
- Molecular Neuroscience Department, Center for Neural Informatics, Structures, and Plasticity, Krasnow Institute for Advanced Study, George Mason University, Fairfax, VA, USA
The importance of neuronal morphology has been recognized from the early days of neuroscience. Elucidating the functional roles of axonal and dendritic arbors in synaptic integration, signal transmission, network connectivity, and circuit dynamics requires quantitative analyses of digital three-dimensional reconstructions. We extensively searched the scientific literature for all original reports describing reconstructions of neuronal morphology since the advent of this technique three decades ago. From almost 50,000 titles, 30,000 abstracts, and more than 10,000 full-text articles, we identified 902 publications describing ∼44,000 digital reconstructions. Reviewing the growth of this field exposed general research trends on specific animal species, brain regions, neuron types, and experimental approaches. The entire bibliography, annotated with relevant metadata and (wherever available) direct links to the underlying digital data, is accessible at NeuroMorpho.Org.
Introduction
Neuronal morphology is a key determinant of information processing in the nervous system. The morphological diversity of axons and dendrites provides an essential substrate for synaptic integration, signal transmission, network connectivity, and circuit dynamics. The beginning of modern neuroscience is often associated with the first drawings of neurite arbors, and those early illustrations continue to appear in research articles and textbooks. However, computational approaches are necessary to quantify the intricate relationship between neuronal morphology (structure) and physiology (activity; De Schutter and Bower, 1994; Borst and Haag, 1996; Segev and Rall, 1998; Häusser et al., 2000; Schmitt et al., 2004; Ascoli et al., 2007; Halavi et al., 2008). Therefore, three-dimensional digital reconstructions of axonal and dendritic branching are indispensable for exploring neural function (Svoboda, 2011).
Light microscopy allows an optimal balance between resolution and field of view to routinely visualize every individual branch through entire neuronal arbors (Lu, 2011). The pre-processing steps for digital reconstructions are the same as for pencil-on-paper tracings: histological tissue preparation, staining and/or labeling, and imaging (Meijering, 2010). Digital reconstructions are obtained by tracing neuronal trees in 3D with dedicated computer-microscope interfaces or with specialized software from previously acquired image stacks. The most popular and parsimonious digital format represents branching morphology as a sequence of interconnected vectors (usually rendered as cylinders or truncated cones) recording the X, Y, and Z coordinates, diameters, and connectivity links. Digital reconstructions capture the essence of neuronal morphology at the scale of light microscopy in conveniently compact files, typically 0.01% the size of the original images. Most importantly, they enable a nearly unlimited variety of morphometric measures, computational models, and statistical analyses to investigate structural changes and their effects during normal brain function, development, and pathologies.
Digital reconstructions can be acquired from any animal species, brain regions, neuron types, and a variety of experimental protocols. Morphological quantification is central in some studies, such as to investigate chemical, genetic, or behavioral effects on branch complexity. In other cases, morphology is traced as an aid, e.g., to document the identity of intracellularly recorded neurons. Once digitally reconstructed, however, morphological data can be re-used in secondary applications beyond the scope of the original project, including computational simulations, comparative analyses, and large-scale data mining across labs or techniques.
Although recent developments promise to facilitate the future automation of digital tracing (Bas and Erdogmus, 2011; Chothani et al., 2011; Narayanaswamy et al., 2011; Türetken et al., 2011; Wang et al., 2011; Zhao et al., 2011), the considerable cost, and laboriousness of current technology prompted the development of NeuroMorpho.Org, an open archive for sharing neuronal reconstructions online after publication (Halavi et al., 2008). In only few years, 66 labs worldwide contributed more than 7,000 neurons from 15 different species and 50 brain regions. The site was accessed in more than 50,000 sessions from nearly 100 countries, totaling more than 2 million downloads. More importantly, reconstructions from NeuroMorpho.Org have been used in more than 200 peer-reviewed articles.
NeuroMorpho.Org aims to provide dense coverage of available data. This goal implies deposition of all digital reconstructions that authors are willing to share. Until the neuroscience community matures a broad expectation that neuronal morphologies be spontaneously submitted upon publication (as is standard for gene sequences, protein structures, etc.), achieving dense coverage requires proactive identification of all past and future papers describing digital reconstructions. Notwithstanding the impending data “explosion” expected with high-throughput automation (Donohue and Ascoli, 2011; Kozloski, 2011; Liu, 2011), to this day most neurons are semi-manually reconstructed one by one (Gillette et al., 2011; Luisi et al., 2011; Peng et al., 2011). As a result, the neuronal reconstruction literature is still sufficiently contained to allow exhaustive mining and extensive metadata annotation.
Inspection of almost 50,000 titles, 30,000 abstracts, and more than 10,000 full-text articles (nearly 2000 h of literature search and information extraction) identified 902 articles describing ∼44,000 neuronal reconstructions. This count (and subsequent analysis) only includes the original papers reporting the first or most complete characterization of the reconstruction rather than use or application of data described in other reports. Independent sampling indicates that this collection represents a robust (two-thirds) majority of all actually published relevant material. This corpus provides a representative coverage of cellular neuroanatomy and a comprehensive assessment of the growth of the field. We thus analyzed chronological patterns and number of reconstructions by field of study, animal species, brain region, cell type, journal, and experimental method, revealing interesting research trends. Moreover, we stored the extracted metadata into a newly created literature database directly accessible from NeuroMorpho.Org, enabling further online analyses and data mining.
Results
The information collated through extensive literature mining (see Materials and Methods) indicated that the literature of digital reconstructions of neuronal morphology started in the early 1980s, though its roots can be tracked more than a decade earlier. Research in this field remained sparse until the mid-1990s, when an explosive growth began that is continuing to these days. Accordingly, we organized the analysis by lumping together all publications through 1990 (the “early days”), while supplying finer chronological detail for the last two decades. For complete perspective, we first briefly overview the earlier history.
The Emergence of Digital Reconstruction Techniques
Drawings of complex neuronal arbors started to appear in scientific reports since the 1873 publication of Golgi’s staining (Senft, 2011). Initial applications of computers to neuronal morphometry were described in the late 1960s (Glaser and Van der loos, 1965; Blinkov and Ivanitskii, 1968; Macků and Hradil, 1968). Computer-aided neuromorphological reconstructions were preliminarily attempted through the following decade (Garvey et al., 1973; Levinthal et al., 1974; Capowski, 1976, 1977; Valverde, 1976; Mazziotta and Hamilton, 1977; Macagno et al., 1979; Sobel et al., 1980). Interfacing computers with microscopes and motorized stages in the early 1980s led to the first successful digital reconstructions (Capowski and Sedivec, 1981; DeVoogd et al., 1981; Yelnik et al., 1981; Capowski and Réthelyi, 1982; Gilbert and Wiesel, 1983; Johnson and Capowski, 1983; Simons and Woolsey, 1984; Zsuppán, 1984). Although these early systems received limited attention, they introduced semi-automated recognition of bifurcations and terminations via user–machine interaction (Capowski, 1983). The first broadly adopted commercial set-up for digital reconstructions was neuron tracing system (NTS: Eutectic Electronics, Raleigh, NC, USA). Dominance of NTS in the late 1980s was gradually replaced by Neurolucida (MBF Bioscience Williston, VT, USA) in the mid 1990s. The ubiquitous spread of personal computers catalyzed the rapid adoption of digital reconstruction as the preferred approach to investigating axonal and dendritic structure. Before the turn of the millenium, open source release of reconstruction-specific neuroinformatics resources (Cannon et al., 1998) initiated the growth of a now mature, diverse, and vibrant ecosystem of users and applications.
Growth and Trends
The temporal analysis of the 902 identified publications describing digital reconstructions demonstrates a continuous growth starting from the mid 1990s (Figure 1A). The semi-log linear cumulative increase parallels the general exponential trend of the scientific literature (Larsen and von Ins, 2010). In the breakdown by animal species, rodents made up more than two-thirds of experimental subjects, with all invertebrates only accounting for just 4% of the reports. Among rats, which accounted for more publications than all other species together, the most common strains were Sprague-Dawley and Wistar, while Long-Evans and others were reported in less than one eighth of the reports (Figure 1B).
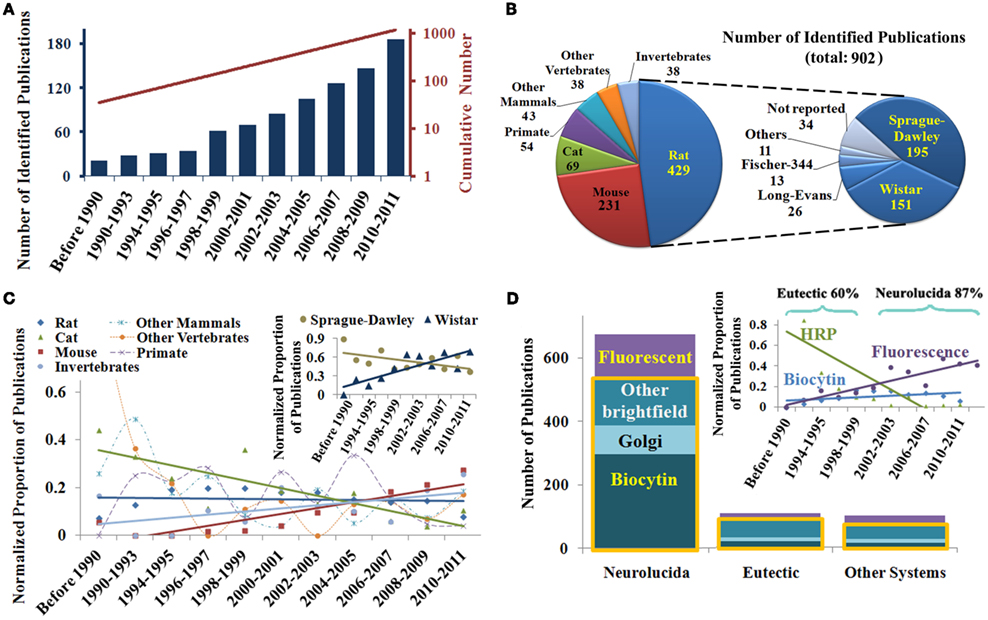
Figure 1. (A) Chronological overview of publications reporting digital neuronal reconstructions and their cumulative number, showing an exponential rise for the past 15 years. (B) Breakdown of the identified publications by animal species, with a further subdivision for rat strains. (C) Normalized temporal analysis of the animal model of choice, demonstrating a decline in the use of cats, an increase of mice and invertebrates, and a remarkably stable preference for rats over three decades. Changes in other species do not display regular trends. Inset: shift in the balance of preferred rat strain. (D) Relative prevalence of common reconstruction system and staining methods, showing the predominance of bright field microscopy (yellow box) across the board (“Other Systems” include Amira, Digitizing Tablet, Filament Tracer, TRAKA, and custom-built programs). Inset: temporal trend of various staining methods, revealing the recent rise in fluorescent staining and decline in the use of horseradish peroxidase (HRP). A transition during the mid-1990s is noted in the most popular reconstruction systems from Eutectic to Neurolucida.
To examine the chronological trend in the usage of animal models, the numbers of publications for every species, and time period were normalized to factor out both the general temporal growth and the overall species distribution (see Materials and Methods). The resulting relative proportions (Figure 1C) reveal that the use of rats as experimental subjects has remained steady over the years, though a reversal in the use of the two most common strains was observed at the turn of the millenium (inset). The popularity of cats declined, while mice and invertebrates suitable for genetic manipulation (especially Drosophila) are increasingly more represented (Figure 1C).
Breakdown by reconstruction software, microscopy techniques, and staining methods also uncovered clear trends (Figure 1D). Across all systems, the majority of published reports are based on bright field microscopy (yellow box), with a majority using biocytin labeling over Golgi and other approaches. Chronological analysis of the staining methods shows a steep decline in the use of horseradish peroxidase (HRP) through the 1990s and an increasingly frequent choice of fluorescent markers. In contrast, biocytin has remained steadily popular over the years (Figure 1D, inset). Investigation of the preferred reconstruction systems reveals that 60% of publications utilized Eutectic in the 1990s, which was replaced by Neurolucida that dominated the last decade (Figure 1D, inset). We also observed a very recent uptick in the use of Amira (data not shown), though it is too early to know if it represents more than an isolated oscillation. A future shift is expected as newer technologies such as confocal and two-photon microscopy mature into routine high-throughput processes.
Next we examined the most frequently investigated brain regions and neuron types (Figure 2). The neocortex and hippocampus form a majority of the reports (Figure 2A). Neocortical sub-regions are broadly represented with the non-barrel somatosensory area constituting more than a quarter of the cases. Interestingly, digital reconstructions from the amygdala have only started to be published in the past decade (data not shown). Overall, pyramidal neurons are the most common reconstructions, making up more than half of the reported cell types in neocortex and hippocampus combined. As expected, principal cells were the most studied neuron types in each brain region (Figure 2B).
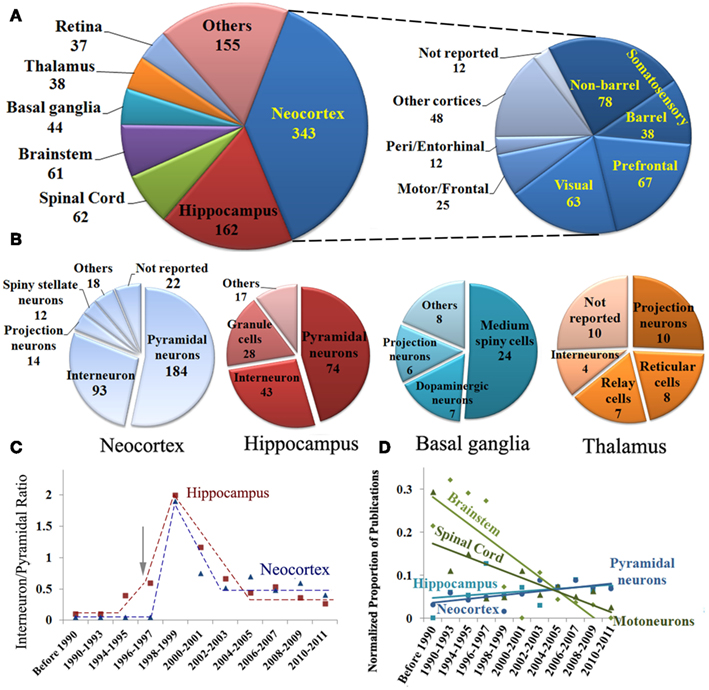
Figure 2. (A) Identified publications sorted by brain region with further subdivision of neocortical areas. (B) Breakdown of reports of digital reconstructions by neuron types in the two most popular and two other representative brain regions. (C) Temporal trend of the ratio of interneurons to pyramidal cells reconstructed in the hippocampus and neocortex, highlighting the surge of interest in interneurons in the late 1990s (arrow); (D) Chronological analysis of identified publications by brain region and cell type demonstrating selected upward and downward shifts.
While interneurons are believed to account for ∼15% of neurons in the mammalian neocortex and hippocampus (Gonchar and Burkhalter, 1997), they are represented in more than a quarter of the reconstruction literature. The early preference for pyramidal cells (Figure 2C) changed dramatically following the publication of a seminal review (Freund and Buzsáki, 1996), which to date remains one of the most highly cited reference in the field (Figure 2C, arrow). At the turn of the millenium, three times as many papers were published on the reconstruction of hippocampal interneurons than on pyramidal cells. That ratio appears to have stabilized to 1:2 in both hippocampus and neocortex. Temporal analysis also demonstrates a general increase in pyramidal cell reconstructions from these two regions, and a steep decline in reports of motoneurons from both brainstem and spinal cord (Figure 2D).
Data Acquisition and Availability
For each of the identified publications, we annotated the number of reconstructed neurons and the general neuroscience subfield of study (see Materials and Methods). These data, alone and combined with the information on species, brain regions, and neuron types, also revealed interesting research trends (Figure 3). The numbers of reported reconstructions span a broad range (Figure 3A), with most reports including between 3 and 100 neurons (49 ± 30 SEM). The average number of reconstructions per publication is significantly increasing and has nearly doubled over the last two decades (Figure 3B).
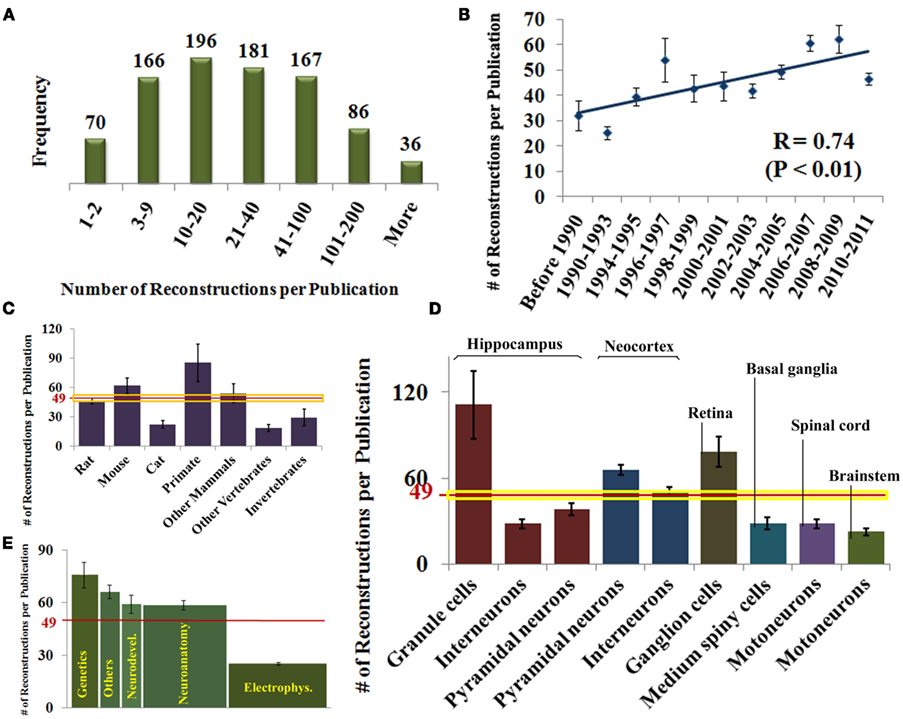
Figure 3. (A) Histogram distribution of the number of reported reconstructions per publication. (B) Rising temporal trend of the number of reconstructions per publication (mean ± SEM). (C) Number of reconstructions per publication by species. The horizontal red and yellow lines represent mean and SE [same in (D)]. (D) Number of reconstructions per publication for selected neuron type organized by brain region. (E) Number of reconstructions per publication by field of study. The area under each column is proportional to the total number of reconstructions in each category.
Since the number of neurons reported in a study may be affected by the ease of the experimental process, the reconstruction system might constitute an important ergonomic factor depending on the user friendliness of different software programs. Nevertheless, we found no statistically significant differences in the number of reconstructions per publication among reconstruction systems (data not shown). In contrast, publications using mice or primates as experimental subjects contain more reconstructions on average than those using other species (Figure 3C). For mice, this difference can be attributed to recent technological advances in experimental design (in particular, genetic fluorescent tagging). In case of primates, their relative high cost mandates optimal recovery of every possible neuron. The lower numbers of reconstructions per publication in cats, whose popularity dates back farther, and in invertebrates and other non-mammals, which are less costly animal models, mirror the proposed explanation for mice and primates, respectively. Among neuron types, simpler hippocampal granule cells are reconstructed in higher numbers compared to interneurons or pyramidal cells (Figure 3D). The highly elaborate retinal ganglion cells are reconstructed in larger numbers than other neurons of similar morphological complexity, perhaps thanks to the experimental technique of retinal whole mounts, allowing full visualization of their quasi-planar arbors.
We also categorized each identified publication by its field of study, based on the scientific question (e.g., developmental changes) or the technical approach (e.g., electrophysiological recording). When categories were mixed, as in numerous recent studies on genetic mechanisms involving developmental questions or electrophysiological techniques, we selected the most prominent. For example, all articles clearly had a neuroanatomical component, but we only considered the field of study as neuroanatomy if that was the primary focus. Others categories included neuropathology, behavior, and pharmacology. A full third of studies were electrophysiological (Figure 3E), yet they typically contained the smallest number of reconstructions per article (26 ± 2 SEM). In contrast, genetics only accounted for 12% of the papers, but each typically contained more reconstructions (77 ± 14 SEM). Neuroanatomy made up another third of the publications, and constituted a larger majority in older work (data not shown). Typical number of reconstructions in neuroanatomical papers was above the average and similar to neurodevelopmental and other categories. As a result, the majority of reconstructions (areas under the bars in Figure 3E) was described in neuroanatomy (∼18,500), followed by electrophysiology (∼8,500), genetics (∼8,500), and neurodevelopment (∼3,500), with other categories together form the remaining ∼5,000.
To determine reconstruction availability for public data sharing, we sent an initial invitation and three follow-up requests to the first, last, and (if different) corresponding authors of all identified publications (Figure 4A) not yet included in NeuroMorpho.Org. Reconstructions were categorized as available if they were already present in the database (N = 5,292) or if authors indicated willingness to share their reconstructions and followed-up with data submission within their agreed time line. These contributions (N = 3,321) were then added to the processing pipeline for inclusion in NeuroMorpho.Org (7,232 are uploaded as of version 5.3). Reconstructions were categorized as not available if authors declined the request to share, had lost the data, failed to reply to all communication, or provided no viable contact information (Figure 4B). Many authors indicated an initial interest in sharing data (“maybe-response”), and/or asked to be contacted again later. Upon subsequent communication, a minority of these cases (10%) ended up being available, but most (90%) fell in the not available category. For the purpose of this analysis, those that are still in the communication process were divided in “expected” and “not expected” in the same proportions (1:9).
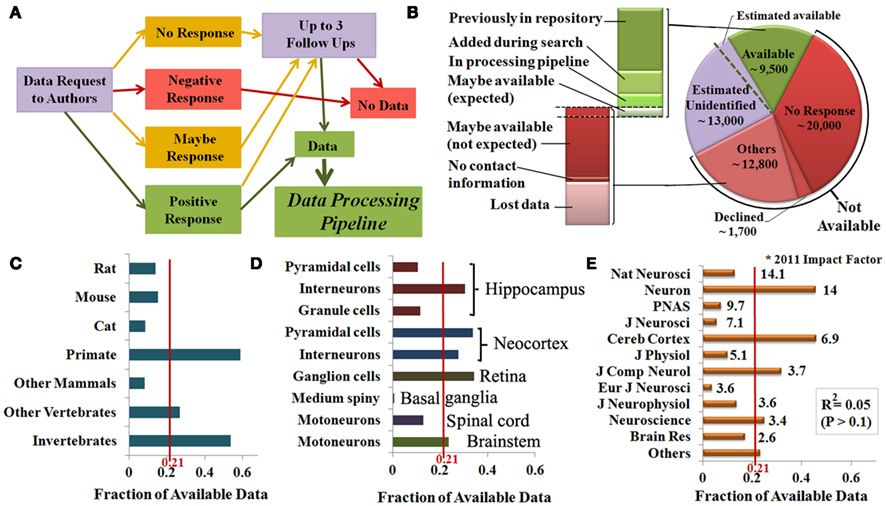
Figure 4. (A) Flowchart of the systematic author communication process and its possible outcomes. (B) Data availability and subdivisions of the available data (green) based on the processing stage, and of the not available data (red) based on the underlying reason. Independent sampling indicates that a minority of the data likely remain unidentified (lavender), a small proportion of which could be shared if identified (″Estimated available″). (C–E) The ratio between available data and the total number of identified reconstructions indicates the fraction of available data by species (C), brain region and cell type (D), and publication venue (E).
Independent sampling (see Materials and Methods) indicates that the identified publications cover 70% the actual entire literature describing digital reconstructions. This suggests the possible existence of another 13,000 reconstructions missed by this mining effort. Maintaining the same outcome proportion as for the identified data, we estimate that 1,300 of these additional reconstructions would actually be shared if identified (“Estimated available” in Figure 4B). Hence, though only 21% of the 44,000 identified reconstructions are shared, the reconstructions in NeuroMorpho.Org constitute an overwhelming majority, i.e., very dense coverage, of all available data.
Data availability varied substantially by species. Reconstructions from primates and invertebrates were on average five times more available than those from cats and other mammals (typically older data), while the availability from rats, mice, and other vertebrates was close to the mean (Figure 4C). Individual neuron types also differed in availability; half of the identified neocortex pyramidal neurons are available, while nearly all basal ganglia medium spiny neurons are unavailable. Moreover, hippocampus interneurons are available three times more than granule and pyramidal cells (Figure 4D). Lastly, we tested the relationship between availability and the publication impact factors. Interestingly, no significantly positive or negative relationship was found (Figure 4E), even though the fraction of available data varied widely from more than 0.6 (Cereb. Cortex) to less than 0.1 (Eur. J. Neurosci.).
We posted the annotated bibliography at NeuroMorpho.Org enabling further open analysis through a user-friendly graphic interface. Literature information can be browsed by year of publication, species, brain region, and cell type. Moreover, users who identify a report describing digital reconstructions can search the database by PubMed identifier (PMID) to determine data availability. If the reconstructions are available, they can be retrieved directly with a one-click link. This resource is updated at every new release of NeuroMorpho.Org with continuous literature searches (see Materials and Methods).
Methods
Two important considerations are relevant to the literature mining approach underlying this study. First, the presented methodology is fully applicable to other subfields and techniques. Second, this process enacts comprehensive coverage of the published data in a given domain. This is a necessary and often overlooked step for densely populating the relevant databases. Dense coverage is of immense value for scientific resources as it elevates them to a one-stop portal for the user community. To ensure continuous maintenance of comprehensive coverage, the described retrospective strategy must be followed by an analogous, regularly ongoing prospective search to cover new data as they are published.
Retrospective Literature Search (Through the End of 2010)
Our literature mining protocol consisted of five sequential steps: (1) pilot testing and progressive refinement of query terms; (2) bulk bibliographic search; (3) information identification; (4) metadata extraction; and (5) data request and follow-up author communication.
The first step aimed to select the search engines and query terms for minimizing missed relevant publications (false negatives) without excessively inflating the return of irrelevant publications (false positives). This process was continuous and dynamic; the results presented here were acquired over a period of 3 years, during which new bibliographic resources were introduced and existing ones evolved in their functionality or expanded their coverage, requiring adjustment of optimal query terms and search protocol.
A broad spectrum of search terms was initially tested in PubMed1. Several queries were too broad and returned an excessive number of hits. For example, the following were excluded based on the English publications retrieved from 1980 to 2010 (search performed on 3/25/11): “Neuron” (404,859), “Neuron morphology” (237,988), “Neuron structure” (22,021), “Tracing” (15,957), and “Three-dimensional reconstruction” (10,113). After extensive trial and error, eight query strings were selected based on their optimal range of return: “Digital reconstruction” (2,147), “Neuron reconstruction” (1,899), “Neuronal morphology tracing” (1,134), “3D neuron” (866), “Eutectic” (832), “Neuronal reconstruction” (644), “Amira neuron” (198), and “Neurolucida” (40).
Although PubMed is the largest dedicated database of biomedical literature with more than 20 million records (in early 2011), it only searches abstracts and keywords. The above eight selected keywords were thus searched in three additional resources: PubMed Central (PMC), which contains more than two million full-text records2, Textpresso3 (Müller et al., 2004) for Neuroscience V.2, with more than 67,000 domain-specific full-text articles, and Google Scholar4.
The bulk results of these searches were progressively narrowed down to identify the actual publications describing neuronal reconstructions (Table 1). From the records returned by each engine (Total Hits), redundant entries identified by more than one keyword were removed first. Of the resulting Unique Hits, all titles, most abstracts, and relevant full-texts were sequentially evaluated to determine presence of reconstructions. The articles identified as containing reconstructions constituted a minority (Positive Fraction) of the full-texts evaluated. Several positive articles were found by multiple engines: 16% overlapped between PubMed and PMC, close to 96% between PubMed/PMC and Google Scholar, and only 1–3.5% between Textpresso and the above resources. All engines contributed substantially but to different degrees to the final collection of identified articles (Fraction of Identified Positive). Lastly, we integrated the resulting list by mining an online bibliography of 577 publications reporting use of Neurolucida5.
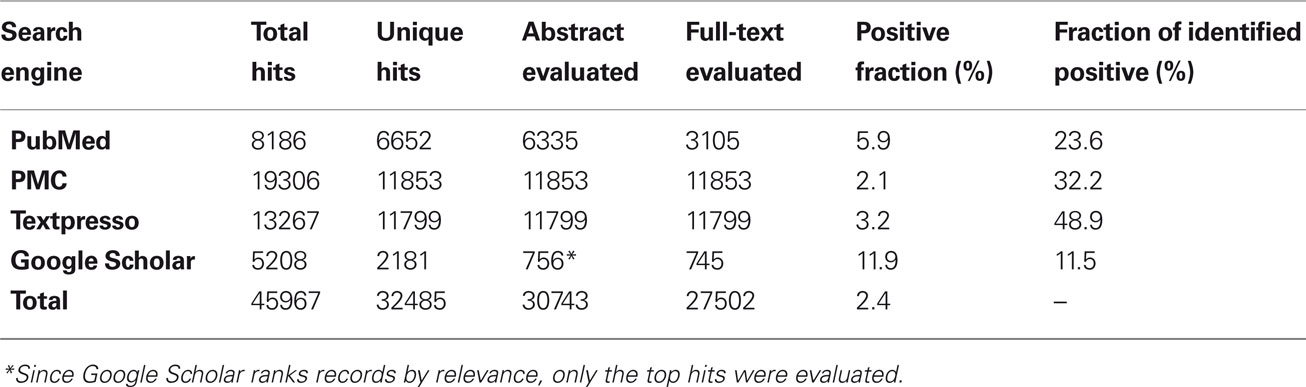
Table 1. Search engine comparison based on eight selected keywords.
To test the efficiency of this protocol and to estimate the proportion of possibly missed relevant literature, we compared these results with two independent samples. The first consisted of publications positive for reconstructions collected in our lab over the years. The second was populated by manually identifying positive publications from a random 4% subset of the results of a full-text HighWire search6 using the same keywords. The above-described search protocol identified 67 and 70% of the first and second independent samples, respectively, suggesting that it covered more than two-thirds of the relevant literature. Hence, we estimate that the number of publications describing or utilizing 3D digital reconstructions of neuronal morphologies to date exceeds 1,000 articles.
Ongoing Prospective Literature Search (2011 and Beyond)
The database of positively identified publications is continuously updated with monthly literature searches. The methodology for this ongoing process is similar to that described above, but the exact protocol is constantly adapted to evolving scientific knowledge and new resources. In particular, we currently employ two search engines allowing full-text searches: Scirus.com and HighWire. Scirus mines numerous sources, including BioMed Central, SpringerLink, Hindawi, IOP, PubMed, Nature Publishing Group, Pubmed Central, Royal Society, SAGE, ScienceDirect, and Wiley-Blackwell. Such extended coverage provides access to over 200 neuroscience journals, representing more than half of all relevant titles. HighWire contributes eight additional journals, including Science, PNAS, J. Neuroscience, J. Neurophysiology, Learning and Memory, and Biological Bulletin. Altogether, these portals encompass 73% of all titles found positive in the retrospective search. Most importantly, they extend the power of full-text search beyond the restricted reach of PubMed Central and Textpresso.
The following keywords were chosen for the 2011 literature: “Neurolucida,” “neuron reconstruction,” “neuronal reconstruction,” “3D neuron,” “digitally reconstructed neuron,” “neuron morphology,” “dendrite structure,” “axon structure,” “axon arborization,” “axonal arborization,” “Imaris,” and “Amira.” After checking the PMIDs from all keywords for redundancies, full-texts are evaluated for presence of digital reconstructions. Positive PMIDs are then annotated with information on species, strain, brain region(s), cell type(s), staining method, reconstruction software, and number of reconstructions. Data are requested from the authors and the availability is noted. The resulting “Literature Coverage” database is updated monthly.
Metadata Weighting and Normalization of Publication Proportions
When annotating positive publications with relevant species, brain region, and other metadata, if multiple categories apply (e.g., a report describing reconstructions from two species), they are weighted based on the number of reconstructions in each.
In temporal trend analyses (e.g., Figure 1C), the numbers of publication were scaled relative to both the given period of time, accounting for the overall variation over the years (Figure 1A), and the factor under investigation (in this example, species), accounting for the variation in publication number among categories (Figure 1B). This normalization ensures unitary sum within each temporal period over all categories and within each category across time, resulting in a proportional representation of the relative importance of each factor at a given time.
Discussion
Reconstructing complex neuronal branching in digital 3D format may help map brain circuitry with its billions of connections. This technique enables Morphometric and stereological analyses, statistical correlations of morphology with electrical activity, computational models at cellular and network levels, neuronal classifications, and quantification of changes in development, pathology, and pharmacological or genetic manipulations. Neuronal reconstructions are routinely performed in the course of a variety of studies, sometime as a central component of the experimental design, others as a side product, across all subfields of neuroscience. Thus, the observed research trends apply beyond digital morphology and represent neuroscience as a whole. Different applications of digital reconstructions (e.g., electrophysiological simulations or investigation of branch pruning) require variable precision in distinct morphological aspects, such as branch diameter and identification of natural endings (Scorcioni et al., 2004; Meijering, 2010). Users must recognize the non-uniform limits of various datasets.
Highly anticipated advancements in high-throughput data acquisition such as robotic specimen preparation, fast microscopic imaging, and automated digital reconstruction, would enable large-scale morphological studies. Reverse engineering the brain requires representative sampling of cell type diversity. The DIADEM Challenge demonstrated that, despite recent progress, full automation of 3D tracing is still a major bottleneck (Gillette et al., 2011). However, considerable success is already achieved in specific cases. A recent brain-wide Drosophila study (Chiang et al., 2011) reported the automated reconstruction of more than 16,000 genetically labeled local and projection neurons within a common 3D tissue model. The digital data were posted online a year after publication7. Given its qualitatively different nature, we did not include this dataset in the current analysis. This breakthrough, however, demonstrates the relevance of digital reconstruction to whole-circuit mapping.
Sharing reconstructions through designated databases, such as NeuroMorpho.Org, allows integration of results from different experiments and ensures preservation, circulation, re-analyses, and modeling of available data. Not all reconstructions are available to be shared. Our results show that the majority of these data is already unobtainable. To ensure maximum data recovery, active requests, and collection are necessary. This requires systematic data identification, making literature mining a growing need in neuroscience. Our study demonstrates that full-text searches provide an invaluable tool. Newly developed publisher portals (e.g., Scirus.com) greatly expand the benefit of open-access (PubMed Central) in this regard. Resources like Textpresso that highlight the searched keyword and surrounding sentence further increase efficiency. Google Scholar often returned repeated links to the same publications via different sources (e.g., PubMed abstracts). Google Scholar’s unfortunate lack of an identification system akin to PubMed PMID forced laborious tracking of evaluated articles, but was mitigated by its useful page ranking. Once high-throughput data becomes routine in neuroscience, efficient identification of knowledge will require new developments in automated semantic analysis.
Conflict of Interest Statement
The authors declare that the research was conducted in the absence of any commercial or financial relationships that could be construed as a potential conflict of interest.
Acknowledgments
The authors are grateful to Sriraman Damodaran, Anirudh Raghavan, Maryum Ilyas, Kaitlin Grainger, and Juhi Saxena for assisting with the retrospective and ongoing literature search; and to Dr. Diek Wheeler for help with critical evaluation of available full-text search engines. Supported in part by NIH R01 NS39600 and ONR MURI N00014-10-1-0198.
Footnotes
Key Concepts
Representation of neuron morphology generated using tracing software that captures the 3D neuronal structure as a list of connected vectors.
An ordered series of 2D images captured at regular z-intervals. Image stacks from optical microscopy are used to trace neurons in three dimensions.
Free online repository of digital reconstructions of neuron morphologies with extensive literature database of publications describing digital reconstruction data.
Descriptive information about the data content of a resource. Relevant metadata for neuron morphology include the experimental subject and protocol, location and classification of the neuron, and reconstruction methods associated with the digital reconstruction.
Extensive search of available literature to identify and collect information related to a specific topic from large corpora.
Exchange of scientific data to reach a mutual goal of research integration enabling secondary discovery.
The study of neuronal structure commonly used for identification and classification. In particular, axonal and dendritic arbors are key functional components of neural processing and fundamental determinants of neural circuits.
Morphometric and stereological analyses
Statistical studies of neuronal geometry that are most effectively performed on digitally reconstructed data.
References
Ascoli, G. A., Donohue, D. E., and Halavi, M. (2007). NeuroMorpho.Org – a central resource for neuronal morphologies. J. Neurosci. 27, 9247–9251.
Bas, E., and Erdogmus, D. (2011). Principal curves as skeletons of tubular objects: locally characterizing the structures of axons. Neuroinformatics 9, 181–191.
Blinkov, S. M., and Ivanitskii, G. R. (1968). Automatic analysis of brain cells. Vestn. Akad. Med. Nauk SSSR 23, 84–85.
Borst, A., and Haag, J. (1996). The intrinsic electrophysiological characteristics of fly lobula plate tangential cells: I. Passive membrane properties. J. Comput. Neurosci. 3, 313–336.
Cannon, R. C., Turner, D. A., Pyapali, G. K., and Wheal, H. V. (1998). An on-line archive of reconstructed hippocampal neurons. J. Neurosci. Methods 84, 49–54.
Capowski, J. J. (1976). Characteristics of neuroscience computer graphics displays and a proposed system to generate those displays. Comput. Graph. 10, 257–261.
Capowski, J. J. (1977). Computer-aided reconstruction of neuron trees from several serial sections. Comput. Biomed. Res. 10, 617–629.
Capowski, J. J., and Réthelyi, M. (1982). Neuron reconstruction using a Quantimet image analyzing computer system. Acta Morphol. Acad. Sci. Hung. 30, 241–249.
Capowski, J. J., and Sedivec, M. J. (1981). Accurate computer reconstruction and graphics display of complex neurons utilizing state-of-the-art interactive techniques. Comput. Biomed. Res. 14, 518–532.
Chiang, A. S., Lin, C. Y., Chuang, C. C., Chang, H. M., Hsieh, C. H., Yeh, C. W., Shih, C. T., Wu, J. J., Wang, G. T., Chen, Y. C., Wu, C. C., Chen, G. Y., Ching, Y. T., Lee, P. C., Lin, C. Y., Lin, H. H., Wu, C. C., Hsu, H. W., Huang, Y. A., Chen, J. Y., Chiang, H. J., Lu, C. F., Ni, R. F., Yeh, C. Y., and Hwang, J. K. (2011). Three-dimensional reconstruction of brain-wide wiring networks in Drosophila at single-cell resolution. Curr. Biol. 21, 1–11.0
Chothani, P., Mehta, V., and Stepanyants, A. (2011). Automated tracing of neurites from light microscopy stacks of images. Neuroinformatics 9, 263–278.
De Schutter, E., and Bower, J. M. (1994). An active membrane model of the cerebellar Purkinje cell: I. Simulation of current clamps in slice. J. Neurophysiol. 71, 375–400.
DeVoogd, T. J., Chang, F. L., Floeter, M. K., Jencius, M. J., and Greenough, W. T. (1981). Distortions induced in neuronal quantification by camera lucida analysis: comparisons using a semi-automated data acquisition system. J. Neurosci. Methods 3, 285–294.
Donohue, D. E., and Ascoli, G. A. (2011). Automated reconstruction of neuronal morphology: an overview. Brain Res. Rev. 67, 94–102.
Garvey, C. F., Young, J. H. Jr., Coleman, P. D., and Simon, W. (1973). Automated three-dimensional dendrite tracking system. Electroencephalogr. Clin. Neurophysiol. 35, 199–204.
Gilbert, C. D., and Wiesel, T. N. (1983). Clustered intrinsic connections in cat visual cortex. J. Neurosci. 3, 1116–1133.
Gillette, T. A., Brown, K. M., and Ascoli, G. A. (2011). The DIADEM metric: comparing multiple reconstructions of the same neuron. Neuroinformatics 9, 233–245.
Glaser, E. M., and Van der loos, H. (1965). A semi-automatic computer-microscope for the analysis of neuronal morphology. IEEE Trans. Biomed. Eng. 12, 22–31.
Gonchar, Y., and Burkhalter, A. (1997). Three distinct families of GABAergic neurons in rat visual cortex. Cereb. Cortex 7, 347–358.
Halavi, M., Polavaram, S., Donohue, D. E., Hamilton, G., Hoyt, J., Smith, K. P., and Ascoli, G. A. (2008). NeuroMorpho.Org implementation of digital neuroscience: dense coverage and integration with the NIF. Neuroinformatics 6, 241–252.
Häusser, M., Spruston, N., and Stuart, G. J. (2000). Diversity and dynamics of dendritic signaling. Science 290, 739–744.
Johnson, E. M., and Capowski, J. J. (1983). A system for the three-dimensional reconstruction of biological structures. Comput. Biomed. Res. 16, 79–87.
Kozloski, J. (2011). Automated reconstruction of neural tissue and the role of large-scale simulation. Neuroinformatics 9, 133–142.
Larsen, P. O., and von Ins, M. (2010). The rate of growth in scientific publication and the decline in coverage provided by Science Citation Index. Scientometrics 84, 575–603.
Levinthal, C., Macagno, E., and Tountas, C. (1974). Computer-aided reconstruction from serial sections. Fed. Proc. 33, 2336–2340.
Luisi, J., Narayanaswamy, A., Galbreath, Z., and Roysam, B. (2011). The FARSIGHT trace editor: an open source tool for 3-D inspection and efficient pattern analysis aided editing of automated neuronal reconstructions. Neuroinformatics 9, 305–315.
Macagno, E. R., Levinthal, C., and Sobel, I. (1979). Three-dimensional computer reconstruction of neurons and neuronal assemblies. Annu. Rev. Biophys. Bioeng. 8, 323–351.
Macků, J., and Hradil, J. (1968). Model of the neuron and of neuron nets on computers. Sb. Ved. Pr. Lek. Fak. Karlovy Univerzity Hradci Kralove 11, 545–558.
Mazziotta, J. C., and Hamilton, B. L. (1977). Three-dimensional computer reconstruction and display of neuronal structure. Comput. Biol. Med. 7, 265–279.
Müller, H. M., Kenny, E. E., and Sternberg, P. W. (2004). Textpresso: an ontology-based information retrieval and extraction system for biological literature. PLoS Biol. 2, e309. doi: 10.1371/journal.pbio.0020309
Narayanaswamy, A., Wang, Y., and Roysam, B. (2011). 3-D image pre-processing algorithms for improved automated tracing of neuronal arbors. Neuroinformatics 9, 219–231.
Peng, H., Long, F., and Myers, G. (2011). Automatic 3D neuron tracing using all-path pruning. Bioinformatics 27, i239–i247.
Schmitt, S., Evers, J. F., Duch, C., Scholz, M., and Obermayer, K. (2004). New methods for the computer-assisted 3-D reconstruction of neurons from confocal image stacks. Neuroimage 23, 1283–1298.
Scorcioni, R., Lazarewicz, M. T., and Ascoli, G. A. (2004). Quantitative morphometry of hippocampal pyramidal cells: differences between anatomical classes and reconstructing laboratories. J. Comp. Neurol. 473, 177–193.
Segev, I., and Rall, W. (1998). Excitable dendrites and spines: earlier theoretical insights elucidate recent direct observations. Trends Neurosci. 21, 453–460.
Simons, D. J., and Woolsey, T. A. (1984). Morphology of Golgi-Cox-impregnated barrel neurons in rat SmI cortex. J. Comp. Neurol. 230, 119–132.
Sobel, I., Levinthal, C., and Macagno, E. R. (1980). Special techniques for the automatic computer reconstruction of neuronal structures. Annu. Rev. Biophys. Bioeng. 9, 347–362.
Svoboda, K. (2011). The past, present, and future of single neuron reconstruction. Neuroinformatics 9, 97–98.
Türetken, E., González, G., Blum, C., and Fua, P. (2011). Automated reconstruction of dendritic and axonal trees by global optimization with geometric priors. Neuroinformatics 9, 279–302.
Valverde, F. (1976). Aspects of cortical organization related to the geometry of neurons with intra-cortical axons. J. Neurocytol. 5, 509–529.
Wang, Y., Narayanaswamy, A., Tsai, C. L., and Roysam, B. (2011). A broadly applicable 3-D neuron tracing method based on open-curve snake. Neuroinformatics 9, 193–217.
Yelnik, J., Percheron, G., Perbos, J., and François, C. (1981). A computer-aided method for the quantitative analysis of dendritic arborizations reconstructed from serial sections. J. Neurosci. Methods 4, 347–364.
Zhao, T., Xie, J., Amat, F., Clack, N., Ahammad, P., Peng, H., Long, F., and Myers, E. (2011). Automated reconstruction of neuronal morphology based on local geometrical and global structural models. Neuroinformatics 9, 247–261.
Keywords: neuron morphology, digital reconstruction, NeuroMorpho.Org, three-dimensional reconstruction, data mining, literature mining, data sharing, potential connectivity
Citation: Halavi M, Hamilton KA, Parekh R and Ascoli GA (2012) Digital reconstructions of neuronal morphology: three decades of research trends. Front. Neurosci. 6:49. doi: 10.3389/fnins.2012.00049
Received: 02 February 2012; Paper pending published: 13 February 2012;
Accepted: 02 March 2012; Published online: 23 April 2012.
Edited by:
Catherine Carr, University of Maryland, USAReviewed by:
Enrico Mugnaini, Northwestern University, USAJohn P. Miller, Montana State University, USA
Copyright: © 2012 Halavi, Hamilton, Parekh and Ascoli. This is an open-access article distributed under the terms of the Creative Commons Attribution Non Commercial License, which permits non-commercial use, distribution, and reproduction in other forums, provided the original authors and source are credited.
*Correspondence: Giorgio A. Ascoli, George Mason University, Krasnow Institute for Advanced Study, Fairfax, USA, ascoli@gmu.edu