Integrative Brain Transcriptome Analysis Reveals Region-Specific and Broad Molecular Changes in Shank3-Overexpressing Mice
 Chunmei Jin1,2†
  Hyojin Kang3†
  Jae Ryun Ryu2,4 Shinhyun Kim1,2
  Yinhua Zhang1,2
  Yeunkum Lee1,2 Yoonhee Kim1,2
  Kihoon Han1,2*
- 1Department of Neuroscience, College of Medicine, Korea University, Seoul, South Korea
- 2Department of Biomedical Sciences, College of Medicine, Korea University, Seoul, South Korea
- 3Supercomputing Center, Korea Institute of Science and Technology Information, Daejeon, South Korea
- 4Department of Anatomy, College of Medicine, Korea University, Seoul, South Korea
Variants of the SH3 and multiple ankyrin repeat domain 3 (SHANK3) gene, encoding excitatory postsynaptic core scaffolding proteins, are causally associated with numerous neurodevelopmental and neuropsychiatric disorders, including autism spectrum disorder (ASD), bipolar disorder, intellectual disability, and schizophrenia (SCZ). Although detailed synaptic changes of various Shank3 mutant mice have been well characterized, broader downstream molecular changes, including direct and indirect changes, remain largely unknown. To address this issue, we performed a transcriptome analysis of the medial prefrontal cortex (mPFC) of adult Shank3-overexpressing transgenic (TG) mice, using an RNA-sequencing approach. We also re-analyzed previously reported RNA-sequencing results of the striatum of adult Shank3 TG mice and of the prefrontal cortex of juvenile Shank3+/ΔC mice with a 50–70% reduction of Shank3 proteins. We found that several myelin-related genes were significantly downregulated specifically in the mPFC, but not in the striatum or hippocampus, of adult Shank3 TG mice by comparing the differentially expressed genes (DEGs) of the analyses side by side. Moreover, we also found nine common DEGs between the mPFC and striatum of Shank3 TG mice, among which we further characterized ASD- and SCZ-associated G protein-coupled receptor 85 (Gpr85), encoding an orphan Gpr interacting with PSD-95. Unlike the mPFC-specific decrease of myelin-related genes, we found that the mRNA levels of Gpr85 increased in multiple brain regions of adult Shank3 TG mice, whereas the mRNA levels of its family members, Gpr27 and Gpr173, decreased in the cortex and striatum. Intriguingly, in cultured neurons, the mRNA levels of Gpr27, Gpr85, and Gpr173 were modulated by the neuronal activity. Furthermore, exogenously expressed GPR85 was co-localized with PSD-95 and Shank3 in cultured neurons and negatively regulated the number of excitatory synapses, suggesting its potential role in homeostatic regulation of excitatory synapses in Shank3 TG neurons. Finally, we performed a gene set enrichment analysis of the RNA-sequencing results, which suggested that Shank3 could affect the directional expression pattern of numerous ribosome-related genes in a dosage-dependent manner. To sum up, these results reveal previously unidentified brain region-specific and broad molecular changes in Shank3-overexpressing mice, further elucidating the complexity of the molecular pathophysiology of SHANK3-associated brain disorders.
Introduction
SH3 and multiple ankyrin repeat domain 3 (SHANK3), also known as proline-rich synapse-associated protein 2 (ProSAP2), is a gene that encodes excitatory synaptic core scaffolding proteins that organize the macromolecular protein complex of the postsynaptic density (PSD) (Naisbitt et al., 1999; Sheng and Kim, 2000). Clinically, deletions of the chromosomal region containing SHANK3 cause Phelan–McDermid syndrome (Wilson et al., 2003; Costales and Kolevzon, 2015; Harony-Nicolas et al., 2015), and a variety of point mutations and small deletions of SHANK3 have been causally associated with numerous neurodevelopmental and neuropsychiatric disorders, including autism spectrum disorder (ASD), intellectual disability, and schizophrenia (SCZ) (Grabrucker et al., 2011; Duffney et al., 2015), which have been modeled by several lines of knock-out and knock-in mouse models (Jiang and Ehlers, 2013; Yoo et al., 2014; Schmeisser, 2015; Monteiro and Feng, 2017). Moreover, duplications of SHANK3 have also been found in patients with Asperger’s syndrome, attention-deficit hyperactivity disorder (ADHD) (Moessner et al., 2007), bipolar disorder (Han et al., 2013), and SCZ (Failla et al., 2007), and the transgenic mice that mildly overexpress Shank3 proteins (∼50%) display manic-like hyperkinetic behaviors and spontaneous seizures (Han et al., 2013; Choi and Han, 2015; Lee et al., 2018). These results indicate that proper expression and function of Shank3 are critical for normal synaptic development and function. Indeed, Shank3-dependent molecular, structural, and functional changes of excitatory synapses have been deeply characterized from in vitro and in vivo studies to elucidate some of the key underlying pathophysiological mechanisms (Han et al., 2013; Wang et al., 2016) and to provide potential therapeutic approaches for SHANK3-associated brain disorders, mainly ASDs (Bozdagi et al., 2013; Shcheglovitov et al., 2013; Duffney et al., 2015; Bidinosti et al., 2016; Vicidomini et al., 2016; Wang et al., 2016).
In contrast, it still remains largely unknown how different variants of a single gene, SHANK3, can lead to diverse phenotypic outcomes or clinical symptoms. Possible explanations could be that SHANK3 expresses numerous Shank3 protein isoforms due to alternative splicing and multiple internal promoters, and that different brain regions express different combinations and levels of these Shank3 isoforms (Wang et al., 2014). Furthermore, we recently demonstrated that Shank3 protein interactomes of different brain regions consist of both brain region-specific (major portion) and common interactors (minor portion), which, together with the isoform diversity, suggest that alterations of Shank3 expression or function could have some distinct effects in different brain regions (Lee et al., 2017b). Supporting this hypothesis, it was reported that the functional changes of different brain regions could vary even in a single Shank3 mutant mouse line (Peca et al., 2011; Lee et al., 2015; Zhou et al., 2016). Nevertheless, these results are so far limited to the characterizations of synaptic changes in Shank3 knock-out mice. Broader downstream molecular changes, including direct and indirect changes, of Shank3 that might be possible even in non-neuronal cell types remain scarcely investigated.
To address this issue, in this study, we performed a transcriptome analysis of the medial prefrontal cortex (mPFC) of Shank3-overexpressing transgenic (TG) mice (Han et al., 2013) and compared the result with previously reported transcriptome analyses of the striatum of Shank3 TG mice (Lee et al., 2017d) and the prefrontal cortex (PFC) of Shank3 heterozygous (Shank3+/ΔC, heterozygous mice for C-terminal exon 21 deletion of Shank3) mice (Duffney et al., 2015; Qin et al., 2018). We focused on the mPFC and striatum for several reasons. The mPFC has well-established roles in top-down regulatory control over various subcortical nuclei involved in regulating emotional, social, and cognitive behaviors (Russo and Nestler, 2013; Riga et al., 2014), which are impaired in brain disorders associated with SHANK3 mutations. The striatum is a key component of the brain motor and reward systems (Balleine et al., 2007; Russo and Nestler, 2013), abnormalities of which may contribute to behavioral symptoms observed in ASD, bipolar disorder, or SCZ. Furthermore, Shank3 is highly expressed in the mPFC and striatum (Monteiro and Feng, 2017), and indeed, molecular, cellular, and electrophysiological defects in the mPFC and striatal neurons are observed in numerous rodent models having Shank3 mutations (Peca et al., 2011; Lee et al., 2015; Harony-Nicolas et al., 2017; Bey et al., 2018).
From integrative analyses and experimental validations, we found that the expression levels of myelin-related genes were downregulated specifically in the mPFC, but not in the striatum or hippocampus, of Shank3 TG mice. Meanwhile, the expression of Gpr85, encoding an orphan G protein-coupled receptor, was increased in multiple brain regions of Shank3 TG mice. We then further characterized the functional effects of this gene on excitatory synapses. Finally, we found that Shank3 affected the directional expression pattern of numerous ribosome-related genes in a dosage-dependent manner. To sum up, these results provide new insights into the complexity and heterogeneity of the molecular pathophysiology of SHANK3-associated brain disorders.
Materials and Methods
Mice
The enhanced green fluorescent protein (EGFP)-Shank3 transgenic (TG) mice used in this study have been described previously (Han et al., 2013; Lee et al., 2017a,b,d). The male wild-type (WT) and TG mice were bred and maintained in a C57BL/6J background according to the Korea University College of Medicine Research Requirements, and all the experimental procedures were approved by the Committees on Animal Research at the Korea University College of Medicine (KOREA-2016-0096). The mice were fed and had access to water ad libitum and were housed under a 12-h light–dark cycle. For all experiments, “control WT mice” means WT littermates of the TG mice used for experiments.
RNA Sequencing and Analysis
The mice (10- to 12-week-old male WT and Shank3 TG) were deeply anesthetized with isoflurane and decapitated. The mPFC was dissected from each brain using a brain matrix (Alto, SA-2175, coronal 1 mm). Specifically, we put brains in contact with the front side (olfactory bulb side) of the matrix and cut off the first 2 mm of brains including the olfactory bulb. Then, we dissected out the next 2 mm of the remaining brain tissue. From the resulting coronal sections, we further dissected the mPFC area as shown in Figure 1A of Lee et al. (2017b). After dissection, the mPFC was immediately placed in a RNAlater solution (Ambion) and stored at 4°C overnight. The mPFC from two mice of same genotype was pooled to make one RNA sample, and a total three pairs of RNA samples (three WT and three Shank3 TG; thus total six mice per each genotype) were processed for RNA sequencing. RNA extraction, library preparation, cluster generation, and sequencing were performed by Macrogen Inc. (Seoul, Korea). RNA samples for sequencing were prepared using a TruSeq Stranded mRNA LT Sample Prep Kit (Illumina) according to the manufacturer’s instructions. An Illumina’s HiSeq 2000 was used for sequencing to generate 101-bp paired-end reads (Supplementary Table S1). Raw data were submitted to the GEO (Gene Expression Omnibus) repository under the accession number GSE113368.
Transcript abundance was estimated with Salmon (v0.9.1) (Patro et al., 2017) in quasi-mapping-based mode onto the Mus musculus genome (GRCm38) with GC bias correction (–gcBias). Quantified gene-level abundance data were imported to R (v.3.6.0) with the tximport (Soneson et al., 2015) package, and differential gene expression analysis was carried out using R/Bioconductor DEseq2 (v1.19.11) (Love et al., 2014). Normalized read counts were computed by dividing the raw read counts by size factors and fitted to a negative binomial distribution. The P-values were first corrected by applying an empirical estimation of the null distribution using the R fdrtool (v.1.2.15) package and then adjusted for multiple testing with the Benjamini–Hochberg correction. Genes with an adjusted P-value of <0.05 were considered as differentially expressed. Volcano plots were generated using the R ggplot2 (v.2.2.1) package.
The gene ontology (GO) and Kyoto Encyclopedia of Genes and Genomes (KEGG) pathway analyses were performed using DAVID software (version 6.8) (Huang da et al., 2009). Mouse gene names were converted to human homologs using the Mouse Genome Informatics (MGI) database1.
To define “myelin-related genes,” a total of 333 human and mouse genes were extracted from five query terms (“central nervous system myelination,” “myelination,” “structural constituent of myelin sheath,” “myelin sheath,” and “myelin sheath adaxonal region”) from AmiGO2.
Gene set enrichment analysis (GSEA)3 (Subramanian et al., 2005) was used to determine whether a priori-defined gene sets would show statistically significant differences in expression between Shank3 TG and WT mice. Enrichment analysis was performed using GSEAPreranked (gsea-3.0.jar) module on gene set collections H (Hallmark gene sets; 50 gene sets) and CP (KEGG; 186 gene sets) downloaded from Molecular Signature Database (MSigDB) v6.14. GSEAPreranked was applied using the list of all genes expressed, ranked by the fold change, and multiplied by the inverse of the P-value with recommended default settings (1,000 permutations and a classic scoring scheme). The false discovery rate (FDR) was estimated to control the false-positive finding of a given normalized enrichment score (NES) by comparing the tails of the observed and null distributions derived from 1,000 gene set permutations. The gene sets with an FDR of <0.05 were considered as significantly enriched.
RNA Purification and qRT-PCR
Real-time quantitative reverse transcription PCR (qRT-PCR) was performed as described previously (Kim et al., 2016; Lee et al., 2017a). In brief, total RNA was extracted from the brain regions of WT and Shank3 TG mice or cultured rat neurons using an miRNeasy Mini Kit (Qiagen) according to the manufacturer’s instructions. Two micrograms of total RNA were used for the cDNA synthesis using iScriptTM cDNA Synthesis Kit (Bio-Rad). Target mRNAs were detected and quantified by a real-time PCR instrument (CFX96 Touch, Bio-Rad) using SYBR Green master mix (Bio-Rad). The results were analyzed using the comparative Ct method normalized against the housekeeping gene Gapdh. The primer sequences for real-time PCR are as follows:
Mouse Plp1 forward 5′ CCCACCCCTATCCGCTAGTT 3′,
reverse 5′ CAGGAAAAAAAGCACCATTGTG 3′
Mouse Myrf forward 5′ TGGCAACTTCACCTACCACA 3′,
reverse 5′ GTGGAACCTCTGCAAAAAGC 3′
Mouse Mobp forward 5′ AACTCCAAGCGTGAGATCGT 3′,
reverse 5′ CTCGGTCACTTCTTCCTTGG 3′
Mouse Mbp forward 5′ ACACACGAGAACTACCCATT ATGG 3′,
reverse 5′ AGAAATGGACTACTGGGTTTTCATCT 3′
Mouse Tspan2 forward 5′ TGCGGTGCATCAAGTATCTG 3′,
reverse 5′ ATAACGGCTGATCCGGCTA 3′
Mouse Cldn11 forward 5′ GTGGTGGGTTTCGTCAC GAG 3′,
reverse 5′ CGTCCATTTTTCGGCAGGTG 3′
Mouse Mog forward 5′ CTGTTTGTTATTGTGCCTGTT CTTG 3′,
reverse 5′ AGTCTTCGGTGCAGCCAGTT 3′
Mouse Mag forward 5′ GGTGTTGAGGGAGGCAGTTG 3′,
reverse 5′ CGTTCTCTGCTAGGCAAGCA 3′
Mouse Shank3 forward 5′ TGGTTGGCAAGAGATCCAT 3′,
reverse 5′ TTGGCCCCATAGAACAAAAG 3′
Mouse Gpr27 forward 5′ GAAGAGGCTGTGCAAGA TGTT 3′,
reverse 5′ AGCTCCCGGTTGAAGAGGA 3′
Mouse Gpr85 forward 5′ ATGCAGCCGACAACATTT TGC 3′,
reverse 5′ CAGGTGGAGCCATTTTTGACA 3′
Mouse Gpr173 forward 5′ CTGCACAAGGCTCCTTA CTAC 3′,
reverse 5′ CAGCCATAAAGGCCACAATCTTA 3′
Mouse Gapdh forward 5′ GGCATTGCTCTCAATGACAA 3′,
reverse 5′ CCCTGTTGCTGTAGCCGTAT 3′
Rat Gpr27 forward 5′ GAAGAGGCTGTGCAAGATGTT 3′,
reverse 5′ AGCTCCCGGTTGAAGAGGA 3′
Rat Gpr85 forward 5′ TCAGCGTCACCAGATACTTAGC 3′,
reverse 5′ CCAAACACGTCCAAAAGGTCA 3′
Rat Gpr173 forward 5′ CTGCACAAGGCTCCTTACTAC 3′,
reverse 5′ CAGCCATAAAGGCCACAATCTTA 3′
Rat Gapdh forward 5′ GGATACTGAGAGCAAGAGAGA 3′,
reverse 5′ TTATGGGGTCTGGGATGGAA 3′
cDNA Constructs
The full-length mouse Gpr85 cDNA was PCR amplified from mouse brain cDNA library and subcloned into pRK5-Myc plasmid (WT and ΔC constructs). Mutagenesis reaction was performed using QuikChange II XL site-directed mutagenesis kit (Agilent Technologies) according to the manufacturer’s instructions to generate pRK5-Myc-GPR85 M152T construct (forward 5′ GGGGAATGCCGTGGCCACGGACAGAG 3′ and reverse 5′ CTCTGTCCGTGGCCACGGCATTCCCC 3′ primers). The pRK5-HA-Shank3 construct was described previously (Choi et al., 2015b). The construct contains a HA-tag followed by the full-length rat Shank3 mRNA (NM_021676.1) with entire coding region and 3′UTR.
Neuron Culture, Drug Treatment, Transfection, and Immunocytochemistry
Cultured cortical and hippocampal neurons were prepared from embryonic day 18 rat brains as described previously (Lee et al., 2017c). Dissociated neurons on poly-L-lysine-coated six-well plates or coverslips were placed in a neurobasal medium supplemented with B27 (Invitrogen), 0.5 mM L-glutamine, and penicillin/streptomycin (Thermo Fisher Scientific). For the drug treatment, cultured cortical neurons at days in vitro (DIV) 21 were treated with either picrotoxin (50 μM, Sigma-Aldrich) or tetrodotoxin (1 μM, Alomone Labs) for an indicated period and processed for RNA extraction. For immunocytochemistry, cultured hippocampal neurons at DIV 7 were transfected with Myc-GPR85 (alone or together with HA-Shank3 construct) constructs using calcium phosphate. The neurons were fixed with 4% PFA/sucrose, permeabilized with 0.2% Triton X-100, and incubated with HA (Santa Cruz, sc-7392), Myc (Santa Cruz, sc-40; Abcam, AB9106), and PSD-95 (NeuroMab, 75-028) primary and dye-conjugated secondary antibodies (Jackson ImmunoResearch). For surface staining, the neurons were incubated with Myc antibody before the permeabilization process. Images were acquired by confocal microscopy (Zeiss, LSM780) and quantified using ImageJ software in a blinded manner. Specifically, dendritic segments (length of at least 50 μm, measured by ImageJ) of the primary or secondary branches of neurons were randomly selected by an analyzer blinded to the transfected construct, and puncta along the dendritic segments were manually counted. The results were collected from three independent experiments (i.e., three independent rounds of neuron culture to image analysis; total n = 16, 16, 24 neurons for WT, ΔC, and M152T constructs were measured, respectively).
Quantification and Statistical Analysis
Values from at least three independent experiments were used for quantification and statistical analysis. This means that we performed at least three independent technical experiments, and we used different biological samples for each technical experiment. P-values were calculated by two-tailed unpaired Student’s t-test unless otherwise specified, using GraphPad Prism 6 software. All data are presented as the mean ± SEM. ∗P < 0.05; ∗∗P < 0.01; and ∗∗∗P < 0.001.
Results
Identification and Comparison of DEGs From the Transcriptome Analysis of Shank3 TG mPFC
To investigate molecular changes in the mPFC of Shank3 TG mice, we performed a transcriptome analysis (RNA sequencing [RNA-seq]) of mPFC tissue from adult (10- to 12-week-old) WT and Shank3 TG mice (Supplementary Tables S1, S2). We reasoned that this unbiased approach might highlight the major molecular changes or signaling pathways affected by mild Shank3 overexpression in the mPFC, as was done to reveal the altered mTORC1 signaling in the striatum of Shank3 TG mice (Lee et al., 2017d). After applying adjusted P values (<0.05, Benjamini–Hochberg correction) to the transcriptome analysis, we identified 195 differentially expressed genes (DEGs) (82 upregulated and 113 downregulated) in the Shank3 TG mPFC compared with the WT mPFC (Figure 1A and Supplementary Table S3). Based on the fold change values, odorant-binding protein 2B (Obp2b), C-type lectin domain family 1 member B (Clec1b), and secretagogin, EF-hand calcium-binding protein (Scgn) were the top three upregulated genes, whereas transmembrane protein 212 (Tmem212), calpain 11 (Capn11), and solute carrier family 5 member 11 (Slc5a11) were the top three downregulated genes (Figure 1B, left). In contrast, based on the P values, Shank3, Musashi RNA-binding protein 2 (Msi2), and lysine methyltransferase 2A (Kmt2a) were the top three upregulated genes, whereas myelin basic protein (Mbp), breast carcinoma-amplified sequence 1 (Bcas1), and septin 4 (Sept4) were the top three downregulated genes (Figure 1B, right).
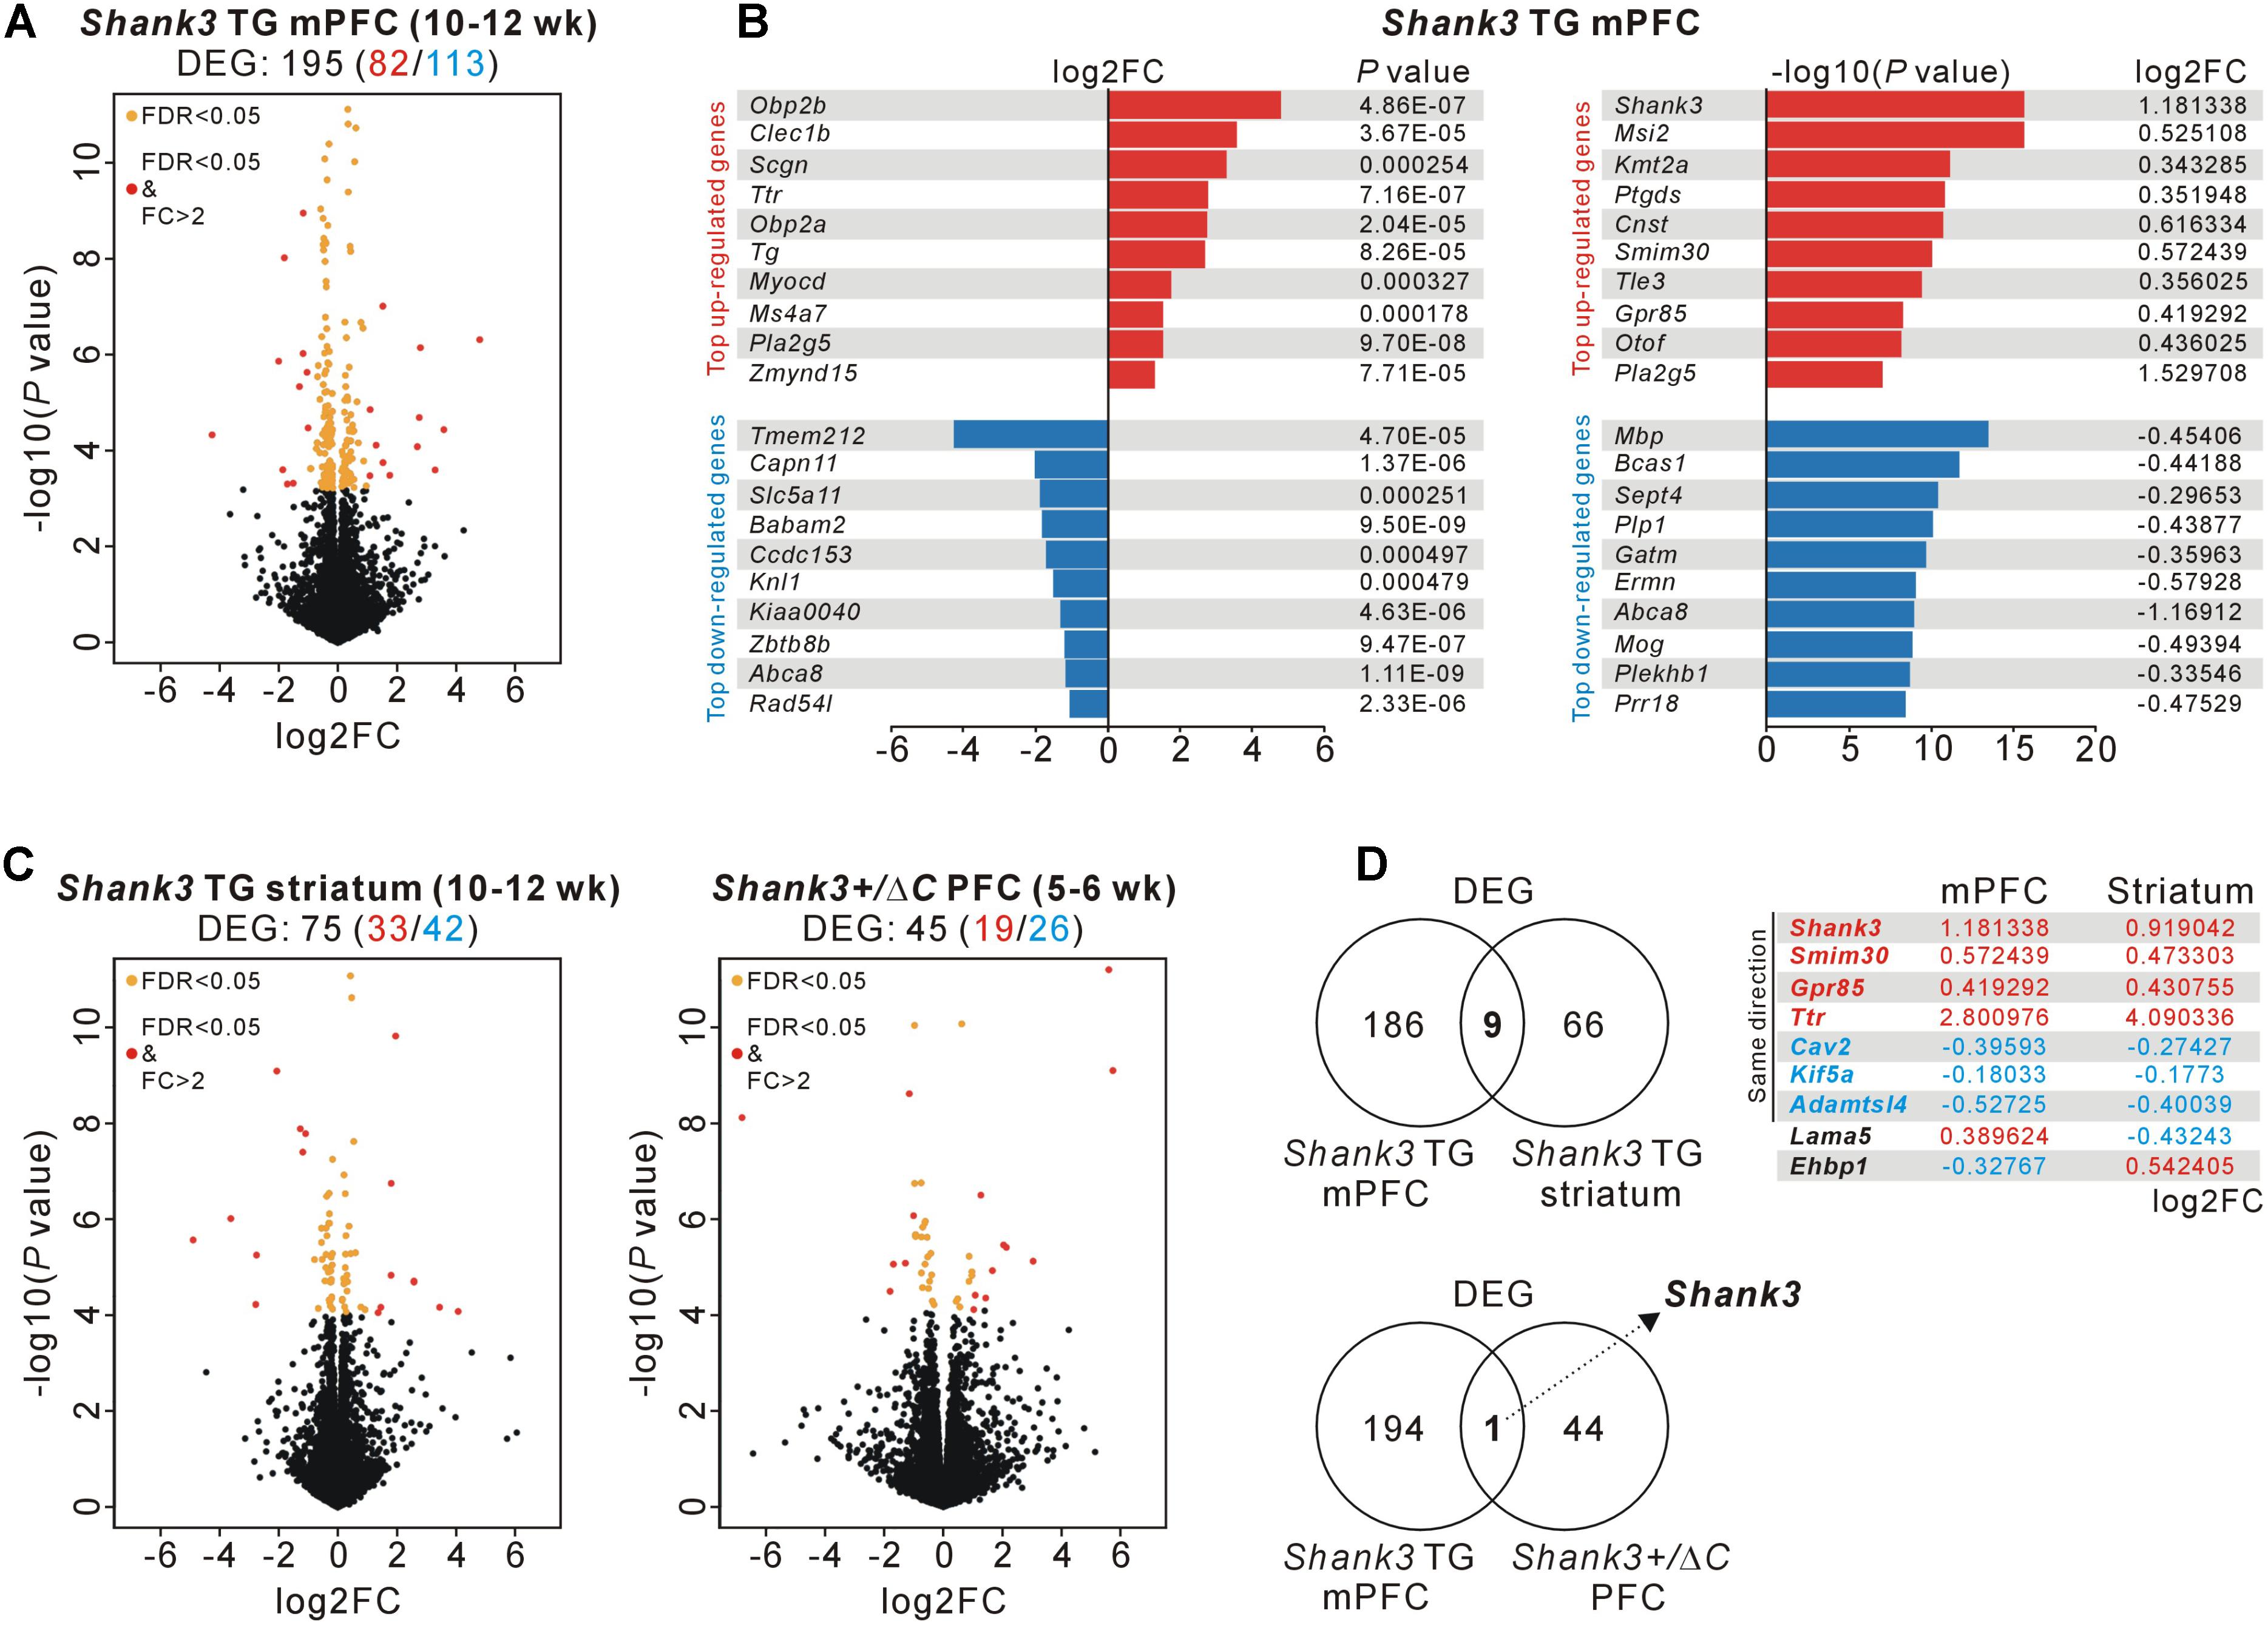
FIGURE 1. RNA-seq and DEG analyses in the Shank3 TG mPFC and striatum and in the Shank3+/ΔC PFC. (A) Volcano plot for the mPFC RNA-seq analysis of 10- to 12-week-old Shank3 TG mice. Differentially expressed genes (DEGs), defined by FDR < 0.05, are shown as orange (FC ≤ 2) and red (FC > 2) circles. FC, fold change. The complete lists of the RNA-seq analysis and DEGs are provided in Supplementary Tables S2, S3. (B) List of top 10 upregulated and downregulated DEGs [based on the fold changes (left) and based on the P-values (right)] from the mPFC RNA-seq analysis of Shank3 TG mice. (C) Volcano plots for the striatum RNA-seq analysis of 10- to 12-week-old Shank3 TG mice (left) and for the PFC RNA-seq analysis of 5- to 6-week-old Shank3+/ΔC mice (right). The complete lists of DEGs are provided in Supplementary Tables S4, S5, respectively. (D) The Venn diagrams show the numbers of common DEGs between the mPFC and striatum of Shank3 TG mice (nine genes, upper) and between the mPFC of Shank3 TG mice and the PFC of Shank3+/ΔC mice (only Shank3, lower). For the nine common DEGs between the mPFC and striatum of Shank3 TG mice, the log2FC values for each brain region are shown.
Next, we tried to understand how specific the Shank3 TG mPFC DEGs were by comparing them with DEGs from two recently published Shank3-related RNA-seq studies. One was from the striatum of adult (10- to 12-week-old) Shank3 TG mice (Lee et al., 2017d), with which we aimed to identify both brain region-specific (i.e., mPFC- or striatum-specific) and, if any, broad (i.e., common to multiple brain regions) molecular changes in adult Shank3 TG mice. The other was from the PFC of juvenile (5- to 6-week-old) Shank3+/ΔC mice (Qin et al., 2018), which are heterozygous mice for C-terminal exon 21 deletion of Shank3. The Shank3+/ΔC mice show a 50–70% reduction of Shank3 proteins in the PFC and display several autism-like behaviors, including social preference deficits and repetitive behaviors, together with molecular and functional changes of excitatory synapses in the PFC (Duffney et al., 2015). Despite the age difference (adult versus juvenile) between the mice used for the analyses, we hypothesized that we might be able to identify Shank3 dosage-dependent molecular changes in the PFC region by comparing the RNA-seq results of Shank3 TG mPFC and Shank3+/ΔC PFC.
We downloaded the raw data sets of the Shank3 TG striatum and Shank3+/ΔC PFC RNA-seq analyses and re-processed them using the same protocol as for the Shank3 TG mPFC RNA-seq analysis to compare the DEGs in greater detail. This approach identified 75 DEGs (33 upregulated and 42 downregulated) in the Shank3 TG striatum (Figure 1C, left and Supplementary Table S4) and 45 DEGs (19 upregulated and 26 downregulated) in the Shank3+/ΔC PFC (Figure 1C, right and Supplementary Table S5), compared with corresponding WT controls. When we compared the DEG lists of the Shank3 TG mPFC and striatum, nine genes were common to both, including Shank3 (Figure 1D, upper). Shank3, small integral membrane protein 30 (Smim30), G protein-coupled receptor 85 (Gpr85), and transthyretin (Ttr) were upregulated, whereas caveolin 2 (Cav2), kinesin family member 5A (Kif5a), and ADAMTS like 4 (Adamtsl4) were downregulated, in both brain regions of Shank3 TG mice compared with WT mice. Intriguingly, in the case of two genes, laminin subunit alpha 5 (Lama5) and EH domain-binding protein 1 (Ehbp1), the directions of changes in expression were the opposite in the mPFC and striatum of Shank3 TG mice. Lama5 was upregulated and downregulated in the mPFC and striatum of Shank3 TG mice compared with WT mice, respectively. Meanwhile, Ehbp1 was downregulated and upregulated in the Shank3 TG mPFC and striatum, respectively. In contrast to the nine common DEGs between Shank3 TG mPFC and striatum, there was only one common DEG, Shank3, between the Shank3 TG mPFC and Shank3+/ΔC PFC (Figure 1D, lower). Overall, these results indicate that the majority of the DEGs of the adult Shank3 TG mPFC and striatum were specific to each brain region, and that there was no common DEG, except for Shank3 itself, between the adult Shank3 TG mPFC and the juvenile Shank3+/ΔC PFC.
Decrease of Myelin-Related mRNA Levels Specifically in the mPFC of Shank3 TG Mice
The fact that there were not many overlaps between the DEGs of three RNA-seq analyses prompted us to investigate whether the biological pathways represented by them could be different. Even though the gene identities of DEGs were different, it is still possible that they could be involved in the same or similar biological pathways. To test this, we performed GO and KEGG pathway analyses for the DEGs of the Shank3 TG mPFC, striatum, and Shank3+/ΔC PFC.
For the 195 DEGs of the adult Shank3 TG mPFC, “central nervous system myelination” in the biological process category, “structural constituent of myelin sheath” and “heparin binding” in the molecular function category, and “extracellular matrix,” “myelin sheath,” “proteinaceous extracellular matrix,” and “extracellular exosome” in the cellular component category were observed to be significant (Figure 2A and Supplementary Table S6). For the 75 DEGs of the adult Shank3 TG striatum, “integrin-mediated signaling pathway” and “platelet activation” in the biological process category were significant, but there was no significant term in the molecular function, cellular component, or KEGG category (Figure 2B and Supplementary Table S7). For the 45 DEGs of the juvenile Shank3+/ΔC PFC, we did not find any significant term in the categories, possibly because the number of genes was too small (Supplementary Table S8). The results suggest that not only the identities of genes but also the representative biological pathways of the DEGs of the Shank3 TG mPFC, striatum, and Shank3+/ΔC PFC were largely different.
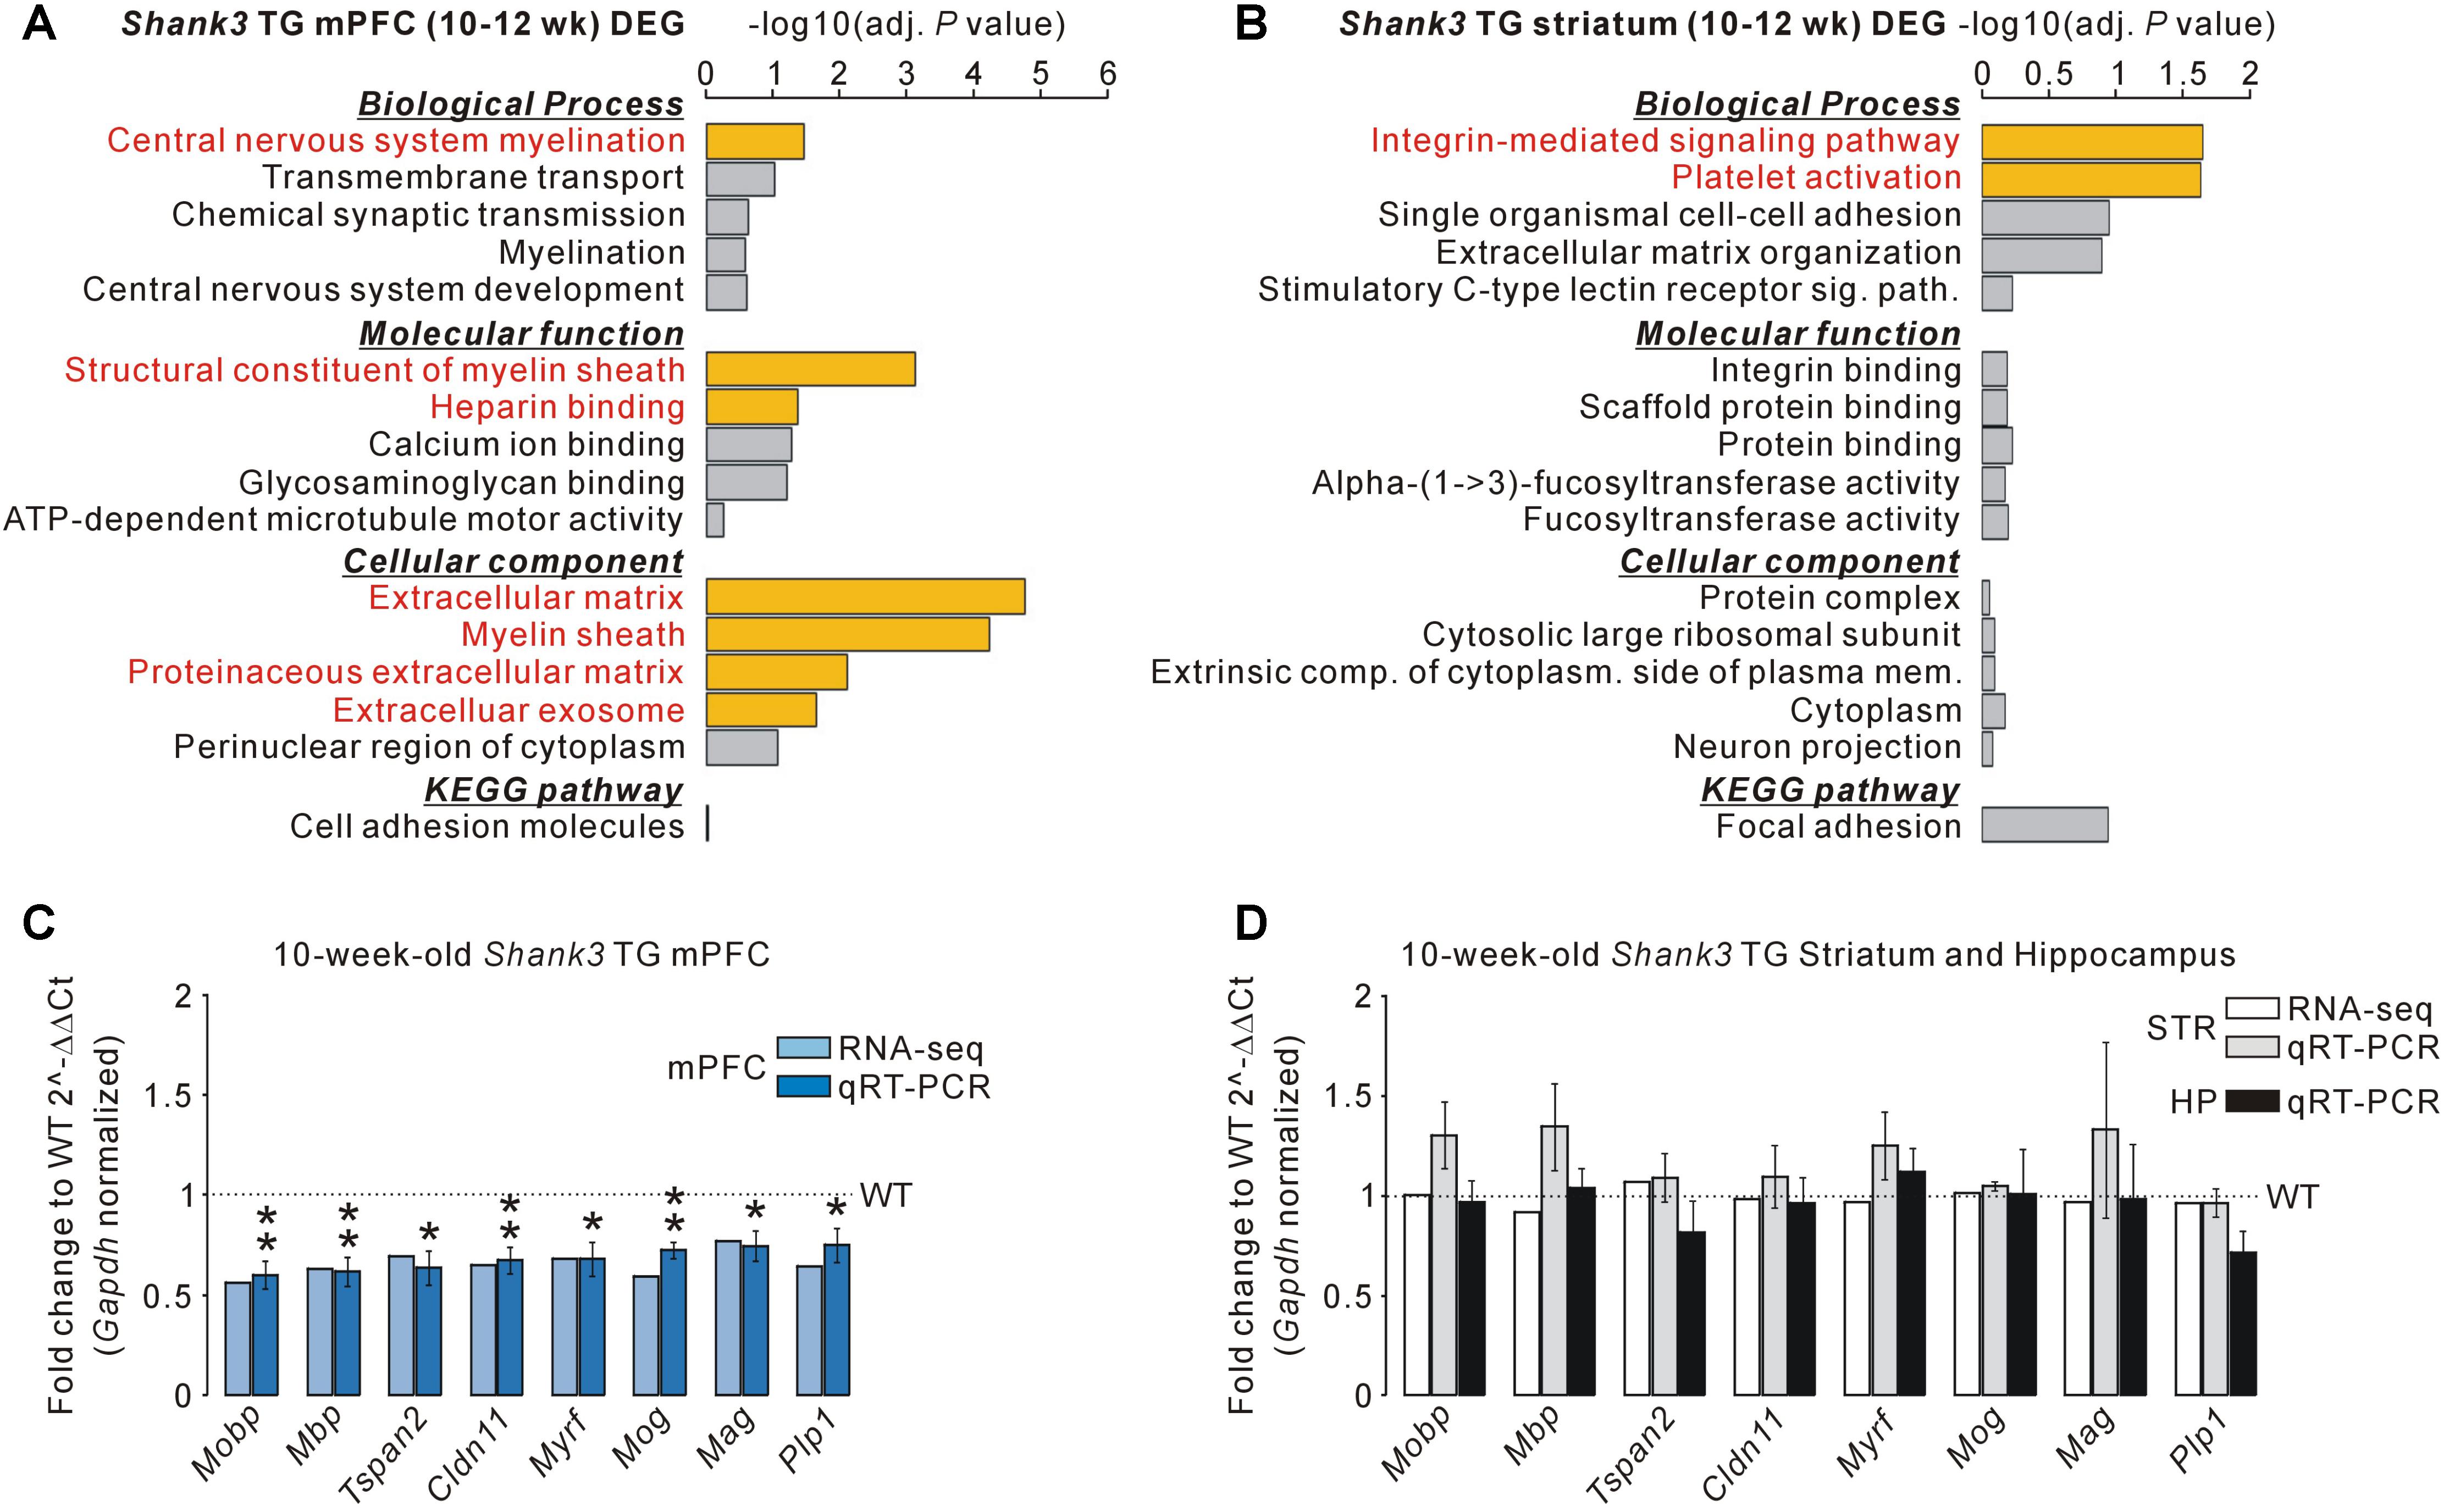
FIGURE 2. Decreased mRNA levels of myelin-related genes specifically in the mPFC, but not striatum and hippocampus, of Shank3 TG mice. (A) Gene ontology (GO) and Kyoto Encyclopedia of Genes and Genomes (KEGG) pathway analyses of the DEGs of the Shank3 TG mPFC. Significant terms (Benjamini adjusted P-value < 0.05) are highlighted in red. The complete list of analyses is provided in Supplementary Table S6. (B) GO and KEGG pathway analyses of the DEGs of the Shank3 TG striatum. The complete list of analyses is provided in Supplementary Table S7. (C) qRT-PCR validation of the eight myelin-related DEGs decreased in the Shank3 TG mPFC (dark blue bar) compared with WT mice (n = 5 animals per genotype; unpaired two-tailed Student’s t-test). The fold change value for each gene from the mPFC RNA-seq analysis is also shown (light blue bar). (D) qRT-PCR analysis of the eight myelin-related DEGs of the Shank3 TG mPFC in the Shank3 TG striatum (STR, gray bar) and hippocampus (HP, black bar) compared with WT mice (n = 4 animals per genotype; unpaired two-tailed Student’s t-test). The fold change value for each gene from the striatum RNA-seq analysis is also shown (white bar). Data are presented as mean ± SEM. ∗P < 0.05 and ∗∗P < 0.01.
Gene ontology analysis revealed that the myelin-related genes were enriched specifically in the DEGs of the Shank3 TG mPFC. Indeed, when analyzing the list of Shank3 TG mPFC DEGs, we identified 27 myelin-related genes (see methods for the definition of myelin-related genes), most of which (25 of 27) were downregulated in the mPFC of Shank3 TG mice compared with WT mice (Supplementary Table S9). We validated eight of the decreased myelin-related DEGs (Mobp, Mbp, Tspan2, Cldn11, Myrf, Mog, Mag, and Plp1) by qRT-PCR analyses of the Shank3 TG mPFC (Figure 2C). We also confirmed that the mRNA levels of eight validated myelin-related genes were not altered in the striatum and hippocampus of Shank3 TG mice compared with WT mice (Figure 2D). These results indicate that the mRNA levels of myelin-related genes were altered specifically in the mPFC, but not in the striatum or the hippocampus, of adult Shank3 TG mice. None of the 27 myelin-related DEGs of the Shank3 TG mPFC were found in the Shank3+/ΔC PFC DEGs, suggesting the normal expression of the genes in Shank3+/ΔC mice (Supplementary Table S5). However, direct qRT-PCR validations are necessary to confirm this.
Increase of Gpr85 mRNA Levels in the Multiple Brain Regions of Shank3 TG Mice
Next, we attempted to identify whether there were any commonly altered DEGs among the multiple brain regions of Shank3 TG mice, which might provide additional insights into the molecular pathophysiology of Shank3 overexpression. Therefore, we re-evaluated the nine, including Shank3, shared DEGs between the Shank3 TG mPFC and striatum (Figure 1D, upper). Among them, Gpr85 (also called Sreb2 for superconserved receptor expressed in brain 2), an upregulated DEG in both mPFC and striatum of Shank3 TG mice, was significant, because of its known associations with SCZ and ASDs (Matsumoto et al., 2008; Fujita-Jimbo et al., 2015).
There are three members in the Sreb gene family, Sreb1 (Gpr27), Sreb2 (Gpr85), and Sreb3 (Gpr173), which have previously been shown to be expressed in the central nervous system (Matsumoto et al., 2000, 2005). Thus, we performed qRT-PCR for Gpr27, Gpr85, and Gpr173 in the cortex, hippocampus, striatum, and cerebellum of adult (10-week-old) WT and Shank3 TG mice (Figure 3A). We found that the mRNA levels of Gpr85 were significantly upregulated in the four brain regions of Shank3 TG mice compared with WT mice. Intriguingly, however, Gpr27 and Gpr173 mRNAs showed trends of downregulation in the four brain regions of Shank3 TG mice. Specifically, Gpr27 mRNA was significantly downregulated in the cortex, and Gpr173 mRNA was significantly downregulated in the cortex and striatum of Shank3 TG mice (Figure 3A). When we performed qRT-PCR analysis of the juvenile (5-week-old) WT and Shank3 TG cortex and hippocampus, Gpr85 mRNA was found to be significantly upregulated in the hippocampus, but not in the cortex, of Shank3 TG mice, whereas Gpr27 and Gpr173 showed normal expression in both brain regions, suggesting age-dependent expression changes in Gpr27, Gpr85, and Gpr173 in Shank3 TG brains (Figure 3B). Gpr27, Gpr85, and Gpr173 mRNA levels were slightly higher in the adult stage compared with the juvenile stage of the WT cortex (Figure 3C).
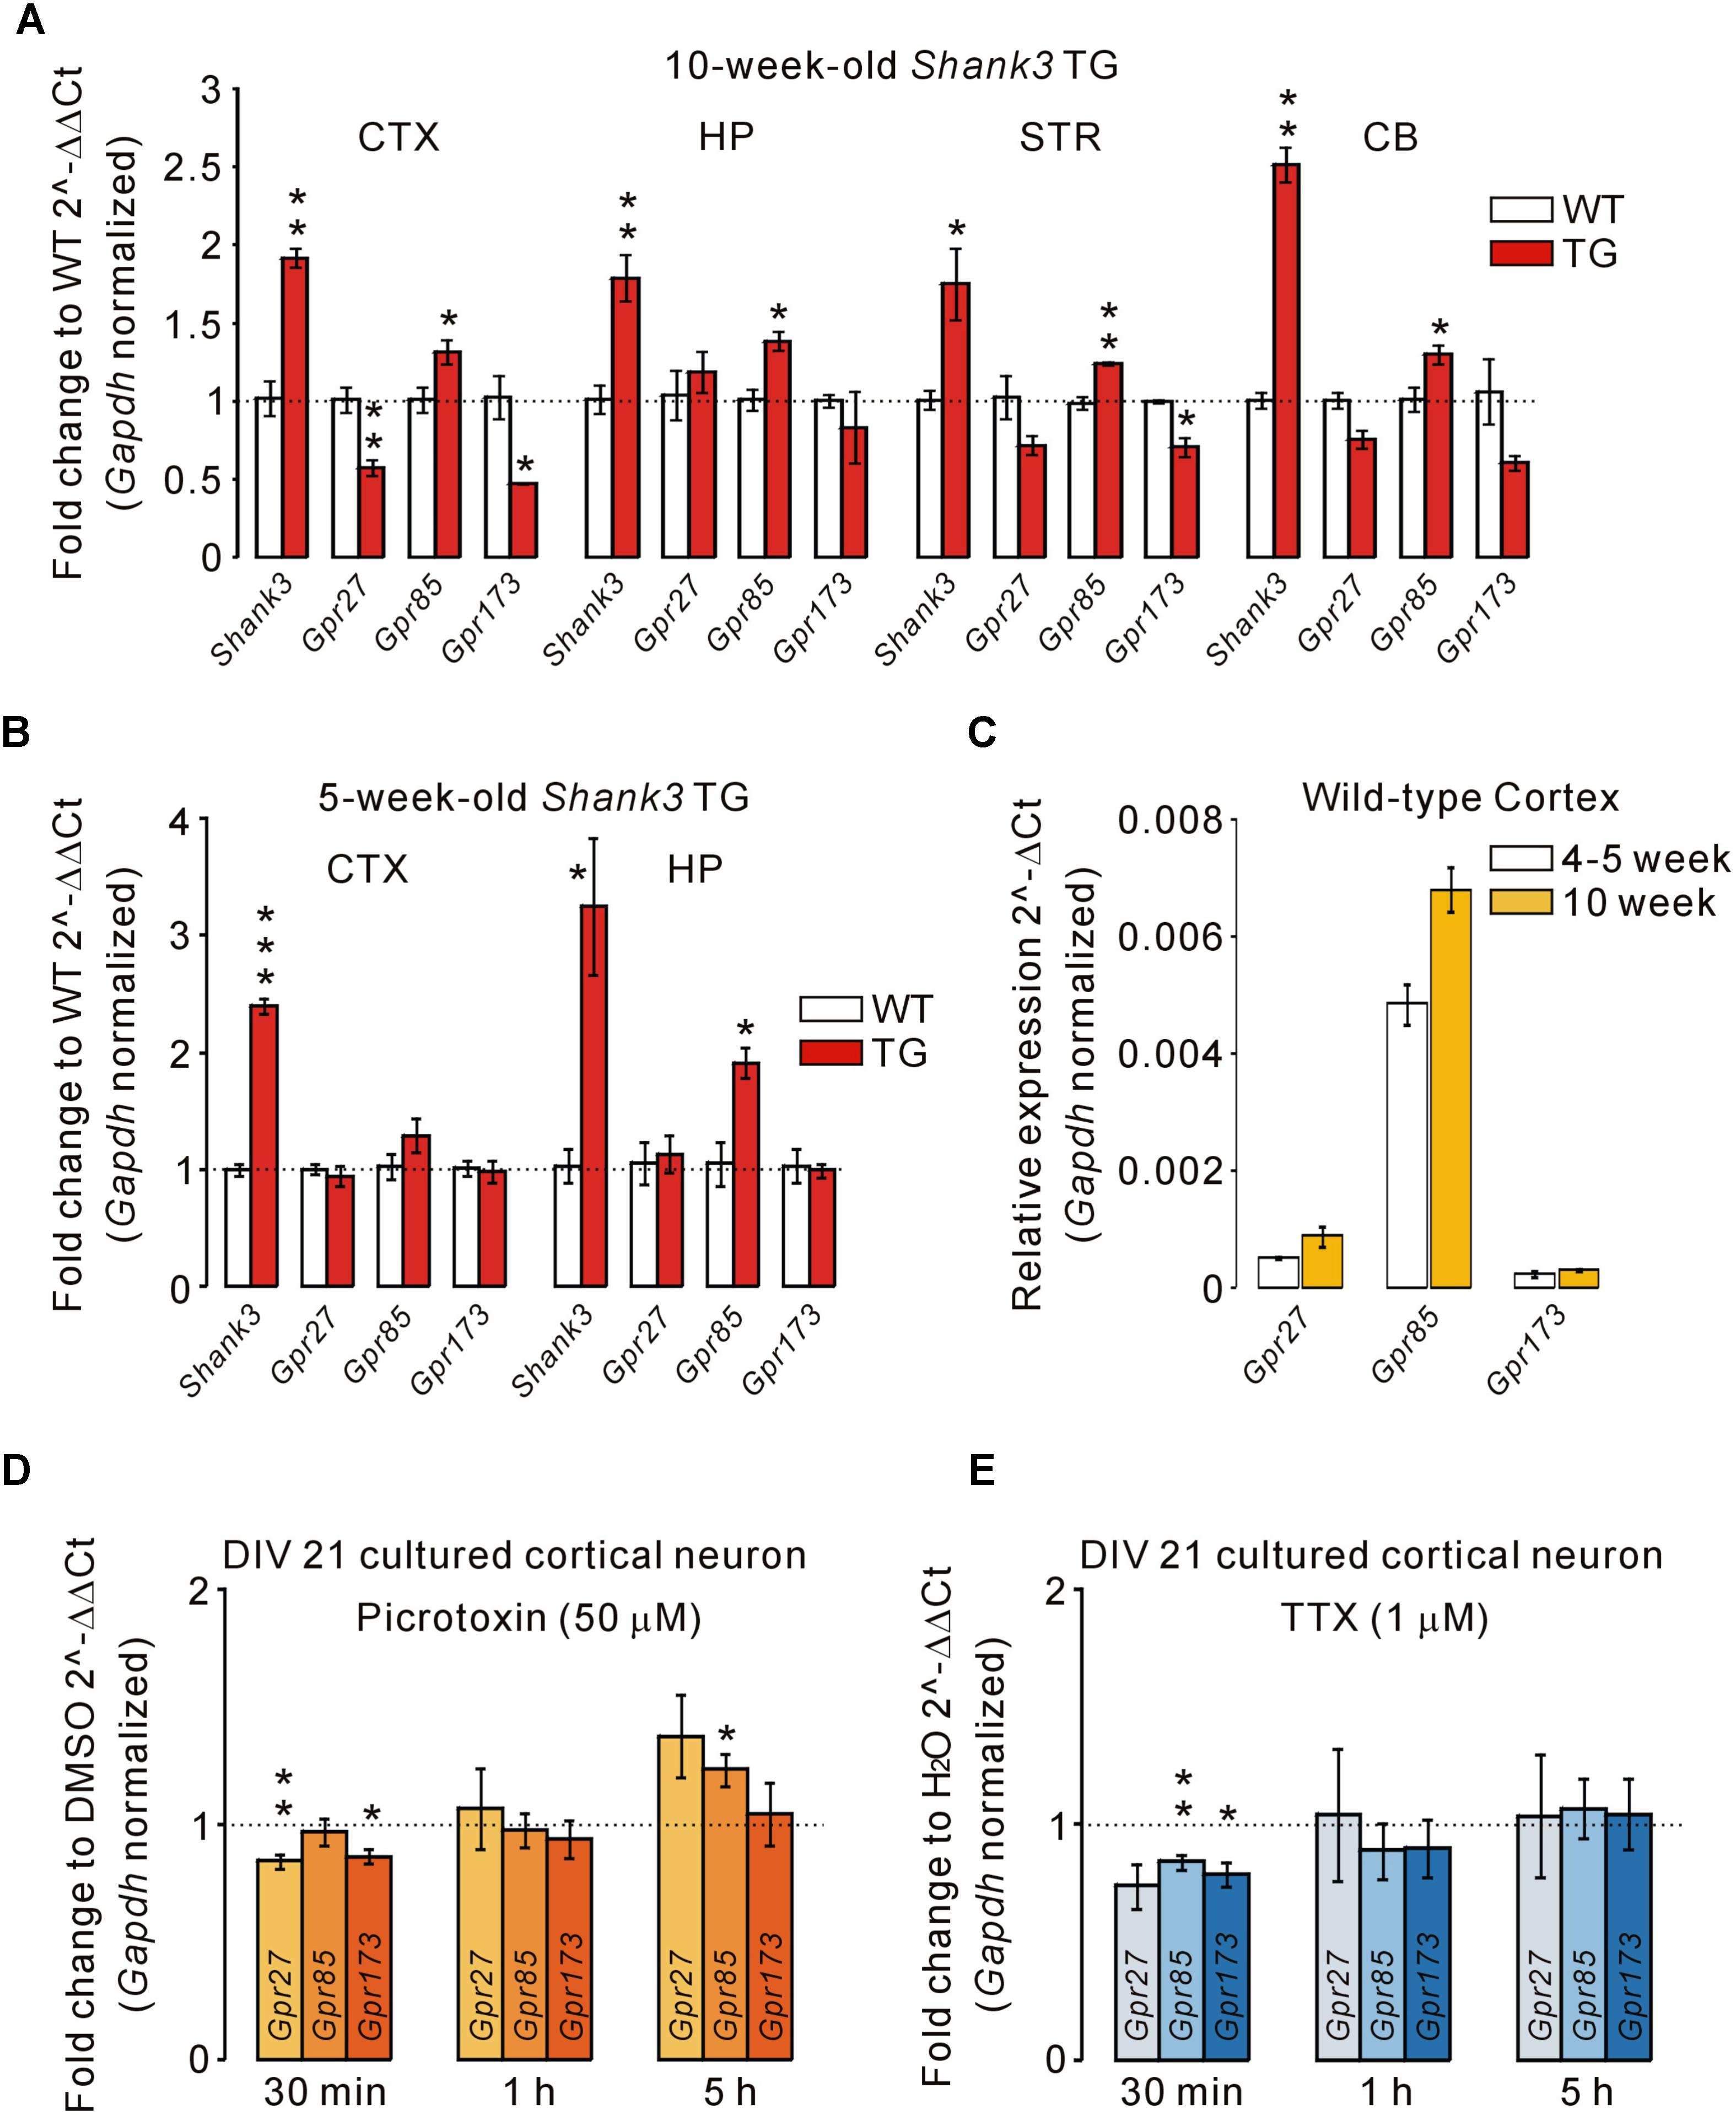
FIGURE 3. Altered mRNA levels of Gpr27, Gpr85, and Gpr173 in multiple brain regions of Shank3 TG mice. (A) qRT-PCR analysis of Gpr27, Gpr85, and Gpr173 in the adult Shank3 TG cortex (CTX), hippocampus (HP), striatum (STR), and cerebellum (CB) compared with WT mice (n = 4 animals per genotype; unpaired two-tailed Student’s t-test). Shank3 was used as a positive control. (B) qRT-PCR analysis of Gpr27, Gpr85, and Gpr173 in the juvenile Shank3 TG cortex and hippocampus compared with WT mice (n = 4 animals per genotype; unpaired two-tailed Student’s t-test). (C) qRT-PCR analysis of the relative expression of Gpr27, Gpr85, and Gpr173 between the cortical tissues of juvenile and adult WT mice (n = 3 animals). (D) qRT-PCR analysis of Gpr27, Gpr85, and Gpr173 in the cultured cortical neurons of days in vitro (DIV) 21 treated with picrotoxin for the indicated periods of time (n = 5 biological replicates; unpaired two-tailed Student’s t-test). Dimethyl sulfoxide (DMSO) was a vehicle control. h, hour. (E) qRT-PCR analysis of Gpr27, Gpr85, and Gpr173 in the neurons treated with tetrodotoxin (TTX) for the indicated periods (n = 4 biological replicates; unpaired two-tailed Student’s t-test). H2O was a vehicle control. Data are presented as mean ± SEM. ∗P < 0.05, ∗∗P < 0.01, and ∗∗∗P < 0.001.
Next, we investigated what the potential mechanisms underlying the altered expression of Gpr27, Gpr85, and Gpr173 in Shank3 TG brains could be. It has been previously reported that Shank3 proteins undergo synapse-to-nucleus shuttling in an activity-dependent manner, and that Shank3 proteins may regulate the expression of several genes in the nucleus (Grabrucker et al., 2014). However, Gpr27, Gpr85, and Gpr173 were not in the list of potential “Shank3 target genes” reported in the study. Therefore, we tested whether the neuronal activity could regulate Gpr27, Gpr85, and Gpr173 expression. We previously showed increased excitatory, but decreased inhibitory, synaptic function, and spontaneous seizures in Shank3 TG mice (Han et al., 2013), which suggests increased neuronal activity. We treated cultured cortical neurons of DIV 21 with either picrotoxin (a blocker for inhibitory GABAA receptor) or tetrodotoxin (TTX, a sodium channel blocker inhibiting action potential firing) for three different time periods (30 min, 1 h, and 5 h) to increase and decrease neuronal activity, respectively, and measured the mRNA levels of Gpr27, Gpr85, and Gpr173. For the picrotoxin treatment, we found that Gpr27 and Gpr173 mRNAs were decreased when neurons were treated for 30 min, whereas Gpr85 mRNA was increased when neurons were treated for 5 h (Figure 3D). For TTX treatment, Gpr85 and Gpr173 mRNAs were decreased when neurons were treated for 30 min, but there was no change in the mRNA levels in the rest of conditions (Figure 3E). Taken together, these results suggest that the mRNA levels of Gpr85 and its family members, Gpr27 and Gpr173, were altered in the multiple brain regions of adult Shank3 TG mice, possibly due to increased neuronal activity.
Negative Regulation of Excitatory Synapse Number by GPR85 in Cultured Hippocampal Neurons
GPR85 is an orphan G protein-coupled receptor (GPCR), and its molecular functions in neurons remain largely unknown. Nevertheless, a recent study showed that GPR85 could interact and co-localize with a core excitatory synaptic protein, PSD-95, in neurons (Fujita-Jimbo et al., 2015). As PSD-95 forms a protein complex with Shank3 through another protein, guanylate kinase-associated protein/synapse-associated protein-associated protein (GKAP/SAPAP) (Naisbitt et al., 1999; Kim and Sheng, 2004; Sheng and Hoogenraad, 2007; Sheng and Kim, 2011), it is possible that GPR85 can also indirectly interact with Shank3 at neuronal excitatory synapses.
To test this, we generated an N-terminal Myc-tagged GPR85 construct with which surface GPR85 proteins expressed in cultured hippocampal neurons could be detected (Figure 4A). As previously reported (Fujita-Jimbo et al., 2015), surface GPR85 proteins were co-localized with endogenous PSD-95 proteins in cultured neurons (Figure 4B, upper). Moreover, when co-transfected with Shank3, the surface GPR85 and Shank3 proteins were found to be highly co-localized along neuronal dendrites, suggesting that they could form protein complexes in neurons (Figure 4B, lower).
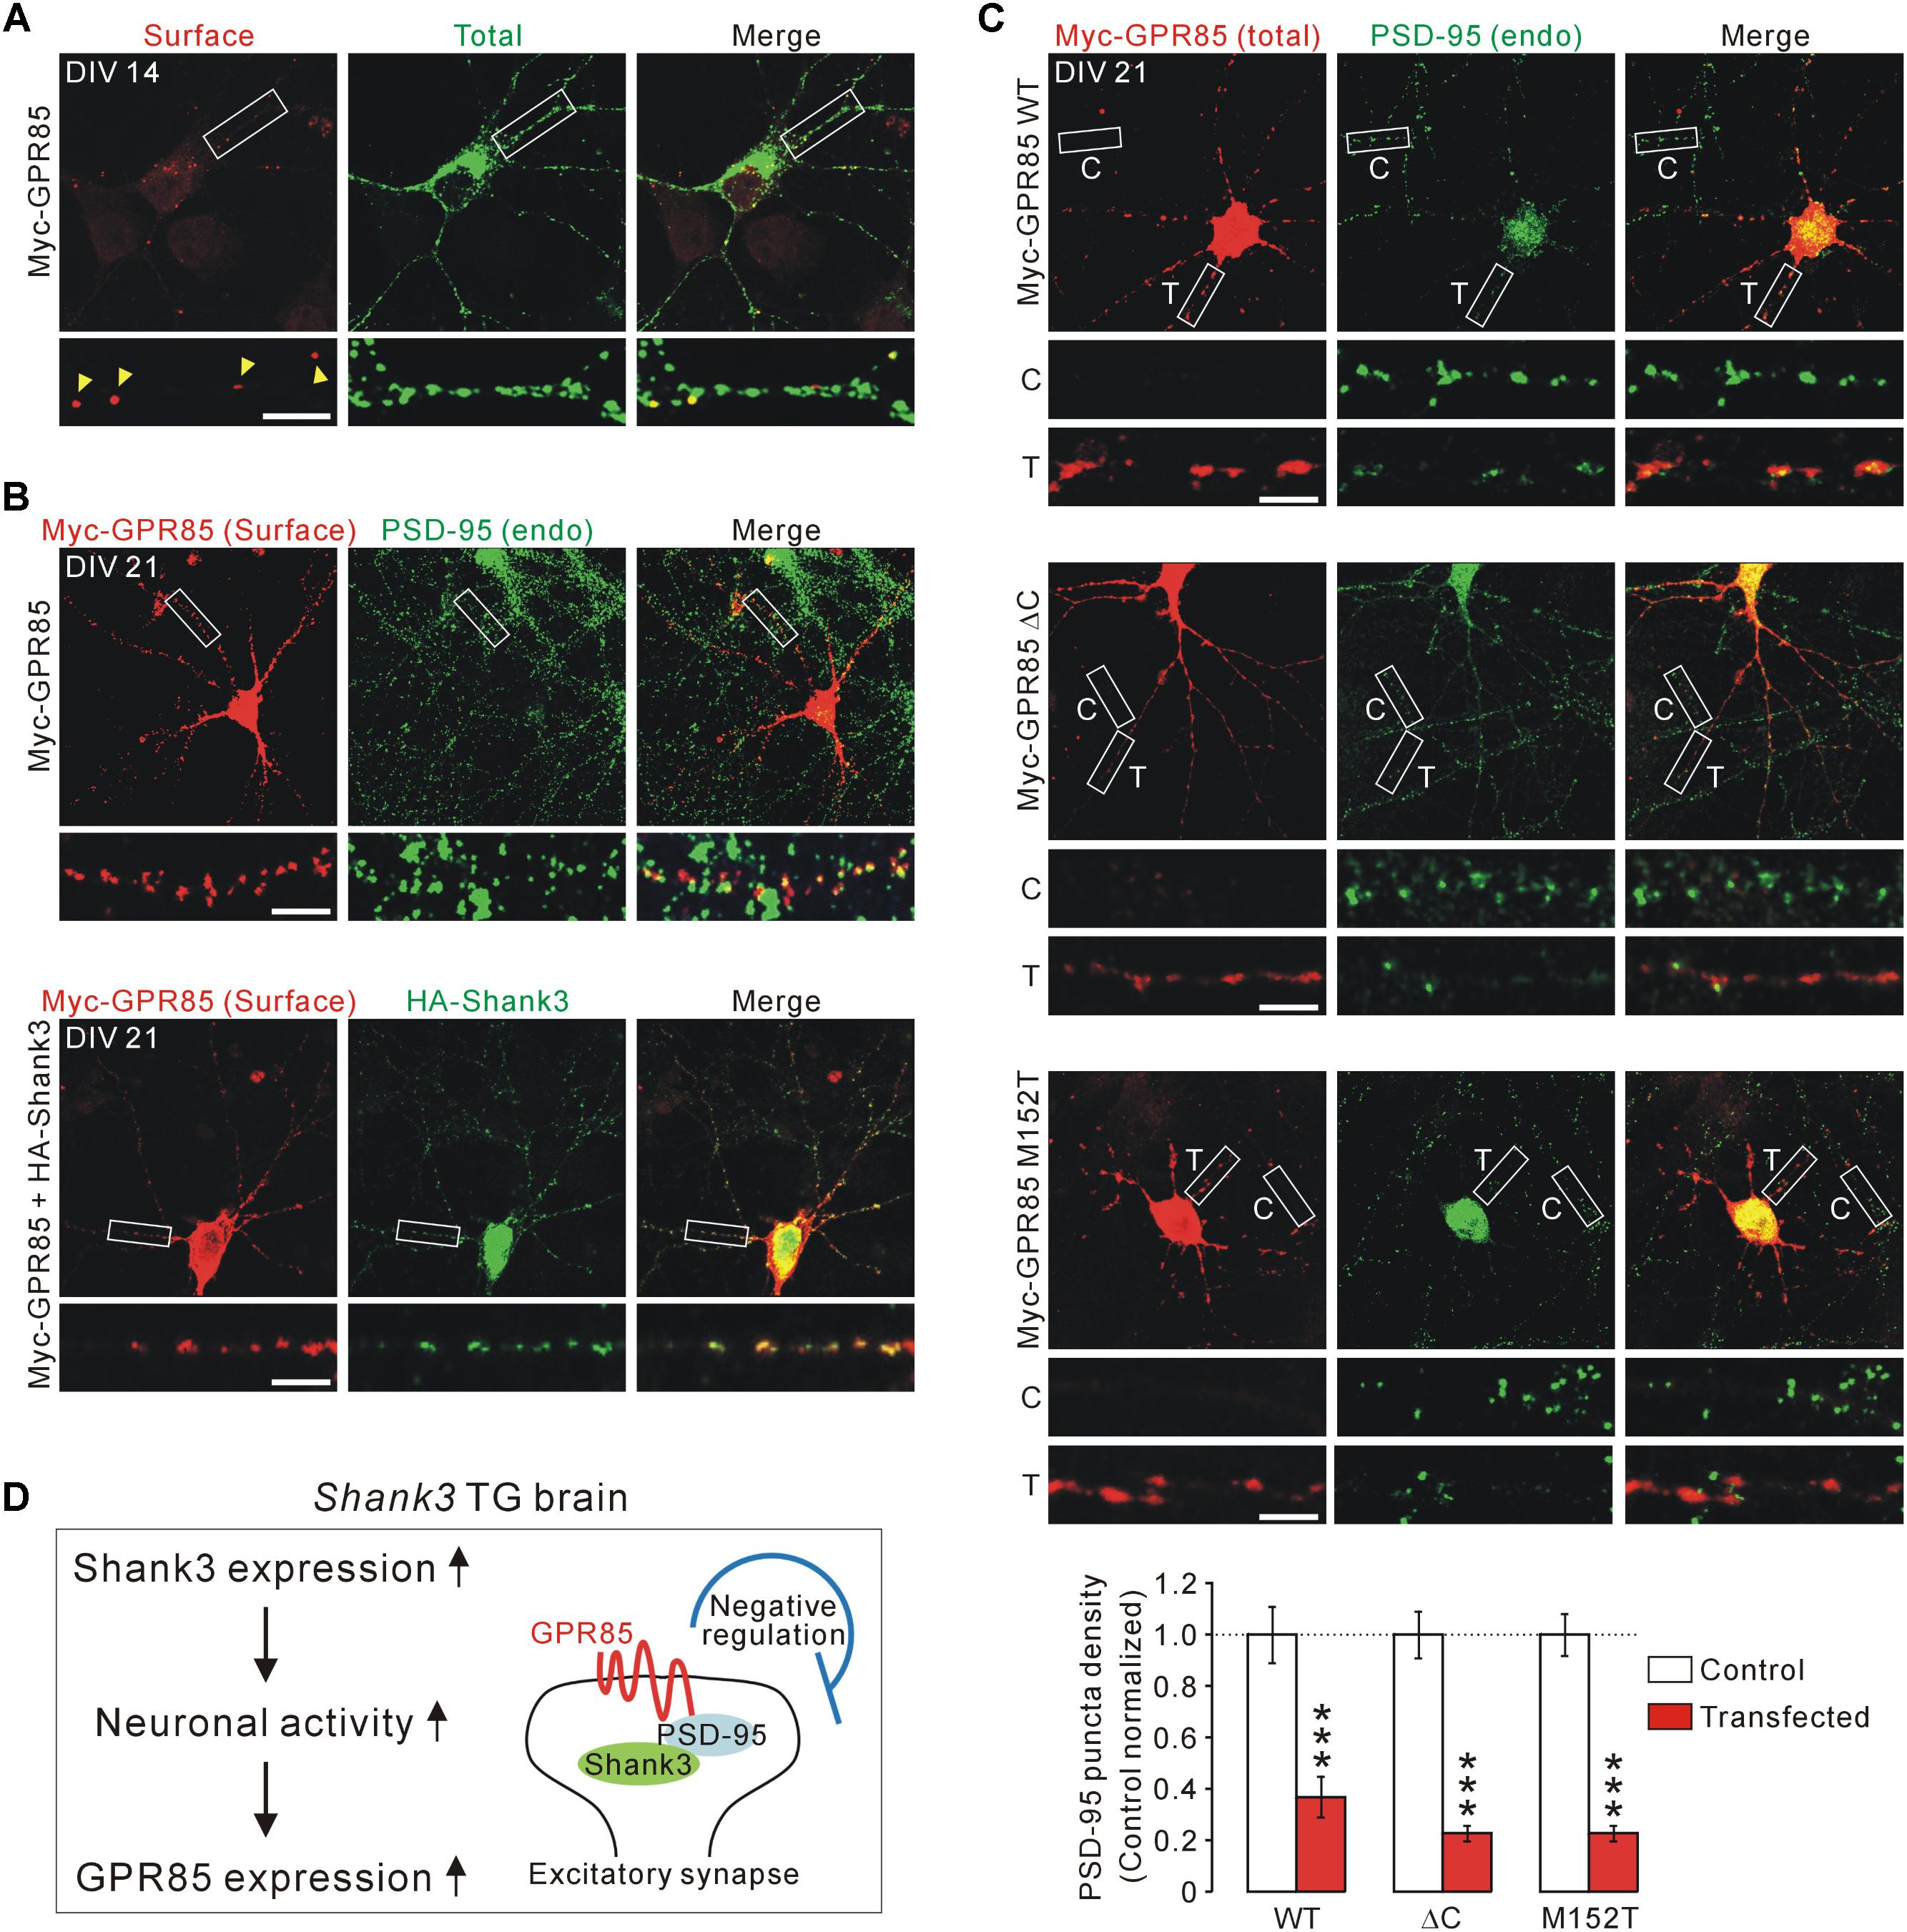
FIGURE 4. Localization and function of GPR85 in excitatory synapses of cultured hippocampal neurons. (A) Representative immunostaining image shows the surface and total protein expression of Myc-GPR85 in cultured hippocampal neurons of DIV 14. Scale bar, 10 μm. (B) Representative immunostaining images show co-localizations of surface Myc-GPR85 puncta with endogenous (endo) PSD-95 (upper) and with exogenous HA-Shank3 (lower) proteins in cultured hippocampal neurons of DIV 21. (C) Representative immunostaining images and quantification show the decreased density of PSD-95 in cultured hippocampal neurons of DIV 21 transfected with Myc-GPR85 constructs (WT, ΔC, or M152T), compared with nearby untransfected neurons (n = 16, 16, 24 neurons for WT, ΔC, and M152T constructs, respectively; unpaired two-tailed Student’s t-test). C, control; T, transfected. (D) The proposed hypothesis suggests that GPR85 expression is increased in Shank3 TG neurons due to increased neuronal activity and that GPR85 forms a complex with Shank3 via PSD-95 to negatively regulate the number of excitatory synapses. Data are presented as mean ± SEM. ∗∗∗P < 0.001.
Next, we investigated the functional effects of GPR85 overexpression, which might mimic its increased expression in Shank3 TG neurons, on excitatory synapses by measuring the PSD-95 puncta density. We used three different GPR85 constructs, WT, ΔC without last four amino acid residues critical for PSD-95 interaction (Fujita-Jimbo et al., 2015), and M152T mutant identified in an ASD patient (Fujita-Jimbo et al., 2015). We transfected each of the GPR85 constructs to culture hippocampal neurons of DIV 7 and fixed the neurons and immunostained for PSD-95 at DIV 21. We found that the neurons transfected with GPR85 WT had significantly less PSD-95 puncta along the dendrites compared with nearby untransfected neurons (Figure 4C, upper). Moreover, GPR85 ΔC and M152T constructs also showed decreased PSD-95 puncta density, similar to the WT construct (Figure 4C, middle and lower). To sum up, these results suggest that GPR85 could form a protein complex with PSD-95 and Shank3 at neuronal excitatory synapses where it likely exerts a negative effect on the synaptic development and/or maintenance (Figure 4D).
GSEA of the Transcriptome Analyses of the Shank3 TG mPFC and Striatum and of the Shank3+/ΔC PFC
The above-mentioned results were based on the DEGs of RNA-seq analyses, which focused on significantly altered, but a small subset of, genes. We performed GSEA of the Shank3 TG mPFC and striatum and of the Shank3+/ΔC PFC RNA-seq analyses to identify meaningful “molecular signatures” based on the broader or overall expression changes in the transcriptome. We applied two different groups of gene sets (hallmark and KEGG gene sets) to the three RNA-seq analyses, which revealed significantly enriched terms from each transcriptome (Figure 5 and Supplementary Tables S10–S12).
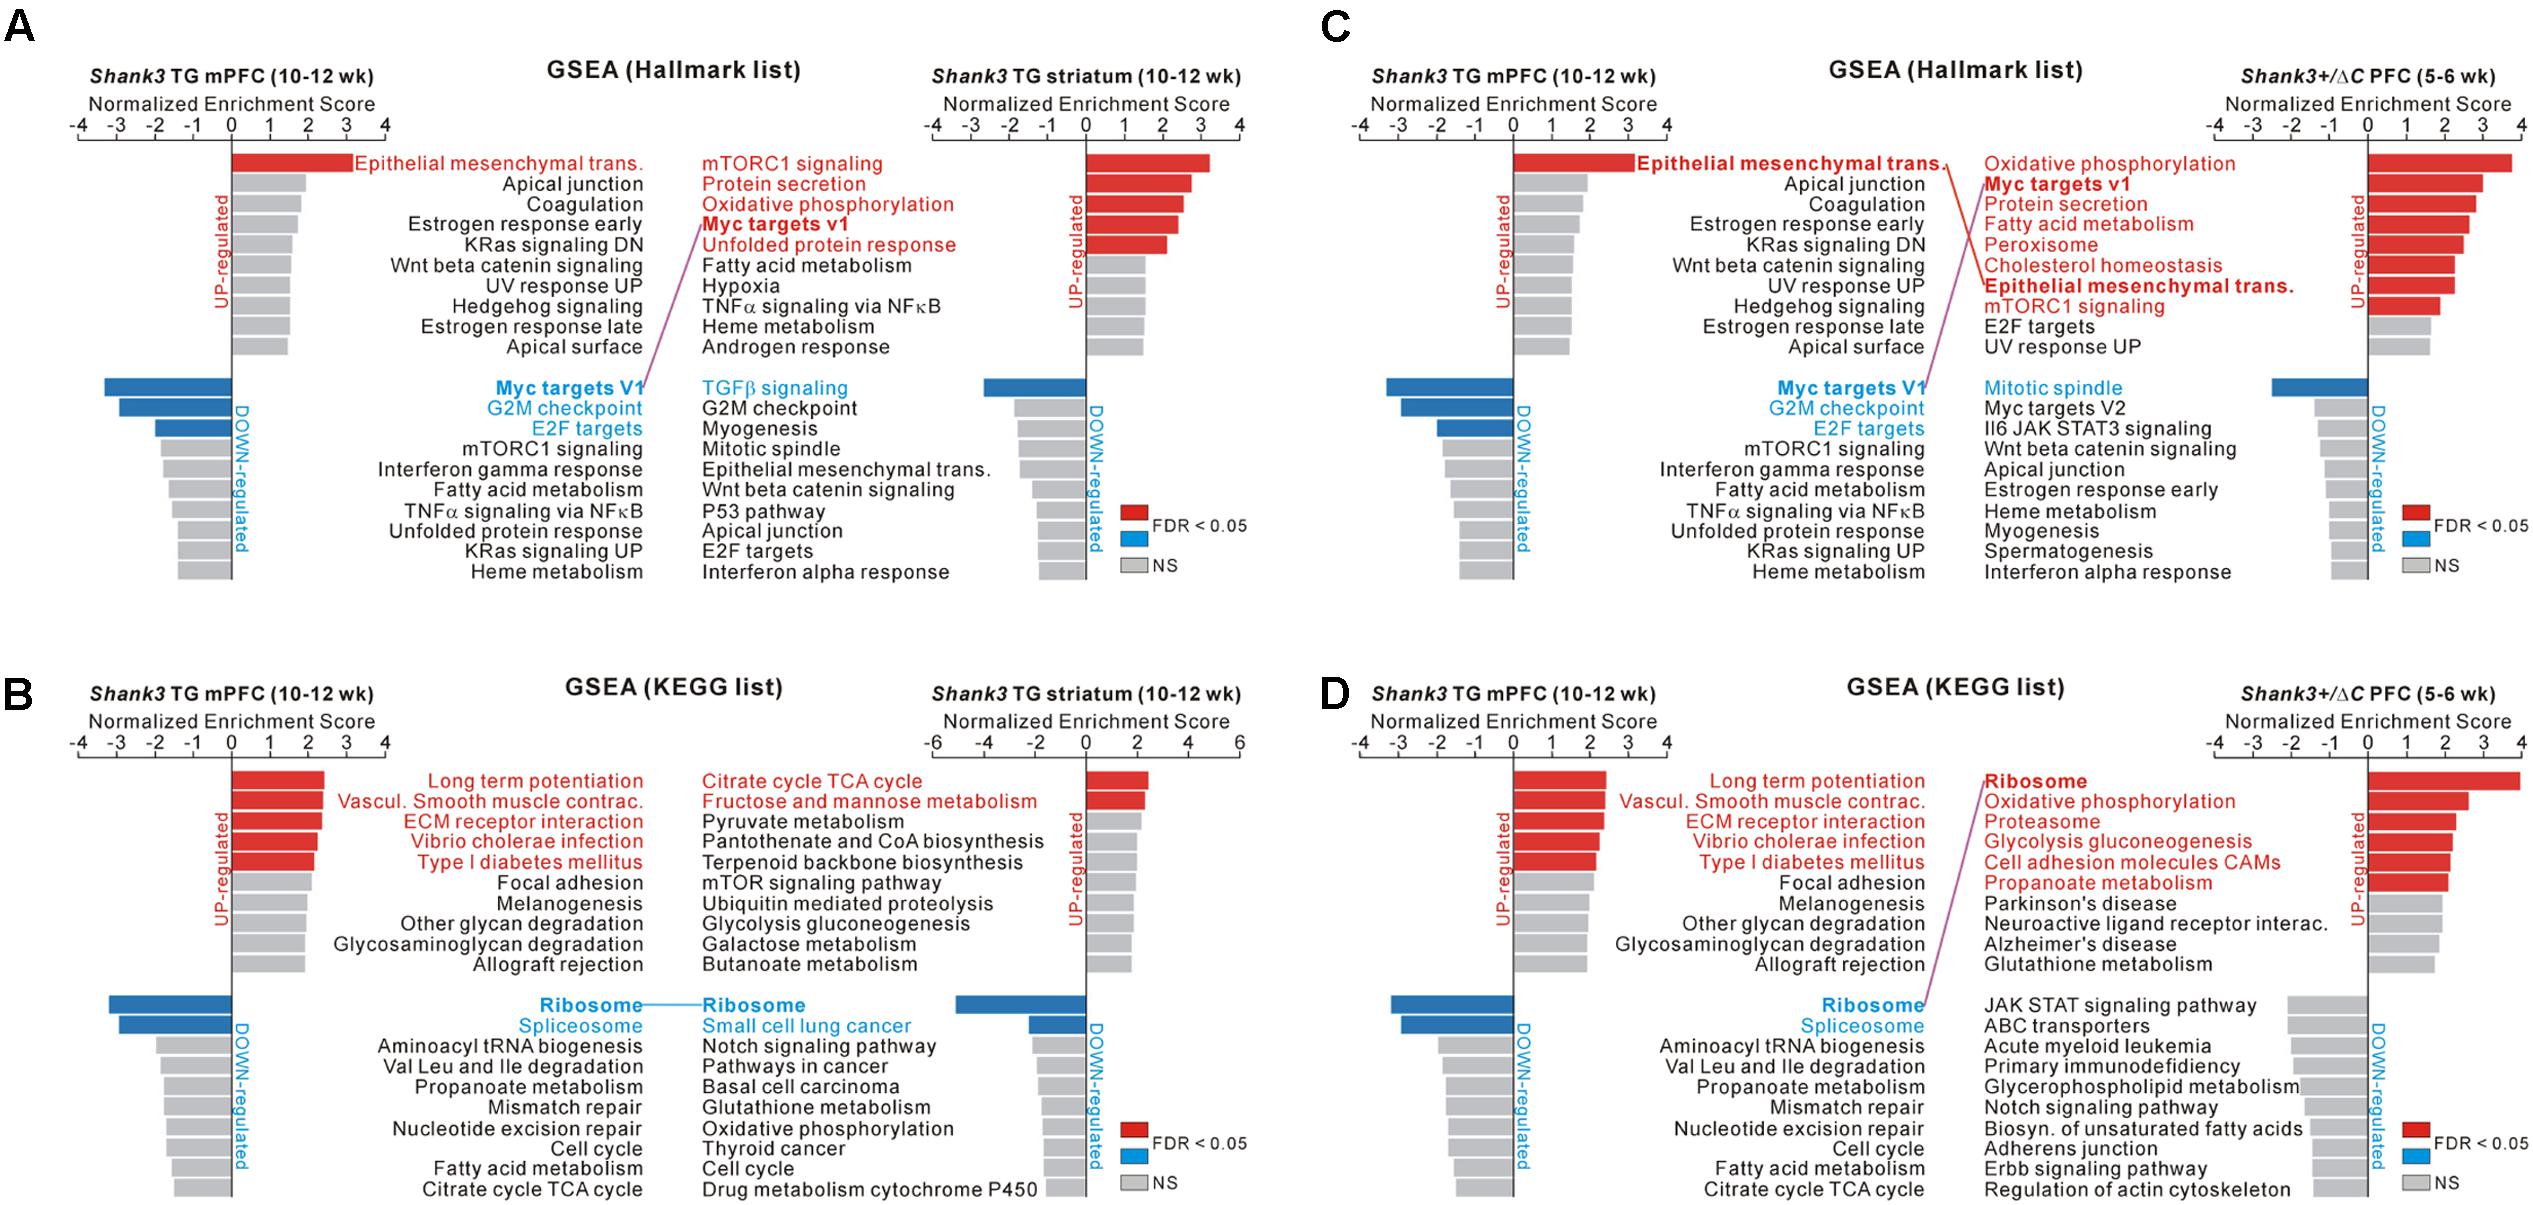
FIGURE 5. GSEA of the Shank3 TG mPFC and striatum and Shank3+/ΔC PFC RNA-seq results. (A) The bar graphs show normalized enrichment scores (NESs) of the gene set enrichment analysis (GSEA) on the hallmark gene sets for the Shank3 TG mPFC (left) and striatum (right) RNA-seq analyses. Significant gene sets (FDR < 0.05) are highlighted in red and blue for upregulated and downregulated genes, respectively. The common term, “Myc targets V1,” between the Shank3 TG mPFC and striatum, is connected with a purple line. (B) The bar graphs show NES of GSEA on the KEGG gene sets for the Shank3 TG mPFC (left) and striatum (right) RNA-seq analyses. The common term, “ribosome,” is connected with a blue line. (C) The bar graphs show NES of GSEA on the hallmark gene sets for the Shank3 TG mPFC (left) and the Shank3+/ΔC PFC (right). The common terms, “epithelial mesenchymal transition” and “Myc targets V1,” are connected with red and purple lines, respectively. (D) The bar graphs show the NES of GSEA on the KEGG gene sets for the Shank3 TG mPFC (left) and the Shank3+/ΔC PFC (right). The common term, “ribosome,” is connected with a purple line. The complete list that contains the results of the GSEA is provided in Supplementary Tables S10–S12.
In particular, we found that several enriched terms were common among the analyses of the Shank3 TG mPFC and striatum and the Shank3+/ΔC PFC. First, for the hallmark gene sets, “Myc target V1” was represented by the downregulated genes of Shank3 TG mPFC and the upregulated genes of Shank3 TG striatum (Figure 5A). Second, for the KEGG gene sets, “ribosome” was represented by the downregulated genes of both Shank3 TG mPFC and striatum (Figure 5B). Third, for the hallmark gene sets, “epithelial mesenchymal transition” was enriched by the upregulated genes of both Shank3 TG mPFC and Shank3+/ΔC PFC, whereas “Myc target V1” was represented by the downregulated genes of Shank3 TG mPFC and the upregulated genes of Shank3+/ΔC PFC (Figure 5C). Finally, for the KEGG gene sets, “ribosome” was enriched by the downregulated genes of Shank3 TG mPFC and the upregulated genes of Shank3+/ΔC PFC (Figure 5D).
Among the GSEA results, we further investigated the ribosome-related gene expression changes, because those genes were downregulated in the Shank3 TG mPFC and striatum but upregulated in the Shank3+/ΔC PFC (Figure 6A), thus possibly modulated in a Shank3 dosage-dependent manner. Moreover, it was previously reported that neuronal mTORC1 signaling, which regulates ribosome biogenesis and function (Jastrzebski et al., 2007; Iadevaia et al., 2014), can be altered by Shank3 overexpression or knock-down (Bidinosti et al., 2016; Lee et al., 2017d). Therefore, we compared the ribosome-related GSEA core enrichment genes of the Shank3 TG mPFC and the Shank3+/ΔC PFC. There were 65 downregulated and 78 upregulated ribosome-related core genes in the Shank3 TG mPFC and the Shank3+/ΔC PFC RNA-seq analyses, respectively (Supplementary Table S13), and surprisingly, 61 genes (74.4% of total) were found to be shared between them (Figure 6B). Overall, these results suggest that there could be some shared molecular signatures between the different brain regions of Shank3 TG mice and between the PFC regions of Shank3 TG and Shank3+/ΔC mice, and that ribosome-related changes could be a potential candidate.
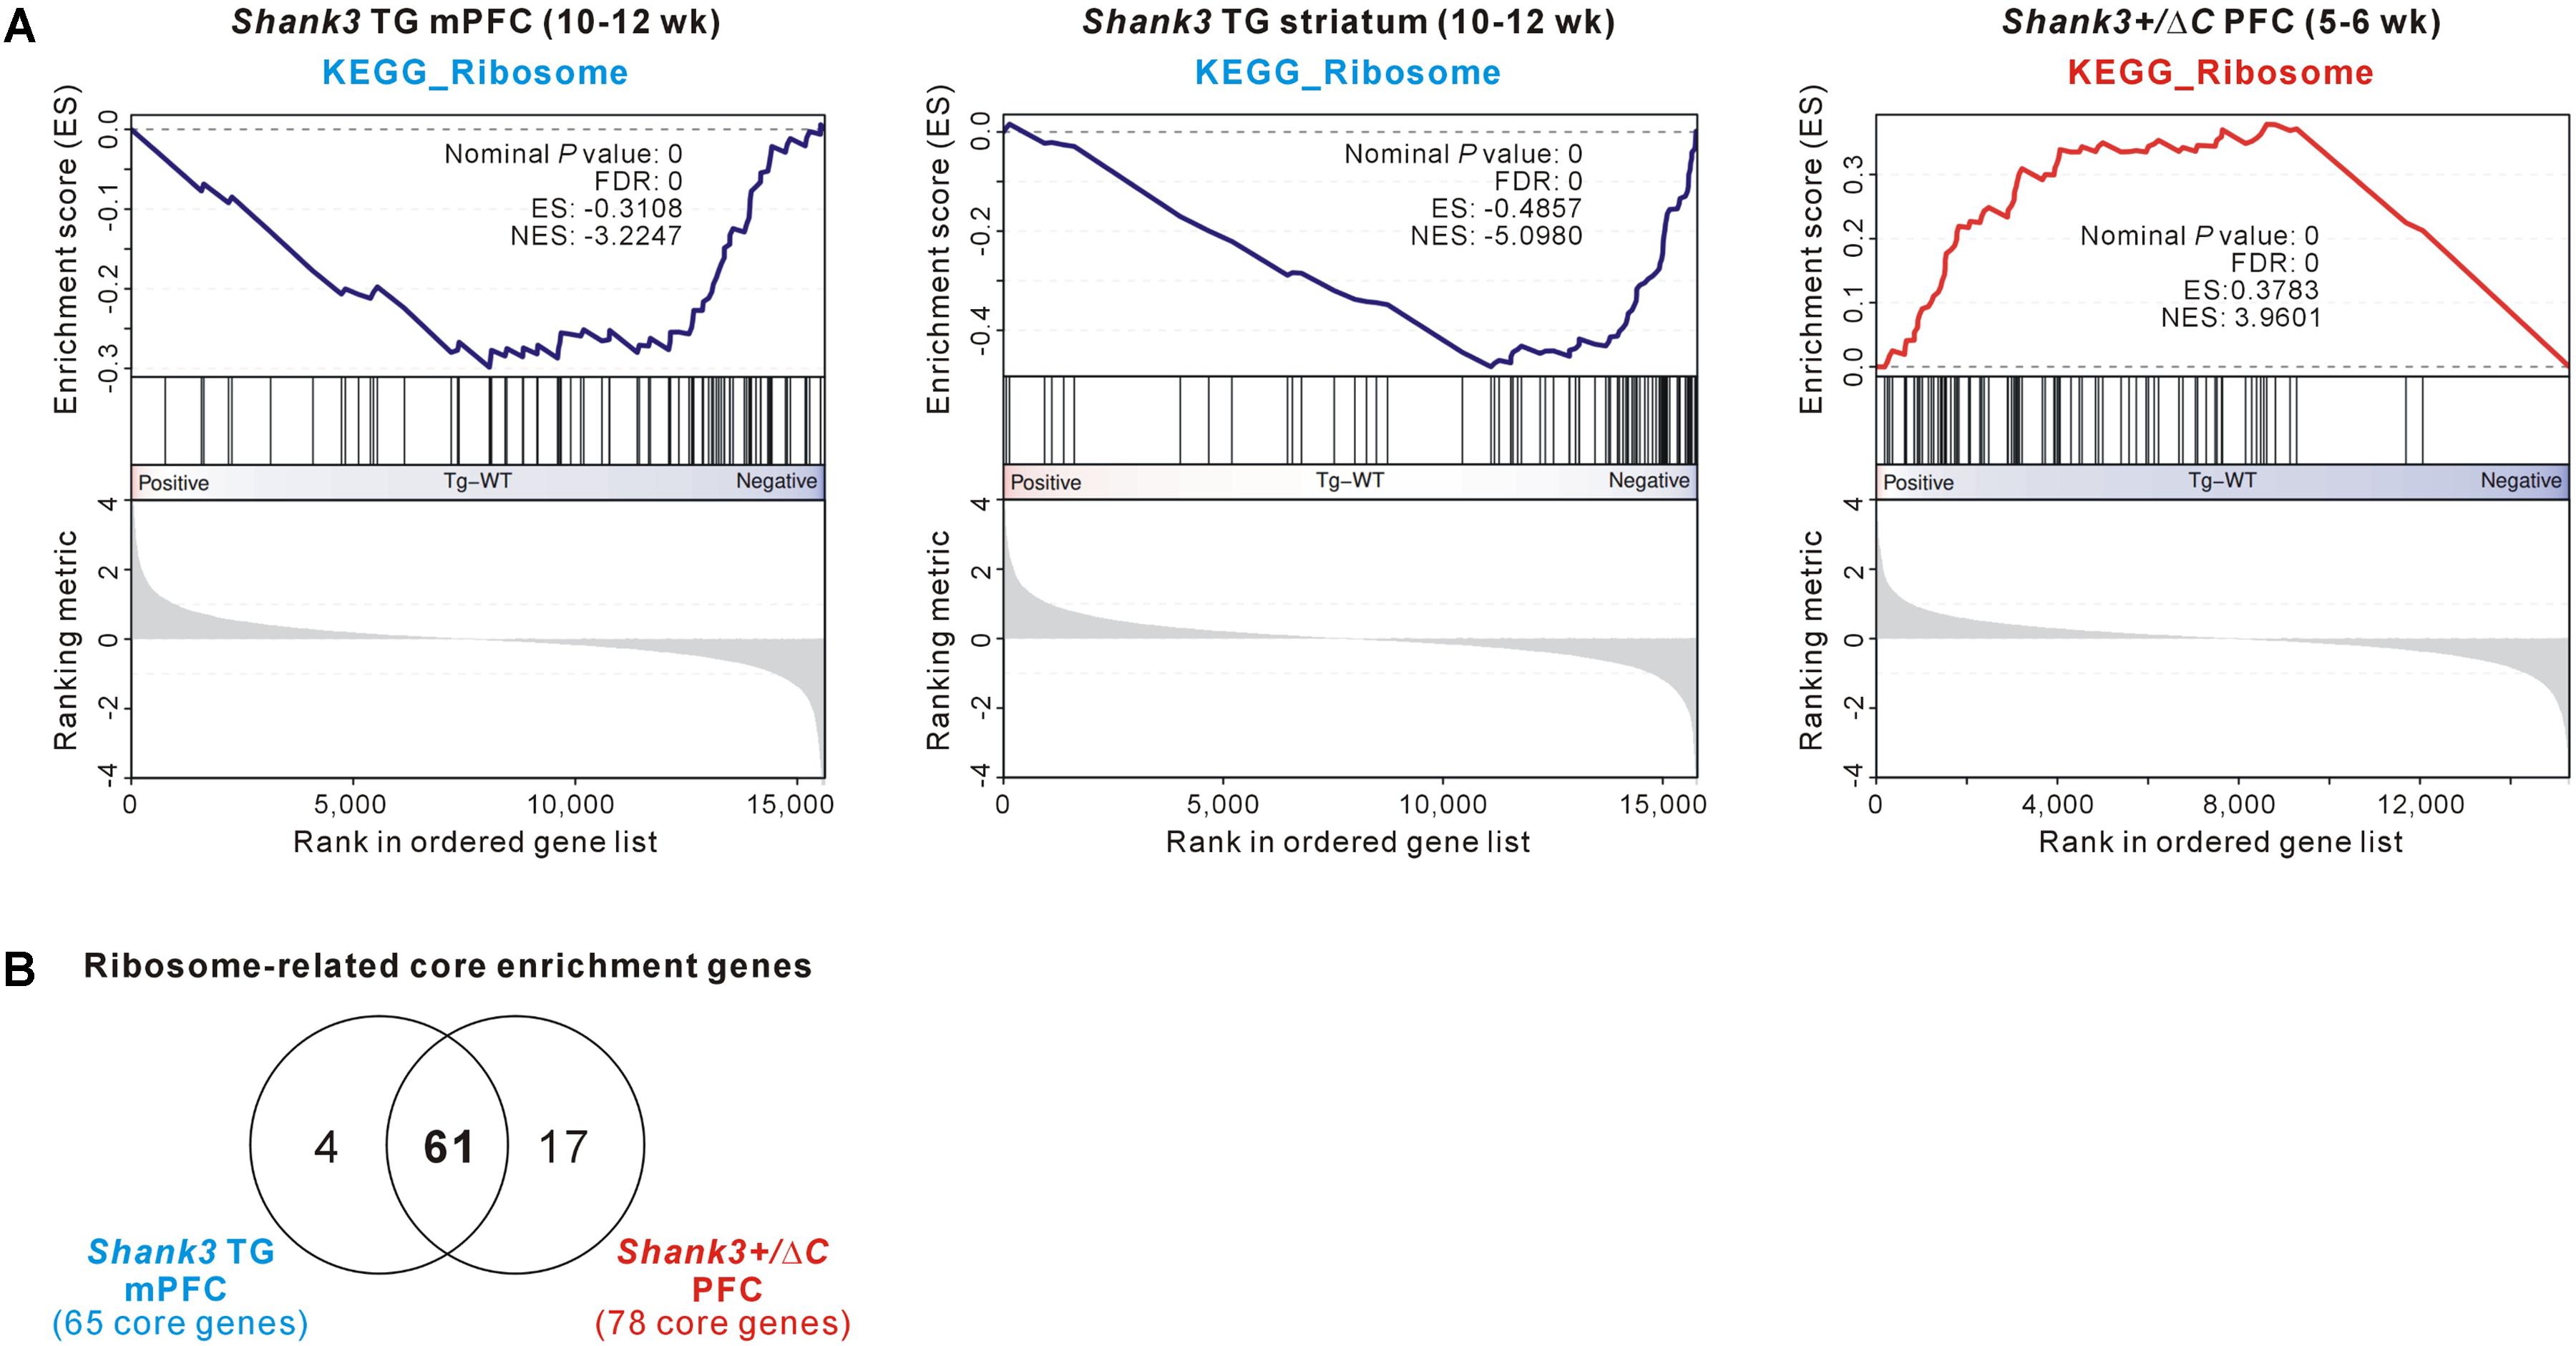
FIGURE 6. The ribosome-related molecular signature commonly detected in the Shank3 TG mPFC and striatum and Shank3+/ΔC PFC RNA-seq results. (A) The enrichment plots of RNA-seq analyses of Shank3 TG mPFC (left) and striatum (middle) and Shank3+/ΔC PFC (right) of the KEGG ribosome gene set. (B) The Venn diagram shows the number of common ribosome-related core enrichment genes between the Shank3 TG mPFC (65 downregulated core genes) and the Shank3+/ΔC PFC (78 upregulated core genes). The lists of core genes are provided in Supplementary Table S13.
Discussion
In this study, we performed RNA-seq analysis of the mPFC of Shank3 TG mice and compared the result, side by side, with the previously reported RNA-seq analyses of the striatum of Shank3 TG mice and the PFC of Shank3+/ΔC mice. We found that the expression of myelin-related genes specifically decreased in the mPFC and the expression of Gpr85 increased in multiple brain regions of Shank3 TG mice by comparing the DEGs of different RNA-seq analyses. Moreover, the GSEA results suggested that the expression of a group of ribosome-related genes could be altered in a Shank3 dosage-dependent manner, at least in the PFC regions of mice. One obvious limitation of our analysis is that we compared DEGs from the mPFC of “adult” Shank3 TG mice and from the PFC of “juvenile” Shank3+/ΔC mice. Indeed, when we compared the transcriptomes of “adult” WT mPFC and “juvenile” WT PFC (Supplementary Table S14), or “adult” TG mPFC and “juvenile” WT PFC (Supplementary Table S15), there were about 5,300 DEGs in both cases, suggesting that developmental stages largely affect gene expression profiles (note that we therefore compared Shank3-dependent DEGs normalized to the age-matched WT controls). Furthermore, considering differential Shank3 expression in brain across developmental stages (Wang et al., 2014), it is possible that DEGs of the PFC of juvenile Shank3+/ΔC mice can be different from those of adult Shank3+/ΔC mice. Therefore, further validation will be necessary to confirm that a group of ribosome-related genes of PFC are altered in a Shank3 dosage-dependent manner. In contrast, it is also possible that additional common DEGs, other than ribosome-related genes, may be identified if we compare Shank3 TG mice and Shank3+/ΔC mice of similar developmental stages.
The brain region-specific Shank3 isoform expression (Wang et al., 2014) and Shank3 interactome (Lee et al., 2017b) have been suggested to contribute to the phenotypic complexity and heterogeneity of SHANK3-associated brain disorders. It is also possible that such protein-level diversity of Shank3 might contribute to the brain region-specific changes of transcriptome in Shank3 mutant mice. For example, Shank3 proteins can undergo synapse-to-nucleus shuttling in an activity-dependent manner to regulate the expression of several genes in the nucleus (Grabrucker et al., 2014). Certain Shank3 isoforms may be more preferentially targeted to the nucleus or some Shank3 interactors may be involved in the synapse-to-nucleus shuttling of Shank3. If so, each brain region could have different levels of Shank3 proteins in the nucleus. Further investigations about Shank3-dependent gene expression and its regulation will be necessary to test this intriguing hypothesis.
It was unexpected that the mRNA levels of myelin-related genes would be altered in the mPFC of adult Shank3 TG mice. As the majority of Shank3 proteins in the brain function at the neuronal excitatory synapses, it is likely that the altered expression of myelin-related genes could be an indirect effect of Shank3 overexpression in the neurons. Indeed, it has been reported that the neuronal activity can promote oligodendrogenesis and myelination (Gibson et al., 2014; Mitew et al., 2018). However, this might not be the case for Shank3 TG mice where the neuronal activity is expected to increase (Han et al., 2013), but the expression of myelin-related genes decreases. As an alternative possibility, various types of behavioral stress, including neonatal maternal separation, chronic social isolation, and chronic social defeat, can impair myelination in rodents, mainly in the PFC regions (Liu et al., 2012; Lehmann et al., 2017; Yang et al., 2017). Moreover, increased serum levels of stress hormone corticosterone and altered hypothalamic-pituitary-adrenal (HPA) axis have been observed in human patients and animal models of mania (Daban et al., 2005; Leussis et al., 2013). Therefore, as an animal model of mania (Han et al., 2013; Lee et al., 2018), Shank3 TG mice might also have increased levels of stress hormones, which could secondarily affect the expression of myelin-related genes in the mPFC. Further validation of myelin-related phenotypes of the mPFC, together with measurements of stress hormone levels, in Shank3 TG mice could be an interesting topic of the future study.
Among the common DEGs between the mPFC and striatum of adult Shank3 TG mice, we further characterized Gpr85 and its family members Gpr27 and Gpr173. In the cortex, hippocampus, striatum, and cerebellum of adult Shank3 TG mice, the mRNA levels of Gpr85 increased, whereas those of Gpr27 and Gpr173 decreased, compared with WT mice, suggesting some compensatory changes in expression among the family members. In particular, when we treated cultured cortical neurons with picrotoxin to increase the neuronal activity and thereby possibly mimick the neurons of Shank3 TG mice, we observed an increase in Gpr85, but a decrease in Gpr27 and Gpr173, mRNA levels. Therefore, elevated neuronal activity could, at least in part, contribute to the altered expression of Gpr85, Gpr27, and Gpr173 in Shank3 TG brains. It was unexpected that, in the case of Gpr173, mRNA levels were also reduced under decreased neuronal activity by TTX treatment. Detailed transcriptional (or post-transcriptional) mechanisms underlying activity-dependent expression changes of Gpr85, Gpr27, and Gpr173 need to be further investigated.
Beyond their relationship at the level of transcriptional regulation, we further investigated the functional interaction between Shank3 and GPR85 at neuronal excitatory synapses, based on the recently reported protein–protein interactions between PSD-95 and GPR85 (Fujita-Jimbo et al., 2015). Indeed, GPR85 proteins were found to be co-localized with PSD-95 and Shank3 along the neuronal dendrites, suggesting that increased GPR85 in Shank3 TG neurons could be targeted to the excitatory synapses. To replicate this condition, we overexpressed GPR85 in cultured hippocampal neurons and found that GPR85 significantly decreased the number of excitatory synapses. Even GPR85 proteins without the C-terminal four residues or those harboring an ASD-associated variant (M152T) were nonetheless found to decrease excitatory synapses in cultured neurons, suggesting that these mutant proteins may still exert their negative effect at excitatory synapses. It is not uncommon that PSD-95-interacting proteins negatively regulate excitatory synaptic development and function. For example, Neph2/Kirrel3, an adhesion molecule interacting with PSD-95, negatively regulates excitatory synaptic transmission in the dentate granule neurons of the hippocampus (Choi et al., 2015a; Roh et al., 2017). Although the detailed underlying mechanisms need to be further investigated, we speculate that an activity-dependent increase of Gpr85 expression, together with its negative regulation of excitatory synapses, could represent a homeostatic response in Shank3 TG neurons. In the original paper describing the Shank3 TG mice (Han et al., 2013), we found increased excitatory synapse number in TG neurons compared with WT neurons. We speculate that Shank3 overexpression in TG neurons increases excitatory synapse number, which in turn elevates neuronal activity to induce Gpr85 mRNA expression. GPR85 proteins in Shank3 TG neurons may have negative effects on excitatory synapse number, but its expression level may not be enough to fully normalize synapse number to the WT level. Meanwhile, in our GPR85 overexpression experiment, we could observe decreased synapse number because we overexpressed GPR85 very high level for a long period (2 weeks). Considering the associations of GPR85/SREB2 with ASDs and SCZ (Matsumoto et al., 2008; Chen et al., 2012; Radulescu et al., 2013; Fujita-Jimbo et al., 2015), more investigations about the functional relationship between Shank3 and GPR85 would provide information on the detailed mechanisms of activity-dependent synaptic regulation and their potential implications in multiple brain disorders.
To identify meaningful molecular signatures based on broader expression changes, instead of the DEGs, we performed a GSEA of the RNA-seq results, which revealed some commonly enriched terms among the Shank3 TG mPFC and striatum and the Shank3+/ΔC PFC. Notably, ribosome-related genes were downregulated in the Shank3 TG mPFC and striatum but upregulated in the Shank3+/ΔC PFC, suggesting that those genes could be altered in a Shank3 dosage-dependent manner. Indeed, when we compared the ribosome-related core enrichment genes of the Shank3 TG mPFC and the Shank3+/ΔC PFC, most were shared and showed the opposite directional changes in expression in the two mice. Although it is not currently easy to explain how the level of Shank3 proteins affects the expression of a group of ribosome-related genes, changes in mTORC1 signaling, which regulates ribosome biogenesis and function (Jastrzebski et al., 2007; Iadevaia et al., 2014), might be involved. It was found that the reduced Shank3 expression decreased mTORC1 activity by increasing steady-state levels of Cdc2-like kinase 2 (CLK2) (Bidinosti et al., 2016). The CLK2 phosphorylates and activates the regulatory subunit of protein phosphatase 2A (PP2A), which in turn inhibits AKT, a positive upstream regulator of mTORC1. Moreover, we recently showed that the mTORC1 activity is decreased in the striatum of Shank3 TG mice, possibly due to the aberrant protein interactions between Shank3 and some upstream regulators of mTORC1 (Lee et al., 2017d). A comprehensive analysis of mTORC1 activity in various brain regions of Shank3 mutant mice, together with the direct measurement of ribosomal quantity (both mRNA and protein) and activity, could provide important clues regarding the detailed mechanisms behind this. In this regard, it is worth noting that in a recent quantitative proteomic analysis of the striatal PSD of Shank3 mutant mice (Shank3Δ11−/−), the levels of several ribosomal proteins were increased compared with WT mice (Reim et al., 2017). Shank3 proteins are coupled with metabotropic glutamate receptors (mGluRs) via Homer (Tu et al., 1999) and regulate their synaptic expression and signaling (Verpelli et al., 2011; Vicidomini et al., 2016; Wang et al., 2016). mGluR signaling is a key regulator of synaptic local translation (Waung and Huber, 2009; Luscher and Huber, 2010). Therefore, abnormal mGluR signaling and altered levels of ribosomal proteins may together lead to changes in synaptic mRNA translation in Shank3 mutant mice, which can be an important topic of the future study.
Conclusion
In conclusion, using unbiased transcriptome analyses, our study reveals both brain region-specific and broad, previously unidentified molecular changes in Shank3-overexpressing mice. These results further elucidate the complexity and heterogeneity of the molecular pathophysiology of SHANK3-associated brain disorders and also highlight the need for subsequent studies on relevant molecular pathways, which could be applied, in the long term, for the development of the better therapeutic approaches.
Author Contributions
CJ, JR, SK, YZ, YL, YK, and KH designed and performed the experiments. HK and KH analyzed and interpreted the data, and wrote the paper. All authors read and approved the manuscript.
Funding
This work was supported by the National Research Foundation of Korea (NRF) grants funded by the Korea Government Ministry of Science and ICT (NRF-2015M3C7A1028790 and NRF-2018R1C1B6001235), by the grant of the Korea Health Technology R&D Project through the Korea Health Industry Development Institute (KHIDI) funded by the Korea Government Ministry of Health and Welfare (HI16C0090), by the Korea Institute of Science and Technology Information (K-18-L12-C08-S01), and by the Korea University grant (K1800771).
Conflict of Interest Statement
The authors declare that the research was conducted in the absence of any commercial or financial relationships that could be construed as a potential conflict of interest.
Supplementary Material
The Supplementary Material for this article can be found online at: https://www.frontiersin.org/articles/10.3389/fnmol.2018.00250/full#supplementary-material
Footnotes
- ^ http://www.informatics.jax.org/homology.shtml
- ^ http://amigo.geneontology.org/amigo
- ^ http://software.broadinstitute.org/gsea
- ^ http://software.broadinstitute.org/gsea/msigdb
References
Balleine, B. W., Delgado, M. R., and Hikosaka, O. (2007). The role of the dorsal striatum in reward and decision-making. J. Neurosci. 27, 8161–8165.
Bey, A. L., Wang, X., Yan, H., Kim, N., Passman, R. L., Yang, Y., et al. (2018). Brain region-specific disruption of Shank3 in mice reveals a dissociation for cortical and striatal circuits in autism-related behaviors. Transl. Psychiatry 8:94. doi: 10.1038/s41398-018-0142-6
Bidinosti, M., Botta, P., Kruttner, S., Proenca, C. C., Stoehr, N., Bernhard, M., et al. (2016). CLK2 inhibition ameliorates autistic features associated with SHANK3 deficiency. Science 351, 1199–1203. doi: 10.1126/science.aad5487
Bozdagi, O., Tavassoli, T., and Buxbaum, J. D. (2013). Insulin-like growth factor-1 rescues synaptic and motor deficits in a mouse model of autism and developmental delay. Mol. Autism 4:9. doi: 10.1186/2040-2392-4-9
Chen, Q., Kogan, J. H., Gross, A. K., Zhou, Y., Walton, N. M., Shin, R., et al. (2012). SREB2/GPR85, a schizophrenia risk factor, negatively regulates hippocampal adult neurogenesis and neurogenesis-dependent learning and memory. Eur. J. Neurosci. 36, 2597–2608. doi: 10.1111/j.1460-9568.2012.08180.x
Choi, S.-Y., and Han, K. (2015). Emerging role of synaptic actin-regulatory pathway in the pathophysiology of mood disorders. Anim. Cells Syst. 19, 283–288.
Choi, S. Y., Han, K., Cutforth, T., Chung, W., Park, H., Lee, D., et al. (2015a). Mice lacking the synaptic adhesion molecule Neph2/Kirrel3 display moderate hyperactivity and defective novel object preference. Front. Cell. Neurosci. 9:283. doi: 10.3389/fncel.2015.00283
Choi, S. Y., Pang, K., Kim, J. Y., Ryu, J. R., Kang, H., Liu, Z., et al. (2015b). Post-transcriptional regulation of SHANK3 expression by microRNAs related to multiple neuropsychiatric disorders. Mol. Brain 8:74. doi: 10.1186/s13041-015-0165-3
Costales, J. L., and Kolevzon, A. (2015). Phelan-McDermid Syndrome and SHANK3: implications for Treatment. Neurotherapeutics 12, 620–630.
Daban, C., Vieta, E., Mackin, P., and Young, A. H. (2005). Hypothalamic-pituitary-adrenal axis and bipolar disorder. Psychiatr. Clin. North Am. 28, 469–480.
Duffney, L. J., Zhong, P., Wei, J., Matas, E., Cheng, J., Qin, L., et al. (2015). Autism-like deficits in shank3-deficient mice are rescued by targeting actin regulators. Cell Rep. 11, 1400–1413. doi: 10.1016/j.celrep.2015.04.064
Failla, P., Romano, C., Alberti, A., Vasta, A., Buono, S., Castiglia, L., et al. (2007). Schizophrenia in a patient with subtelomeric duplication of chromosome 22q. Clin. Genet. 71, 599–601.
Fujita-Jimbo, E., Tanabe, Y., Yu, Z., Kojima, K., Mori, M., Li, H., et al. (2015). The association of GPR85 with PSD-95-neuroligin complex and autism spectrum disorder: a molecular analysis. Mol. Autism 6:17. doi: 10.1186/s13229-015-0012-5
Gibson, E. M., Purger, D., Mount, C. W., Goldstein, A. K., Lin, G. L., Wood, L. S., et al. (2014). Neuronal activity promotes oligodendrogenesis and adaptive myelination in the mammalian brain. Science 344:1252304. doi: 10.1126/science.1252304
Grabrucker, A. M., Schmeisser, M. J., Schoen, M., and Boeckers, T. M. (2011). Postsynaptic ProSAP/Shank scaffolds in the cross-hair of synaptopathies. Trends Cell Biol. 21, 594–603. doi: 10.1016/j.tcb.2011.07.003
Grabrucker, S., Proepper, C., Mangus, K., Eckert, M., Chhabra, R., Schmeisser, M. J., et al. (2014). The PSD protein ProSAP2/Shank3 displays synapto-nuclear shuttling which is deregulated in a schizophrenia-associated mutation. Exp. Neurol. 253, 126–137. doi: 10.1016/j.expneurol.2013.12.015
Han, K., Holder, J. L. Jr., Schaaf, C. P., Lu, H., Chen, H., Kang, H., et al. (2013). SHANK3 overexpression causes manic-like behaviour with unique pharmacogenetic properties. Nature 503, 72–77. doi: 10.1038/nature12630
Harony-Nicolas, H., De Rubeis, S., Kolevzon, A., and Buxbaum, J. D. (2015). Phelan mcdermid syndrome: from genetic discoveries to animal models and treatment. J. Child Neurol. 30, 1861–1870. doi: 10.1177/0883073815600872
Harony-Nicolas, H., Kay, M., Hoffmann, J. D., Klein, M. E., Bozdagi-Gunal, O., Riad, M., et al. (2017). Oxytocin improves behavioral and electrophysiological deficits in a novel Shank3-deficient rat. eLife 6:e18904. doi: 10.7554/eLife.18904
Huang da, W., Sherman, B. T., and Lempicki, R. A. (2009). Systematic and integrative analysis of large gene lists using DAVID bioinformatics resources. Nature Protoc. 4, 44–57. doi: 10.1038/nprot.2008.211
Iadevaia, V., Liu, R., and Proud, C. G. (2014). mTORC1 signaling controls multiple steps in ribosome biogenesis. Semin. Cell Dev. Biol. 36, 113–120. doi: 10.1016/j.semcdb.2014.08.004
Jastrzebski, K., Hannan, K. M., Tchoubrieva, E. B., Hannan, R. D., and Pearson, R. B. (2007). Coordinate regulation of ribosome biogenesis and function by the ribosomal protein S6 kinase, a key mediator of mTOR function. Growth Fact. 25, 209–226.
Jiang, Y. H., and Ehlers, M. D. (2013). Modeling autism by SHANK gene mutations in mice. Neuron 78, 8–27. doi: 10.1016/j.neuron.2013.03.016
Kim, Y., Zhang, Y., Pang, K., Kang, H., Park, H., Lee, Y., et al. (2016). Bipolar disorder associated microRNA, miR-1908-5p, regulates the expression of genes functioning in neuronal glutamatergic synapses. Exp. Neurobiol. 25, 296–306. doi: 10.5607/en.2016.25.6.296
Lee, B., Zhang, Y., Kim, Y., Kim, S., Lee, Y., and Han, K. (2017a). Age-dependent decrease of GAD65/67 mRNAs but normal densities of GABAergic interneurons in the brain regions of Shank3-overexpressing manic mouse model. Neurosci. Lett. 649, 48–54. doi: 10.1016/j.neulet.2017.04.016
Lee, Y., Kang, H., Lee, B., Zhang, Y., Kim, Y., Kim, S., et al. (2017b). Integrative analysis of brain region-specific Shank3 interactomes for understanding the heterogeneity of neuronal pathophysiology related to SHANK3 mutations. Front. Mol. Neurosci. 10:110. doi: 10.3389/fnmol.2017.00110
Lee, Y., Kim, D., Ryu, J. R., Zhang, Y., Kim, S., Kim, Y., et al. (2017c). Phosphorylation of CYFIP2, a component of the WAVE-regulatory complex, regulates dendritic spine density and neurite outgrowth in cultured hippocampal neurons potentially by affecting the complex assembly. Neuroreport 28, 749–754. doi: 10.1097/WNR.0000000000000838
Lee, Y., Kim, S. G., Lee, B., Zhang, Y., Kim, Y., Kim, S., et al. (2017d). Striatal transcriptome and interactome analysis of Shank3-overexpressing mice reveals the connectivity between Shank3 and mTORC1 signaling. Front. Mol. Neurosci. 10:201. doi: 10.3389/fnmol.2017.00201
Lee, J., Chung, C., Ha, S., Lee, D., Kim, D. Y., Kim, H., et al. (2015). Shank3-mutant mice lacking exon 9 show altered excitation/inhibition balance, enhanced rearing, and spatial memory deficit. Front. Cell. Neurosci. 9:94. doi: 10.3389/fncel.2015.00094
Lee, Y., Zhang, Y., Kim, S., and Han, K. (2018). Excitatory and inhibitory synaptic dysfunction in mania: an emerging hypothesis from animal model studies. Exp. Mol. Med. 50:12. doi: 10.1038/s12276-018-0028-y
Lehmann, M. L., Weigel, T. K., Elkahloun, A. G., and Herkenham, M. (2017). Chronic social defeat reduces myelination in the mouse medial prefrontal cortex. Sci. Rep. 7:46548. doi: 10.1038/srep46548
Leussis, M. P., Berry-Scott, E. M., Saito, M., Jhuang, H., De Haan, G., Alkan, O., et al. (2013). The ANK3 bipolar disorder gene regulates psychiatric-related behaviors that are modulated by lithium and stress. Biol. Psychiatry 73, 683–690. doi: 10.1016/j.biopsych.2012.10.016
Liu, J., Dietz, K., Deloyht, J. M., Pedre, X., Kelkar, D., Kaur, J., et al. (2012). Impaired adult myelination in the prefrontal cortex of socially isolated mice. Nat. Neurosci. 15, 1621–1623. doi: 10.1038/nn.3263
Love, M. I., Huber, W., and Anders, S. (2014). Moderated estimation of fold change and dispersion for RNA-seq data with DESeq2. Genome Biol. 15:550.
Luscher, C., and Huber, K. M. (2010). Group 1 mGluR-dependent synaptic long-term depression: mechanisms and implications for circuitry and disease. Neuron 65, 445–459. doi: 10.1016/j.neuron.2010.01.016
Matsumoto, M., Beltaifa, S., Weickert, C. S., Herman, M. M., Hyde, T. M., Saunders, R. C., et al. (2005). A conserved mRNA expression profile of SREB2 (GPR85) in adult human, monkey, and rat forebrain. Brain Res. Mol. Brain Res. 138, 58–69.
Matsumoto, M., Saito, T., Takasaki, J., Kamohara, M., Sugimoto, T., Kobayashi, M., et al. (2000). An evolutionarily conserved G-protein coupled receptor family, SREB, expressed in the central nervous system. Biochem. Biophys. Res. Commun. 272, 576–582.
Matsumoto, M., Straub, R. E., Marenco, S., Nicodemus, K. K., Matsumoto, S., Fujikawa, A., et al. (2008). The evolutionarily conserved G protein-coupled receptor SREB2/GPR85 influences brain size, behavior, and vulnerability to schizophrenia. Proc. Natl. Acad. Sci. U.S.A. 105, 6133–6138. doi: 10.1073/pnas.0710717105
Mitew, S., Gobius, I., Fenlon, L. R., Mcdougall, S. J., Hawkes, D., Xing, Y. L., et al. (2018). Pharmacogenetic stimulation of neuronal activity increases myelination in an axon-specific manner. Nat. Commun. 9:306. doi: 10.1038/s41467-017-02719-2
Moessner, R., Marshall, C. R., Sutcliffe, J. S., Skaug, J., Pinto, D., Vincent, J., et al. (2007). Contribution of SHANK3 mutations to autism spectrum disorder. Am. J. Hum. Genet. 81, 1289–1297.
Monteiro, P., and Feng, G. (2017). SHANK proteins: roles at the synapse and in autism spectrum disorder. Nat. Rev. Neurosci. 18, 147–157. doi: 10.1038/nrn.2016.183
Naisbitt, S., Kim, E., Tu, J. C., Xiao, B., Sala, C., Valtschanoff, J., et al. (1999). Shank, a novel family of postsynaptic density proteins that binds to the NMDA receptor/PSD-95/GKAP complex and cortactin. Neuron 23, 569–582.
Patro, R., Duggal, G., Love, M. I., Irizarry, R. A., and Kingsford, C. (2017). Salmon provides fast and bias-aware quantification of transcript expression. Nat. Methods 14, 417–419. doi: 10.1038/nmeth.4197
Peca, J., Feliciano, C., Ting, J. T., Wang, W., Wells, M. F., Venkatraman, T. N., et al. (2011). Shank3 mutant mice display autistic-like behaviours and striatal dysfunction. Nature 472, 437–442. doi: 10.1038/nature09965
Qin, L., Ma, K., Wang, Z. J., Hu, Z., Matas, E., Wei, J., et al. (2018). Social deficits in Shank3-deficient mouse models of autism are rescued by histone deacetylase (HDAC) inhibition. Nat. Neurosci. 21, 564–575. doi: 10.1038/s41593-018-0110-8
Radulescu, E., Sambataro, F., Mattay, V. S., Callicott, J. H., Straub, R. E., Matsumoto, M., et al. (2013). Effect of schizophrenia risk-associated alleles in SREB2 (GPR85) on functional MRI phenotypes in healthy volunteers. Neuropsychopharmacology 38, 341–349. doi: 10.1038/npp.2012.184
Reim, D., Distler, U., Halbedl, S., Verpelli, C., Sala, C., Bockmann, J., et al. (2017). Proteomic analysis of post-synaptic density fractions from Shank3 mutant mice reveals brain region specific changes relevant to autism spectrum disorder. Front. Mol. Neurosci. 10:26. doi: 10.3389/fnmol.2017.00026
Riga, D., Matos, M. R., Glas, A., Smit, A. B., Spijker, S., and Van Den Oever, M. C. (2014). Optogenetic dissection of medial prefrontal cortex circuitry. Front. Syst. Neurosci. 8:230. doi: 10.3389/fnsys.2014.00230
Roh, J. D., Choi, S. Y., Cho, Y. S., Choi, T. Y., Park, J. S., Cutforth, T., et al. (2017). Increased excitatory synaptic transmission of dentate granule neurons in mice lacking PSD-95-interacting adhesion molecule Neph2/Kirrel3 during the early postnatal period. Front. Mol. Neurosci. 10:81. doi: 10.3389/fnmol.2017.00081
Russo, S. J., and Nestler, E. J. (2013). The brain reward circuitry in mood disorders. Nat. Rev. Neurosci. 14, 609–625. doi: 10.1038/nrn3381
Schmeisser, M. J. (2015). Translational neurobiology in Shank mutant mice–model systems for neuropsychiatric disorders. Ann. Anat. 200, 115–117. doi: 10.1016/j.aanat.2015.03.006
Shcheglovitov, A., Shcheglovitova, O., Yazawa, M., Portmann, T., Shu, R., Sebastiano, V., et al. (2013). SHANK3 and IGF1 restore synaptic deficits in neurons from 22q13 deletion syndrome patients. Nature 503, 267–271. doi: 10.1038/nature12618
Sheng, M., and Hoogenraad, C. C. (2007). The postsynaptic architecture of excitatory synapses: a more quantitative view. Annu. Rev. Biochem. 76, 823–847.
Sheng, M., and Kim, E. (2000). The Shank family of scaffold proteins. J. Cell Sci. 113(Pt 11), 1851–1856.
Sheng, M., and Kim, E. (2011). The postsynaptic organization of synapses. Cold Spring Harb. Perspect. Biol. 3:a005678. doi: 10.1101/cshperspect.a005678
Soneson, C., Love, M. I., and Robinson, M. D. (2015). Differential analyses for RNA-seq: transcript-level estimates improve gene-level inferences. F1000Res. 4:1521. doi: 10.12688/f1000research.7563.2
Subramanian, A., Tamayo, P., Mootha, V. K., Mukherjee, S., Ebert, B. L., Gillette, M. A., et al. (2005). Gene set enrichment analysis: a knowledge-based approach for interpreting genome-wide expression profiles. Proc. Natl. Acad. Sci. U.S.A. 102, 15545–15550.
Tu, J. C., Xiao, B., Naisbitt, S., Yuan, J. P., Petralia, R. S., Brakeman, P., et al. (1999). Coupling of mGluR/Homer and PSD-95 complexes by the Shank family of postsynaptic density proteins. Neuron 23, 583–592.
Verpelli, C., Dvoretskova, E., Vicidomini, C., Rossi, F., Chiappalone, M., Schoen, M., et al. (2011). Importance of Shank3 protein in regulating metabotropic glutamate receptor 5 (mGluR5) expression and signaling at synapses. J. Biol. Chem. 286, 34839–34850. doi: 10.1074/jbc.M111.258384
Vicidomini, C., Ponzoni, L., Lim, D., Schmeisser, M. J., Reim, D., Morello, N., et al. (2016). Pharmacological enhancement of mGlu5 receptors rescues behavioral deficits in SHANK3 knock-out mice. Mol. Psychiatry 22, 689–702. doi: 10.1038/mp.2016.30
Wang, X., Bey, A. L., Katz, B. M., Badea, A., Kim, N., David, L. K., et al. (2016). Altered mGluR5-Homer scaffolds and corticostriatal connectivity in a Shank3 complete knockout model of autism. Nat. Commun. 7:11459. doi: 10.1038/ncomms11459
Wang, X., Xu, Q., Bey, A. L., Lee, Y., and Jiang, Y. H. (2014). Transcriptional and functional complexity of Shank3 provides a molecular framework to understand the phenotypic heterogeneity of SHANK3 causing autism and Shank3 mutant mice. Mol. Autism 5:30. doi: 10.1186/2040-2392-5-30
Waung, M. W., and Huber, K. M. (2009). Protein translation in synaptic plasticity: mGluR-LTD, Fragile X. Curr. Opin. Neurobiol. 19, 319–326. doi: 10.1016/j.conb.2009.03.011
Wilson, H. L., Wong, A. C., Shaw, S. R., Tse, W. Y., Stapleton, G. A., Phelan, M. C., et al. (2003). Molecular characterisation of the 22q13 deletion syndrome supports the role of haploinsufficiency of SHANK3/PROSAP2 in the major neurological symptoms. J. Med. Genet. 40, 575–584.
Yang, Y., Cheng, Z., Tang, H., Jiao, H., Sun, X., Cui, Q., et al. (2017). Neonatal maternal separation impairs prefrontal cortical myelination and cognitive functions in rats through activation of Wnt signaling. Cereb. Cortex 27, 2871–2884. doi: 10.1093/cercor/bhw121
Yoo, J., Bakes, J., Bradley, C., Collingridge, G. L., and Kaang, B. K. (2014). Shank mutant mice as an animal model of autism. Philos. Trans. R. Soc. Lond. B Biol. Sci. 369:20130143. doi: 10.1098/rstb.2013.0143
Keywords: Shank3, mPFC, striatum, transcriptome, myelin, GPR85, ribosome
Citation: Jin C, Kang H, Ryu JR, Kim S, Zhang Y, Lee Y, Kim Y and Han K (2018) Integrative Brain Transcriptome Analysis Reveals Region-Specific and Broad Molecular Changes in Shank3-Overexpressing Mice. Front. Mol. Neurosci. 11:250. doi: 10.3389/fnmol.2018.00250
Received: 26 April 2018; Accepted: 02 July 2018;
Published: 31 August 2018.
Edited by:
Deepak Prakash Srivastava, King’s College London, United KingdomReviewed by:
Carlo Sala, Istituto di Neuroscienze (IN), ItalyMichael Schön, Universität Ulm, Germany
Copyright © 2018 Jin, Kang, Ryu, Kim, Zhang, Lee, Kim and Han. This is an open-access article distributed under the terms of the Creative Commons Attribution License (CC BY). The use, distribution or reproduction in other forums is permitted, provided the original author(s) and the copyright owner(s) are credited and that the original publication in this journal is cited, in accordance with accepted academic practice. No use, distribution or reproduction is permitted which does not comply with these terms.
*Correspondence: Kihoon Han, neurohan@korea.ac.kr
†These authors have contributed equally to this work