Chaotic desynchronization as the therapeutic mechanism of deep brain stimulation
- 1 Department of Biology, University of Texas at San Antonio, San Antonio, TX, USA
- 2 School of Physics and Astronomy, University of Minnesota, Minneapolis, MN, USA
- 3 Department of Biomedical Engineering, University of Minnesota, Minneapolis, MN, USA
High frequency deep-brain stimulation of the subthalamic nucleus (deep brain stimulation, DBS) relieves many of the symptoms of Parkinson’s disease in humans and animal models. Although the treatment has seen widespread use, its therapeutic mechanism remains paradoxical. The subthalamic nucleus is excitatory, so its stimulation at rates higher than its normal firing rate should worsen the disease by increasing subthalamic excitation of the globus pallidus. The therapeutic effectiveness of DBS is also frequency and intensity sensitive, and the stimulation must be periodic; aperiodic stimulation at the same mean rate is ineffective. These requirements are not adequately explained by existing models, whether based on firing rate changes or on reduced bursting. Here we report modeling studies suggesting that high frequency periodic excitation of the subthalamic nucleus may act by desynchronizing the firing of neurons in the globus pallidus, rather than by changing the firing rate or pattern of individual cells. Globus pallidus neurons are normally desynchronized, but their activity becomes correlated in Parkinson’s disease. Periodic stimulation may induce chaotic desynchronization by interacting with the intrinsic oscillatory mechanism of globus pallidus neurons. Our modeling results suggest a mechanism of action of DBS and a pathophysiology of Parkinsonism in which synchrony, rather than firing rate, is the critical pathological feature.
Introduction
The motor symptoms of Parkinson’s disease have long been attributed to increased firing rates of neurons in the globus pallidus, which then are thought to inhibit thalamic neurons relaying signals to the motor cortex (for reviews see Albin et al., 1989; Wichmann and DeLong, 1996). An alternative explanation is based on the observation that pallidal and subthalamic neurons in animal models of the disease exhibit low frequency rhythmic bursting not normally present (e.g., Bergman et al., 1994; Raz et al., 2000). Bursting occurs near the tremor frequency (7–10 Hz), and the normally uncorrelated firing across cells becomes synchronized at about twice that frequency (Nini et al., 1995). Local field potentials show a large increase in power in the beta band (the frequency of synchrony; Dostrovsky and Bergman, 2004; Gatev et al., 2006; Brown, 2007). If the change in firing pattern, and not rate, causes the symptoms of Parkinson’s disease, then the beneficial effects (e.g., Wichmann and DeLong, 2006) of deep brain stimulation (DBS) may act by disrupting the pathological pattern, either the low frequency bursting, or the synchronous firing, or both (Rubin and Terman, 2004; Guo et al., 2008; Dorval et al., 2010; Schiff, 2010). A computational model has been proposed for the oscillations and the therapeutic mechanism of DBS (Rubin and Terman, 2004; Guo et al., 2008). It assumes that DBS entrains the globus pallidus cells, increasing synchrony but abolishing beta oscillations. This is thought to regularize pallidothalamic inhibition and allow blocked signals to traverse the thalamus to the motor cortex. In this model, any stimulus that can entrain the globus pallidus at rates faster than the burst frequency, and thereby suppress the low frequency oscillations that engage the intrinsic resonance of the thalamus, should abolish the symptoms. It does not directly address the mechanism of frequency specificity of the stimulus. Furthermore, it has recently been shown that the effectiveness of DBS depends on the periodicity of the stimulation (Dorval et al., 2010); Poisson patterns of stimulation at the same mean frequency were much less effective. This suggests that the effectiveness of DBS may depend on some dynamic process unique to periodically driven systems.
Here we present an alternative hypothesis, that DBS does not entrain the neurons but instead disrupts population synchrony. Basal ganglia output neurons are autonomous oscillators that fire rhythmically when isolated from synaptic inputs (Atherton and Bevan, 2005; Kita et al., 2005). Periodically driven oscillators, including neurons, exhibit several different patterns of synchrony depending on stimulus intensity and frequency: phase-shifting, phase locking, and chaos (e.g., Glass and Mackey, 1988; Elbert et al., 1994; Kaplan et al., 1996). During stimulus driven phase locking, the trajectories of cells that are out of phase with each other will converge, and synchrony of the network will increase. However, when the periodic stimulus evokes a chaotic response, nearby trajectories diverge, and the oscillators are actively desynchronized.
Materials and Methods
Construction of Deterministic Phase Maps
When a periodically firing neuron is perturbed by an injected (or synaptic) current, it may alter the neuron’s phase, making it fire earlier or later than it would have otherwise. The degree to which a stimulus may alter the timing of the next action potential depends upon the phase in the cell’s oscillation at which it is applied. By stimulating the neuron at different phases and measuring the resulting change in spike timing, a phase-resetting curve (PRC) can be calculated (for review see Gutkin et al., 2005). For a neuron firing with period Tc and being stimulated by a periodic stimulus with period Ts the relative timing between the stimulus and the neuron’s action potential tsi + 1, can be calculated from the timing of the previous stimulus tsi using a map. Notation used is indicated in Figure 1. The change in interspike interval (ISI) Δt caused by the stimulus is determined by the cell’s PRC. By dividing the time of the stimulus relative to the previous action potential by the cell’s period we can determine its phase. The stimulus phase on the next cycle can be calculated as:
in which the PRC is scaled by the size and sign of the stimulus, ms. For our purposes, all phases were defined relative to the cell’s period Tc. By substituting ɸi = tsi/Tc the map of stimulus phase relative to action potential firing can be rewritten as:
A similar approach is taken when we need to calculate the timing of action potentials relative to the stimulus, for example in calculating the peristimulus histogram.
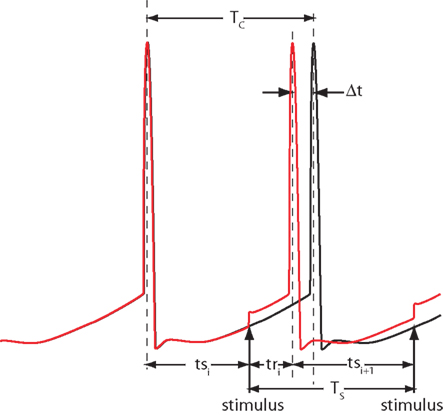
Figure 1. Notation. Two trajectories of a spontaneously active neuron firing with period Tc are shown, one unperturbed (black) and one perturbed by the stimulus presented at period Ts. The phase-dependent change in the period caused by the stimulus is Δt. Stimulation latencies relative to cell firing are indicated by ts, and response latencies relative to the stimulus are labeled tr.
We used a PRC shape measured from a simplified conductance-based model of the basal ganglia output cells that we based on data from Atherton and Bevan (2005). It consisted of a low threshold persistent sodium current, a fast sodium action potential current, a high-threshold spike repolarization potassium current, a high-threshold calcium current, calcium pump, and a calcium-dependent potassium current. The model is not an accurate representation of all the firing patterns reported for the substantia nigra pars reticulata neuron, but did reproduce the basic pattern of spontaneous activity. Its PRC was similar to that reported for a more complex model of the cells of the external segment of globus pallidus (whose firing patterns are similar) by Schultheiss et al. (2010). The specific PRC used was:
At high stimulus intensities, the PRC approaches a causal limit, corresponding to immediate firing in response to the stimulus. This limit, the resetting line, has a slope of −1. For large stimuli, the PRC is partly absorbed into the phase resetting line. This was incorporated into the definition of the PRC used here.
The behavior of the neuron in response to periodic inputs can take on three different forms, entrainment, quasiperiodicity, or chaos. When entrained to the stimulus, cells receiving the stimulus will converge in phase. In quasiperiodicity, their patterns of activity are complex but two neurons starting at nearly the same phase will on average retain their phase difference. Chaotic activity is aperiodic and two neurons starting at nearly the same phase will rapidly diverge in the timing of their firing. To characterize the three patterns of response, we calculated the Lyapunov exponent of the response. This was done by calculating the phases repeatedly from an arbitrary starting point. After 500 initial iterations, the map was iterated an additional 10,000 times. At each of these, the slope of the map was calculated at the new phase point, and the log of the absolute value of the slope at visited phase points was averaged across the 10,000 cycles.
Construction of the Stochastic Phase Map
The PRC represents an idealized version of the response of a repetitively firing neuron to stimulation. The most significant simplification is that it ignores the variability in the cell’s ISI. The neuron’s spike times can vary from interval to interval due to unaccounted-for external inputs or intrinsic noise in the neuron’s membrane. Noise produces many small phase perturbations during each ISI. When a neuron receives multiple stimuli during a single ISI, the phase is shifted after each one, causing phase to become decoupled from time. This “latent phase” (Winfree, 2000) can only be realized when the neuron fires an action potential.
The distribution of latent phases of stimulation caused by noise can be inferred from the distribution of ISIs observed in the absence of stimulation. The effect of this uncertainty in the latent phase of the stimulus on the PRC has been described by Ermentrout et al. (2011), who also describe an approximation to the variance of the PRC as a function of mean latent phase of the stimulus. Using this approach, we represented each point in the PRC as a probability distribution of the phase change caused by an input. This probabilistic PRC was used to make a stochastic phase map that takes as input the probability distribution of neuron phases for the ith stimulus and calculates the distribution for the (i + 1)th iteration. The mean value at each phase corresponds to the deterministic phase map and the variance is altered according to the variance of the PRC at that mean phase. Phase (as a proportion of the ISI) was divided into 200 increments, and the stochastic map was instantiated as a 200 × 200 stochastic matrix. Each row in the matrix was a normal distribution with a mean equal to the mean value of the PRC at that phase, and with variance calculated as in Ermentrout et al. (2011).
The steady-state probability distribution of the stimulus phases of the neurons to periodic stimulation can be determined from the stochastic map matrix by taking the largest eigenvector, λ corresponding to the largest eigenvalue. The Lyapunov exponent is the log of the average slope of the map and can be calculated as:
in which the slope of the PRC at each phase [PRC′(ɸ)] is weighted by the probability density of neurons at that phase in the steady state.
Network Simulations
We simulated a network of neurons subjected to periodic stimulation. Each neuron was modeled as a periodic oscillator whose phase was updated according to the input amplitude and the neuron’s PRC. Each cell received input from three sources: (1) an independent noise source, (2) a common noise source, and (3) DBS stimulus. The neurons in this simulation were uncoupled from each other. The phase of each cell i was calculated as follows:
Here, ɸi is the phase of cell i at time t, Ω is the natural period of the neuron (set to 1 for all cells in this simulation), ζi(t) is the random (independent) stochastic input, and η(t) is the common stochastic input, which are dependent on the square root of the time step, Δt. The coefficients Ai and B scale the noise inputs, which are multiplied by N(0, 1), a zero-mean random variable with SD 1. Var(ɸi) is the variance of each stochastic input for unitary noise, calculated as the integral of the square of the PRCs up to the time of stimulus as:
We modeled a population of uncoupled cells receiving common stochastic input η(t) from an external brain region. The other stochastic input, ζ(t), represents independent noise inputs to the cells, including intrinsic noise and unshared synaptic inputs from nearby cells or other brain areas. The shared input was adjusted to impose a substantial correlation but not perfect synchrony among the cells in the absence of DBS stimulation. This was done so that both synchronizing and desynchronizing effects of the DBS stimulus could be readily observed. When a cell received a DBS input, we used the PRC to determine a cell’s phase shift to external inputs as:
in which the phase immediately after the stimulus  is equal to the phase immediately before the stimulus
  minus the cell’s response to the input, PRC
  Changes in the stimulus amplitude were simulated by scaling the coefficient ms. The phase-update from periodic stimulation only occurred when time t equaled the stimulus time ts. We also kept track of the resetting of each cell’s oscillation to ensure that no cell’s phase was advanced to a point prior to the stimulus time – only an immediate spike is possible in that case.
Measurement of Synchrony
We simulated 100 uncoupled cells starting with randomly distributed initial phases normalized between 0 and 1. A periodic stimulus was delivered throughout the simulation, the frequency, and strength of which was varied to examine the effect on network dynamics. The network had no spatial distribution, meaning that we stimulated all cells with equal amplitude. The frequency of stimulation ranged from 1 to 2 times the natural frequency of the cell. The relative strength of stimulation ranged from −1 to 1 (negative strengths indicating inhibition), with a peak advance of 30% of the phase at the largest stimulation strength. To determine population entrainment from the DBS, we calculated the entropy (as phase distribution) of the population as:
in which p(ɸj) is the probability of a cell being in bin j of B total bins. A high value of entropy indicates a population of cells that are evenly distributed in phase, or “splay phase,” while a low value of entropy indicates synchrony. The theoretical maximum entropy for 100 bins is approximately 4.6. We found that entropy more accurately represented the network’s synchrony than a Kuramoto order parameter (Kuramoto, 1984) because at certain stimulus frequencies the population was entrained into two clusters of neurons at exactly opposite phases. This configuration resulted in zero-synchrony measured using the Kuramoto order parameter yet a low value for entropy.
Compound Synaptic Phase-Resetting Curve for Isolated Stimuli
When stimulating a neuron at high rates, multiple stimulus inputs may occur within one ISI. While it is straightforward to predict the phase advance cause by a single input, the response to the second input must be calculated recursively. The presentation of a stimulus causes a change in the phase of the neuron that is not revealed until the neuron fires its next action potential. Therefore we refer to the phase of the neuron at the time of the second stimulus as the latent phase, as in the case of ongoing noise. Because a synaptic stimulus, unlike noise, cannot be assumed to average to zero, a statistical approach cannot be used. The cumulative phase advance must be calculated by determining the latent phase and stimulus amplitude at each time point, and summing the phase advances to all the stimuli. To implement this, we discretized time and decomposed the synaptic current into a series of discrete impulses occurring at each point in time. The latent phase assigned to each stimulus impulse was calculated from the phase of the previous stimulus and the change in latent phase it produced (Netoff et al., 2005). The resulting phase evolution was given as:
in which ɸi is latent phase of the cell at the time of the ith stimulus, ms is the stimulus magnitude and Δt is the time increment. Thus the effect of a temporally extended synaptic current arising from any sequence of synaptic inputs could be approximated by setting ms accordingly for each time point. At each time i Δt a new latent phase value was calculated, and this was repeated until the latent phase achieved a value of 1 (indicating that the cell fired). The resolution of the measurement of phase changes was set by Δt, for which we used Tc/5000. We calculated the compound (PRCsyn) by applying a stimulus sequence ms[t] starting at various time delays after the onset of an action potential. This represents the experiment in which a stimulus is presented very rarely, so that the effect of a prior stimulus is completely dissipated before the next stimulus is presented. These are the conditions used for calculating the post-stimulus histogram. The response to a single input may not accurately reflect the neuron’s response to a periodic stimulus, for which the effects of stimuli from previous cycles may accumulate. Therefore, we calculate two synaptic PRCs, one for singular stimuli and one for stimuli presented periodically.
Modeling Response of the Synaptic Response to DBS
We modeled the direct subthalamo-pallidal pathway using an excitatory synaptic current with a latency of 1 ms, an instantaneous rise, and a decay time constant of 2.5 ms, which is typical of AMPA excitation. The direct inhibitory effect of antidromic activation of globus pallidus external (GPe) segmentaxons in the subthalamic nucleus was modeled as a smaller but longer-lasting hyperpolarizing current, with a latency of 1.5 ms, and a decay time constant of 5 ms (based on the measurement by Sims et al., 2008). We selected −0.6 as the ratio of inhibition to excitation, as this produced a small net inhibitory effect at low frequencies and intensities, as described by Kita et al. (2005).
For a periodically firing neuron and a stimulus given at intervals much longer than the cell period, the relationship between the PRC and the post-stimulus histogram has been described by Gutkin et al. (2005). Their analysis requires that the stimulus does not insert extra action potentials, meaning that any one trial in the post-stimulus histogram has no more than one action potential during one firing period after the stimulus. Thus the histograms are measured for the period T, during which the cell fires once. The post-stimulus histogram is effectively a firing latency histogram. Because neurons in the subthalamo-pallidal pathway do not burst in response to single stimuli (Kita et al., 2005), it is possible to estimate the post-stimulus histogram directly from the PRC.
We treated the entire stimulus sequence starting at time ts as a single impulse stimulus for calculation of the PRCsyn. Because the stimulus is absent for times before ts, the distinction between phase and time need not be made for that period. This stimulus time measured from the most recent action potential ts and response latency tr would sum to the ISI Tc in the absence of an effective stimulus. Stimulation may change the response latency by an amount dependent on the stimulus time as calculated by the PRCsyn. We constructed the post-stimulus histogram by uniformly sampling stimulus phase ɸs, and plotting the probability of obtaining a value of ɸr.
Compound Synaptic Phase-Resetting Curve for Periodic Stimuli
During high frequency stimulation, the next stimulus may arrive before the effects of previous ones have completely dissipated. When the neuron’s response to a periodic stimulus has reached steady state, the influence of stimulus history is absorbed into a constant component. The steady-state stimulus current for an exponentially decaying input as we have used for each of the monosynaptic effects of subthalamic stimulation is given by:
in which t0 is the time of the most recent stimulus, τ is the decay time constant of synaptic current, Δ is the increment of the current on each stimulus, and F is stimulus frequency. Synaptic currents for both excitatory and inhibitory inputs (each with its own Δ and τ) were calculated using this equation, and summed. The resulting periodic input waveform was used to calculate the compound synaptic PRC. At steady state, there is a frequency-dependent constant current associated with each synaptic component, whose sum may create a constant offset in the compound PRC, equivalent to a change in the cell’s unperturbed firing rate.
Because of its longer time constant, the constant component of the current at most stimulus intensities was dominated by inhibition. This periodic form of the compound synaptic PRC was used to make a phase map. To make a stochastic map, the effect of background current noise must be incorporated. That noise acts through the cells intrinsic PRC, not the synaptic PRC.
For purposes of calculating the variance of the cyclic synaptic PRC, we assumed that the greatest phase shift produced by the stimulus occurred at the time of stimulus presentation. With this simplification, we calculate the variance of that curve in the same way as the discrete stimulation (Ermentrout et al., 2011). During the part of the ISI before the onset of the stimulus the latent phase is dispersed by the accumulation of phase shifts induced by a Gaussian noise current. The variance of the latent phase distribution at the moment just preceding the stimulus (ts) is given by
in which η is the SD of the current noise, and PRC is the cellular PRC. At the time of the stimulus, the variance is altered because trajectories at different latent phases at the moment of stimulation are shifted by different amounts. The variance immediately after the stimulus is:
in which  is the derivative of the cyclic synaptic PRC. During the remaining part of the ISI, additional phase dispersion is caused by background current noise. This component of the variance is decreased by phase advances, and increased by phase delays. The total variance for the PRCsyn is:
The stochastic map was then calculated as described previously.
Calculating the Firing Rate during Stimulation
During repetitive stimulation, stimuli shift the phase of cell firing in a phase-dependent manner and the effect of each stimulus on the rate of firing is determined by the phase at which the stimulus occurs relative to the previous action potential. The probability distribution of such phases is given by the stationary distribution of stimulus phases. The firing rate for each stimulation rate and intensity was calculated from the product of that distribution and the compound synaptic PRC, which was summed to calculate the average phase change expected from each stimulus. The reciprocal of that sum is the average fractional change in rate. Baseline firing rate was 60 Hz.
Results
The desynchronizing effect of high frequency stimulation on identical noise-free model neurons is shown in Figures 2A,B. Two conductance-based simple one-compartment model neurons that show spontaneous oscillations near the rate of globus pallidus output neurons are shown in Figure 2A. They had identical periods, and so maintained their relative phase relationship at the start of the simulation. When they were both stimulated with the same periodic high frequency train of current pulses, they did not respond identically. Because the first stimulus fell at slightly different phases of their ongoing oscillation, each cell’s phase was changed in a slightly different way. These changes were, on average, amplified over subsequent cycles of stimulation. Both cells fired irregularly during the stimulation and their phase relationship varied erratically as shown in Figure 2B. Analysis of this effect is complicated by the multidimensional nature of the conductance model and the oscillatory mechanism. A simplified representation of this model neuron can be obtained by measuring its PRC, shown in Figure 2C. In this graph the change of the cell’s ISI in response to a single brief current injection is plotted as a function of the time of stimulation after the preceding action potential. Both the change in ISI and the time of the stimulus are normalized by the unperturbed ISI to be in units of phase. Advances in phase, meaning decreases in ISI caused by the stimulus, are shown as positive. The response to a depolarizing pulse is shown. The PRC scales with stimulus strength (over a range of small stimulus intensities), and is inverted when the current pulses are hyperpolarizing. The PRC can be readily converted to a phase map, as shown in Figures 2D,E (blue line). This gives the phase of the (i + 1)th stimulus relative to the preceding action potential, as a function of the phase of the ith stimulus. It is calculated by adding the PRC to the identity line (in red), and shifting it up or down respectively according to whether the cell is firing more rapidly or more slowly than the stimulus is presented. In Figure 2D, the stimulation rate is 20% higher than the cell’s natural firing rate, so the map is shifted down, resulting in two equilibria, which are the crossings with the identity line. The stability of equilibria can be determined by the slope of the map; equilibria at crossings with negative slopes are stable. Only one of the equilibria in Figure 2D is stable, as indicated by the black dot, and so regardless of the phase of the stimulus at the start of stimulation, the cell will speed up slightly and become phase locked to the stimulus at a phase corresponding to that equilibrium. Trajectories from all starting phases will converge to this phase and become phase locked to the stimulus. The negative value of the Lyapunov exponent is indicative of entrainment to the stimulus and synchrony among stimulated neurons. In the chaotic example in Figure 2E, the stimulation rate is faster and the amplitude is not changed. There are no equilibria because the PRC does not cross the line of identity, and trajectories are complicated and do not repeat. However, some regions on the phase map are never visited by the trajectories, and some are visited often. The Lyapunov exponent measured in this case is positive, indicating that the phase relationship between two cells starting near each other in phase will diverge exponentially in time. This phase difference between the two neurons over the stimulated cycles is shown in Figure 2F. The neurons start at almost the same phase (nearly zero phase difference) and within 10 cycles, the phase difference has grown exponentially to large value indicating the neurons are no longer synchronized. For very small amplitude stimulation and non-zero difference between the frequency of the cell and stimulus, there are also no equilibria on the map, but the effect of stimulation on phases of neurons is very small, and the Lyapunov exponent is nearly zero, indicating that the cells will maintain their phase relationships on average (not shown). The effect of stimulus intensity and frequency of current pulses on synchrony as measured by the Lyapunov exponent is shown in Figure 2G. For depolarizing (excitatory) stimuli, chaotic desynchronization occurs at intermediate stimulus intensities, large enough to produce effects on cell phase but too small to entrain cells completely, and at frequencies of stimulation greater than 50% faster than the cells’ spontaneous firing rate. Hyperpolarizing (inhibitory) stimuli produce chaotic desynchronization of model neurons over a wider range of stimulus frequencies and intensities. In both cases, small changes in either frequency or intensity of the stimulation can cause a switch between synchronization (in blue) and desynchronization (in red).
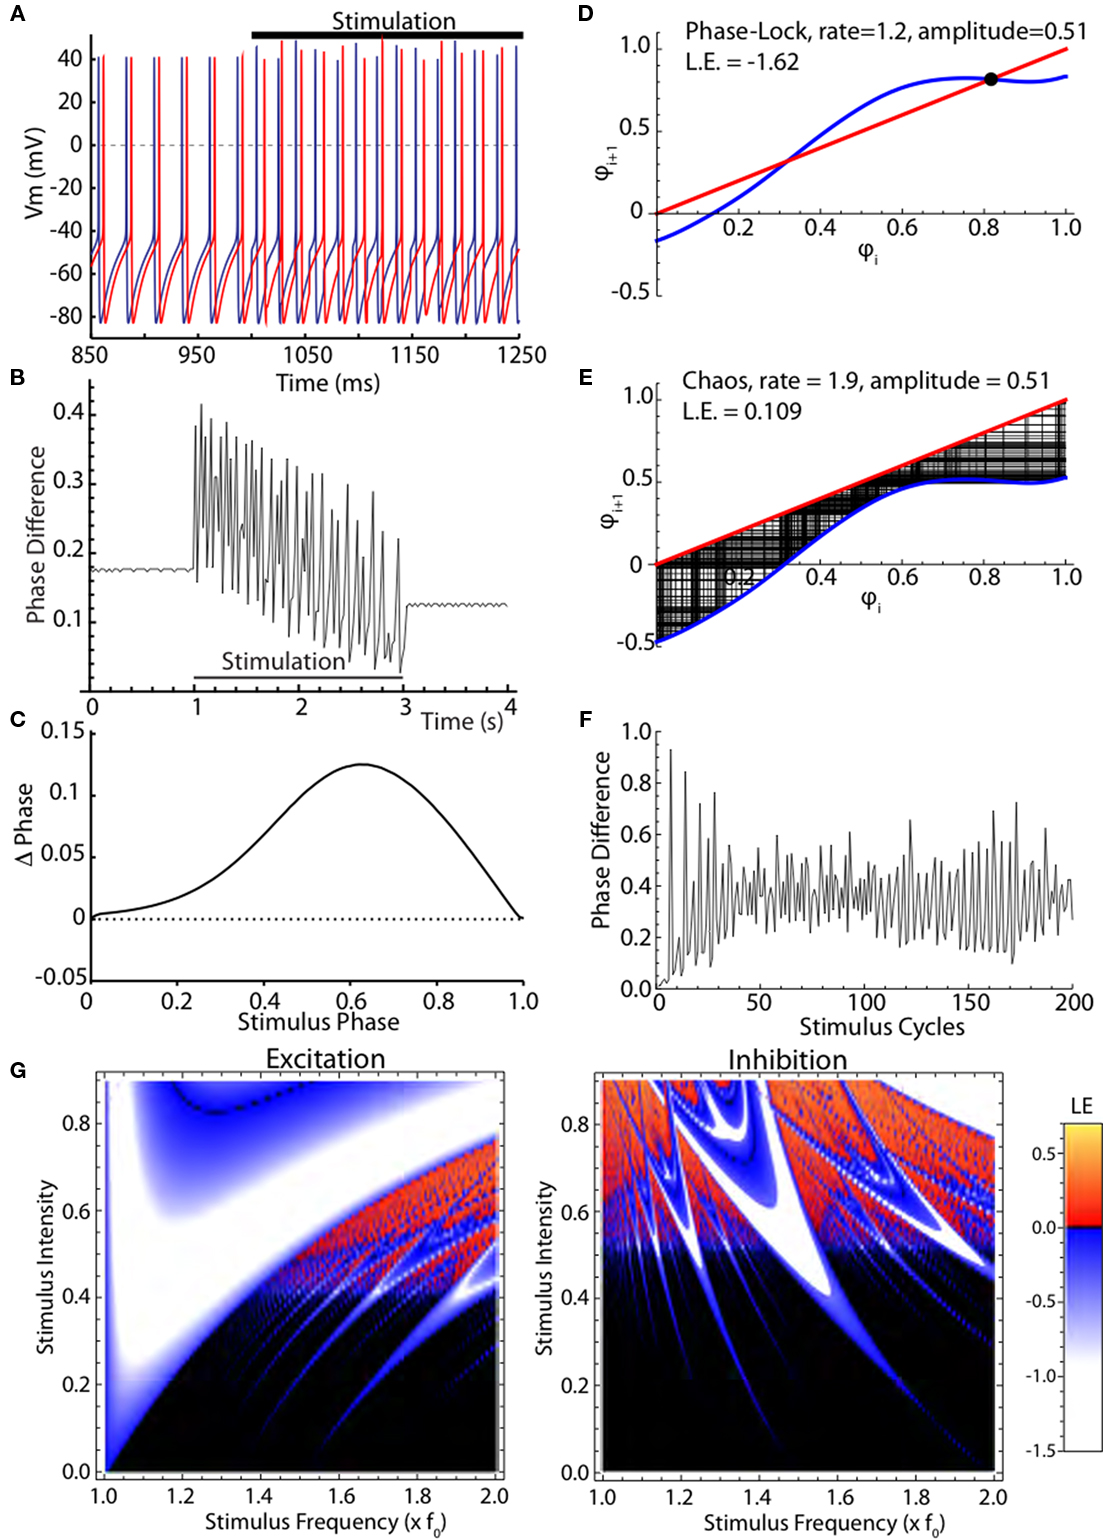
Figure 2. Chaotic desynchronization in a model neuron. (A) Two uncoupled conductance-based simulated neurons before and during stimulation with high frequency current pulses. (B) The neurons’ phase relationship is disturbed during the stimulation. (C) The phase-resetting curve (PRC), a simplification of the neuron model consisting of a phase-dependent phase shift by a current pulse. (D) Iterative phase map. The phase of the stimulus for the next stimulation is calculated from its PRC and its phase on the previous cycle. (E) Phase map for chaotic desynchronization, leading to a non-repeating non-random sequence of phases. (F) Phase differences for two initially nearby trajectories in the chaotic map. (G) Map of stimulus strength and frequency dependence of firing patterns using the Lyapunov exponent. Negative Lyapunov exponents (white to blue) indicate phase convergence and synchrony. Positive Lyapunov exponents (red to orange) indicate chaotic phase divergence. Lyapunov exponents near zero, indicating neither active synchronization nor desynchronization, are shown black. Inhibitory current pulses also produce chaotic firing and divergence of trajectories, but over a different range of rates.
Effects of Cellular Variability
Some features of the effects of stimulation shown in Figure 2 are caused by the idealized nature of the cells’ oscillation in the stochastic map. Globus pallidus neurons are not perfect oscillators; their period varies due to intrinsic noise and irregular synaptic inputs. We incorporated irregularity of the cell’s firing using a stochastic phase map, as shown in Figure 3. The variance of the PRC can be approximated from an estimate of the average variability in the absence of stimuli, and from the shape of the PRC (Ermentrout et al., 2011). An example stochastic-PRC, showing the mean effect of a current pulse on firing phase and the variance of that effect, is shown in Figure 3A. The map constructed from the stochastic PRC calculates a probability distribution of stimulus phase on the (i + 1)th stimulus presentation given a probability distribution of phase of the ith stimulus. Examples of stochastic phase maps for stimulation at the same frequency as the neuron’s spontaneous rate, or at twice that frequency are shown in Figure 3B. The steady-state probability distribution obtained after many iterations of the stochastic map can be used to calculate the Lyapunov exponent, and to determine whether the stimulus will actively synchronize the cells, desynchronize them, or have no effect on synchrony. The relationship between stimulus frequency, amplitude, and Lyapunov exponent for the stochastic model neuron is shown in Figure 3C. The result is similar to that obtained in the deterministic case, except that the fine fractal mosaic of synchronization and desynchronization is smoothed by cellular irregularity. In the region that gives rise to chaotic desynchronization, the fine dependency on tiny changes in stimulus parameters is not seen. This occurs because irregularity in the firing pattern ensures that the trajectories visit regions of the map associated with expansion and folding of trajectories required for chaotic desynchronization.
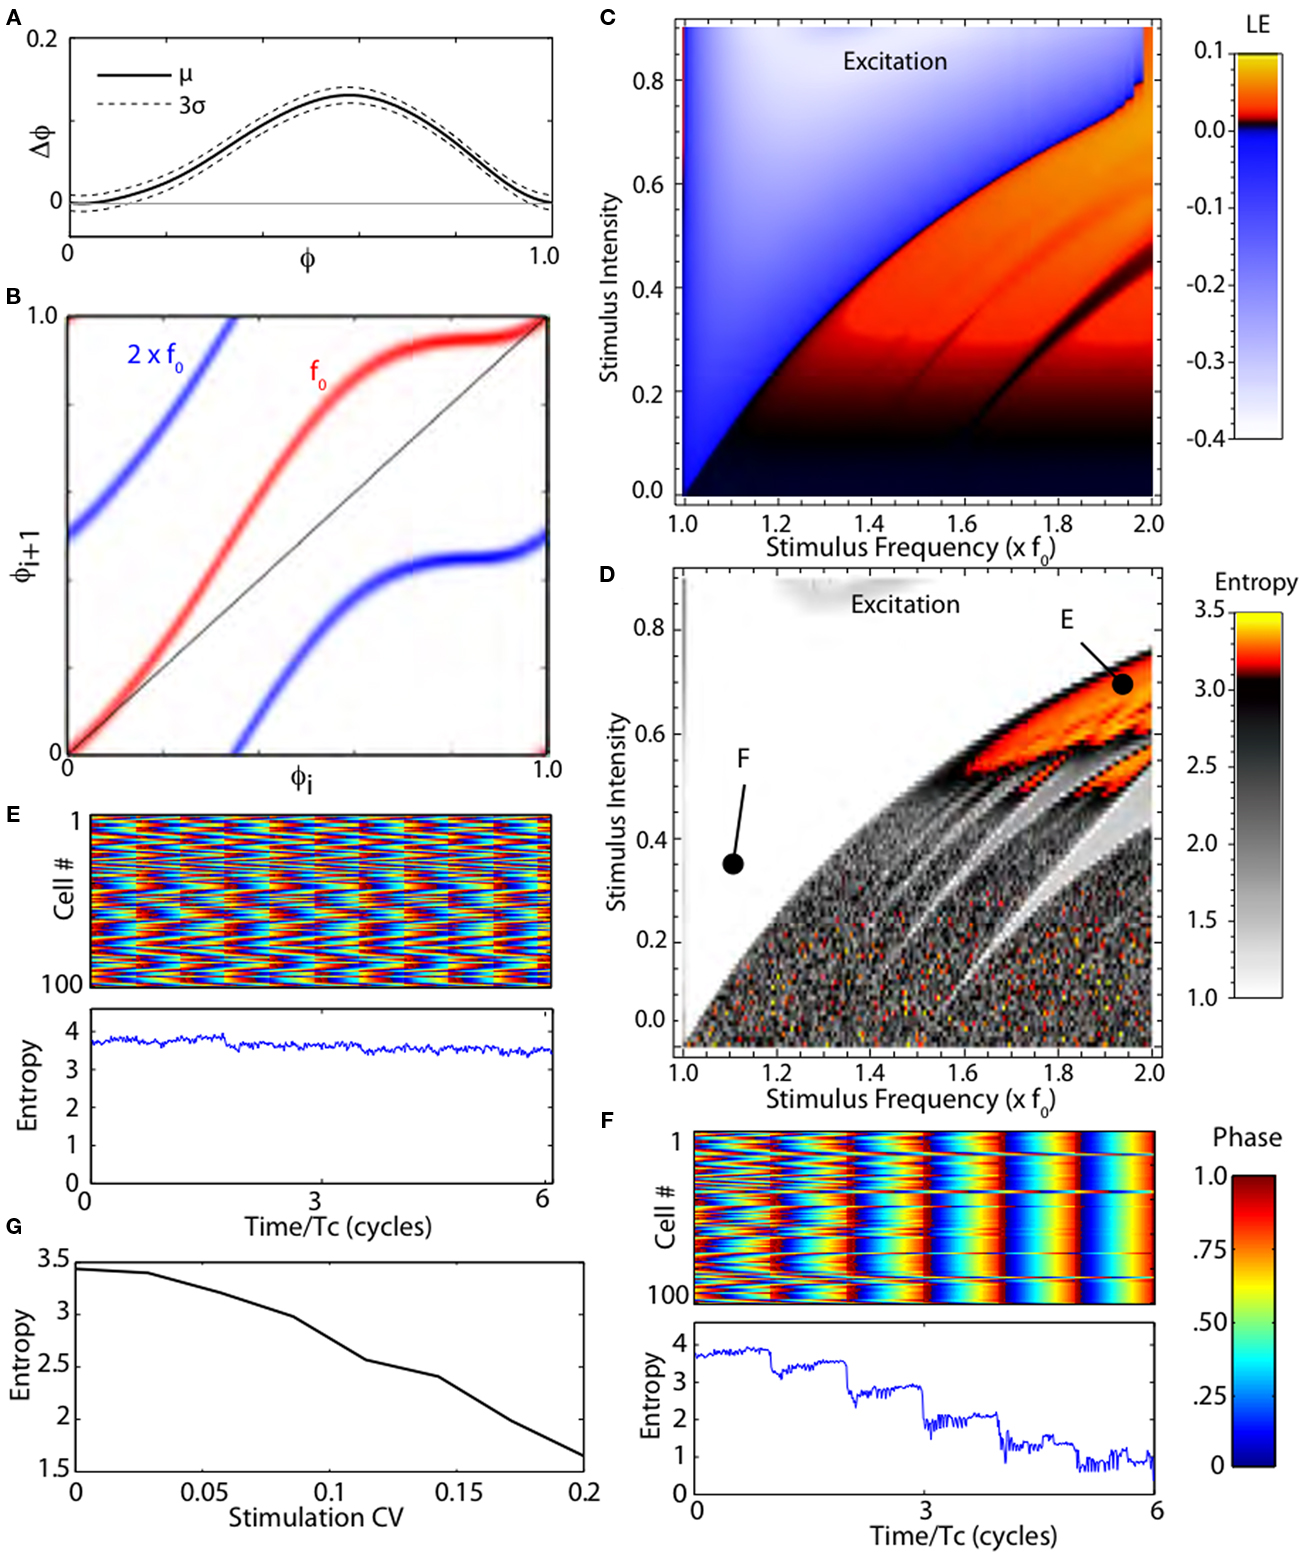
Figure 3. Stochastic phase map. (A) The phase-resetting curve for a model neuron in globus pallidus with confidence intervals. (B) Stochastic maps for periodic stimulation at two frequencies, the cell’s natural frequency (f0) and twice that. The stochastic map gives the probability distribution of stimulus phases on the next interspike interval given a distribution for the previous interval. (C) Lyapunov exponents for the stochastic map. (D) Entropy of a simulated network of 100 stochastic neurons correlated by shared random synaptic input. Periodic high frequency stimulation synchronizes (lowers entropy) or disrupts synchrony (raises entropy) as predicted by the Lyapunov exponent. (E,F) Rastergrams and entropy of a simulated network over six cycles during stimulation as indicated in (D). (G) Randomizing stimulus interval (measured by coefficient of variation) decreases the entropy of the population.
Simulations of a population of neurons synchronized by common noise input confirmed the results obtained using the Lyapunov exponents. We simulated a group of 100 neurons, each oscillating at the same unperturbed rate and having the same PRC, but receiving noisy current perturbations from two sources. One of the noise sources was common to all the cells, and so tended to synchronize them, whereas the other was independent for each neuron. In the absence of high frequency stimulation the cells stabilized with a moderate amount of synchrony, corresponding to an entropy measure of about 2.5. These models were stimulated with depolarizing or hyperpolarizing current pulses over the same range of stimulus intensities and frequencies used in Figure 3C. The steady-state effect of stimulation on synchrony was assessed using a measure of population entropy (see Materials and Methods). The results for depolarizing pulses are shown in Figure 3D. Stimulus frequencies and intensities that yielded positive Lyapunov exponents desynchronized the neurons (increased entropy), whereas those yielding negative Lyapunov exponents caused synchronization. Examples of two stimulus parameter sets are shown in Figures 3E,F.
In this model network, it was also possible to measure the importance of periodicity for the desynchronizing effect of high frequency stimulation. We varied the periodicity of the high frequency stimulation, making it increasingly less regular but maintaining its average frequency. As reported for the clinical effectiveness of DBS (Dorval et al., 2010), randomization of the high frequency current pulses caused a rapid decline in the desynchronization effect of the stimulus, as shown in Figure 3G.
Synaptic Stimulation
Subthalamic nucleus stimulation monosynaptically excites neurons in the internal segment of the globus pallidus (Kita and Kitai, 1991; Nakanishi et al., 1991) but it also recruits inhibitory connections between the pallidal segments (e.g., Kita, 1994; Kita et al., 2005). The most direct pathways recruited by subthalamic stimulation are shown in Figure 4A. Note that most of the same pathways are present and may be stimulated by electrodes in either the GPe or GPi. There are a variety of indirect pathways that may be recruited, and it is not certain which pathways are most essential for DBS (e.g., Gradinaru et al., 2009; Xu et al., 2011). The presence of both excitatory and inhibitory effects of STN stimulation are reflected in the post-stimulus changes in firing observed after single stimuli (Nambu et al., 2000; Kita et al., 2005) and during DBS (Hashimoto et al., 2003; Kita et al., 2005; McCairn and Turner, 2009). We constructed a compound synaptic current generated in the GPi neuron by the stimulus, composed of a subthalamo-pallidal EPSC with a latency of 1 ms and a pallido-pallidal IPSC evoked by the axon reflex antidromically activated from the subthalamic nucleus and inhibiting the GPi via the GPe–GPi collateral of the same axons. The inhibitory pathway had a latency of 1.5 ms. The EPSC component decayed exponentially with a time constant of 2.5 ms, and the IPSC component had a decay time constant of 5 ms (Sims et al., 2008). The IPSC had an amplitude 0.6 that of the EPSC. This ratio of inhibition to excitation was selected to produce a post-stimulus time histogram similar to that recorded by Kita et al. (2005). A typical post-stimulus time histogram for this stimulus is shown in Figure 4B.
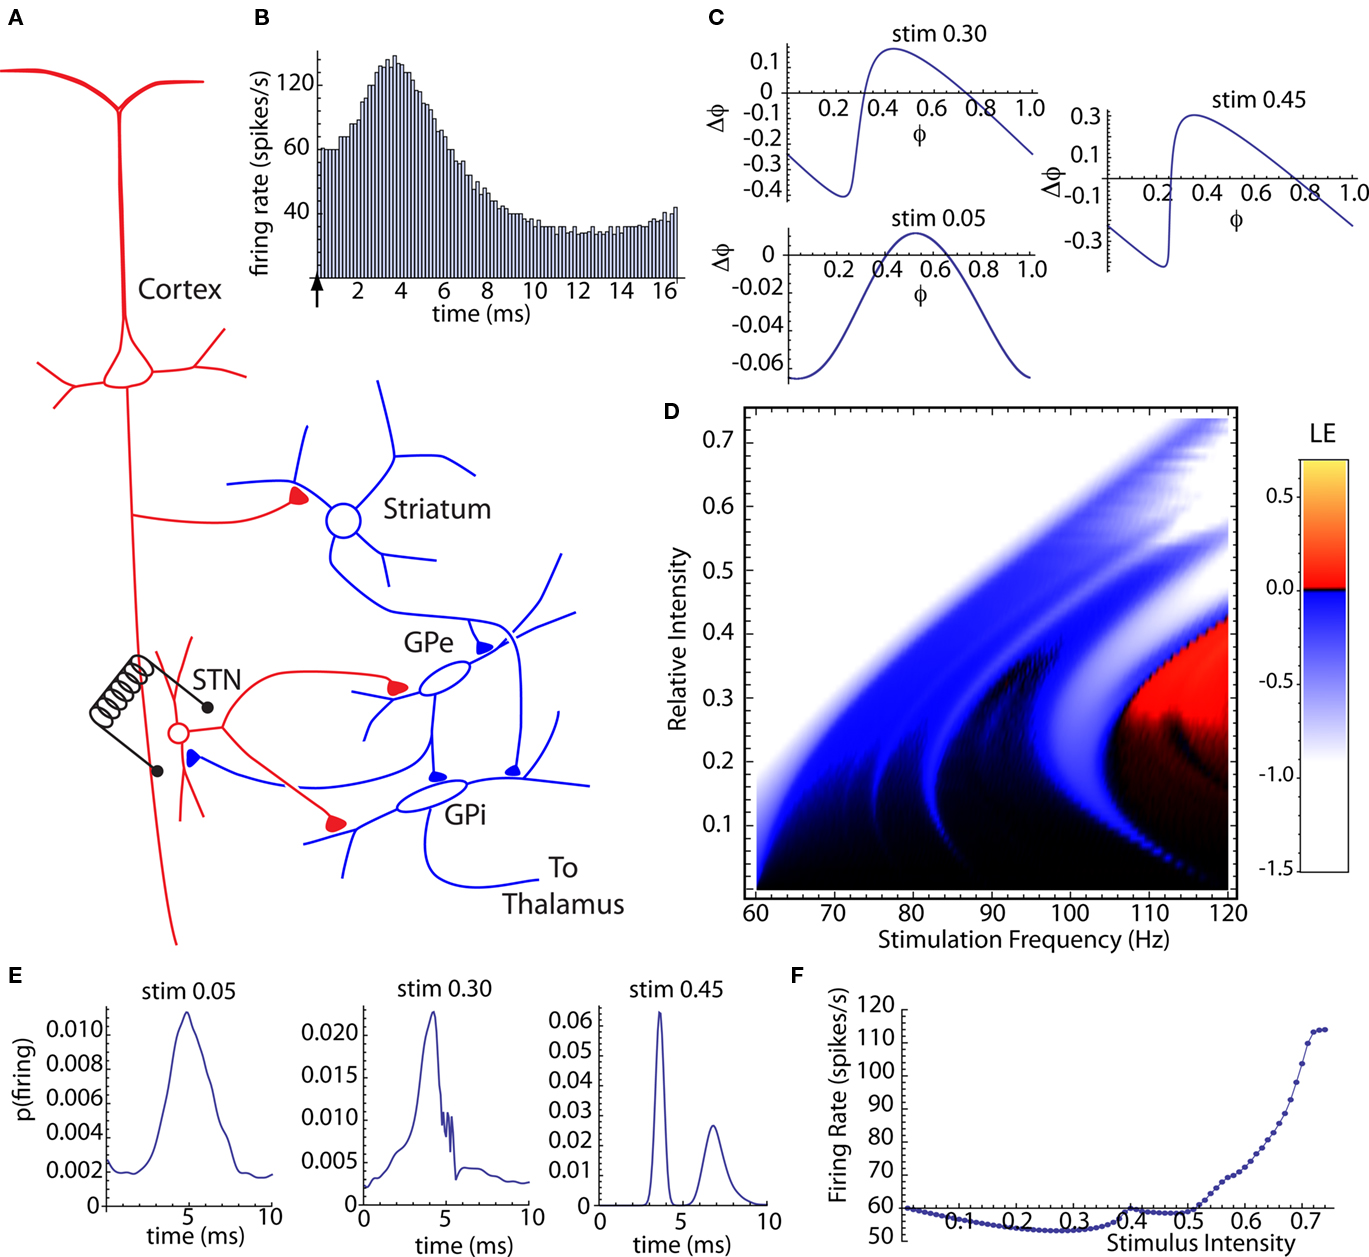
Figure 4. Compund synaptic phase-resetting curve of globus pallidus neurons for subthalamic stimulation. (A) The connections between the subthalamic nucleus and globus pallidus neurons in the internal (GPi) and external (GPe) segments. Red indicates excitation; blue is inhibition (B) Post-stimulus histogram of single stimuli with latencies of 1 ms for excitation and 1.5 ms for inhibition, and excitatory and inhibitory current time constants of 2.5 and 6.0 ms respectively. (C) Compound synaptic phase-resetting curves for three stimulus intensities. (D) Stimulus intensity and frequency map of Lyapunov exponenents for the stochastic compound subthalamo-pallidal phase map, based on a baseline firing rate of 60 spikes/s. (E) Stationary probability distributions of firing time relative to DBS stimulation at 114 Hz, for the same threestimulus intensities shown in (C). (F) Steady-state average firing rate during 114 Hz. DBS across the range of stimulus intensities.
We calculated the compound synaptic PRCs generated by this synaptic stimulus. Unlike the idealized PRCs in Figures 2 and 3, these included temporally extended responses to both excitatory and inhibitory components, and so both the shape and size of the PRC depended on stimulus strength. They also depended on the unperturbed firing rate of the cell, which was fixed at 60 Hz. Examples of the synaptic PRCs obtained at three different stimulus intensities are shown in Figure 4C. The curves are shifted in the downward (phase-retarding) direction by the influence of the inhibitory component of the synaptic stimulus, especially at low stimulus intensities. Because of its longer duration, the inhibitory synaptic current accumulated over multiple stimulation presentations. The compound synaptic PRC is a periodic function (see Materials and Methods) for repeated stimulation, and includes the cumulative effect of the steady-state periodic train of synaptic stimuli.
We then constructed a family of stochastic phase maps for the compound synaptic PRCs, and used them to calculate Lyapunov exponents over a range of stimulation intensities and frequencies as shown in Figure 4D. As before, stimulation frequencies were varied starting from the baseline firing rate of the cell and extending to twice that rate (60–120 Hz). This revealed a frequency–sensitivity for stimulus-induced desynchronization similar to that of clinically effective DBS (Rizzone et al., 2001; Chen et al., 2008). A stochastic map was also constructed for the probability of neuronal firing at various times after a DBS stimulus. The stationary distribution obtained from the map is the steady-state post-stimulus firing probability, and so should predict the post-stimulus histogram that would be obtained during DBS. These were sensitive to changes in stimulus intensity and frequency. Three examples, corresponding to the same three synaptic PRCs shown in Figure 4C, but for a stimulation frequency of 114 Hz, are shown in Figure 4E.
To examine the relationship between phase locking, chaos, and firing rate, we calculated the firing rate for the same series of intensities at 114 Hz. We did this by multiplying the stationary distribution of stimulus arrival times with the PRC, to get an average phase shift that could be converted to an average frequency change. The effect of stimulus intensity on firing rate during DBS is shown in Figure 4F. At low intensities, accumulation of the longer-lasting inhibitory synaptic current dominated, and DBS produced a decrease in firing rate, similar to that reported by Kita et al. (2005). At higher intensities, increased entrainment of the cell by the stimulus caused an increase in firing rate, as in Hashimoto et al. (2003). Our results indicate that maximal desynchronization should occur at lower intensities, even ones causing a slowing of firing rate, and not showing strong phase locking to the stimulus.
Discussion
Our model is very abstract, and does not address some of the practical aspects of DBS. For example, we do not address the shape or size of the electric field generated by the DBS stimulus, and the resulting differences in stimulation that occur across the population of STN neurons (Miocinovic et al., 2009). We also consider only the effects of the stimulus on STN and GPe cells and their processes, and not the host of other cell types whose axons are in or near the region of the stimulus (Xu et al., 2011) and may contribute to the effect of the stimulus. We have also not included rate heterogeneity of GPi neurons. Neurons with different natural frequencies would have corresponding shifts in the frequency specificity of their response to periodic stimulation. In our simulations, we used shared input as a way of creating correlated activity in basal ganglia output neurons. The true cause of correlations between output neurons in parkinsonism is not known. If their correlations were caused by synaptic coupling rather than shared input, they might be less sensitive to the desynchronizing effect of periodic stimulation. This last simplification is common to nearly all models of DBS.
The beneficial effects of DBS on the symptoms of Parkinson’s disease may not be attributable to its effects on firing rate, but rather to disruption of low frequency bursting, synchrony of firing, or both (Hashimoto et al., 2003; McCairn and Turner, 2009). Previous theoretical studies have assumed that DBS synchronizes firing in basal ganglia output neurons, emphasizing its effects on low frequency oscillations (Rubin and Terman, 2004; Guo et al., 2008). Our results do not directly address the importance of the slow oscillatory bursting, but rather the correlations among neurons. These two mechanisms of DBS are not mutually exclusive, and may be acting simultaneously. To the extent that entrained activity in the globus pallidus can prevent bursting in the thalamus, as in the Rubin and Terman (2004) model, it should still do so when the cells are not entrained, but activated asynchronously. Chaotic desynchronization might also act indirectly to disrupt bursting and other structured activity in pallidal neurons by decorrelating activity in their inputs. This mechanism may have even contributed but gone unrecognized in the simulations with the conductance-based neuron models by Rubin and Terman and others.
It is also possible that bursting could continue during DBS, but become desynchronized among neurons, as observed by McCairn and Turner (2009). Whether bursting is suppressed or only decorrelated by DBS, increased entropy across the GPi neuronal population should distribute pallidothalamic inhibition in time. This more constant pallidothalamic synaptic barrage would be less likely to engage the low frequency resonance in thalamic neurons which in the Rubin and Terman model is considered to be responsible for the parkinsonian symptoms.
If the desynchronizing effects of DBS were critical to its effectiveness, it would explain the periodicity requirement and frequency–sensitivity of DBS. Our model further predicts that increasing stimulus intensity beyond the therapeutically effective range will entrain the population and degrade effectiveness of DBS. It also explains the observations that basal ganglia output cells are not precisely entrained, but rather fire irregularly (CV ∼ 1) during DBS (Hahn et al., 2008), and that spike-wise correlations of activity in basal ganglia output neurons are suppressed rather than enhanced during DBS (Degos et al., 2005). Of course, if cells were entrained to the stimulus, their firing would be highly correlated. Our model also explains why randomization of the stimulus interval degrades clinical effectiveness (Dorval et al., 2010).
Our results suggest that inhibitory, as well as excitatory inputs, may contribute to DBS effectiveness. We suggest that effectiveness in disrupting the correlations between nearby basal ganglia output neurons may determine the effectiveness of DBS stimulation sites, intensities, and frequencies. A similar mechanism may underlie the beneficial effects of DBS on other neurological and psychiatric conditions.
Conflict of Interest Statement
The authors declare that the research was conducted in the absence of any commercial or financial relationships that could be construed as a potential conflict of interest.
Acknowledgments
Supported by NIH grant NS047085 (Charles J. Wilson), NSF CAREER 0954797 (Theoden I. Netoff), and U. Minnesota Grant-in-Aid (Bryce Beverlin II).
References
Albin, R. L., Young, A. B., and Penney, J. B. (1989). The functional anatomy of basal ganglia disorders. Trends Neurosci. 12, 366–375.
Atherton, J. F., and Bevan, M. D. (2005). Ionic mechanisms underlying autonomous action potential generation in the somata and dendrites of GABAergic substantia nigra pars reticulata neurons in vitro. J. Neurosci. 25, 8722–8781.
Bergman, H., Wichmann, T., Karmon, B., and DeLong, M. R. (1994). The primate subthalamic nucleus. II. Neuronal activity in the MPTP model of parkinsonism. J. Neurophysiol. 72, 507–520.
Brown, P. (2007). Abnormal oscillatory synchronization in the motor system leads to impaired movement. Curr. Opin. Neurobiol. 17, 656–664.
Chen, C. C., Litvak, V., Gilbertson, T., Kühn, A., Lu, C. S., Lee, S. T., Tsai, C. H., Tisch, S., Limousin, P., Hariz, M., and Brown, P. (2008). Excessive synchronization of basal ganglia neurons at 20 Hz slows movement in Parkinson’s disease. Exp. Neurol. 205, 214–221.
Degos, B., Deniau, J.-M., Thierry, A.-M., Glowinski, J., Pezard, L., and Maurice, N. (2005). Neuroleptic-induced catalepsy: electrophysiological mechanisms of functional recovery induced by high-frequency stimulation of the subthalamic nucleus. J. Neurosci. 25, 7687–7696.
Dorval, A. D., Kuncel, A. M., Birdno, M. J., Turner, D. A., and Grill, W. M. (2010). Deep brain stimulation alleviates parkinsonian bradykinesia by regularizing pallidal activity. J. Neurophysiol. 104, 911–921.
Dostrovsky, J., and Bergman, H. (2004). Oscillatory activity in the basal ganglia – relationship to normal physiology and pathophysiology. Brain 127, 721–722.
Elbert, T., Ray, W. J., Kowalik, Z. J., Skinner, J. E., Graff, K. E., and Birbaumer, N. (1994). Chaos and physiology: deterministic chaos in excitable cell assemblies. Physiol. Rev. 74, 1–47.
Ermentrout, G. B., Beverlin, B. Π, Troyer, T., and Netoff, T. I. (2011). The variance of phase-resetting curves. J. Comput. Neurosci. [Epub ahead of print].
Gatev, P., Darbin, O., and Wichmann, T. (2006). Oscillations in the basal ganglia under normal conditions and in movement disorders. Mov. Disord. 21, 1566–1577.
Glass, L., and Mackey, M. C. (1988). From Clocks to Chaos. Princeton: Princeton University Press, 248.
Gradinaru, V., Mogri, M., Thompson, K. R., Henderson, J. M., and Deisseroth, K. (2009). Optical deconstruction of parkinsonian neural circuitry. Science 324, 354–359.
Guo, Y., Rubin, J. E., McIntyre, C. C., Vitek, J. L., and Terman, D. (2008). Thalamocortical relay fidelity varies across subthalamic nucleus deep brain stimulation protocols in a data-driven computational model. J. Neurophysiol. 99, 1477–1492.
Gutkin, B. S., Ermentrout, G. B., and Reyes, A. D. (2005). Phase-response curves give the responses of neurons to transient inputs. J. Neurophysiol. 94, 1623–1635.
Hahn, P. J., Russo, G. S., Hashimoto, T., Miocinovic, S., Xu, W., McIntyre, C. C., and Vitek, J. L. (2008). Pallidal burst activity during therapeutic deep brain stimulation. Exp. Neurol. 211, 243–251.
Hashimoto, T., Elder, C. M., Okun, M. S., Patrick, S. K., and Vitek, J. L. (2003). Stimulation of the subthalamic nucleus changes the firing pattern of pallidal neurons. J. Neurosci. 23, 1916–1923.
Kaplan, D. T., Clay, J. R., Manning, T., Glass, L., Guevara, M. R., and Shrier, A. (1996). Subthreshold dynamics in periodically stimulated squid giant axons. Phys. Rev. Lett. 76, 4074–4077.
Kita, H. (1994). “Physiology of two disynaptic pathways from the sensori-motor cortex to the basal ganglia output nuclei,” in The Basal Ganglia IV: New Ideas and Data on Structure and Function, eds G. Percheron, J. S. McKenzie, and J. Féger (New York: Springer), 263–276.
Kita, H., and Kitai, S. T. (1991). Intracellular study of rat globus pallidus neurons: membrane properties and responses to neostriatal, subthalamic and nigral stimulation. Brain Res. 564, 296–305.
Kita, H., Tachibana, Y., Nambu, A., and Chiken, S. (2005). Balance of monosynaptic excitatory and disynaptic inhibitory responses of the globus pallidus induced after stimulation of the subthalamic nucleus in the monkey. J. Neurosci. 25, 8611–8619.
McCairn, K., and Turner, R. S. (2009). Deep brain stimulation of the globus pallidus internus in the parkinsonian primate: local entrainment and suppression of low-frequency oscillations. J. Neurophysiol. 101, 1941–1960.
Miocinovic, S., Lempka, S. F., Russo, G. S., Maks, C. B., Butson, C. R., Sakale, K. E., Vitek, J. L., and McIntyre, C. C. (2009). Experimental and theoretical characterization of the voltage distribution generated by deep brain stimulation. Exp. Neurol. 216, 166–176.
Nakanishi, H., Kita, H., and Kitai, S. T. (1991). Intracellular study of rat entopeduncular nucleus neurons in an in vitro slice preparation: response to subthalamic stimulation. Brain Res. 549, 285–291.
Nambu, A., Tokuno, H., Hamada, I., Kita, H., Imanishi, M., Akazawa, T., Ikeuchi, Y., and Hasegawa, N. (2000). Excitatory cortical inputs to pallidal neurons via the subthalamic nucleus in the monkey. J. Neurophysiol. 84, 289–300.
Netoff, T. I., Aker, C. D., Bettencourt, J. C., and White, J. A. (2005). Beyond two-cell networks: experimental measurement of neuronal responses to multiple synaptic inputs. J. Comput. Neurosci. 18, 287–295.
Nini, A., Feingold, A., Slovin, H., and Bergman, H. (1995). Neurons in the globus pallidus do not show correlated activity in the normal monkey, but phase-locked oscillations appear in the MPTP model of parkinsonism. J. Neurophysiol. 74, 1800–1805.
Raz, A., Vaadia, E., and Bergman, H. (2000). Firing patterns and correlations of spontaneous discharge of pallidal neurons in the normal and the tremulous 1-methyl-4-phenyl-1,2,3,6-tetrahydropyridine vervet model of parkinsonism. J. Neurosci. 20, 8559–8571.
Rizzone, M., Lanotte, M., Bergamasco, B., Tavella, A., Torre, E., Faccani, G., Melcarne, A., and Lopiano, L. (2001). Deep brain stimulation of the subthalamic nucleus in Parkinson’s disease: effects of variation in stimulus parameters. J. Neurol. Neurosurg. Psychiatr. 71, 215–219.
Rubin, J. E., and Terman, D. (2004). High frequency stimulation of the subthalamic nucleus eliminates pathological thalamic rhythmicity in a computational model. J. Comput. Neurosci. 16, 211–235.
Schiff, S. J. (2010). Towards model-based control of Parkinson’s disease. Philos. Transact. A Math. Phys. Eng. Sci. 368, 2269–1308.
Schultheiss, N. W., Edgerton, J. R., and Jaeger, D. (2010). Phase response curve analysis of a full morphological globus pallidus neuron model reveals distinct perisomatic and dendritic modes of synaptic integration. J. Neurosci. 30, 2767–2782.
Sims, R. E., Woodhall, G. L., Wilson, C. L., and Stanford, I. M. (2008). Functional characterization of GABAergic pallidopallidal and striatopallidal synapses in the rat globus pallidus in vitro. Eur. J. Neurosci. 28, 2401–2408.
Wichmann, T., and DeLong, M. R. (1996). Functional and pathophysiological models of the basal ganglia. Curr. Opin. Neurobiol. 6, 751–758.
Wichmann, T., and DeLong, M. R. (2006). Deep brain stimulation for neurologic and neuropsychiatric disorders. Neuron 52, 197–204.
Keywords: basal ganglia, deep brain stimulation, Parkinson’s disease
Citation: Wilson CJ, Beverlin B II and Netoff T (2011) Chaotic desynchronization as the therapeutic mechanism of deep brain stimulation. Front. Syst. Neurosci. 5:50. doi: 10.3389/fnsys.2011.00050
Received: 22 April 2011; Paper pending published: 23 May 2011;
Accepted: 05 June 2011; Published online: 21 June 2011.
Edited by:
James M. Tepper, Rutgers, The State University of New Jersey, USACopyright: © 2011 Wilson, Beverlin II and Netoff. This is an open-access article subject to a non-exclusive license between the authors and Frontiers Media SA, which permits use, distribution and reproduction in other forums, provided the original authors and source are credited and other Frontiers conditions are complied with.
*Correspondence: Charles J. Wilson, Department of Biology, University of Texas at San Antonio, One UTSA Circle, San Antonio, TX 78249, USA. e-mail: charles.wilson@utsa.edu