Input dependent cell assembly dynamics in a model of the striatal medium spiny neuron network
- Neurobiology Research Unit, Okinawa Institute of Science and Technology, Okinawa, Japan
The striatal medium spiny neuron (MSN) network is sparsely connected with fairly weak GABAergic collaterals receiving an excitatory glutamatergic cortical projection. Peri-stimulus time histograms (PSTH) of MSN population response investigated in various experimental studies display strong firing rate modulations distributed throughout behavioral task epochs. In previous work we have shown by numerical simulation that sparse random networks of inhibitory spiking neurons with characteristics appropriate for UP state MSNs form cell assemblies which fire together coherently in sequences on long behaviorally relevant timescales when the network receives a fixed pattern of constant input excitation. Here we first extend that model to the case where cortical excitation is composed of many independent noisy Poisson processes and demonstrate that cell assembly dynamics is still observed when the input is sufficiently weak. However if cortical excitation strength is increased more regularly firing and completely quiescent cells are found, which depend on the cortical stimulation. Subsequently we further extend previous work to consider what happens when the excitatory input varies as it would when the animal is engaged in behavior. We investigate how sudden switches in excitation interact with network generated patterned activity. We show that sequences of cell assembly activations can be locked to the excitatory input sequence and outline the range of parameters where this behavior is shown. Model cell population PSTH display both stimulus and temporal specificity, with large population firing rate modulations locked to elapsed time from task events. Thus the random network can generate a large diversity of temporally evolving stimulus dependent responses even though the input is fixed between switches. We suggest the MSN network is well suited to the generation of such slow coherent task dependent response which could be utilized by the animal in behavior.
1. Introduction
Experimentally testing theoretical work on the dynamics of brain networks requires measurement of key predictions of models. With existing technologies it is in general not possible to obtain a complete record of the activity of entire populations of cells embedded within networks in intact, behaving animals. Most data is obtained by recording small groups or single neurons during behavioral tasks, frequently reported as peri-stimulus time histograms (PSTH). Such studies of neural response to behavioral task events and sensory stimuli throughout the brain demonstrate large firing rate fluctuations on slow behaviorally relevant timescales in both single cells and cell populations. These large slow firing rate modulations in PSTH do not simply occur at stimulus offset and onset but tend to be broadly distributed throughout the trial period (Jin et al., 2009). The different responses of a sample of cells from a network may provide a signature of network dynamical activity.
The striatal medium spiny neuron (MSN) network is one neural network which shows strong modulations in PSTH during behavioral tasks. MSNs are GABAergic and comprise more than 90% of the cells of the striatum which forms the main input structure to the basal ganglia (BG) (McGeorge and Faull, 1989; Oorschot, 1996; Wickens et al., 2007). Since the MSN network is composed of sparse, random, and weak connections (Czubayko and Plenz, 2002; Tunstall et al., 2002; Koos et al., 2004; Taverna et al., 2004), its function has been puzzling and inconsistent with its often supposed winner-take-all role (Groves, 1983; Wickens et al., 1991; Beiser and Houk, 1998; Suri and Schultz, 1999; Bar-Gad and Bergman, 2001). Recent experimental observations of striatal slices show that MSN cell assemblies display episodes of spontaneous and recurrent bursting activity (Carrillo-Reid et al., 2008) while in vivo behavioral studies show that coherent bursting activity in cortico-BG microcircuits is important in the encoding of movement (DeLong, 1973; Hikosaka et al., 1989, 2000, 2006; Jaeger et al., 1995; Kasanetz et al., 2006; Miller et al., 2008) and the execution of learned motor programs and sequence learning (Kimura, 1990; West et al., 1990; Brotchie et al., 1991; Gardiner and Kitai, 1992; Kimura et al., 1992; Kermadi and Joseph, 1995; Mushiake and Strick, 1996; Aldridge and Berridge, 1998; Jog et al., 1999; Doya, 2000; Barnes et al., 2005; Kubota et al., 2009). A recent study (Jin et al., 2009) found that populations of striatal neurons display a variety of response profiles during tasks. Firing rates were strongly modulated in various epochs of the task and individual cells responded with activity peaks that were distributed at different temporal delays after individual task events. The authors suggested the neurons could have encoded time as a population.
Other BG inhibitory networks also exhibit firing rate modulations that are time locked to behavioral tasks. PSTH of pallidal cells in song bird Area X display rate increases and decreases significantly correlated with song temporal structure (Goldberg et al., 2010) and pallidal cells also exhibit a broad range of firing rates during motor tasks (Joshua et al., 2009). However cells also generally exhibit strong trial-to-trial variability in the timing of their activity during motor tasks (Tomko and Crapper, 1974; Goldberg et al., 2010).
It is a priori surprising that large slow modulations in PSTH exist since the cells generating these responses receive inputs from very many cells (∼10000). Indeed, according to the law of large numbers, a reduction in fluctuation size is to be expected when many independent inputs to a cell are combined. On the other hand if the excitatory inputs to an MSN covary on slow timescales then the MSN activity can be expected to show large modulations on similar time scales. Even if pairwise correlations between inputs are themselves weak (Schneidman et al., 2006; Yim et al., 2011) their cumulative effect may be strong. Such strongly covarying inputs might translate into large fluctuations in PSTH when the stimuli are repeatedly presented.
However the MSN response is also determined by the activity generated within the striatum through feedback inhibition among MSNs and feedforward inhibition from fast spiking interneurons in particular. Indeed in recent modeling work on the striatal MSN network (Ponzi and Wickens, 2008a,b, 2010a) we have shown that coherent cell assembly population dynamics on slow behaviorally relevant timescales can be generated simply by the MSN network in isolation, even when excitatory input is constant and unvarying. We showed that such activity occurs if the network has the sparse random striatally relevant connectivity of around 10–30% and cortical excitation is appropriate so that cells are excited just above firing threshold. In this “balanced” situation even small changes in network generated inhibition or cortical excitation can cause cells to switch between firing and quiescent states. We demonstrated that under these circumstances individual cells displayed broadly distributed firing rates and that the network generated complex spatio-temporal dynamics (Usher et al., 1994, 1995; Ermentrout, 1998; Huerta and Rabinovich, 2004) while spiking itself was highly irregular (Tomko and Crapper, 1974; Softky and Koch, 1993; Holt et al., 1996; Shadlen and Newsome, 1998; Compte et al., 2003; Miura et al., 2007; Renart et al., 2007; Barbieri and Brunel, 2008). Networks with balanced excitation and inhibition (van Vreeswijk and Sompolinsky, 1996; Amit and Brunel, 1997) generically produce irregular chaotic spiking with broad rate distributions.
Here we wish to understand how the large amplitude firing rate fluctuations on slow time scales generated by the MSN network are modulated when excitatory input varies as it would in a behavioral task. Thus we investigate how the MSN network transforms cortical driving activity. On the one hand MSN network generated activity may be suppressed so that PSTH simply reflect the variations in cortical driving. Alternatively MSN activity may evolve chaotically independent of the cortical activity. In this case we would expect MSN PSTH to be structureless after many stimulus presentations are averaged. Or finally interaction between cortical driving and MSN network generated activity may occur, thus generating complex patterns in PSTH.
First we extend our previous study of MSN network dynamics and show that similar dynamical activity occurs when the excitatory input to cells is composed of many independent Poisson spike trains. We also investigate how network dynamics depends on cortical excitation strength (Ponzi and Wickens, 2009) and on the time scale of inhibitory neurotransmitter. Next we show that the MSN network can generate coherent repeatable responses to variations in cortical driving input. Cell assemblies display large firing rate modulations over a broad range of temporal delays up to many hundreds of milliseconds after particular task events (Ponzi and Wickens, 2010b) resulting in strongly modulated stimulus and temporally specific PSTH. Finally we investigate how the stimulus locked fluctuations in PSTH depend on connectivity and input strength.
These network generated behaviors may be relevant in reinforcement learning tasks where the animal shows a transition from exploratory to exploitative behavior (for example (Barnes et al., 2005)). Moreover the dual encoding of stimulus identity and elapsed time in a single spiking network (Buonomano and Merzenich, 1995; Maass et al., 2002; Jaeger and Hass, 2004; Karmarkar and Buonomano, 2007; Buonomano and Maass, 2009) may be relevant in the temporal credit assignment tasks which are thought to deeply involve the striatum and dopaminergic systems.
2. Model
The network is composed of model MSNs with parameters set so they are in the vicinity of a bifurcation from a stable fixed point to spiking limit cycle dynamical behavior (Ponzi and Wickens, 2010a). This models the dynamics in the UP state when the cells are all receiving excitatory drive to firing threshold levels of depolarization. To describe the cells we use the INa,p+ Ik model described in (Izhikevich, 2005) which is two-dimensional and given by,
having leak current IL, persistent Na+ current INa,p with instantaneous activation kinetic and a relatively slower persistent K+ current IK. Vi(t) is the membrane potential of the ith cell, C the membrane capacitance, EL,Na,k are the channel reversal potentials, and gL,Na,k are the maximal conductances. ni(t) is K+ channel activation variable of the ith cell. The steady state activation curves m∞ and n∞ are both described by,  where x denotes m or n and
  and
and  are fixed parameters. τn is the fixed timescale of the K+ activation variable. The term Ii(t) is the input current to the ith cell.
The parameters are chosen so that the cell is the vicinity of a saddle-node on invariant circle (SNIC) bifurcation, characterizing a Type 1 neuron model. As the current Ii(t) in equation (1) increases through the bifurcation point the stable node fixed point and the unstable saddle fixed point annihilate each other and a limit cycle having zero frequency is formed (Izhikevich, 2005). Increasing current further increases the frequency of the limit cycle. This is an appropriate model to use for an MSN in the UP state, since its dynamics are in qualitative agreement with several aspects of MSN firing (Wilson, 1993; Wilson and Nisenbaum, 1995; Wilson and Kawaguchi, 1996; Wickens and Wilson, 1998). Firstly the SNIC bifurcation allows firing at arbitrarily low frequencies (Izhikevich, 2005) which is important since MSNs are known to fire with very low frequencies (Wilson, 1993). Secondly MSNs do not show subthreshold oscillations (Wilson and Nisenbaum, 1995; Wilson and Kawaguchi, 1996; under normal circumstances, but see McCarthy et al., 2011). Finally the SNIC bifurcation does not allow bistability between a spiking state and a quiescent state (Izhikevich, 2005) in agreement with studies of MSNs (Wilson and Nisenbaum, 1995; Wilson and Kawaguchi, 1996; Wickens and Wilson, 1998). However detailed channel properties such as the interaction of L-type Ca2+ and slowly inactivating K+ channels in the MSN have not been included in the model.
The input current  in equation (1) is composed of two parts. One component
  comes from the MSN inhibitory network and the other component
  represents the current from excitatory sources, the cortex and the thalamus. We describe the excitatory component first.
We model the excitatory part as a stochastic process. In general the excitatory component will be given by Rall-type synapses (Rall, 1967; Destexhe et al., 1998)  where
where  VC is the excitatory reversal potential, set here to the realistic value 0.0 mV. The MSN cells are considered to be contacted by many excitatory inputs l which are non-overlapping between the MSN cells i. Indeed while a given corticostriatal axon will often be providing input to a substantial number of cells (about 800 on average) within the volume of the arborization zone of a typical corticostriatal axon there are about 68000 striatal spiny neurons, making the average common input about 1.2% or less (Zheng and Wilson, 2002). Our assumption of zero common input is not, however, supposed to be a statement of biological fact. We wish to investigate how much correlated activity arises from local interactions among MSNs, rather than via common input.
  are fixed channel parameters from the lth excitatory cortical or thalamic input to the ith MSN cell, described below. The ail(t) are the quantities of postsynaptically bound neurotransmitter from the lth excitatory input to the ith MSN cell. They are given by
  where the Dirac delta function δ() part represents a series of spikes from the lth input to the ith cell at times tilm and τa is a time scale which we set to the realistic value of 10 ms. The term Xi(t) is then described by,
We assume the input spikes follow independent Poisson processes with varying rates  This is a simple and compact way to describe the input activity in the simulation and is not supposed to be necessarily perfectly biologically realistic. This model is an attempt to understand how the MSN network behaves under the simplest assumptions, which do not include correlation between inputs. The contribution provided by many such independent Poisson processes is approximately Gaussian and we can replace the spike series by a term given by the mean rate plus a fluctuation proportional to the SD,
  where
where  is a standard normally distributed random variable (mean zero, std unity) (Brunel and Hakim, 1999). Assuming that spikes are independent across i and l, the term
  which arises can also be replaced by its expectation and fluctuation
  where εi(t) is standard normal noise term independent in i and t and we have used ⟨εil(t)⟩ = 0 and ⟨εil(t)εik(t)⟩ = 0, (l≠k) and ⟨εil(t)εik(t)⟩ = 1, (l = k). Therefore we calculate Xi(t) using,
MSN cells are each contacted by around 10000 cortical and thalamic cells and we therefore set NC= 10000. For each given cortical stimulus we draw the 10000 rates  for each MSN i independently from a certain fixed distribution, here a normalized Pareto distribution (see below). The normalized Pareto distribution with power-law tail parameter α and expectation rC is chosen so that even though there are many, 10000, inputs to the cell the mean input strength can still show large fluctuations across cells when the tail parameter α is small enough. Sums of power-law distributed variables (with finite variance, α > 1) do still converge to the Gaussian distribution, but the convergence rate is very slow. If instead the
  are chosen from a narrow distribution, for example the Gaussian, when many inputs are averaged all the cells will have approximately the same input strength and stimulus specificity will not be possible. Variation of the tail parameter α controls the size in fluctuations in input strength across cells and therefore the amount of input specificity. Input specificity here is defined as 1 minus the normalized scalar product between the mean input vectors
  for two different cortical stimuli. When α < 2 stimuli will have specificity which increases as α decreases toward unity. As α increases past 2 however the limit distribution is a Gaussian and stimuli lose specificity when many inputs (here 10000) are summed over.
We have chosen to use the Pareto distribution as a device to produce a large variation in excitation strength across MSN cells as only the simplest of several possibilities. There are others which may be biologically plausible or possible. For example correlation in inputs to a single cell may also produce similar effects (Yim et al., 2011). Since all the afferents to a cell are combined into a single stochastic equation (3), and interactions between them are not addressed, which method is used is not central to the modeling described here.
The  are also fixed in our simulations reported here, although in reality they may vary with short term facilitation and suppression as well as by LTP and LTD. We choose the
  independently from a uniform distribution on [0,2bC].
The inhibitory current part is provided by the GABAergic collaterals of the striatal network and given by  These synapses are also described by Rall-type synapses (Rall, 1967) contributing to Ii(t) where the current into postsynaptic neuron i is summed over all inhibitory presynaptic neurons j and VM and
  are channel parameters. gj(t) is the quantity of postsynaptically bound neurotransmitter given by,
  for the jth presynaptic cell. Here Vth = −40 mV is a threshold, and Θ(x) is the Heaviside function. gj is a low-pass filter of presynaptic firing.
The timescale τg should be set relatively large so that the postsynaptic conductance follows the exponentially decaying time average of multiple preceding presynaptic high frequency spikes. In simulations here we use two values for τg= 20, 50, for comparison, so that postsynaptically bound transmitter exponentially decays to half its value in time τgln(2) ≈ 14, 34 ms. In our network model what we are reproducing with the synapses is the time course of recovery of the membrane potential to firing threshold after a spike from another MSN. The time scales in the model have been adjusted so that the IPSP decay time scale is near that observed in experimental studies. The choice of τgln(2) ≈ 34 was motivated by (Janssen et al., 2009) which shows a time course of MSN IPSP with a half life of recovery of about 30–40 ms, although a fairly large range of values has been found in various studies depending on experimental conditions as well as on cell type (D1 or D2), and also dependent on facilitating and depressing properties (Tunstall et al., 2002; Koos et al., 2004; Tecuapetla et al., 2004; Taverna et al., 2008; Planert et al., 2010).
The network structure is described by the parameters  where εij is another uniform quenched random variable on [0.8, 1.2] independent in i and j. Zij= 1 if cells i and j are connected and zero otherwise. In the simulations reported here we use random networks where cells i and j are connected with probability ρ, producing binomial degree distributions, and there are no self-connections, Zii= 0. kM is a parameter which is rescaled by the connection probability ρ so that when the network connectivity is varied the average total inhibition on each cell is constant independent of ρ. kM is set so that IPSPs are around 200 μV, very similar to real striatal IPSPs, at connectivities of around ρ = 0.1 when the postsynaptic cell is just above firing threshold.
Striatal MSNs are likely to contact (and be contacted by) about 500 other MSNs (Plenz, 2003; Koos et al., 2004; Tepper et al., 2004; Wickens et al., 2007). Furthermore the probability of a connection is estimated to be fairly low, ρ = 0.05–0.3. To simulate a striatal network which respects these two figures would require, say, a network of around 500/0.2 = 2500 cells. However this neglects the fact that not all cells are cortically excited into the UP state (Wickens and Wilson, 1998) and such never firing cells can be left out of network simulations. We suppose that only about 10–30% of MSNs are cortically excited at any time, and perform simulations of 500 UP state MSNs with sparse connectivities.
All simulations were carried out with the stochastic weak second order Runge-Kutta integrator described in (Burrage and Platen, 1994) with integration time step 0.1 ms, except for the calculation of Lyapunov exponent which was performed with a deterministic fourth order Runge-Kutta with time step 0.01 ms.
3. Methods
3.1. K-Means Algorithm
Here we explain how the k-means algorithm is used in this paper. The number of clusters k is chosen to be N/k = 15 where N is the number of cells used in the simulation. The cross-correlation matrix of cells’ firing rates is calculated based on a 2 s moving window. Each cell i has a vector of cross-correlation coefficients  . Each cluster centroid’s initial location
  is chosen randomly as one on the cells’ vector of cross-correlation coefficients
  All cells i are assigned to be in the cluster j whose centroid is nearest to their cross-correlation coefficient vector,
  where
where  is length of
  Any empty clusters are removed. New cluster centroid vectors are calculated as the mean vector of cells assigned to the cluster
  The process is repeated until there are no cells which change their assigned clusters. Notice the final amount of clusters may be (and usually is) less than the original k. For all statistical calculations (except example single clusterings) the clustering is performed several (10) times and the results averaged since final clusters are not unique but depend on the initial random placing of cluster centroids. Finally results are compared with a null hypothesis where the cells are randomly shuffled between clusters. The difference between the k-means clustering results and the random clustering results demonstrates that k-means clusters are significant.
3.2. Lyapunov Exponent Calculation
The Lyapunov exponent calculation is performed on the deterministic system where inputs do not fluctuate and uses all 3 × 500 = 1500 dynamical variables in the 500 cell system. First a perturbed 1500 dimensional orbit  near the system orbit,
  is selected by random perturbation
  of size
  After both orbits are iterated once (0.01 ms) the new separation vector is calculated
  with length D1. The maximal Lyapunov exponent is calculated as γ1 = ln(D1/D0). The perturbed orbit is rescaled in the direction of maximal separation,
  This process is repeated for many iterations and many values γi= ln(Di/D0) of the Lyapunov exponent are calculated. The running average is calculated through
  and plotted versus 0.01t after discarding a transient of 30000 ms.
3.3. Normalized Pareto Distribution
The pdf is given by,

with tail parameter α and expectation 1/(γ(α − 1)).
4. Results
We first investigate how the network behaves under parameter variation. We vary connectivity, input strength, and inhibitory neurotransmitter timescale using excitatory input which is almost uniform across cells, α = 5. Subsequently we investigate stimulus switching with lower values of α = 1.5 to generate stimulus specific variations in excitation across cells in the network.
4.1. Network Parameter Variation under Uniformly Distributed Input
In Figure 1 we describe how the spiking activity of 500 cell networks depends on connectivity ρ at low input rates rC∼ 10 Hz and uniform input distribution α = 5. Throughout the whole connectivity range the proportion of active cells (which fire at least one spike during the simulation period) is usually 100% (Figure 1, blue dashed triangles) and cells firing completely regularly with constant inter-spike-interval (ISI) are absent. The whole network is therefore engaged in dynamical activity. To investigate the structure of this dynamical activity we use the coefficient of variation (CV) of the cells’ ISI distributions (Tomko and Crapper, 1974). This defined to be the ISI standard deviation divided by the ISI mean for each cell, then averaged over all active cells. A high value, larger than unity, indicates spiking which is burstier (more clustered) than Poisson, while as the CV approaches zero firing becomes more regular. As connectivity increases the coefficient of variation (Figure 1, black solid circles) decreases from a high value near 2.5 to a value near 1. This means that at low connectivity many cells are firing in a bursty way with episodes of high frequency spiking separated by long silent periods, while at high connectivity most cells are firing in a Poisson like way without high frequency bursts and pauses.
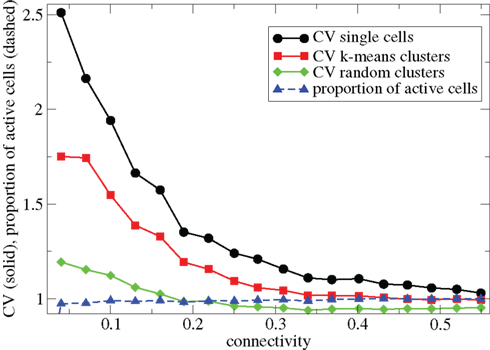
Figure 1. 500 cell network simulations under variation of connectivity for weak input rC= 0.0085, bC= 0.001, α = 5, τg= 50. Each point is calculated from a 50-s time series from a different network simulation. Black solid circles - mean CV over all cells. Red solid squares – mean CV of k-means generated clusters. Green solid diamonds – mean CV of randomly generated clusters. Blue dashed triangles - proportion of cells which fire at least one spike.
The coefficient of variation provides a useful single value to understand how burstiness varies under variation of network parameters. More detail however can be discerned from the distribution of the localized coefficients of variation, defined by  where
where  denotes the nth spike of cell i. Each differently colored distribution, denoted
  , shown in Figure 2 is a different network simulation where all the
  across all i and n are combined in each distribution. The bimodal behavior at low connectivity, with peak near zero and near unity, characteristic of bursty activity changes over to a flat distribution with depletion near unity characteristic of Poisson processes with absolute refractory period at high connectivity.
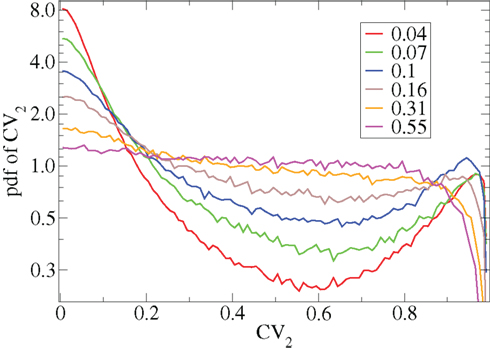
Figure 2. CV2 distributions for all cells combined for network simulations of different connectivities (see key) corresponding to Figure 1.
We have demonstrated that cells fire spikes in a clustered bursty way at low connectivity even when cortical excitation is composed of many independent Poisson processes. Next we investigate whether they fire these bursts coherently or independently. To investigate this we calculate cross-correlation matrices of cell firing rates. We generate cell firing rate time series for all cells by counting the spikes of each cell in a moving window. We use a time window sufficiently long so that irregular fluctuations in precise spike timing do not affect the results.
Figure 3 shows some time-lagged cross-correlation coefficients between randomly selected cell pairs in a 500 cell network simulation. As can be seen, even when cortical input is highly noisy large variations in cross-correlation are present up to time lags of many hundreds of milliseconds. Peaks in cross-correlation do not generally occur at zero time-lag but may be hundreds of milliseconds later. This may express causal relationships between cell firing which exist even on this long timescale, much longer than any of the timescales prescribed by the model parameters. In Figure 4 the mean of the absolute value of the simultaneous (time-lag zero) cross-correlation coefficient of all cell pairs is plotted versus connectivity for many 500 cell network simulations. To make this plot we use a 200-ms time window, reflecting cross-correlation between cells in the window from −100 to +100 ms of the time-lagged cross-correlation. We then take its absolute value and average across all cells. The black line in Figure 4 shows that at low connectivites, precisely where the cells display episodic burst firing, cross-correlations have large absolute magnitude while at higher connectivites this decays. The red line shows the result of the same calculation but where each cell’s ISI time series is initially scrambled. This acts as a control measure removing most of the correlation. At high connectivity the unscrambled ISI result (black line) approaches this control but at low connectivity they are significantly different.
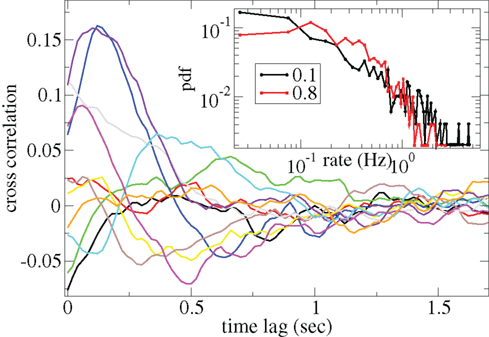
Figure 3. Time-lagged cross-correlations for some randomly chosen cell pairs from a 500 cell network simulation based on a 40-ms sliding window, connectivity 0.1, same parameters as Figure 1. (Inset) Distributions of cell firing rates for two network simulations, connectivity 0.1 (black) and 0.8 (red), same parameters as Figure 1.
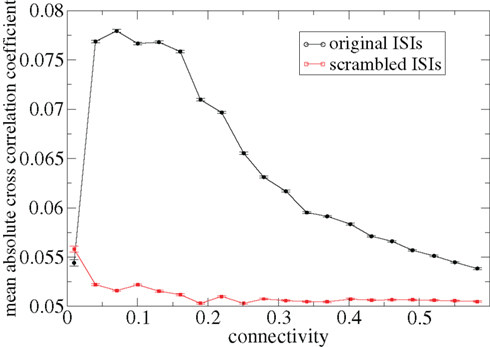
Figure 4. Variation with connectivity of mean absolute firing rate cross-correlation across all cell pairs in 500 cell network simulations based on a 200-ms window corresponding to Figure 1. Black – original ISIs, red – scrambled ISIs.
In fact at low connectivities cells do not fire in bursts individually but in slowly varying episodically firing cell assemblies, even in this case of Poisson cortical excitation. To demonstrate this explicitly we apply a clustering algorithm (k-means) to the cross-correlation matrix of cell firing rates to divide the cells into clusters (see Methods). Then we generate cluster spike time series by merging the spikes of each cluster member cell, preserving each spike’s timing, and measure the mean CV of the resultant spike sequences. Since clusters are not unique (see Methods) this procedure is repeated 10 times and the results averaged. This quantity (Figure 1, red solid squares) also decreases with increasing connectivity. The large value it takes at low connectivities indicates cells fire in assemblies together in episodes and are quiescent together in episodes. This quantity is significantly higher at low connectivities than the control measure we also show in Figure 1 (green solid diamonds). The make the control measure clusters are again generated by the clustering algorithm but the cells are then randomly shuffled between the clusters before their spike time series are merged.
We did not attempt to optimize clustering (Humphries, 2011). However we do show that the (sub-optimal) algorithm produces a result which is significantly different to the null hypothesis where the cells are randomly assigned to clusters. Therefore the (non-random) clustering is meaningful. We thus provide objective demonstration that cell assemblies exist. Indeed the clusters are strongly determined by the network connectivity (Ponzi and Wickens, 2010a). In future work it may be useful to employ more optimal clustering methodologies (Humphries, 2011).
Cell firing rate distributions also vary dependent on connectivity (Figure 3(Inset)). At low connectivity the distribution of cell firing rates (black, connectivity ρ = 0.1) is approximately consistent with a power-law with many cells firing very slowly and a few firing very fast. On the other hand at high connectivity (red, ρ = 0.8) the distribution is narrower and peaks at an intermediate value. Broad firing rate distributions are observed in many brain regions (Lee et al., 1998; Nevet et al., 2007) and in modeling studies of balanced random networks (van Vreeswijk and Sompolinsky, 1996; Amit and Brunel, 1997). They may be relevant for the generation of large firing rate fluctuations representing different stimuli.
These results show that at the sparse connectivities characteristic of many real brain networks, including the MSN network of the striatum, cells show very broadly distributed firing rates and form cell assemblies whose members fire highly irregularly in slow coherent bursty episodes separated by pauses (Ponzi and Wickens, 2010a). Here we demonstrate this occurs even when cortical input is noisy and biologically plausibly composed of many Poisson spike trains.
However Figure 5, which shows how spiking in sparsely connected networks (ρ = 0.1) driven by excitation uniform across cells (α = 5) depends on excitatory input rate,  demonstrates that this interesting dynamical behavior also depends strongly on the strength of cortical excitation (Ponzi and Wickens, 2009). As mean excitatory input, rC, increases the proportion of active cells (Figure 5, blue dashed triangles) decreases from 100% to a value around 75% and simultaneously the single cell CV (Figure 5, black solid circles) decreases to a value below unity (∼0.75.) Similarly our measure of the quantity of episodically firing cell assemblies (Figure 5, red solid squares) decreases to below zero and becomes equal to the control measure (Figure 5, green solid diamonds). CV values below one and near zero imply more regularly (periodically) firing cells are present. This is confirmed by direct calculation of the proportion of regularly firing cells, (magenta crosses) (which are cells whose ISI variance is zero or less than a small threshold determined by the numerical integration time step). As can be seen the quantity of regularly firing cells increases at higher input strengths. This is also demonstrated by the CV2 distributions (Figure 6) which show an increasing accumulation near zero as input strength increases, indicating the presence of more regularly firing cells. In fact (although detailed behavior does depend on other parameters) as input strength increases the network becomes locked into states where fewer cells are firing with higher rates which permanently suppress other cells, while a remaining portion of the cells continue to display bursting behavior. The reduction in the quantity of active inhibitory connections this brings about allows some cells to fire nearly periodically under the cortical excitation. Which cells fire and which are quiescent depends on the details of the network structure and also on the distribution of input rates across cells.
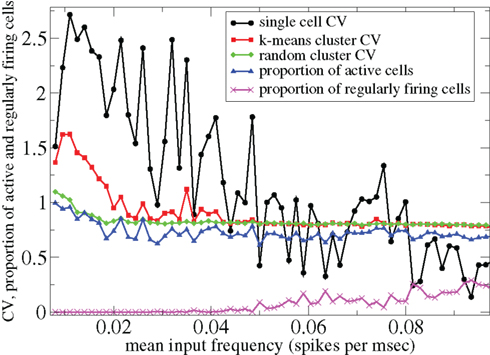
Figure 5. 500 cell network simulations under variation of input strength at low connectivity ρ = 0.1, bC = 0.001, α = 5, τg= 50. Each point is calculated from a 50-s time series from a different network simulation. Black solid circles – mean CV over all cells. Red solid squares – mean CV of k-means generated clusters. Green solid diamonds – mean CV of randomly generated clusters. Blue dashed triangles – proportion of cells which fire at least one spike. Magenta crosses – proportion of regularly firing cells.
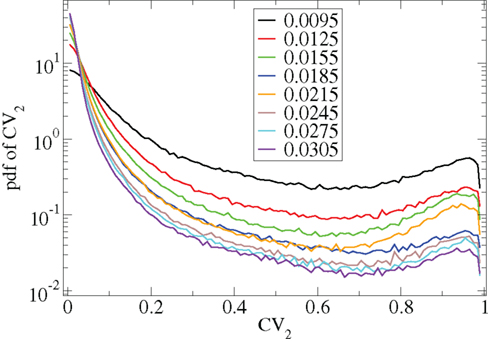
Figure 6. CV2 distributions for all cells combined for many network simulations in increasing input frequency steps of 0.003 spikes per msec (see key) corresponding to Figure 5.
Other network parameters also affect results. The above calculations were all performed with the half life of inhibitory neurotransmitter decay set to τg ln(2) ≈ 34 ms. In Figures 7–10 we show that when this is reduced to τg ln(2) ≈ 14 similar variations with connectivity and input strength are observed but the measured values of episodic burstiness, as quantified by the CV value and CV2 distribution, are somewhat reduced. The reduction in burstiness occurs because IPSP decay times are reduced which reduces the periods of time where cells remain quiescent. However in the absence of inhibition cells still fire roughly regularly at a constant rate due to their fixed mean excitation levels. These two effects produce ISI distributions which are more regular and reduce the CVs. In close correspondence with the longer time scale results shown in Figure 1, as connectivity increases single cell CV (Figure 7, black circles) decreases while k-means cluster CV (Figure 7 red squares) also decreases but remains strongly above its control (Figure 7 green diamonds). CV2 distributions (Figure 8) appear very similar to their longer time scale counterparts, (Figure 2), displaying a cross-over from a bimodal profile at low connectivity to flatter profile at higher connectivity. Similarly the variation with input strength is not strongly affected by reducing τg. Figure 9 shows that single cell CV, k-means cluster CV and random cluster CV for network simulations with τg ln(2) ≈ 14 ms display very similar variations under input strength variation as their longer time scale counterparts, Figure 5. Similar corresponding CV2 profiles (Figure 10) show the same change over from a bimodal profile to a peaked near zero profile as input strength increases. Indeed simulations show that this time scale can be reduced further but not so far that the membrane potential IPSPs do not act as a slow-pass filter for several presynaptic spikes.
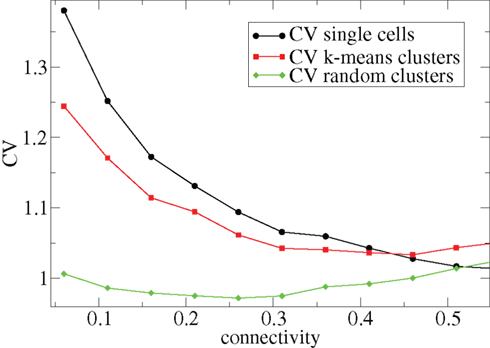
Figure 7. 500 cell network simulations under variation of connectivity for weak input, rC = 0.0085, bC = 0.001, α = 5, but faster inhibitory neurotransmitter decay time τg = 20. Each point is calculated from a 50-s time series from a different network simulation. Black solid circles – mean CV over all cells. Red solid squares – mean CV of k-means generated clusters. Green solid diamonds – mean CV of randomly generated clusters.
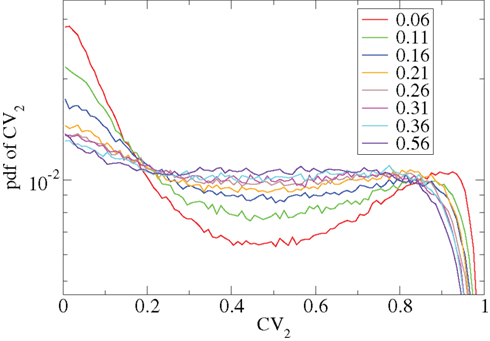
Figure 8. CV2 distributions corresponding to Figure 7 for all cells combined for different network simulations (see key.)
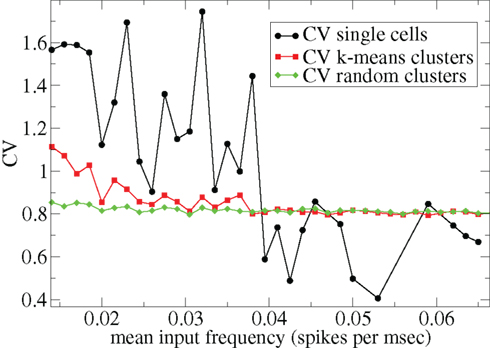
Figure 9. 500 cell network simulations under variation of input strength at low connectivity ρ = 0.1, bC= 0.001, α = 5, but faster inhibitory neurotransmitter decay time τg= 20. Each point is calculated from a 50-s time series from a different network simulation. Black solid circles – mean CV over all cells. Red solid squares – mean CV of k-means generated clusters. Green solid diamonds – mean CV of randomly generated clusters.
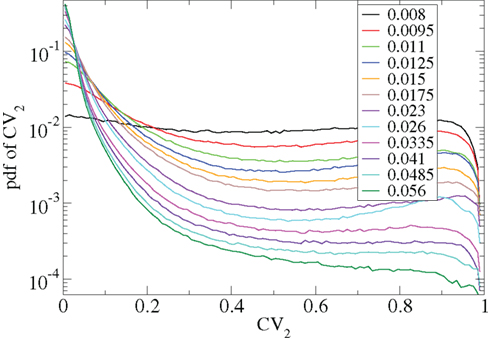
Figure 10. CV2 distributions corresponding to Figure 9 for all cells combined for different network simulations (see key.)
4.2. Network Dynamics under Input Switching
What could be the use of the slowly varying cell assembly dynamics generated by the MSN network? To address this question we investigate how the network responds to stimuli. Here we set the input specificity parameter α to a lower value α = 1.5 to generate stimulus specific activities.
Figure 11 shows a segment of a raster plot of all the active cells from a 100 cell network simulation under an stimulus switching protocol. Three different inputs A, B, and C, each of which consists of a set of i = 100 × l = 10000 firing rates, 
 and
and  are applied for 1 s, each alternately and repetitively. All the rates in the matrices ril are drawn independently randomly and then fixed for the duration of the 174 s simulation. The cells in Figure 11 have been ordered by the clustering algorithm with 15 clusters and colored according to their assigned clusters. Vertical lines denote the input switching times. Figure 12 shows the corresponding cluster PSTH locked to stimulus onset time. To construct this Figure the spikes of cells in a given cluster are merged and binned at given time lags from the onset of one of the stimuli, then the number of spikes in a bin is divided by the bin size (10 ms) and the number of cells in the cluster to give PSTH rates per second per cell.
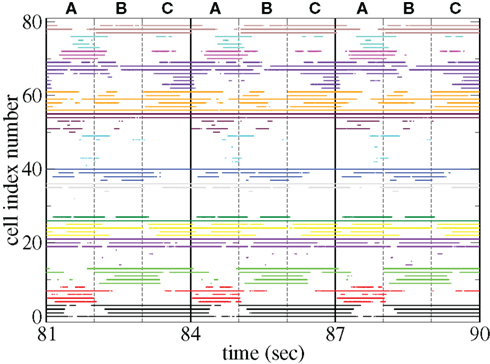
Figure 11. Raster plot from a segment of a 174-s time series network simulation with 100 cells under input switching protocol 1 s × 3 stimuli, (see text) cells colored according to assigned cluster. Input strength rC= 0.018 spikes/ms, connectivity ρ = 0.1, tail parameter α = 1.5, synaptic strength bC= 0.001.
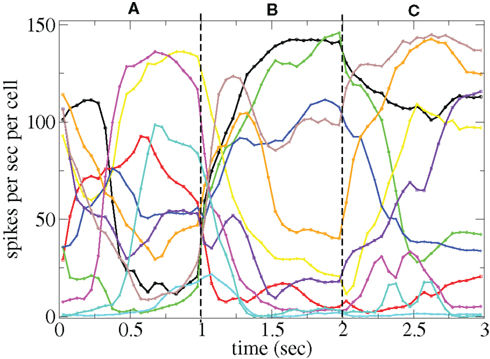
Figure 12. PSTH of clusters corresponding to Figure 11 and colored the same way in spikes per second per cell.
Figures 11 and 12 demonstrate that different stimuli evoke different sets of cells. This is shown by the very different cluster firing rates in the two stimuli in Figure 12 for any given cluster. However the activation of cells is not simply determined by the input strengths. If this were the case (roughly speaking) the most strongly excited cells in any particular stimulus would remain active throughout that stimulus period while the least strongly activated would remain quiescent throughout the stimulus. In fact the network activity provides cells with a large diversity of responses to a given stimulus, rather than a static state of active and quiescent cells. Individual cells fire in specific temporal patterns locked to stimulus onset, (Ponzi and Wickens, 2010b), as can be seen by the repetitive nature of some of the cell spike rasters in Figure 11. For example cell number 74 (colored cyan) fires only during the latter half of stimulus A “in anticipation” of stimulus B while cell number 17 (colored purple) fires a sharp peak near the onset of stimulus C. Furthermore cell assemblies composed of large numbers of cells can also fire in specific stimulus onset locked temporal patterns. For example the green cluster of cells, numbered around 10–15 fires strongly as a coherent assembly for over a second, but only during the latter half of stimulus B and first half of stimulus C. This is also clearly demonstrated by the PSTH in Figure 12 where certain clusters develop large fluctuations in firing rate up to many hundreds of milliseconds after a given stimulus onset. For example the magenta cluster fires strongly during the latter half of stimulus A and more weakly during the first half of stimulus C.
These observations are not trivial since the network can display chaotic temporal evolution (Ponzi and Wickens, 2010a) and each stimulus presentation can occur in a different network state or context, depending on the history of the network. Therefore there are differences in the responses to repeated presentations of the same stimulus and one might expect the firing rate fluctuations of many cells to average themselves out over many presentations. However large fluctuations in cluster PSTH are possible because the strength of the network generated instability is weak (see below).
Large stimulus locked fluctuations occur hundreds of milliseconds after stimulus switching even though input firing rates are fixed for the duration of each stimulus on all excitatory input synapses and each input describes a noisy Poisson spike process. The fluctuations occur on behaviorally relevant timescales. Since the clusters are composed of many cells they may provide a powerful force to drive or modulate downstream motor targets by inhibition when cluster firing rates are high or disinhibition during pauses in cluster firing at specific times after stimulus onset.
The appearance of stimulus locked temporally structured dynamics strongly depends on the system parameters however. At higher input strength, as shown in the spike raster plot in Figure 13 active cells fire at higher rates and more regularly and there are more completely silent cells. Many cells, such as those numbered #1 and #2 (colored black) fire regularly across all stimuli. Thus stimulus specificity is weakened while temporally specific stimulus locking is lost. At higher connectivity, as shown by the spike raster plot in Figure 14, stimulus specificity is strong since many cells fire during only one stimulus (for example the brown colored cells #39–47 fire only during stimulus C) however temporal specificity is weak since cells fire continuously throughout a particular stimulus. Indeed at higher connectivity, cell dynamics approaches a more “winners-take-all” type behavior (Fukai and Tanaka, 1997).
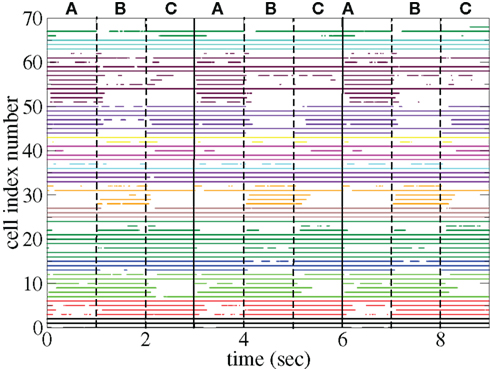
Figure 13. Spike raster plot clustered by k-means algorithm with 15 clusters for 100 cell network simulations under input switching protocol 3 × 1 s stimuli with high input strength ρ = 0.1, bC= 0.001, rC= 0.025, and α = 1.5.
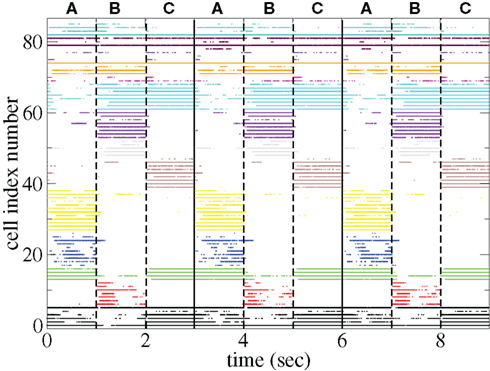
Figure 14. Spike raster plot clustered by k-means algorithm with 15 clusters for 100 cell network simulations under input switching protocol 3 × 1 s stimuli with high connectivity ρ = 0.6, bC= 0.001, rC= 0.0085, and α = 1.5.
4.3. Lyapunov exponent
Network simulations can display complex cell assembly dynamics locked to stimulus onset times. How can such behavior occur?
In Figure 15 we show the maximal Lyapunov exponent γ (Gluckenheimer and Holmes, 1983) calculated for a single deterministic network simulation [here the noise term in equation (3) has been set to zero; see Methods]. The inset shows γ(t) = (1/Δt)log(D(t + Δt)/D(t)) where Δt = 0.01 ms is the time increment and D(t) is the distance between two nearby deterministic trajectories at time t. γ(t) measures the rate of separation of the two trajectories, when negative the trajectories converge exponentially, when positive they diverge. The former indicates a stable periodic (or fixed point) state while the latter indicates the presence of unstable dynamics and chaos.
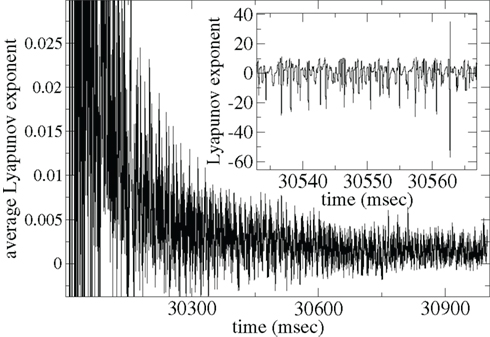
Figure 15. Lyapunov exponent γ calculation for single network deterministic simulation. Inset shows γ, main shows ⟨γ⟩. Connectivity ρ = 0.1, α = 1.5, rC= 0.02, bC= 0.0006, τg= 50, one continuous input without fluctuations.
The γ(t) points (Figure 15 inset) show large fluctuations, sometimes apparently unstable (positive) but often stable (negative). These fluctuations may be caused by the dynamical system remaining close to a meta-stable attractor state for some time before randomly switching between such meta-stable attractors (Kaneko and Tsuda, 2003; Tsuda et al., 2004). The average Lyapunov exponent γAV(t) = ⟨γ(τ)⟩τ, where ⟨…⟩τ denotes time averaging from τ = 0 to t, shown in Figure 15(main), appears to approach a low positive value close to zero. Thus the system may be in a marginally stable very long “transient” state before reaching a permanent attractor state. Network dynamics may be consistent with the paradigm of “weak chaos” (Zillmer et al., 2009) or the “edge of chaos” (Langton, 1990; Bertchinger and NatschlÃger, 1995), since the Lyapanuov exponent is close to zero, “between” a chaotic and a stable state (Ponzi and Wickens, 2010a). A transient state can also be observed in the paradigm of winner-less-competition based on heteroclinic channels (Rabinovich et al., 2000, 2001, 2008a,b; Nowotny and Rabinovich, 2007). Thus long dynamical transient states which are initiated when stimuli suddenly change may be responsible for the temporally locked cell firing observed in simulations of appropriate connectivity and input characteristics. In such a state the system does not either fall to a fixed point attractor state too rapidly nor does the system find a strongly unstable state where strong random fluctuations would be incompatible with large modulations in PSTH after many presentations are averaged.
5. Discussion
In this paper we have extended a model of an MSN network (Ponzi and Wickens, 2010a) to the case where excitatory input to each cell is composed of many independent Poisson processes. We show that in spite of this noisy input at low connectivities with weak excitation cells form assemblies which fire highly irregularly but in coherent episodes on long behaviorally relevant timescales and firing rates are very broadly distributed. However when excitation is increased cells fire more regularly and a permanently quiescent component appears.
When excitatory inputs have a power-law distribution (α < 2) so that cells receive a broad distribution of net excitations, MSN cell population PSTH are both stimulus and temporally specific. Temporal modulations occur for many hundreds of milliseconds after excitatory input rates are suddenly changed even though the inputs are fixed during this period. These time scales are much longer than any that exist in the system parameters. Such modulations are often observed in studies of behavioral tasks at distinct epochs during task events.
We suggest that the low connectivity observed in the striatum is necessary to generate strong firing rate modulations in PSTH. Using two time series examples we demonstrate that stimulus specific PSTH do not occur at high connectivity or high input strength and therefore this activity is not a trivial result which can be generated by any network under any conditions. At high connectivity cells either fire fairly regularly throughout a particular stimulus or are quiescent throughout. Cell activity is stimulus specific but does not display large rate variations locked to stimulus onset. On the other hand at high levels of cortical excitation many cells fire throughout all stimuli and thus stimulus specificity does not occur.
We suggest the MSN network facilitates the generation of marginally stable dynamical transients initiated at sudden stimulus switches. This may also possibly be true for the other sparse networks ubiquitous throughout the brain. Thus the network adds temporal specificity on long behaviorally relevant timescales to stimulus specificity. The dynamics generated by the network is not strongly unstable and therefore cell firing rates have low variability across repeat presentations of the same stimulus. However the dynamics does not rapidly enter a periodic or fixed point state either and therefore a large diversity of temporally varying cell responses can be generated in spite of the fixed excitatory input. We have also shown (Ponzi and Wickens, 2011) that the reduction in variability after stimulus switching characterized by repeatable temporal evolution is equivalent to a reduction in Fano factor across repeated stimulus presentations in qualitative agreement with several experimental studies of neural activity (Churchland et al., 2006, 2010; Mitchell et al., 2007). Thus we offer the prediction that this phenomenon, so far observed only in cortex, should also be observed in MSN activity.
The response of chaotic firing rate networks of excitatory and inhibitory neurons to periodically varying inputs has also been recently studied in (Rajan et al., 2010). The model presented here extends this work to investigate the interaction of network generated chaos with excitatory drive in a purely inhibitory network of conductance based spiking cells with parameters chosen to resemble the striatal MSN network. In other possibly related work (Pehlevan and Sompolinsky, 2011; van Vreeswijk and Hansel, 2011) have shown that a random network operating in the regime where excitation and inhibition are balanced can generate cells with various realistic static tuning curves. The balanced network amplifies small variations in input drive. Although we have not varied the stimulus discriminability parameter α here systematically we observe (data not shown) that strong network responses can occur even under very subtle changes in excitation. Here the amplification is simply a result of the competitive selective behavior of this purely inhibitory asymmetrically connected network (at relatively sparse striatal connectivities.) Since cells are close to firing threshold switching a driving activation from one cell to another can cause a large change in the distribution (and temporal evolution) of activity across the network.
This model could be experimentally tested by simultaneously recording from striatal cell populations while manipulating the corticostriatal input. This is feasible using calcium imaging in brain slices and optogenetic activation of the cortical inputs. The model presented here provides a framework for the analysis of data from such an experiment. Experimental manipulation of connectivity is more difficult, and may require cell cultures. The properties of PSTH predicted by the model, for which some data is already available, provide a means for experimental testing in awake animals.
The crucial test of the model is blocking the lateral inhibition of MSNs. If blocking lateral inhibition does not change MSN PSTH time courses, and also does not change cortical activity patterns, then the model is falsified. If it does change MSN PSTH, the model is supported. The possibility exists, in the latter case, that the changed MSN network dynamics would, by feedback via the cortex, produce further changes in MSN PSTH. To exclude this possibility it would be necessary to block the outputs of the MSNs as well. In practice, it may be possible to do this using optogenetic methods to block lateral inhibition by MSNs. In the future we hope to address in more detail exactly how to test these models.
Large temporally specific fluctuations may be utilized in the time delayed reinforcement learning tasks (Sutton and Barto, 1998) known to recruit the striatum. For example to provide fluctuations at specific times necessary to facilitate exploration of both sensory input and motor response (Doya and Sejnowski, 1996; Kao et al., 2005; Olveczky et al., 2005; Andalman and Fee, 2009) or simply to drive temporally delayed motor response. As learning proceeds the large fluctuations may be reduced and the network “locked” when excitatory input strength is increased (Levi et al., 2004). Related experimental studies show that learning to perform procedural tasks alters neural firing patterns in the sensorimotor striatum as behavior becomes more stereotyped (Barnes et al., 2005) with the task related activity of some cells strongly enhanced and others strongly suppressed. Such activity is reminiscent of the regularly firing and permanently suppressed cell populations which appear when input strength is increased as described above. Excitatory input strength and specificity may be varied through the action of dopamine or other neuromodulators during learning.
There are several good models of the striatum, for example (Beiser and Houk, 1998; Brown et al., 1999; Gurney et al., 2001; Bar-Gad et al., 2003; Humphries et al., 2006, 2009; McCarthy et al., 2011; Yim et al., 2011). The model we present here is not intended to be a complete model of the striatum. It is simply a model of MSN network activity which we hope complements other more complete modeling approaches. The striatum itself is vastly more intricate, including many different types of feedforward and feedback interneurons, different MSN cell types (D1 and D2), facilitating and depressing inhibitory synapses, patch, and matrix connectivity structure, correlations in excitatory input, feedback from thalmo-cortical loops, etc. We do not claim that these striatal components will not alter the network activity we present here. Rather the strategy we adopt is to start with one component, in this case the MSN network, and try to understand its behavior in isolation. In future work we will try to understand how other components, such as the feedforward interneurons, may modify or control the complex MSN network generated dynamical activity which we demonstrate here is possible. In fact we demonstrate that this behavior itself, before other striatal components are included, is nearly as complex as observed in many experimental recording studies in behavioral tasks. This is also the approach taken in (McCarthy et al., 2011) which also investigates the dynamics of the MSN network in isolation. The use of a different type of MSN cell model (including intrinsic oscillations in relation to pathological Parkinsonism) illustrates how useful minimal models may be for making different predictions about (some aspects of) network dynamics which can be easily traced back to differences in the basic behavior of the elements of the model. We hope the appreciation of the complex activity that can be generated by the MSN network will be valuable to provide insight into the roles of the various other striatal components and thus the role of the striatum in behavior and cognition.
6. Conclusion
We previously showed that the MSN network could produce sequences of cell assembly activations when the network receives a fixed pattern of constant input excitation. We here extend this work to consider what happens when the input varies as it would in the more realistic situation of an animal engaged in behavior. We show that the sequence of cell assembly activations can be locked to the input sequence and we outline the range of parameters where this property arises.
Conflict of Interest Statement
The authors declare that the research was conducted in the absence of any commercial or financial relationships that could be construed as a potential conflict of interest.
References
Aldridge, J. W., and Berridge, K. C. (1998). Coding of serial order by neostriatal neurons: a natural action approach to movement sequence. J. Neurosci. 18, 2777–2787.
Amit, D. J., and Brunel, N. (1997). Dynamics of a recurrent network of spiking neurons before and following learning. Network 8, 373–404.
Andalman, A. S., and Fee, M. S. (2009). A basal ganglia-forebrain circuit in the songbird biases motor output to avoid vocal errors. Proc. Natl. Acad. Sci. U.S. A. 106, 12518–12523.
Barbieri, F., and Brunel, N. (2008). Can attractor network models account for the statistics of firing during persistent activity in prefrontal cortex? Front. Neurosci. 2:115. doi:10.3389/neuro.01.003.2008
Bar-Gad, I., and Bergman, H. (2001). Stepping out of the box: information processing in the neural networks of the basal ganglia. Curr. Opin. Neurobiol. 11, 689–695.
Bar-Gad, I., Morris, G., and Bergman, H. (2003). Information processing, dimensionality reduction and reinforcement learning in the basal ganglia. Prog. Neurobiol. 71, 439–473.
Barnes, T. D., Kubota, Y., Hu, D., Jin, D. Z., and Graybiel, A. M. (2005). Activity of striatal neurons reflects dynamic encoding and recoding of procedural memories. Nature 437, 1158–1161.
Beiser, D. G., and Houk, J. C. (1998). Model of cortical-basal ganglionic processing: encoding the serial order of sensory events. J. Neurophysiol. 79, 3168–3188.
Bertchinger, N., and NatschlÃger, T. (1995). Real-time computation at the edge of chaos in recurrent neural networks. Neural Comput. 16, 1413–1436.
Brotchie, P., Iansek, R., and Horne, M. K. (1991). Motor functions of the monkey globus pallidus. II. Cognitive aspects of movement and phasic neuronal activity. Brain 114, 1685–1702.
Brown, J., Bullock, D., and Grossberg, S. (1999). How the basal ganglia use parallel excitatory and inhibitory learning pathways to selectively respond to unexpected rewarding cues. J. Neurosci. 19, 10502–10511.
Brunel, N., and Hakim, V. (1999). Fast global oscillations in networks of integrate-and-fire neurons with low firing rates. Neural Comput. 11, 1621–1671.
Buonomano, D. V., and Maass, W. (2009). State-dependent computations: spatiotemporal processing in cortical networks. Nat. Rev. Neurosci. 10, 113–125.
Buonomano, D. V., and Merzenich, M. M. (1995). Temporal information transformed into a spatial code by a neural network with realistic properties. Science 267, 1028–1030.
Burrage, K., and Platen, E. (1994). Runge-Kutta methods for stochastic differential equations. Ann. Numer. Math. 1, 63–78.
Carrillo-Reid, L., Tecuapetla, F., Tapia, D., Hernandez-Cruz, A., Galarraga, E., Drucker-Colin, R., and Bargas, J. (2008). Encoding network states by striatal cell assemblies. J. Neurophysiol. 99, 1435.
Churchland, M. M., Yu, B. M., Cunningham, J. P., Sugrue, L. P., Cohen, M. R., Corrado, G. S., Newsome, W. T., Clark, A. M., Hosseini, P., Scott, B. B., Bradley, D. C., Smith, M. A., Kohn, A., Movshon, J. A., Armstrong, K. M., Moore, T., Chang, S. W., Snyder, L. H., Ryu, S. I., Santhanam, G., Sahani, M., and Shenoy, K. V. (2010). Stimulus onset quenches neural variability: a widespread cortical phenomenon. Nat. Neurosci. 13, 369–378.
Churchland, M. M., Yu, B. M., Ryu, S. I., Santhanam, G., and Shenoy, K. V. (2006). Neural variability in premotor cortex provides a signature of motor preparation. J. Neurosci. 26, 3697–3712.
Compte, A., Constantinidis, C., Tegnaer, J., Raghavachari, S., Chafee, M. V., Goldman-Rakic, P. S., and Wang, X.-J. (2003). Temporally irregular mnemonic persistent activity in prefrontal neurons of monkeys during a delayed response task. J. Neurophysiol. 90, 3441–3454.
Czubayko, U. Â., and Plenz, D. (2002). Fast synaptic transmission between striatal spiny projection neurons. Proc. Natl. Acad. Sci. U.S.A. 99, 15764–15769.
DeLong, M. R. (1973). Putamen: activity of single units during slow and rapid arm movements. Science 179, 1240–1242.
Destexhe, A., Mainen, Z. F., and Sejnowski, T. J. (1998). “Kinetic models of synaptic transmission,” in Methods in Neuronal Modeling, 2nd Edn, eds C. Koch and I. Segev (Cambridge, MA: MIT Press), 1–26.
Doya, K. (2000). Complementary roles of the basal ganglia and cerebellum in learning and motor control. Curr. Opin. Neurobiol. 10, 732–739.
Doya, K., and Sejnowski, T. J. (1996). “A novel reinforcement model of birdsong vocalization learning,” in Advances in Neural Information Processing 7, eds G. Tesauro, D. S. Touretzky, and T. K. Leen (Cambridge, MA: MIT Press), 101–108.
Ermentrout, G. B. (1998). Neural networks as spatio-temporal pattern-forming systems. Rep. Prog. Phys. 61, 353–430.
Fukai, T., and Tanaka, S. (1997). A simple neural network exhibiting selective activation of neuronal ensembles: from winner-take-all to winners-share-all. Neural Comput. 9, 77–97.
Gardiner, T. W., and Kitai, S. T. (1992). Single-unit activity in the globus pallidus and neostriatum of the rat during performance of a trained head movement. Exp. Brain Res. 88, 517–530.
Gluckenheimer, J., and Holmes, P. (1983). Non-linear Oscillations, Dynamical Systems and Bifurcations of Vector Fields. Berlin: Springer, 1983.
Goldberg, J. H., Adler, A., Bergman, H., and Fee, M. S. (2010). Singing-related neural activity distinguishes two putative pallidal cell types in the songbird basal ganglia: comparison to the primate internal and external pallidal segments. J. Neurosci. 30, 7088–7098.
Groves, P. M. (1983). A theory of the functional organization of the neostriatum and the neostriatal control of voluntary movement. Brain Res. 286, 109–132.
Gurney, K., Prescott, T. J., and Redgrave, P. (2001). A computational model of action selection in the basal ganglia II: analysis and simulation of behaviour. Biol. Cybern. 85, 411–423.
Hikosaka, O., Nakamura, K., and Nakahara, H. (2006). Basal ganglia orient eyes to reward. J. Neurophysiol. 95, 567–584.
Hikosaka, O., Sakamoto, M., and Usui, S. (1989). Functional properties of monkey caudate neurons I. Activities related to saccadic eye movements. J. Neurophysiol. 61, 780–798.
Hikosaka, O., Takikawa, Y., and Kawagoe, R. (2000). Role of the basal ganglia in the control of purposive saccadic eye movements. Physiol. Rev. 80, 953–978.
Holt, G. R., Softky, W. R., Koch, C., and Douglas, R. J. (1996). Comparison of discharge variability in vitro and in vivo in cat visual cortex neurons. J. Neurophysiol. 75, 1806–1814.
Huerta, R., and Rabinovich, M. I. (2004). Reproducible sequence generation in random neural ensembles. Phys. Rev. Lett. 93, 238104.
Humphries, M. D. (2011). Spike-train communities: finding groups of similar spike trains. J. Neurosci. 31, 2321–2336.
Humphries, M. D., Stewart, R. D., and Gurney, K. N. (2006). A physiologically plausible model of action selection and oscillatory activity in the basal ganglia. J. Neurosci. 26, 12921–12942.
Humphries, M. D., Wood, R. D., and Gurney, K. N. (2009). Dopamine-modulated dynamic cell assemblies generated by the GABAergic striatal microcircuit. Neural Netw. 22, 1174–1188.
Izhikevich, E. M. (2005). Dynamical Systems in Neuroscience: The Geometry of Excitability and Bursting. Cambridge, MA: MIT press.
Jaeger, D., Gilman, S., and Aldridge, J. W. (1995). Neuronal activity in the striatum and pallidum of primates related to the execution of externally cued reaching movements. Brain Res. 694, 111–127.
Jaeger, H., and Hass, H. (2004). Harnessing Nonlinearity: predicting chaotic systems and saving energy in wireless communication. Science 304, 78.
Janssen, M. J., Ade, K. K., Fu, Z., and Vicini, S. (2009). Dopamine modulation of GABA tonic conductance in striatal output neurons. J. Neurosci. 29, 5116–5126.
Jin, D. Z., Fujii, N., and Graybiel, A. M. (2009). Neural representation of time in cortico-basal ganglia circuits. Proc. Natl. Acad. Sci. U.S.A. 106, 19156–19161.
Jog, M. S., Kubota, Y., Connolly, C. I., Hillegaart, V., and Graybiel, A. M. (1999). Building neural representations of habits. Science 286, 1745–1749.
Joshua, M., Adler, A., Rosin, B., Vaadia, E., and Bergman, H. (2009). Encoding of probabilistic rewarding and aversive events by pallidal and nigral neurons. J. Neurophysiol. 101, 758–772.
Kao, M. H., Doupe, A. J., and Brainard, M. S. (2005). Contributions of an avian basal ganglia-forebrain circuit to real-time modulation of song. Nature 433, 638–643.
Karmarkar, U. R., and Buonomano, D. V. (2007). Timing in the absence of clocks: encoding time in neural network states. Neuron 53, 427–438.
Kasanetz, F., Riquelme, L. A., O’Donnell, P., and Murer, M. G. (2006). Turning off cortical ensembles stops striatal up states and elicits phase perturbations in cortical and striatal slow oscillations in rat in vivo. J. Physiol. (Lond.) 577, 97–113.
Kermadi, I., and Joseph, J. P. (1995). Activity in the caudate nucleus of monkey during spatial sequencing. J. Neurophysiol. 74, 911–933.
Kimura, M. (1990). Behaviorally contingent property of movement-related activity of the primate putamen. J. Neurophysiol. 63, 1277–1296.
Kimura, M., Aosaki, T., Hu, Y., Ishida, A., and Watanabe, K. (1992). Activity of primate putamen neurons is selective to a mode of voluntary movement: visually guided, self-initiated or memory-guided. Exp. Brain Res. 89, 473–477.
Koos, T., Tepper, J. M., and Wilson, C. J. (2004). Comparison of IPSCs evoked by spiny and fast-spiking neurons in the neostriatum. J. Neurosci. 24, 7916–7922.
Kubota, Y., Liu, J., Hu, D., DeCoteau, W. E., Eden, U. T., Smith, A. C., and Graybiel, A. M. (2009). Stable encoding of task structure coexists with flexible coding of task events in sensorimotor striatum. J. Neurophysiol. 102, 2142–2160.
Lee, D., Port, N. L., Kruse, W., and Georgopoulos, A. P. (1998). Variability and correlated noise in the discharge of neurons in motor and parietal areas of the primate cortex. J. Neurosci. 18, 1161–1170.
Levi, R., Varona, P., Arshavsky, Y. I., Rabinovich, M. I., and Selverston, A. I. (2004). Dual sensory-motor function for a molluskan statocyst network. J. Neurophysiol. 91, 336–345.
Maass, W., Natschlager, T., and Markram, H. (2002). Real-time computing without stable states: a new framework for neural computation based on perturbations. Neural Comput. 14, 2531–2560.
McCarthy, M. M., Moore-Kochlacs, C., Gu, X., Boyden, E. S., Han, X., and Kopell, N. (2011). Striatal origin of the pathologic beta oscillations in Parkinsons disease. Proc. Natl. Acad. Sci. U.S.A. 108, 11620–11625.
McGeorge, A. J., and Faull, R. L. (1989). The organization of the projection from the cerebral cortex to the striatum in the rat. Neuroscience 29, 503–537.
Miller, B. R., Walker, A. G., Shah, A. S., Barton, S. J., and Rebec, G. V. (2008). Dysregulated information processing by medium spiny neurons in striatum of freely behaving mouse models of Huntingtons disease. J. Neurophysiol. 100, 2205–2216.
Mitchell, J. F., Sundberg, K. A., and Reynolds, J. J. (2007). Differential attention dependent response modulation across cell classes in macaque visual area V4. Neuron 55, 131–41.
Miura, K., Tsubo, Y., Okada, M., and Fukai, T. (2007). Balanced excitatory and inhibitory inputs to cortical neurons decouple firing irregularity from rate modulations. J. Neurosci. 27, 13802–13812.
Mushiake, H., and Strick, P. L. (1996). Pallidal neuron activity during sequential arm movements. J. Neurophysiol. 74, 2754–2758.
Nevet, A., Morris, G., Saban, G., Arkadir, D., and Bergman, H. (2007). Lack of spike-count and spike-time correlations in the substantia nigra reticulata despite overlap of neural responses. J. Neurophysiol. 98, 2232–2243.
Nowotny, T., and Rabinovich, M. I. (2007). Dynamical origin of independent spiking and bursting activity in neural microcircuits. Phys. Rev. Lett. 98, 128106.
Olveczky, B. P., Andalman, A. S., and Fee, M. S. (2005). Vocal experimentation in the juvenile songbird requires a basal ganglia circuit. PLoS Biol. 3, e153. doi:10.1371/journal.pbio.0030153
Oorschot, D. E. (1996). Total number of neurons in the neostriatal, pallidal, subthalamic, and substantia nigral nuclei of of the rat basal ganglia. J. Comp. Neurol. 366, 580–599.
Pehlevan, C., and Sompolinsky, H. (2011). Sensory selectivity in random cortical circuits. Program No. 624.09, 2011 Neuroscience Meeting Planner. Washington, DC: Society for Neuroscience.
Planert, H., Szydlowski, S. N., Hjorth, J. J. J., Grillner, S., and Silberberg, G. (2010). Dynamics of synaptic transmission between fast-spiking interneurons and striatal projection neurons of the direct and indirect pathways. J. Neurosci. 30, 3499–3507.
Plenz, D. (2003). When inhibition goes incognito: feedback interaction between spiny projection neurons in striatal function. Trends Neurosci. 26, 436–443.
Ponzi, A., and Wickens, J. (2008a). Multiscale switching cell assembly clusters naturally emerge in simulations of random inhibitory networks of Hodgkin Huxley neurons. Program No. 670.9, 2008 Neuroscience Meeting Planner. Washington, DC: Society for Neuroscience, Online.
Ponzi, A., and Wickens, J. (2008b). Cell assemblies in large sparse inhibitory networks of biologically realistic spiking neurons advances. NIPS 21, 1273–1281.
Ponzi, A., and Wickens, J. (2009). A balanced striatal network model. Program No. 845.21, 2009 Neuroscience Meeting Planner. Chicago, IL: Society for Neuroscience. Online.
Ponzi, A., and Wickens, J. (2010a). Sequentially switching cell assemblies in random inhibitory networks of spiking neurons in the striatum. J. Neurosci. 30, 5894–5911.
Ponzi, A., and Wickens, J. (2010b). Input dependent cell assembly dynamics in an inhibitory spiking network model. Program No. 380.19, 2010 Neuroscience Meeting Planner. San Diego, CA: Society for Neuroscience, Online.
Ponzi, A., and Wickens, J. (2011). “Input dependent variability in a model of the striatal medium spiny neuron network,” in Proceedings of ICCN, The Third International Conference on Cognitive Neurodynamics, Hokkaido.
Rabinovich, M., Huerta, R., and Laurent, G. (2008a). Transient dynamics for neural processing. Science 321, 48–50.
Rabinovich, M. I., Huerta, R., Varona, P., and Afraimovich, V. S. (2008b). Transient cognitive dynamics, metastability, and decision making. PLoS Comput. Biol. 4, e1000072. doi:10.1371/journal.pcbi.1000072
Rabinovich, M., Volkovskii, A., Lecanda, P., Huerta, R., Abarbanel, H. D. I., and Laurent, G. (2001). Dynamical encoding by networks of competing neuron groups: winnerless competition. Phys. Rev. Lett. 87, U149–U151.
Rabinovich, M. I., Huerta, R., Volkovskii, A., Abarbanel, H. D. I., Stopfer, M., and Laurent, G. (2000). Dynamical coding of sensory information with competitive networks. J. Physiol. Paris 94, 465.
Rajan, K., Abbott, L. F., and Sompolinsky, H. (2010). Stimulus-dependent suppression of chaos in recurrent neural networks. Phys. Rev. E Stat. Nonlin. Soft Matter Phys. 82, 011903.
Rall, W. (1967). Distinguishing theoretical synaptic potentials computed for different soma-dendritic distributions of synaptic input. J. Neurophysiol. 30, 1138–1168.
Renart, A., Moreno-Bote, R., Wang, X.-J., and Parga, N. (2007). Mean-driven and fluctuation-driven persistent activity in recurrent networks. Neural Comput. 19, 1–46.
Schneidman, E., Berry, M. J., Segev, R., and Bialek, W. (2006). Weak pairwise correlations imply strongly correlated network states in a neural population Nature 440, 1007–1012.
Shadlen, M. N., and Newsome, W. T. (1998). The variable discharge of cortical neurons: implications for connectivity, computation, and information coding. J. Neurosci. 18, 3870–3896.
Softky, W. R., and Koch, C. (1993). The highly irregular firing of cortical cells is inconsistent with temporal integration of random EPSPs. J. Neurosci. 13, 334–350.
Suri, R. E., and Schultz, W. (1999). A neural network model with dopamine-like reinforcement signal that learns a spatial delayed response task. Neuroscience 91, 871–890.
Sutton, R. S., and Barto, A. G. (1998). Reinforcement Learning: An Introduction. Cambridge: MIT Press.
Taverna, S., Ilijic, E., and Surmeier, D. J. (2008). Recurrent collateral connections of striatal medium spiny neurons are disrupted in models of Parkinsons disease. J. Neurosci. 28, 5504–5512.
Taverna, S., van Dongen, Y. C., Groenewegen, H. J., and Pennartz, C. M. A. (2004). Direct physiological evidence for synaptic connectivity between medium-sized spiny neurons in rat nucleus accumbens in situ. J. Neurophysiol. 91, 1111–1121.
Tecuapetla, F., Koos, T., Tepper, J. M., Kabbani, N., and Yeckel, M. F. (2004). Differential dopaminergic modulation of neostriatal synaptic connections of striatopallidal axon collaterals. J. Neurosci. 29, 8977–8990.
Tepper, J. M., Koos, T., and Wilson, C. J. (2004). GABAergic microcircuits in the neostriatum. Trends Neurosci. 27, 662–669.
Tomko, G., and Crapper, D. (1974). Neuronal variability: non-stationary responses to identical visual stimuli. Brain Res. 79, 405–418.
Tsuda, I., Fujii, H., Tadokoro, S., Yasuoka, T., and Yamaguti, Y. (2004). Chaotic itinerancy as a mechanism of irregular changes between synchronization and desynchronization in a neural network. J. Integr. Neurosci. 3, 159–182.
Tunstall, M. J., Oorschot, D. E., Keen, A., and Wickens, J. R. (2002). Inhibitory interactions between spiny projection neurons in the rat striatum. J. Neurophysiol. 88, 1263–1269.
Usher, M., Stemmler, M., Koch, C., and Olami, Z. (1994). Network amplification of local fluctuations causes high spike rate variability, fractal firing patterns and oscillatory local field potentials. Neural Comput. 6, 795–836.
Usher, M., Stemmler, M., and Olami, Z. (1995). Dynamic pattern formation leads to 1/f noise in neural populations. Phys. Rev. Lett. 74, 326.
van Vreeswijk, C., and Hansel, D. (2011). Balanced network model of orientation selectivity in primary visual cortex without orientation map. Program No. 175.12, 2011 Neuroscience Meeting Planner. Washington, DC: Society for Neuroscience, Online.
van Vreeswijk, C., and Sompolinsky, H. (1996). Chaos in neuronal networks with balanced excitatory and inhibitory activity. Science 274, 6.
West, M. O., Carelli, R. M., Pomerantz, M., Cohen, S. M., Gardnet, J. P., Chapin, J. K., and Woodward, D. J. (1990). A region in the dorsolateral striatum of the rat exhibiting single-unit correlations with specific locomotor limb movements. J. Neurophysiol. 64, 1233–1246.
Wickens, J. R., Alexander, M. E., and Miller, R. (1991). Two dynamic modes of striatal function under dopaminergic-cholinergic control: simulation and analysis of a model. Synapse 8, 1–12.
Wickens, J. R., Arbuthnott, G., and Shindou, T. (2007). Simulation of GABA function in the basal ganglia: computational models of GABAergic mechanisms in basal ganglia function. Prog. Brain Res. 160, 316.
Wickens, J. R., and Wilson, C. J. (1998). Regulation of action-potential firing in spiny neurons of the rat neostriatum in vivo. J. Neurophysiol. 79, 2358–2364.
Wilson, C. J. (1993). The generation of natural firing patterns in neostriatal neurons. Prog. Brain Res. 99, 277.
Wilson, C. J., and Kawaguchi, Y. (1996). The origins of two-state spontaneous membrane potential fluctuations of neostriatal spiny neurons. J. Neurosci. 16, 2397–2410.
Wilson, C. J., and Nisenbaum, E. S. (1995). Potassium currents responsible for inward and outward rectification in rat neostriatal spiny projection neurons. J. Neurosci. 75, 4449–4463.
Yim, M. Y., Aertsen, A., and Kumar, A. (2011). Significance of input correlations in striatal function. PLoS Comput. Biol. 7, e1002254. doi:10.1371/journal.pcbi.1002254
Zheng, T., and Wilson, C. J. (2002). Corticostriatal combinatorics: the implications of corticostriatal axonal arborizations. J. Neurophysiol. 87, 1007–1017.
Keywords: striatum, computational modeling, inhibition, medium spiny neuron, cell assembly, population dynamics, spiking network
Citation: Ponzi A and Wickens J (2012) Input dependent cell assembly dynamics in a model of the striatal medium spiny neuron network. Front. Syst. Neurosci. 6:6. doi: 10.3389/fnsys.2012.00006
Received: 20 April 2011; Accepted: 04 February 2012;
Published online: 12 March 2012.
Edited by:
Charles J. Wilson, University of Texas at San Antonio, USAReviewed by:
Joshua D. Berke, University of Michigan, USAMark D. Humphries, Group for Neural Theory, LNC, DEC, ENS, France
Copyright: © 2012 Ponzi and Wickens. This is an open-access article distributed under the terms of the Creative Commons Attribution Non Commercial License, which permits non-commercial use, distribution, and reproduction in other forums, provided the original authors and source are credited.
*Correspondence: Adam Ponzi, Okinawa Institute of Science and Technology, 12-22 Suzaki, Uruma-shi, Okinawa, Japan. e-mail: adamp@oist.jp