Dietary Fiber Intake Is Related to Skeletal Muscle Mass, Body Fat Mass, and Muscle-to-Fat Ratio Among People With Type 2 Diabetes: A Cross-Sectional Study
 Fuyuko Takahashi1
  Yoshitaka Hashimoto1*
  Ayumi Kaji1 Ryosuke Sakai1 Yuka Kawate1
  Takuro Okamura1
  Hiroshi Okada1
  Noriyuki Kitagawa1,2
  Naoko Nakanishi1 Saori Majima1
  Takafumi Osaka1 Takafumi Senmaru1
  Emi Ushigome1 Mai Asano1
  Masahide Hamaguchi1 Masahiro Yamazaki1
  Michiaki Fukui1
- 1Department of Endocrinology and Metabolism, Graduate School of Medical Science, Kyoto Prefectural University of Medicine, Kyoto, Japan
- 2Department of Diabetology, Kameoka Municipal Hospital, Kameoka, Japan
Objectives: To investigate the relationship between dietary fiber intake and skeletal muscle mass, body fat mass, and muscle-to-fat ratio (MFR) among men and women with type 2 diabetes (T2D).
Methods: This cross-sectional study involved 260 men and 200 women with T2D. Percent skeletal muscle mass (%) or percent body fat mass (%) was calculated as (appendicular muscle mass [kg] or body fat mass [kg]/body weight [kg]) × 100. MFR was calculated as appendicular muscle mass divided by body fat mass. Information about dietary fiber intake (g/day) was obtained from a brief-type self-administered diet history questionnaire.
Results: Dietary fiber intake was correlated with percent body fat mass (r = –0.163, p = 0.021), percent skeletal muscle mass (r = 0.176, p = 0.013), and MFR (r = 0.157, p = 0.026) in women. However, dietary fiber intake was not correlated with percent body fat mass (r = –0.100, p = 0.108), percent skeletal muscle mass (r = 0.055, p = 0.376), and MFR (r = 0.065, p = 0.295) in men. After adjusting for covariates, dietary fiber intake was correlated with percent body fat mass (β = 0.229, p = 0.009), percent skeletal muscle mass (β = 0.364, p < 0.001), and MFR (β = 0.245, p = 0.006) in women. Further, dietary fiber intake was related to percent skeletal muscle mass (β = 0.221, p = 0.008) and tended to be correlated with percent body fat mass (β = 0.148, p = 0.071) in men.
Conclusion: Dietary fiber intake was correlated with skeletal muscle mass, body fat mass, and MFR among women with T2D.
Introduction
There are increasing the number of elderly people with type 2 diabetes (T2D) (1). Diabetes accelerates muscle catabolism via insulin resistance and attenuating insulin signaling (2), causing rapidly loss of muscle mass and strength (3). Furthermore, older people with T2D frequently have sarcopenia (4), which is defined as the loss of muscle mass, strength, and function related to aging (5). Muscles are the main organs responsible for glucose metabolism in the body (6). Therefore, it is a critical target for treatment of T2D. A tight relationship between muscle atrophy and high visceral fat exists (7, 8). Muscle atrophy is caused by proinflammatory cytokines such as tumor necrosis factor-α (TNF-α) and interleukin-6 (IL-6) secreted from fat cells enlarged by obesity (9). Further, fat accumulation increases the risk factor for cardiovascular diseases (10) and all-cause death (11). The muscle-to-fat ratio (MFR) is a marker of cardiometabolic conditions and chronic kidney disease among the elderly people (12, 13). MFR is a marker of sarcopenic obesity, which is defined as the coexistence of sarcopenia and obesity (14). Compared with sarcopenia alone, sarcopenic obesity is a greater risk of microvascular complications (15) and mortality (16, 17) among patients with T2D.
Dietary fiber intake can improve glycemic control and decrease hyperinsulinemia and plasma lipid concentrations in people with T2D (18). A high dietary fiber intake is reported to be associated with a low risk of all-cause death and cardiometabolic disease (19). This association seems to be mediated partly by the effect of dietary fiber on body mass (20). Dietary fiber delays the movement of food from the stomach to the intestines, therefore causing digestion and absorption of carbohydrates to be slowed and blood glucose levels to be raised slowly (21). Insulin is secreted when blood glucose levels rise, which functions to import glucose into cells; however, it also synthesizes and stores excess glucose as glycogen and triglycerides (22). Therefore, it is useful to slow the rise of postprandial blood glucose to prevent the fat accumulation. Previous studies reported that a high dietary fiber intake was related to a greater lean mass and a lower fat mass (23) and a decreased prevalence of sarcopenia (24). Moreover, a higher dietary fiber consumption was related to a lower visceral adiposity and multiple biomarker levels implicated in inflammation (25). However, the association between dietary fiber intake and body compositions, such as skeletal muscle mass, body fat mass, and MFR in people with T2D is unknown. Therefore, this cross-sectional study examined this relationship among men and women with T2D, individually.
Materials and Methods
Study Participants
The KAMOGAWA-DM cohort study, a prospective cohort study, has begun in 2014 and continues now (26). It enrolled outpatients in the Department of Endocrinology and Metabolism, Kyoto Prefectural University of Medicine Hospital (Kyoto, Japan), and the Department of Diabetology, Kameoka Municipal Hospital (Kameoka, Japan). Patients who completed the questionnaire from January 2015 to September 2021 were enrolled in the cross-sectional research. The exclusion criteria were follows: patients without T2D, those with incomplete answers to the questionnaire, and those without data about multifrequency impedance body composition analyzer findings. The present study was approved by the local research ethics committee (no. RBMR-E-466-6) and was performed in accordance with the Declaration of Helsinki. A written informed consent was gathered from all participants.
Data Collection
Family history and duration of diabetes, the habit of smoking, and the habit of exercise were obtained using a standardized questionnaire. Participants were separated according to smoking status (smokers and non-smokers). Exercising regularly was determined as constantly playing some kind of sport > 1 times per week. Furthermore, venous blood samples were obtained from patients after an overnight fast, and the fasting plasma glucose, the hemoglobin A1c (HbA1c), creatinine (Cr), triglyceride, and high-density lipoprotein cholesterol levels were assessed. The estimated glomerular filtration rate (eGFR) was estimated from the Japanese Society of Nephrology equation, which is as follows: eGFR = 194 × Cr–1.094 × age–0.287 (mL/min/1.73 m2) (× 0.739, if woman) (27). Blood pressure was evaluated using the HEM-906 device (OMRON, Kyoto, Japan) in a quiet space after 5 min of rest. Data about the medications for diabetes, including sodium glucose cotransporter-2 (SGLT2) inhibitors, insulin, metformin, and antihypertensive drugs were gathered from the medical records. Hypertension was defined as usage of antihypertensive drugs and/or blood pressure of ≥ 140/90 mmHg.
Definition of Percent Skeletal Muscle Mass, Percent Body Fat Mass, and Muscle-to-Fat Ratio
Body weight (kg), appendicular muscle mass (kg), and body fat mass (kg) were assessed via InBody 720, which is a multifrequency impedance body composition analyzer (InBody Japan, Tokyo, Japan) (28). Body mass index (BMI, kg/m2) was calculated by dividing body weight in kilogram (kg) by height in meters squared (m2). Ideal body weight (IBW) was regarded as height in meters squared multiplied by 22 (29). Percent body fat mass (%) was calculated as (body fat mass [kg]/body weight [kg]) × 100. Percent skeletal muscle mass was calculated as (appendicular muscle mass/body weight) × 100 (30). MFR was estimated as appendicular muscle mass divided by body fat mass (14).
Data About Habitual Diet Intake
A brief-type self-administered diet history questionnaire (BDHQ) was administered to measure habitual food and nutrient intake during the preceding 1-month period (31). The validation of BDHQ has been reported previously (32, 33). The median (interquartile range) Pearson correlation coefficients between the dietary record and the BDHQ were 0.54 (0.45–0.61) in women and 0.56 (0.41–0.63) in men (32). Data about the intake of energy, fat, carbohydrate, protein, including animal and vegetable proteins, dietary fiber, including soluble and insoluble dietary fiber, and alcohol consumption as well as fiber were collected using the BDHQ. Energy intake (kcal/IBW/day), fat intake (g/IBW/day), carbohydrate intake (g/IBW/day), and protein intake (g/IBW/day), including animal protein intake (g/IBW/day) and vegetable protein intake (g/IBW/day) were estimated. The carbohydrate-to-fiber ratio was calculated as carbohydrate intake divided by fiber intake (34).
Statistical Analyses
Data were presented as means [standard deviation (SD)] or frequencies of potential confounding variables. The characteristics of men and women differed; thus, we analyzed data according to sex.
A correlation analysis was performed using Pearson’s correlation coefficient. We analyzed the correlation between body composition and dietary fiber intake in younger (age < 60 years) and older adults (age ≥ 60 years), separately (35, 36). Moreover, we analyzed the correlation between body composition and soluble or insoluble dietary fiber intake, and the correlation between macronutrient intakes and body composition. Investigating the association of dietary fiber intake with percent skeletal muscle mass, percent body fat mass, and MFR, multiple regression analyses were conducted after adjusting for potential cofounders including age, duration of diabetes, energy intake, the habit of exercise, the habit of smoking, alcohol consumption, HbA1c and creatinine levels, treatment with metformin (37), insulin (38) and SGLT2 inhibitor (39). Statistical analyses were performed using JMP (version 13.2; SAS Institute Inc., Cary, NC, United States) and EZR (Saitama Medical Center, Jichi Medical University, Saitama, Japan) (40), a graphical user interface for R (The R Foundation for Statistical Computing, Vienna, Austria). P-values of < 0.05 were regarded statistically significant.
Results
The current study included 745 people. Among them, 139 who did not carry out the bioelectrical impedance analysis test, 102 without the date of the BDHQ, and 44 without T2D were excluded. Therefore, 460 patients (260 men and 200 women) were finally involved in the present study (Figure 1).
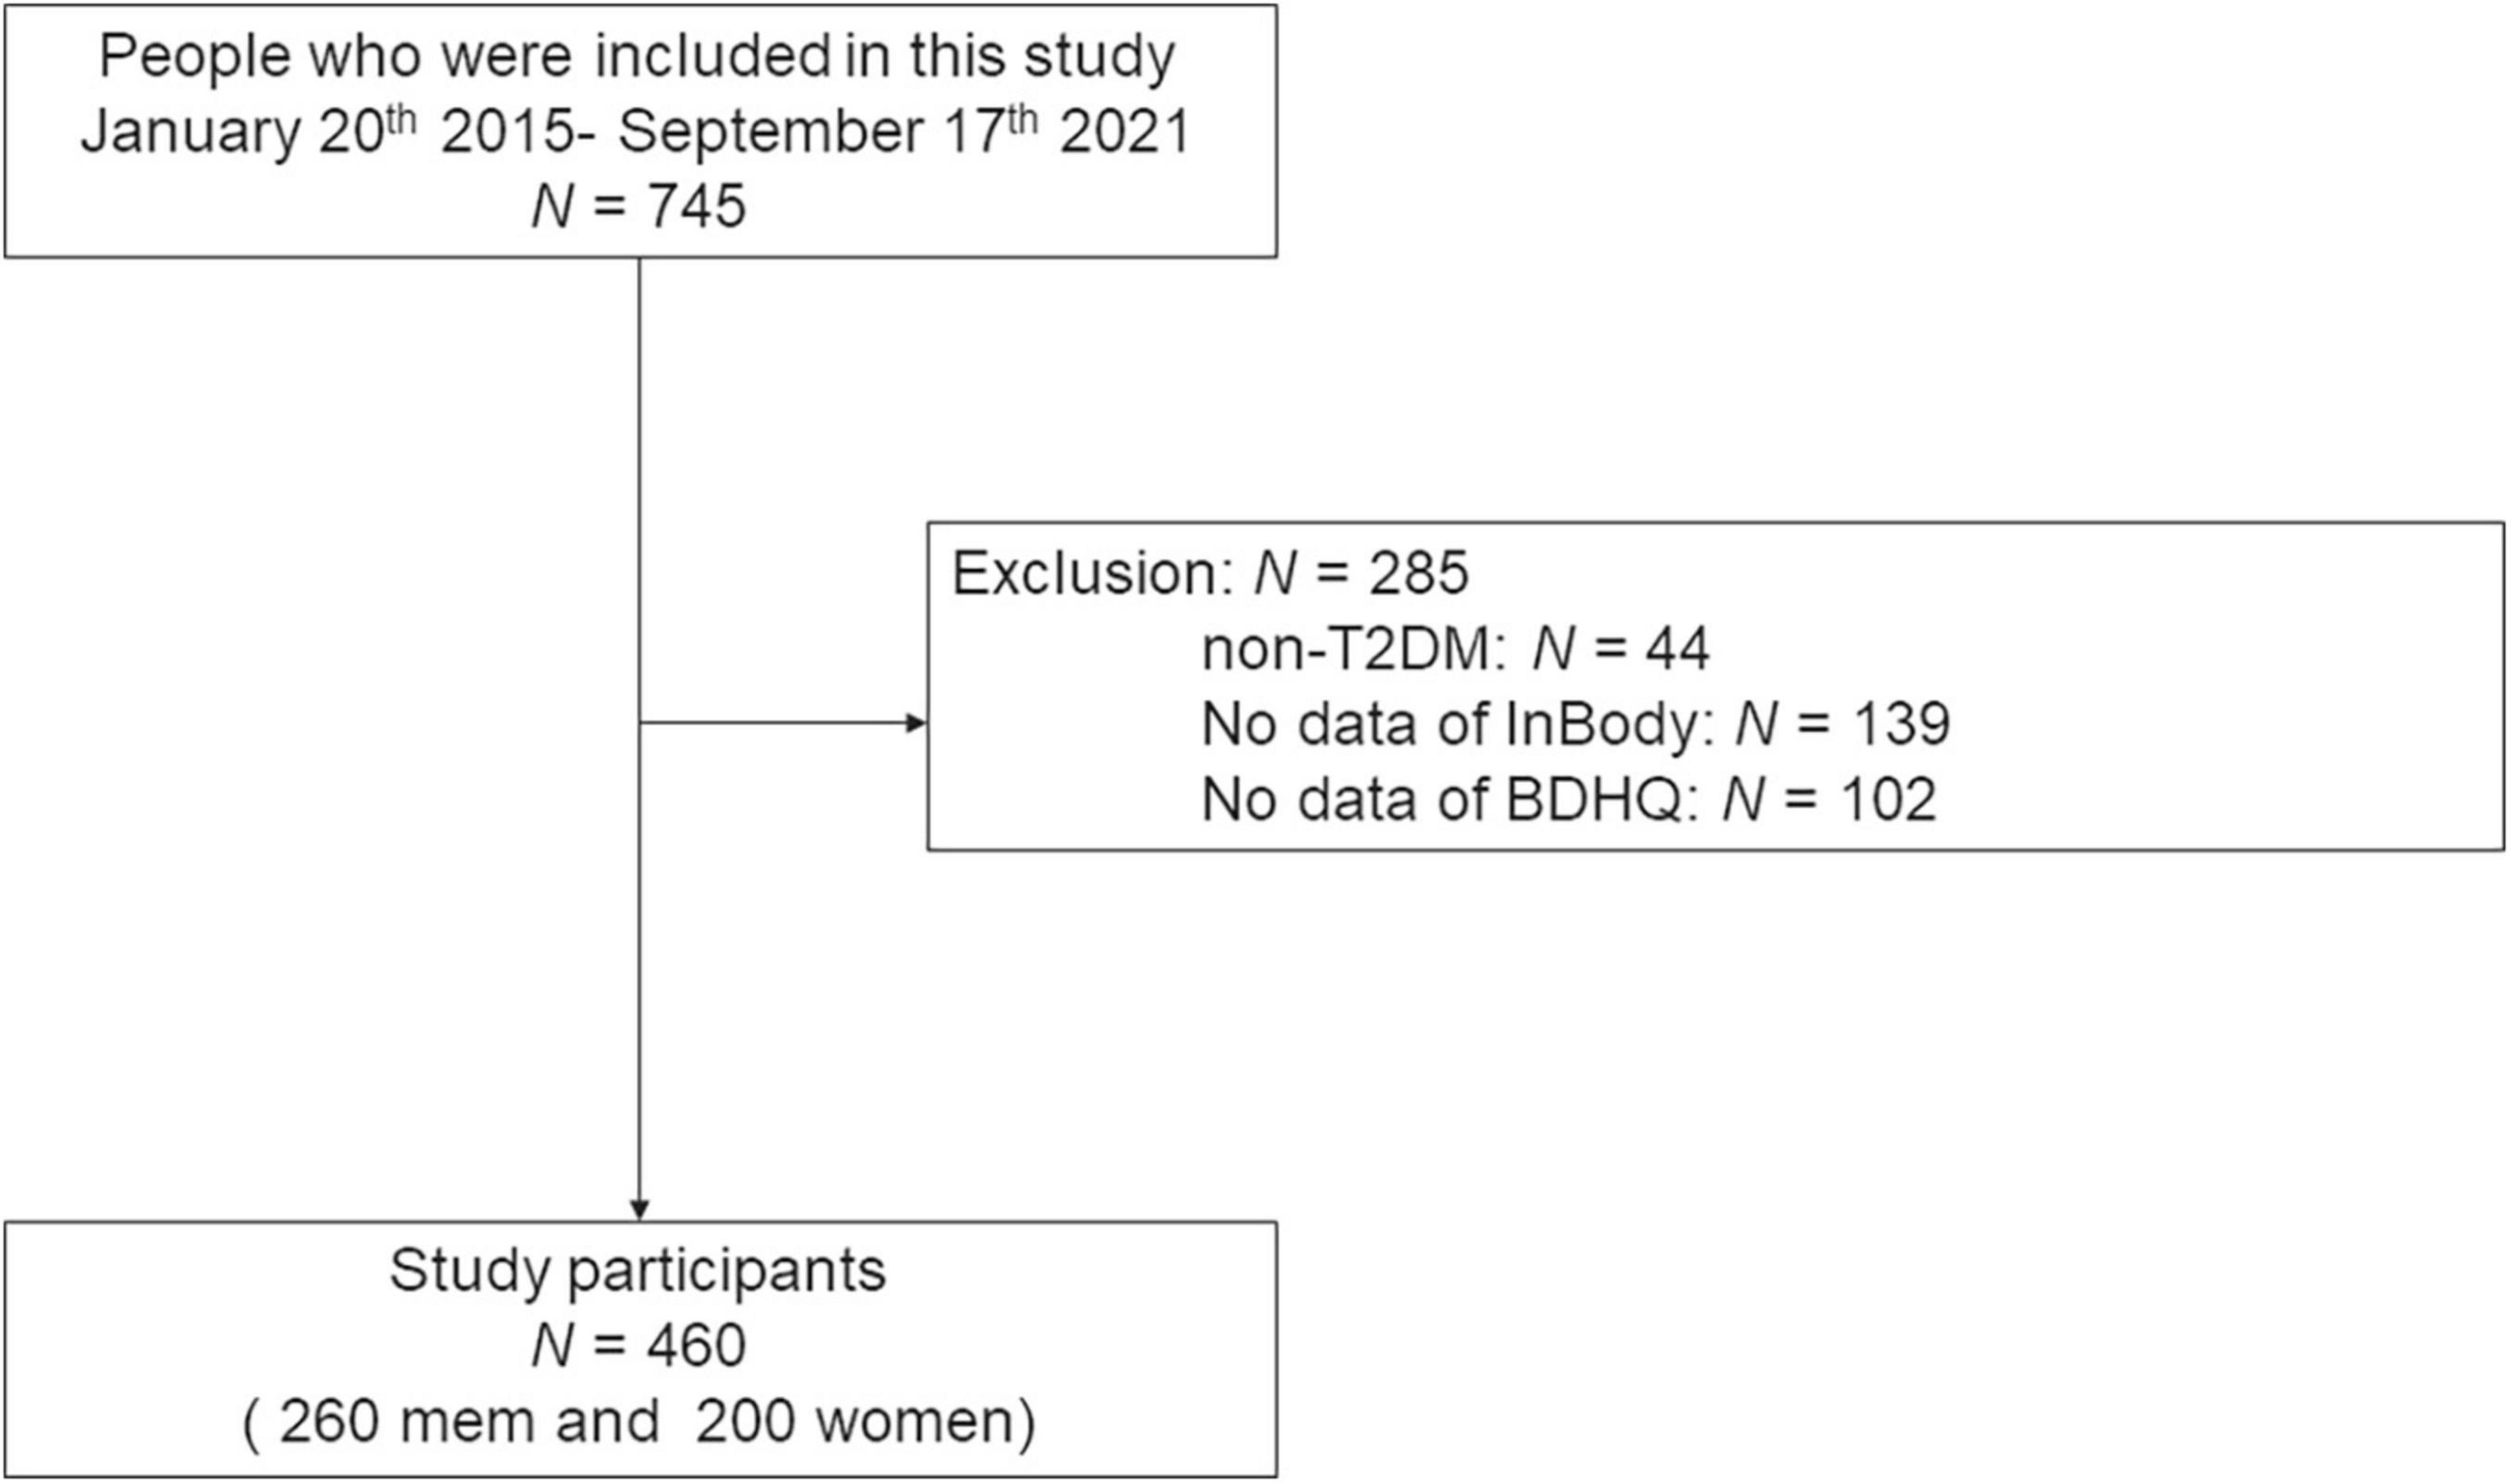
Figure 1. Study flow diagram for the registration of patients.
Table 1 presents the clinical characteristics of the participants. The mean ages were 68.2 ± 10.6 years in men and 66.6 ± 10.8 years in women. The mean BMIs were 23.8 ± 3.7 kg/m2 in men and 25.2 ± 5.6 kg/m2 in women. The mean percent body fat mass and percent skeletal muscle mass were 25.2 ± 7.1 and 31.9 ± 4.4% in men and 34.8 ± 7.8 and 25.4 ± 3.9% in women, respectively. The mean MFRs were 1.5 ± 1.0 in men and 0.8 ± 0.3 in women.
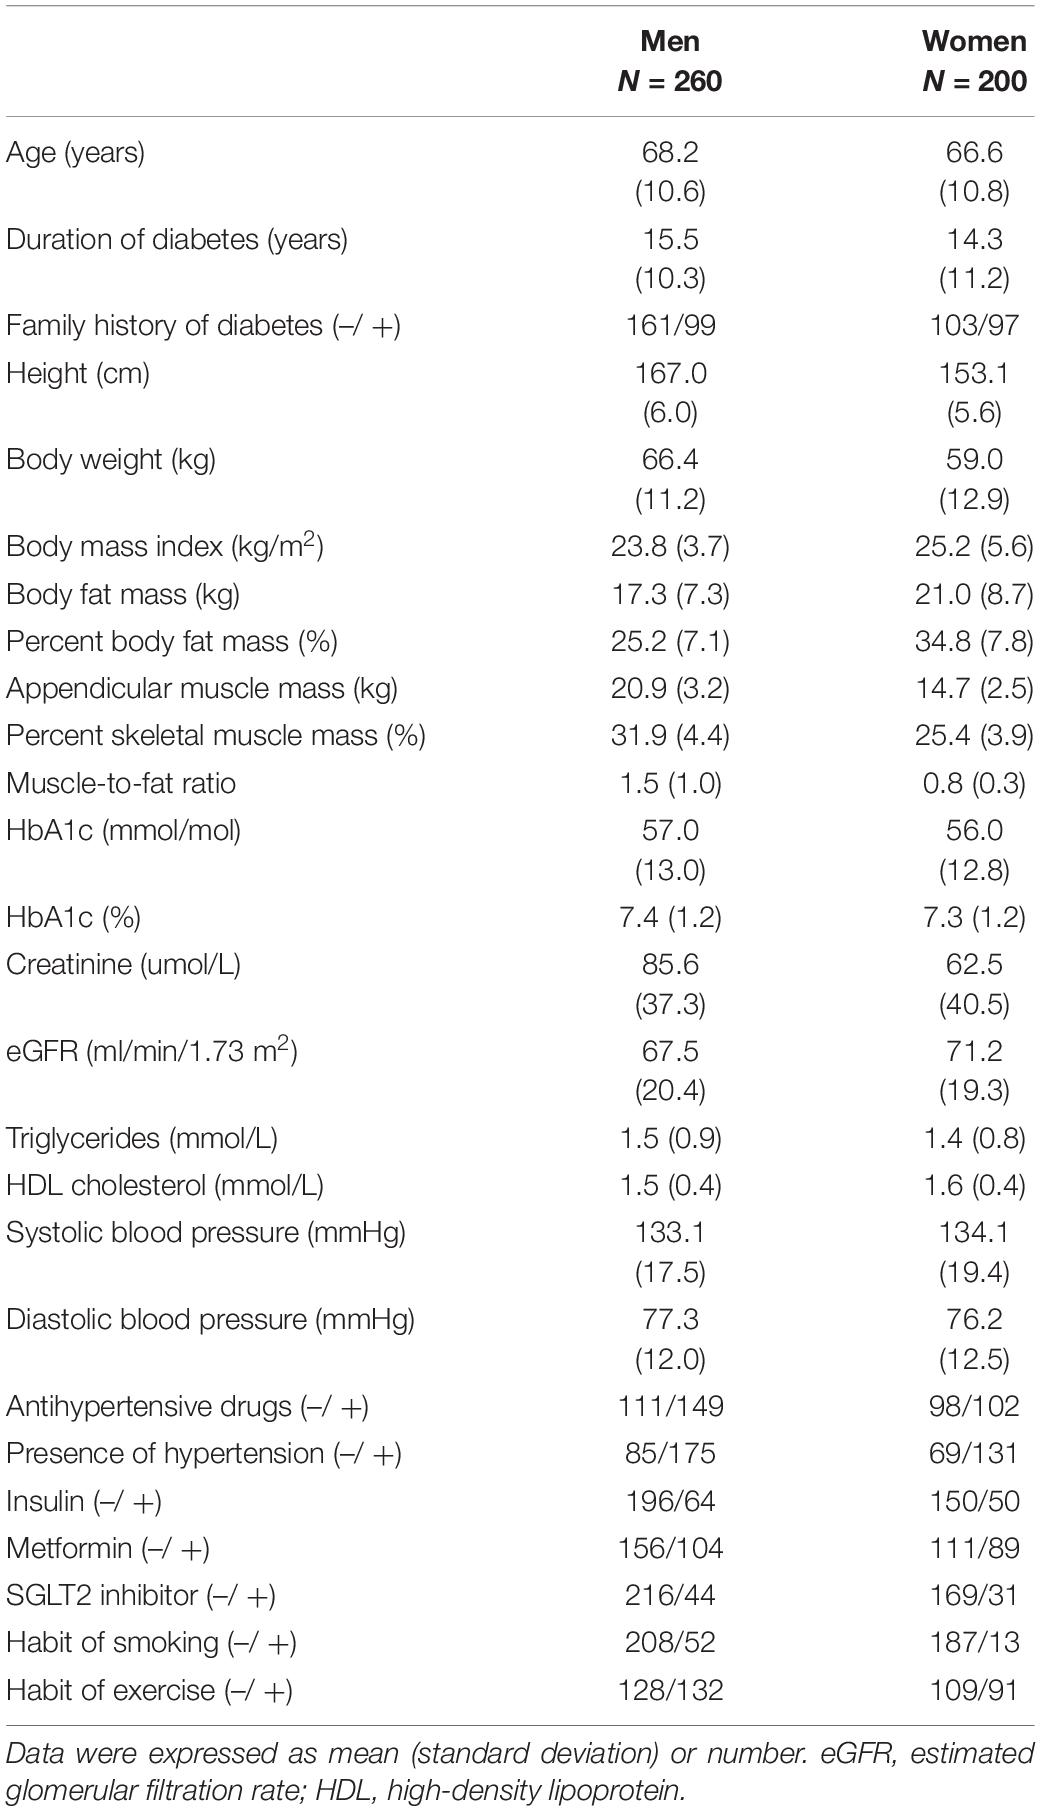
Table 1. Clinical characteristics of study participants.
Table 2 presents the dietary intake of the participants. The mean dietary fiber intakes were 12.8 ± 5.8 g/day in men and 11.7 ± 4.8 g/day in women.
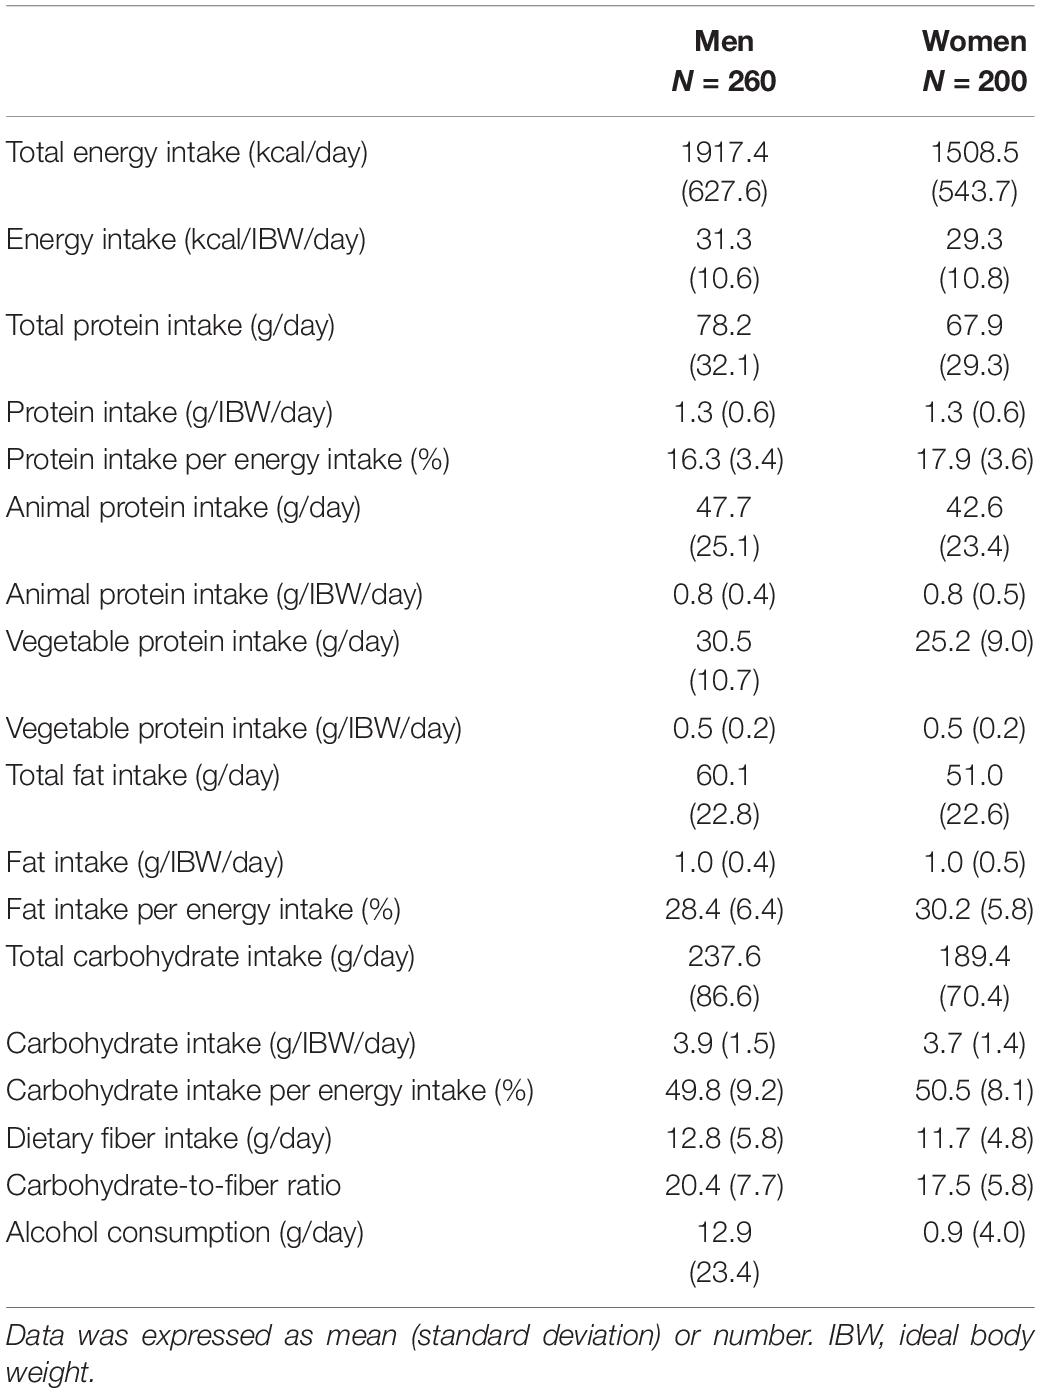
Table 2. Habitual diet intake of study participants.
Table 3 and Figure 2 depict the correlation between dietary fiber intake and clinical characteristics. Dietary fiber intake was correlated with percent body fat mass (r = –0.163, p = 0.021), percent skeletal muscle mass (r = 0.176, p = 0.013), and MFR (r = 0.157, p = 0.026) in women. However, dietary fiber intake was not related to percent body fat mass (r = –0.100, p = 0.108), percent skeletal muscle mass (r = 0.055, p = 0.376), and MFR (r = 0.065, p = 0.295) in men. HbA1c was not correlated with dietary fiber intake in men (r = 0.020, p = 0.755) and women (r = 0.023, p = 0.750). Dietary fiber intake was correlated with creatinine (r = –0.152, p = 0.032) and tended to be correlated with eGFR (r = 0.119, p = 0.092) in women. Dietary fiber intake was not associated with triglycerides (r = –0.089, p = 0.151 in men; r = 0.049, p = 0.496 in women) and HDL cholesterol (r = 0.060, p = 0.332 in men; r = 0.063, p = 0.381 in women). The correlation between dietary fiber intake and systolic blood pressure was significant in men (r = 0.127, p = 0.042).
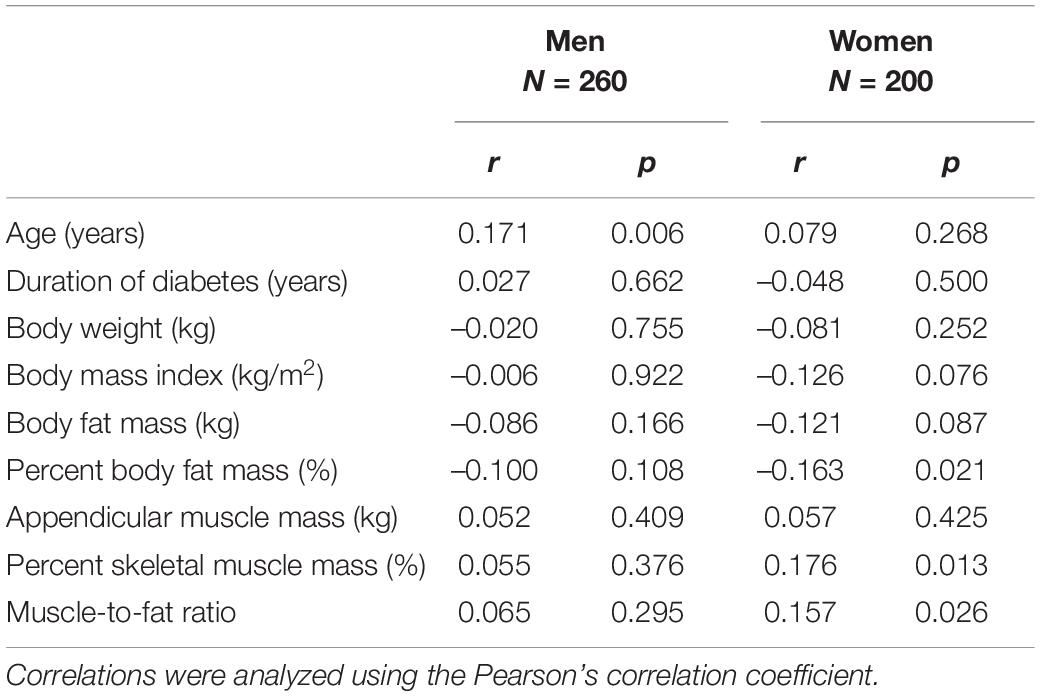
Table 3. Correlation between dietary fiber intake and clinical characteristics.
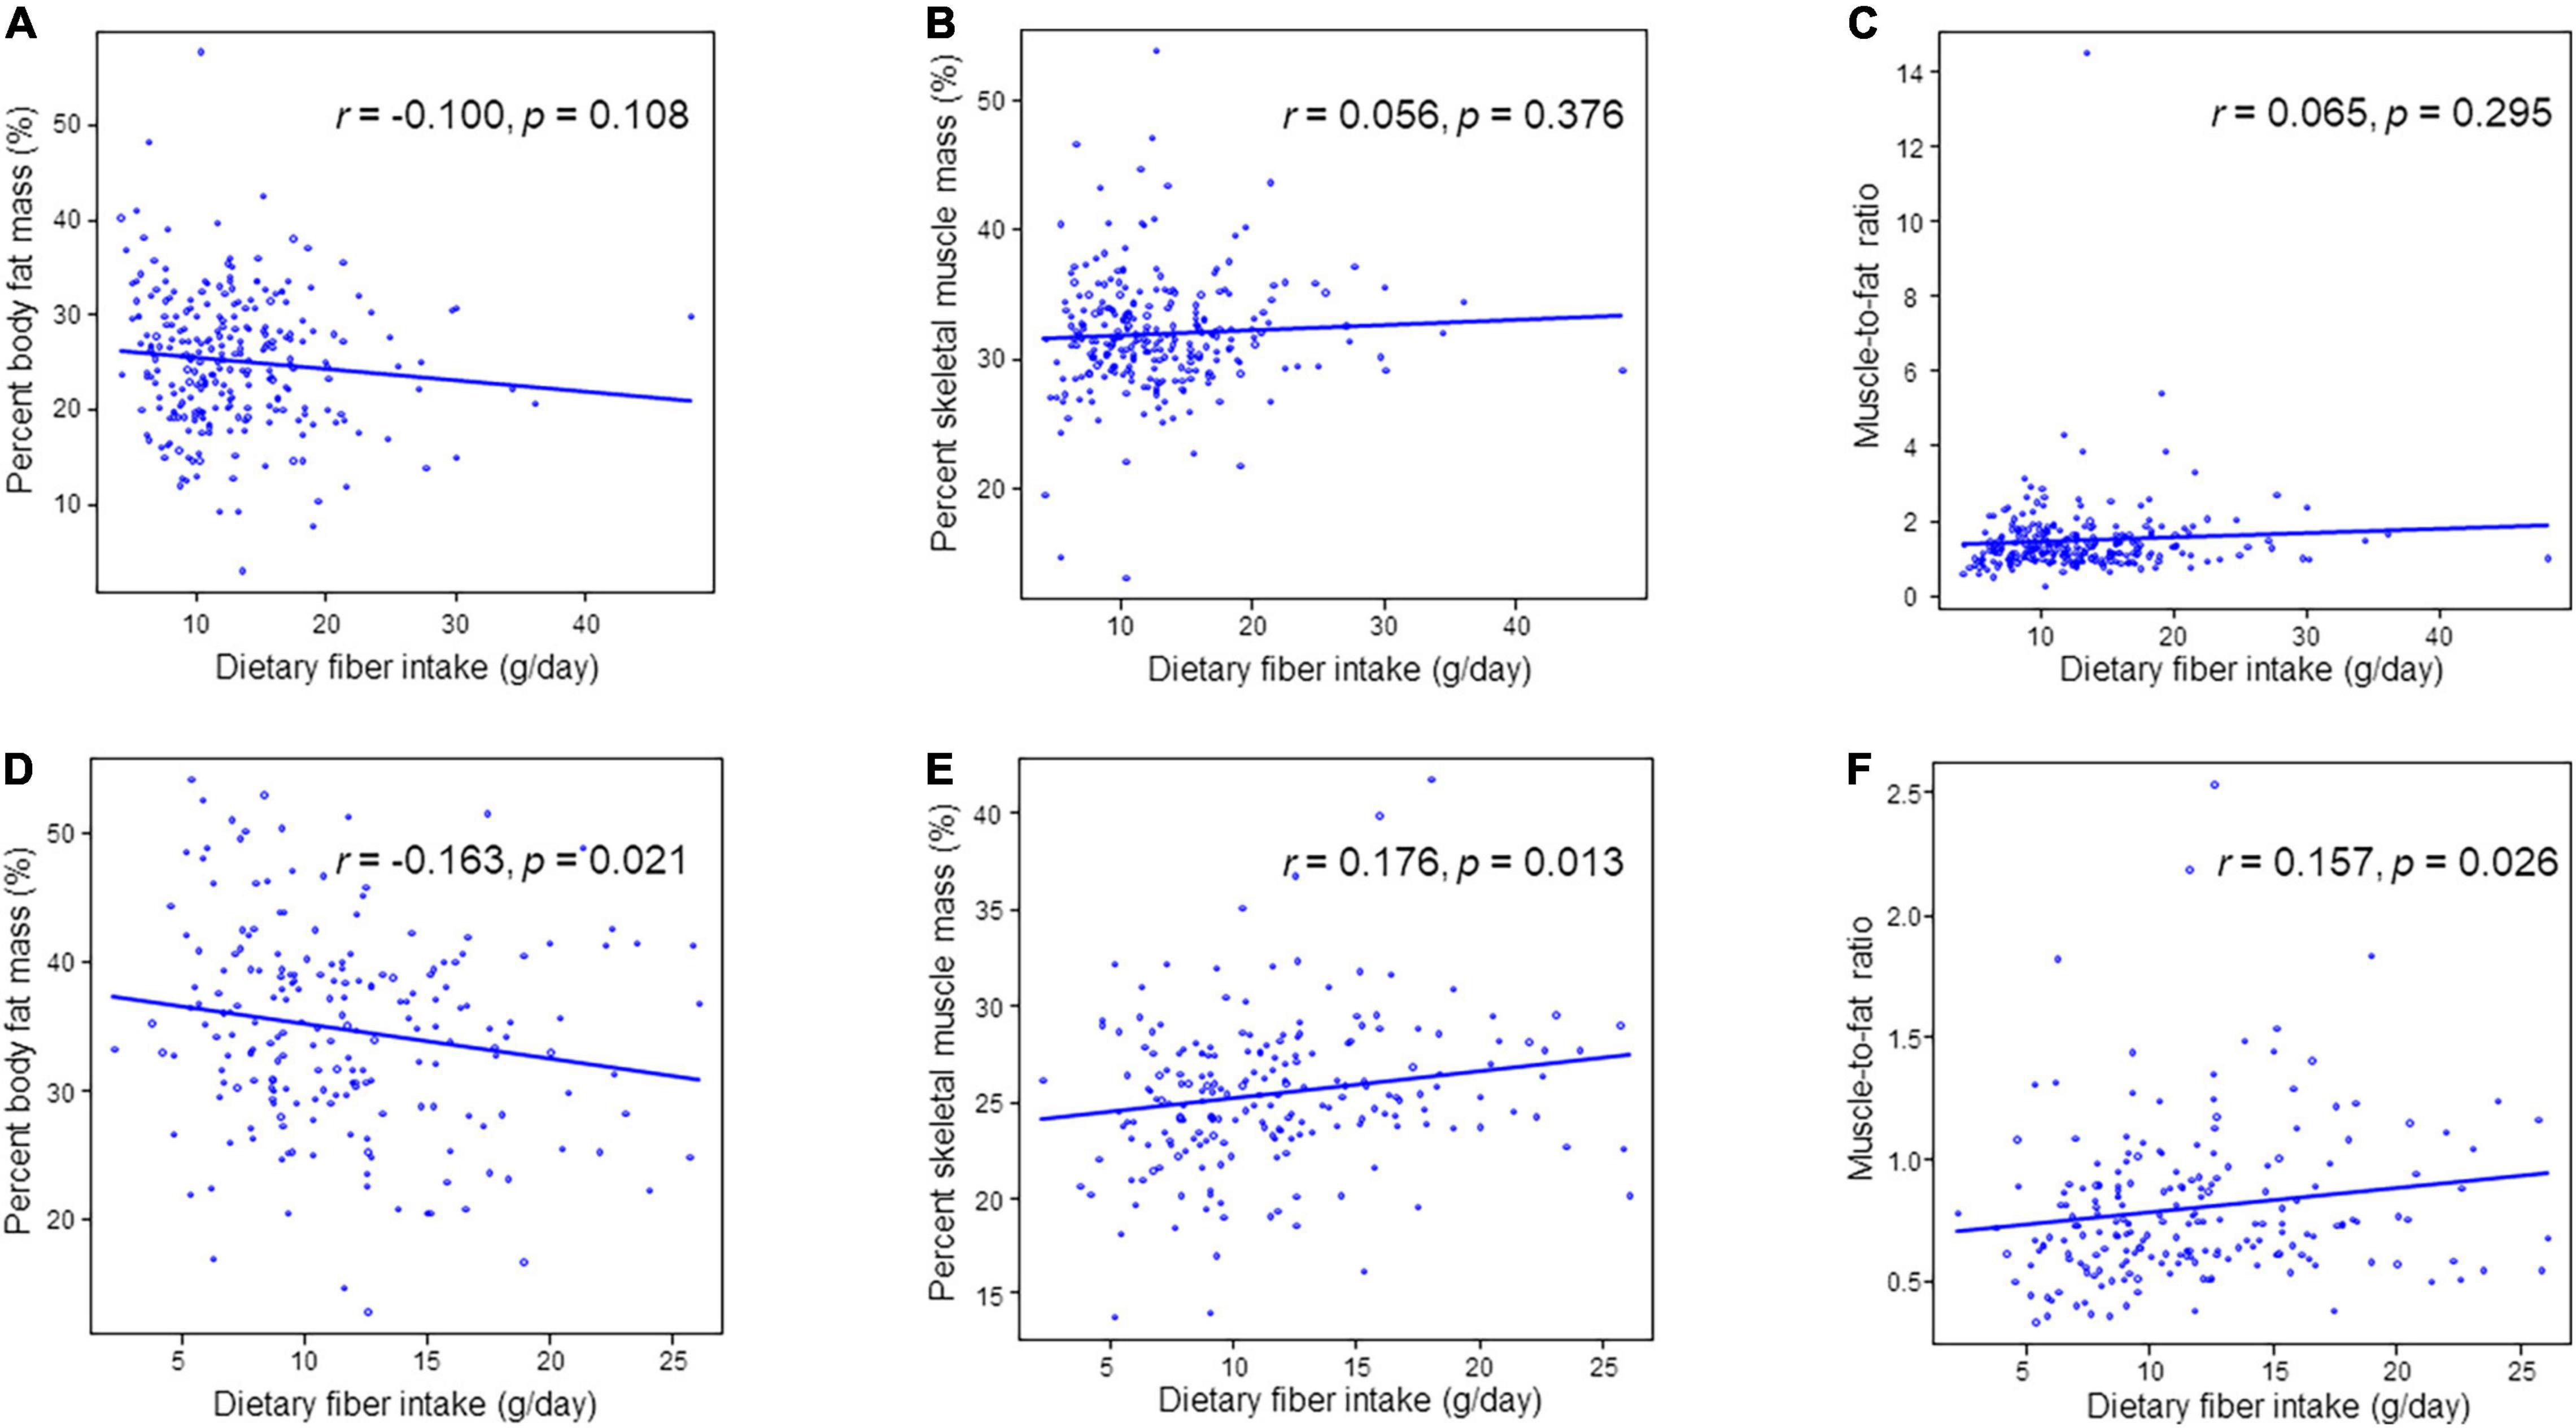
Figure 2. Correlation between dietary fiber intake and percent skeletal muscle mass, percent body fat mass or muscle-to-fat ratio. (A) Percent body fat mass in men. (B) Percent skeletal muscle mass in men. (C) Muscle-to-fat ratio in men. (D) Percent body fat mass in women. (E) Percent skeletal muscle mass in women. (F) Muscle-to-fat ratio in women.
In younger men (n = 42), percent body fat mass (r = –0.343, p = 0.026) and MFR (r = 0.309, p = 0.047) were correlated with dietary fiber intake. Percent skeletal muscle mass tended to be correlated with dietary fiber intake in both younger (n = 40) and older women (n = 160), although these correlations was not statistically significant. Moreover, percent body fat mass (r = –0.154, p = 0.052) and MFR (r = 0.152, p = 0.056) in older women tended to be correlated with fiber intake (Supplementary Table 1).
In women, soluble dietary fiber intake was correlated with percent body fat mass (r = –0.159, p = 0.024), percent skeletal muscle mass (r = 0.186, p = 0.008), and MFR (r = 0.152, p = 0.032), and insoluble dietary fiber intake was correlated percent body fat mass (r = –0.160, p = 0.024), percent skeletal muscle mass (r = 0.175, p = 0.013), and MFR (r = 0.157, p = 0.027) (Supplementary Table 2).
Fat intake was not associated with percent body fat in both men (r = 0.003, p = 0.966) and women (r = –0.031, p = 0.663). Each macronutrient intake was not associated with MFR in both men and women (Supplementary Table 3).
To investigate the association between dietary fiber intake and percent body fat mass, percent skeletal muscle mass, and MFR, multiple regression analyses were performed (Table 4). In women, dietary fiber intake was correlated with percent body fat mass (β = 0.229, p = 0.009), percent skeletal muscle mass (β = 0.364, p < 0.001), and MFR (β = 0.245, p = 0.006) after adjusting for covariates. Dietary fiber intake was related to percent skeletal muscle mass (β = 0.221, p = 0.008) and tended to be correlated with percent body fat mass (β = 0.148, p = 0.071) in men.
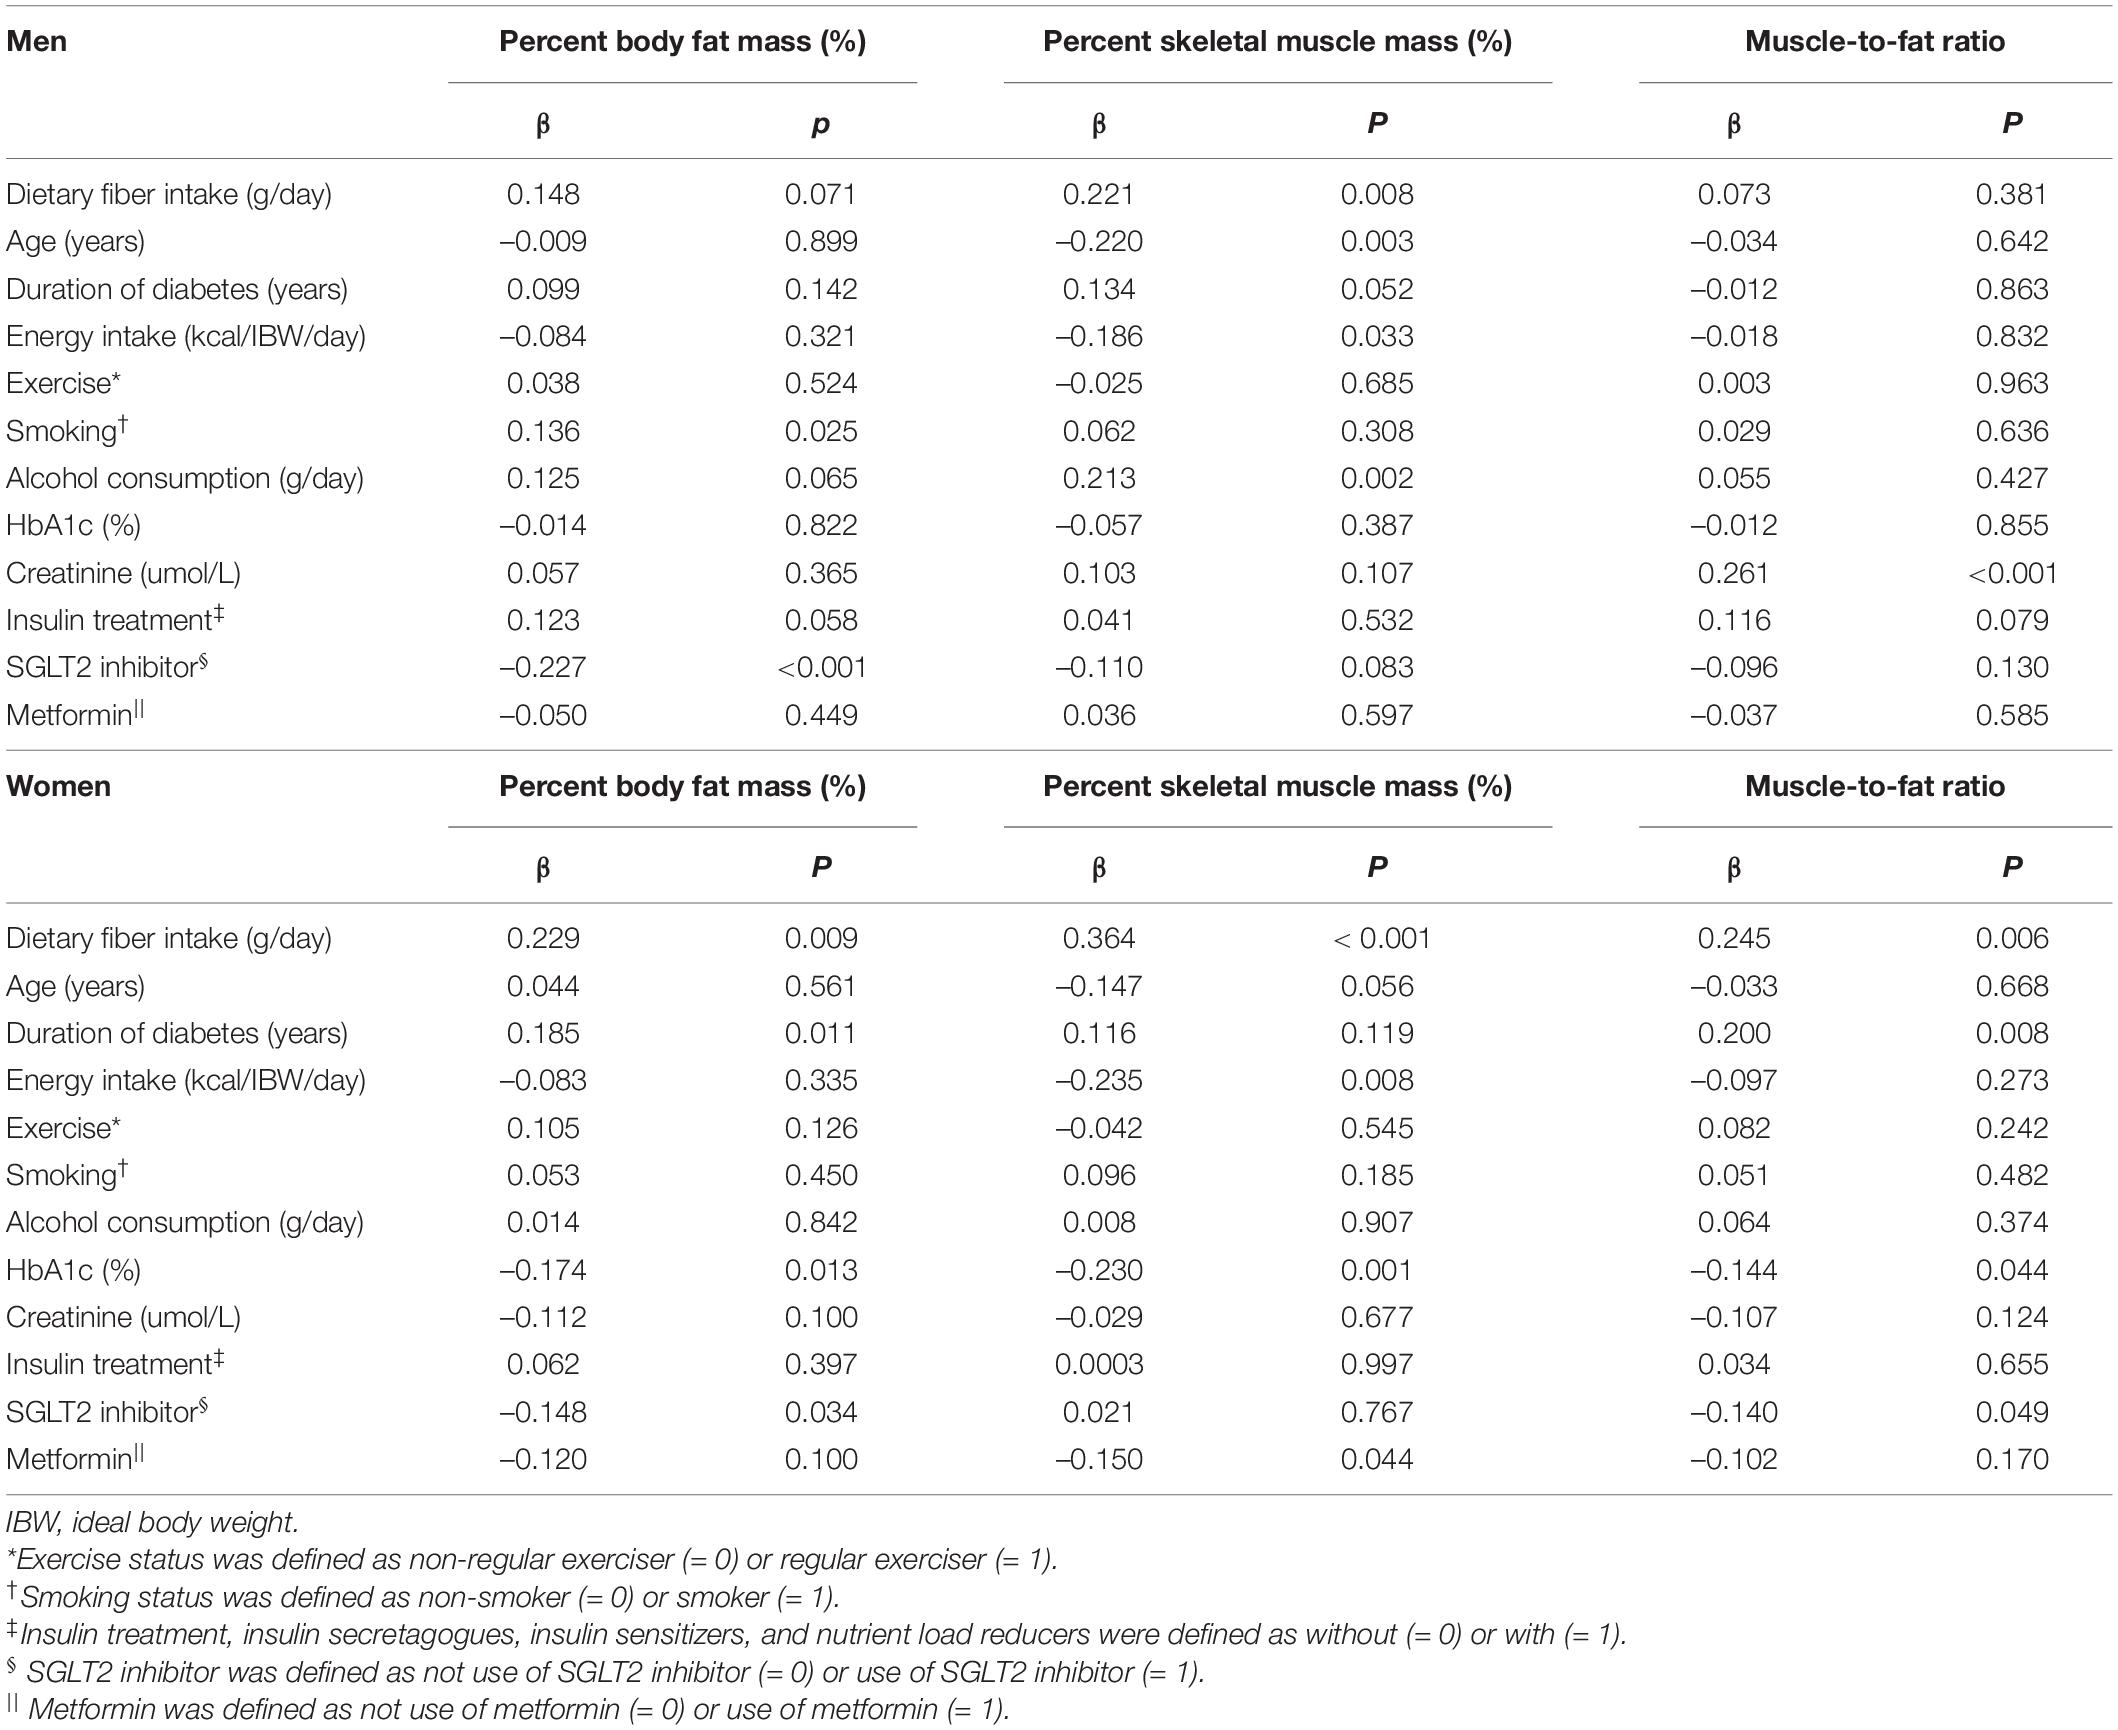
Table 4. Multiple regression analysis on percent body fat mass, percent skeletal muscle mass, and muscle-to-fat ratio.
Discussion
To the best of our knowledge, the present study first investigated the association between dietary fiber intake and body composition, which included skeletal muscle mass, body fat mass, and MFR among men and women with T2D. Results suggested that dietary fiber intake was related to percent body fat mass, percent skeletal muscle mass, and MFR in women. However, the relationship between dietary fiber intake and body composition in men should be further investigated.
The correlation between dietary fiber intake and percent body fat mass, percent skeletal muscle mass, and MFR might be explained by the following:
High visceral fat and muscle atrophy are closely related (7, 8). Muscle atrophy is induced by inflammatory cytokines such as TNF-α and IL-6 secreted from fat cells enlarged by obesity (9). Protein kinase B signaling and nuclear factor κB via the secretion of transforming growth factor-β, IL-6 and TNF-α was associated with sarcopenia (41). On the other hand, dietary fiber delays the movement of food from the stomach to the intestines, therefore causing blood glucose levels to be raised slowly (21). Suppressing the rise in postprandial glycemia avoids excessive insulin secretion and prevents the fat accumulation (42). A high dietary fiber intake is associated with the reduction of insulin resistance and fat accumulation (23, 25). A high dietary fiber intake and low inflammatory marker levels were found to be associated with visceral adiposity, which might be a consequence of dietary fiber-induced improvement in insulin sensitivity (25). Insulin resistance causes muscle atrophy (3). In addition, dietary fiber is associated with low IL-6 and TNF-α levels (43). In this study, dietary fiber intake might have suppressed fat accumulation and inflammation; therefore, it was positively correlated with skeletal muscle mass.
Dietary fiber intake greatly influences the metabolic activity and composition of gut microbiome (23). Gut microbiota affects the progression of obesity in the host. Moreover, gut microbiota in obese mice differed from that in normal mice (44, 45), and this relationship was found in the general population (46). Some gut bacteria grow using dietary fiber and make short-chain fatty acids (SCFAs) (47). In an animal study, SCFAs (particularly butyrate) prevented the translocation of lipopolysaccharide, a potent inflammatory molecule made in the cell membrane of gram-negative bacteria (48). Therefore, muscle atrophy might also be suppressed because dietary fiber intake inhibited inflammation based on body fat mass. Moreover, butyrate, one of SCFAs, promotes inducing regulatory T cells, which have a central role in the suppression of inflammatory (49). Regulatory T cells are known to have a protective effect on muscle atrophy (50). Therefore, the anti-inflammatory effects of fiber prevent muscle atrophy through SCFAs. Therefore, dietary fiber intake prevents muscle atrophy. Moreover, energy metabolism and glucose homeostasis in the host are promoted by SCFAs made by these bacteria (51, 52). SCFAs inhibit fat accumulation in adipose tissues (53) and increase skeletal muscle mass (54). Dietary fiber preserves lean body mass and decreases adiposity by increasing the biosynthesis of mitochondria and the oxidation of fatty acids in skeletal muscle (55). SCFA receptors are present not only in adipose tissues but also in skeletal muscle. SCFAs, particularly acetic acid, are an activator of AMP-activated protein kinase. Further, they promote oxidation of mitochondrial lipids in skeletal muscle via AMP production, which would lead to prevent muscle atrophy (56, 57). This study found that dietary fiber intake was related to MFR in women. Moreover, it improved MFR because dietary fiber intake might have suppressed body fat mass and prevented muscle atrophy.
In this study, there was no sufficient relationship between dietary fiber and body composition in men. It is unclear why the associations between dietary fiber intake and body composition in men and women are different. The effect of dietary fiber is considered to be more significant in women than in men, this might be because women are more likely to accumulate body fat and to experience muscle atrophy than men (58). In fact, it has been reported that dietary fiber intake suppresses the body fat mass (59). However, this study showed that dietary fiber intake tended to be correlated with body composition in men, although it did not reach statistically significance. The multivariate analysis showed correlations between dietary fiber and body compositions in men. Thus, further studies must be conducted to validate this relationship.
The current study had some limitations. First, due to its cross-sectional nature, causal relationships could not be identified. In this study, fat intake did not associate with percent fat mass in both men and women, although fat intake had been reported to be associated with fat accumulation (60). People with high percent fat mass might have reduced fat intake. Second, only Japanese individuals were enrolled in the current study. Thus, the results might not be generalizable to individuals from other ethnic backgrounds. Third, the body composition of participants was assessed via multifrequency impedance body composition analysis, not dual-energy X-ray absorptiometry. However, multifrequency impedance body composition analyzer data has a strong correlation with dual-energy X-ray absorptiometry data (61). Fourth, the observed correlations were relatively weak, and thus, there is a possibility that these acceptances are limited. Moreover, the sample size of this study was relatively small; therefore, we need further research with more participants. The participants in this study were almost older patients (n = 218/260 in men, n = 160/200 in women); therefore, further research is needed, especially about younger patients. Fifth, dietary fiber intake of the excluded group is not known exactly; thus, it is possible that dietary fiber intake in exclusion group is lower than that in including group.
To conclude, the present study first showed that dietary fiber intake was related to skeletal muscle mass, body fat mass, and MFR in women with T2D. Dietary fiber intake is important for not only preventing fat accumulation but also maintaining skeletal muscle mass.
Data Availability Statement
The raw data supporting the conclusions of this article will be made available by the authors, without undue reservation.
Ethics Statement
The studies involving human participants were reviewed and approved by the Kyoto Prefectural University of Medicine. The patients/participants provided their written informed consent to participate in this study.
Author Contributions
FT contributed to design of the work, analysis and interpretation of data, and written the manuscript. YH contributed to conception and design the work, acquisition, analysis and interpretation of data, and revising the manuscript. AK and RS contributed to conception, design the work, acquisition, curation data, and contributed discussion. YK, TOk, NK, TOs, NN, SM, TS, HO, EU, MY, and MA contributed to acquisition data and contributed discussion. MH contributed to design of the work, acquisition data and contributed discussion. MF contributed to conception and design the work, acquisition and interpretation of data, and revising the manuscript. All authors have read and agreed to the published version of the manuscript.
Conflict of Interest
YH received personal fees from Novo Nordisk Pharma Ltd., Mitsubishi Tanabe Pharma Corp., Kowa Company Ltd., Sanofi K.K., Takeda Pharmaceutical Co., Ltd., Ono Pharmaceutical Co., Ltd., Daiichi Sankyo Co., Ltd., and Sumitomo Dainippon Pharma Co., Ltd., outside of the submitted work. HO received grant support from the Japan Society for the Promotion of Science, and personal fees from Daiichi Sankyo Co., Ltd., Takeda Pharmaceutical Co., Ltd., Sumitomo Dainippon Pharma Co., Ltd., Novo Nordisk Pharma Ltd., MSD K.K., Kyowa Hakko Kirin Company Ltd., Kowa Pharmaceutical Co., Ltd., Eli Lilly Japan K.K., Ono Pharmaceutical Co., Ltd., Kissei Pharmaceutical Co., Ltd., Sanofi K.K., and Mitsubishi Tanabe Pharma Corporation. NN received grant support from Japan Society for the Promotion of Science (JSPS KAKENHI grant numbers: 19K23999 and 20K16158) and the Japan Food Chemical Research Foundation, and personal fees from Novo Nordisk Pharma Ltd., and Kowa Pharmaceutical Co., Ltd. TOs received grants from Combi Corporation, and personal fees from Toa Eiyo Corp., Mitsubishi Tanabe Pharma Corp., Daiichi Sankyo Co., Ltd., Novo Nordisk Pharma Ltd., Nippon Boehringer Ingelheim Co., Ltd., Ono Pharmaceutical Co., Ltd., Kyowa Kirin Co., Ltd., Sumitomo Dainippon Pharma Co., Ltd., MSD K.K., Takeda Pharmaceutical Co., Ltd., Kowa Pharma Co., LTD., Eli Lilly Japan K.K., and AstraZeneca K.K., outside of the submitted work. TS received personal fees from Kyowa Hakko Kirin Co., Ltd., Astellas Pharma Inc., Mitsubishi Tanabe Pharma Co., Kowa Pharma Co., Ltd., Sanofi K.K., Taisho Toyama Pharma Co., Ltd., Kissei Pharma Co., Ltd., MSD K.K., Novo Nordisk Pharma Ltd., Ono Pharma Co., Ltd., Eli Lilly Japan K.K., and Takeda Pharma Co., Ltd., outside of the submitted work. EU received grant support from the Japanese Study Group for Physiology and Management of Blood Pressure, Astellas Foundation for Research on Metabolic Disorders (grant number: 4024), Japan Society for the Promotion of Science, Mishima Kaiun Memorial Foundation, and personal fees from Sumitomo Dainippon Pharma Co., Ltd., Mitsubishi Tanabe Pharma Corporation, Nippon Boehringer Ingelheim Co., Ltd., Sanofi K.K., Kowa Pharmaceutical Co., Ltd., Daiichi Sankyo Co., Ltd., Kyowa Hakko Kirin Co., Ltd., AstraZeneca K.K., Novo Nordisk Pharma Ltd., Ono Pharmaceutical Co., Ltd., Taisho Pharmaceutical Co., Ltd., Takeda Pharmaceutical Company Ltd., and MSD K.K., outside of the submitted work. Donated Fund Laboratory of Diabetes therapeutics is an endowment department, supported with an unrestricted grant from Taiyo Kagaku Co., Ltd., Taisho Pharmaceutical Co., Ltd., and Ono Pharmaceutical Co., Ltd. MH received grants from Yamada Bee Farm, Oishi Kenko Inc., Nippon Boehringer Ingelheim Co., Ltd., AstraZeneca K.K., and Ono Pharma Co., Ltd., and personal fees from Eli Lilly, Japan, Sanofi K.K., Sumitomo Dainippon Pharma Co., Ltd., Daiichi Sankyo Co., Ltd., Mitsubishi Tanabe Pharma Corp., AstraZeneca K.K., Ono Pharma Co., Ltd., and Kowa Pharma Co., Ltd., outside of the submitted work. MA received personal fees from Takeda Pharmaceutical Co., Ltd., Kowa Pharmaceutical Co., Ltd., AstraZeneca K.K., Ono Pharmaceutical Co., Ltd., Abbott Japan Co., Ltd., Novo Nordisk Pharma Ltd., Chugai Pharmaceutical Co., Ltd., and Sumitomo Dainippon Pharma Co., Ltd., outside of the submitted work. MY received personal fees from Sumitomo Dainippon Pharma Co., Ltd., Kowa Pharmaceutical Co., Ltd., Takeda Pharmaceutical Company Limited, Kyowa Hakko Kirin Co., Ltd., Kowa Company, Limited, Daiichi Sankyo Co., Ltd., Ono Pharmaceutical Co., Ltd., AstraZeneca PLC, and MSD K.K., outside of the submitted work. MF received grants from Eli Lilly, Japan, K.K., Nippon Boehringer Ingelheim Co., Ltd., Sanwa Kagagu Kenkyusho Co., Ltd., Oishi Kenko Inc., MSD K.K., Kowa Pharma Co., Ltd., Kissei Pharma Co., Ltd., Sumitomo Dainippon Pharma Co., Ltd., Ono Pharma Co. Ltd., Mitsubishi Tanabe Pharma Corp., Abbott Japan Co., Ltd., Daiichi Sankyo Co., Ltd., Johnson & Johnson K.K. Medical Co., Astellas Pharma Inc., Kyowa Kirin Co., Ltd., Novo Nordisk Pharma Ltd., Yamada Bee Farm, Taisho Pharma Co., Ltd., Terumo Corp., Takeda Pharma Co., Ltd., Tejin Pharma Ltd., Sanofi K.K., Nippon Chemiphar Co., Ltd., and TERUMO CORPORATION, and personal fees from Astellas Pharma Inc., Nippon Boehringer Ingelheim Co., Ltd., Sanwa Kagaku Kenkyusho Co., Ltd., MSD K.K., Mochida Pharma Co., Ltd., Eli Lilly Japan K.K., Kissei Pharma Co., Ltd., AstraZeneca K.K., Mitsubishi Tanabe Pharma Corp., TERUMO CORPORATION, Daiichi Sankyo Co., Ltd., Bayer Yakuhin, Ltd., Takeda Pharma Co., Ltd., Teijin Pharma Ltd., Ono Pharma Co., Ltd., Taisho Pharma Co., Ltd., Kyowa Kirin Co., Ltd., Abbott Japan Co., Ltd., Sumitomo Dainippon Pharma Co., Ltd., Arkray Inc., Medtronic Japan Co., Ltd., Novo Nordisk Pharma Ltd., Kowa Pharma Co., Ltd., Nipro Corp., and Sanofi K.K., outside of the submitted work.
The remaining authors declare that the research was conducted in the absence of any commercial or financial relationships that could be construed as a potential conflict of interest.
Publisher’s Note
All claims expressed in this article are solely those of the authors and do not necessarily represent those of their affiliated organizations, or those of the publisher, the editors and the reviewers. Any product that may be evaluated in this article, or claim that may be made by its manufacturer, is not guaranteed or endorsed by the publisher.
Acknowledgments
We would like to thank Enago (www.enago.jp) for the English language review.
Supplementary Material
The Supplementary Material for this article can be found online at: https://www.frontiersin.org/articles/10.3389/fnut.2022.881877/full#supplementary-material
References
1. Charvat H, Goto A, Goto M, Inoue M, Heianza Y, Arase Y, et al. Impact of population aging on trends in diabetes prevalence: a meta-regression analysis of 160,000 Japanese adults. J Diabetes Investig. (2015) 6:533–42. doi: 10.1111/jdi.12333
2. Umegaki H. Sarcopenia and frailty in older patients with diabetes mellitus. Geriatr Gerontol Int. (2016) 16:293–9. doi: 10.1111/ggi.12688
3. Morley JE, Malmstrom TK, Rodriguez-Mañas L, Sinclair AJ. Frailty, sarcopenia and diabetes. J Am Med Dir Assoc. (2014) 15:853–9. doi: 10.1016/j.jamda.2014.10.001
4. Anagnostis P, Gkekas NK, Achilla C, Pananastasiou G, Taouxidou P, Mitsiou M, et al. Type 2 diabetes mellitus is associated with increased risk of sarcopenia: a systematic review and meta-analysis. Calcif Tissue Int. (2020) 107:453–63. doi: 10.1007/s00223-020-00742-y
5. Chen LK, Woo J, Assantachai P, Auyeung TW, Chou MY, Iijima K, et al. Asian working group for sarcopenia: 2019 consensus update on sarcopenia diagnosis and treatment. J Am Med Dir Assoc. (2020) 21:300–307.e2. doi: 10.1016/j.jamda.2019.12.012
6. DeFronzo RA, Tripathy D. Skeletal muscle insulin resistance is the primary defect in type 2 diabetes. Diabetes care. (2009) 32(Suppl 2):S157–63. doi: 10.2337/dc09-s302
7. Zhu S, Tian Z, Torigoe D, Zhao J, Xie P, Sugizaki T, et al. Aging– and obesity-related peri-muscular adipose tissue accelerates muscle atrophy. PLoS One. (2019) 14:e0221366. doi: 10.1371/journal.pone.0221366
8. Kim TN, Park MS, Ryu JY, Choi HY, Hong HC, Yoo HJ, et al. Impact of visceral fat on skeletal muscle mass and vice versa in a prospective cohort study: the Korean sarcopenic obesity study (KSOS). PLoS One. (2014) 9:e115407. doi: 10.1371/journal.pone.0115407
9. Beyer I, Mets T, Bautmans I. Chronic low-grade inflammation and age-related sarcopenia. Curr Opin Clin Nutr Metab Care. (2012) 15:12–22. doi: 10.1097/MCO.0b013e32834dd297
10. Mathieu P, Poirier P, Pibarot P, Lemieux I, Després JP. Visceral obesity the link among inflammation, hypertension, and cardiovascular disease. Hypertension. (2009) 53:577–84. doi: 10.1161/HYPERTENSIONAHA.108.110320
11. Kuk JL, Katzmarzyk PT, Nichaman MZ, Church TS, Blair SN, Ross R. Visceral fat is an independent predictor of all-cause mortality in men. Obesity. (2006) 14:336–41. doi: 10.1038/oby.2006.43
12. Jhee JH, Joo YS, Han SH, Yoo TH, Kang SW, Park JT. High muscle-to-fat ratio is associated with lower risk of chronic kidney disease development. J Cachexia Sarcopenia Muscle. (2020) 11:726–34. doi: 10.1002/jcsm.12549
13. Seo YG, Song HJ, Song YR. Fat-to-muscle ratio as a predictor of insulin resistance and metabolic syndrome in Korean adults. J Cachexia Sarcopenia Muscle. (2020) 11:710–25. doi: 10.1002/jcsm.12548
14. Yu P, Hsu C, Lee W, Liang C, Chou M, Lin M, et al. Muscle−to−fat ratio identifies functional impairments and cardiometabolic risk and predicts outcomes: biomarkers of sarcopenic obesity. J Cachexia Sarcopenia Muscle. (2021) 13:368–76. doi: 10.1002/jcsm.12877
15. Takahashi F, Hashimoto Y, Kaji A, Sakai R, Okamura T, Hamaguchi M, et al. Sarcopenic obesity is associated with macroalbuminuria in patients with type 2 diabetes: a cross-sectional study. Endocr J. (2021) 68:781–9. doi: 10.1507/endocrj.EJ20-0655
16. Tian S, Xu Y. Association of sarcopenic obesity with the risk of all-cause mortality: a meta-analysis of prospective cohort studies. Geriatr Gerontol Int. (2016) 16:155–66. doi: 10.1111/ggi.12579
17. Zhang X, Xie X, Dou Q, Liu C, Zhang W, Yang Y, et al. Association of sarcopenic obesity with the risk of all-cause mortality among adults over a broad range of different settings: a updated meta-analysis. BMC Geriatr. (2019) 19:183. doi: 10.1186/s12877-019-1195-y
18. Chandalia M, Garg A, Lutjohann D, von Bergmann K, Grundy SM, Brinkley LJ. Beneficial effects of high dietary fiber intake in patients with type 2 diabetes mellitus. N Engl J Med. (2000) 342:1392–8. doi: 10.1056/nejm200005113421903
19. Reynolds A, Mann J, Cummings J, Winter N, Mete E, te Morenga L. Carbohydrate quality and human health: a series of systematic reviews and meta-analyses. Lancet. (2019) 393:434–45. doi: 10.1016/S0140-6736(18)31809-9
20. Wanders AJ, van den Borne JJGC, de Graaf C, Hulshof T, Jonathan MC, Kristensen M, et al. Effects of dietary fibre on subjective appetite, energy intake and body weight: a systematic review of randomized controlled trials. Obes Rev. (2011) 12:724–39. doi: 10.1111/j.1467-789X.2011.00895.x
21. Imai S, Fukui M, Kajiyama S. Effect of eating vegetables before carbohydrates on glucose excursions in patients with type 2 diabetes. J Clin Biochem Nutr. (2014) 54:7–11. doi: 10.3164/JCBN.13-67
22. Després JP. The insulin resistance-dyslipidemic syndrome of visceral obesity: effect on patients’ risk. Obes Res. (1998) 6(Suppl. 1):8S–17S. doi: 10.1002/j.1550-8528.1998.tb00683.x
23. Frampton J, Murphy KG, Frost G, Chambers ES. Higher dietary fibre intake is associated with increased skeletal muscle mass and strength in adults aged 40 years and older. J Cachexia Sarcopenia Muscle. (2021) 12:2134–44. doi: 10.1002/jcsm.12820
24. Montiel-Rojas D, Nilsson A, Santoro A, Franceschi C, Bazzocchi A, Battista G, et al. Dietary fibre may mitigate sarcopenia risk: findings from the NU-AGE cohort of older european adults. Nutrients. (2020) 12:1–10. doi: 10.3390/nu12041075
25. Parikh S, Pollock NK, Bhagatwala J, Guo DH, Gutin B, Zhu H, et al. Adolescent fiber consumption is associated with visceral fat and inflammatory markers. J Clin Endocrinol Metab. (2012) 97:1451–7. doi: 10.1210/jc.2012-1784
26. Sakai R, Hashimoto Y, Ushigome E, Miki A, Okamura T, Matsugasumi M, et al. Late-night-dinner is associated with poor glycemic control in people with type 2 diabetes: the KAMOGAWA-DM cohort study. Endocr J. (2018) 65:395–402. doi: 10.1507/endocrj.EJ17-0414
27. Matsuo S, Imai E, Horio M, Yasuda Y, Tomita K, Nitta K, et al. Revised equations for estimated GFR from serum creatinine in Japan. Am J Kidney Dis. (2009) 53:982–92. doi: 10.1053/j.ajkd.2008.12.034
28. Kaji A, Hashimoto Y, Kobayashi Y, Sakai R, Okamura T, Miki A, et al. Sarcopenia is associated with tongue pressure in older patients with type 2 diabetes: a cross-sectional study of the KAMOGAWA-DM cohort study. Geriatr Gerontol Int. (2019) 19:153–8. doi: 10.1111/ggi.13577
29. Lemmens HJM, Brodsky JB, Bernstein DP. Estimating ideal body weight – a new formula. Obes Surg. (2005) 15:1082–3. doi: 10.1381/0960892054621350
30. Janssen I, Heymsfield SB, Ross R. Low relative skeletal muscle mass (sarcopenia) in older persons is associated with functional impairment and physical disability. J Am Geriatr Soc. (2002) 50:889–96. doi: 10.1046/j.1532-5415.2002.50216.x
31. Okamura T, Miki A, Hashimoto Y, Kaji A, Sakai R, Osaka T, et al. Shortage of energy intake rather than protein intake is associated with sarcopenia in elderly patients with type 2 diabetes: a cross-sectional study of the KAMOGAWA-DM cohort. J Diabetes. (2019) 11:477–83. doi: 10.1111/1753-0407.12874
32. Kobayashi S, Murakami K, Sasaki S, Okubo H, Hirota N, Notsu A, et al. Comparison of relative validity of food group intakes estimated by comprehensive and brief-type self-administered diet history questionnaires against 16 d dietary records in Japanese adults. Public Health Nutr. (2011) 14:1200–11. doi: 10.1017/S1368980011000504
33. Kobayashi S, Honda S, Murakami K, Sasaki S, Okubo H, Hirota N, et al. Both comprehensive and brief self-administered diet history questionnaires satisfactorily rank nutrient intakes in Japanese adults. J Epidemiol. (2012) 22:151–9. doi: 10.2188/jea.JE20110075
34. Hashimoto Y, Tanaka M, Miki A, Kobayashi Y, Wada S, Kuwahata M, et al. Intake of carbohydrate to fiber ratio is a useful marker for metabolic syndrome in patients with type 2 diabetes: a cross-sectional study. Ann Nutr Metab. (2018) 72:329–35. doi: 10.1159/000486550
35. Takahashi F, Hashimoto Y, Kaji A, Sakai R, Okamura T, Kitagawa N, et al. Sarcopenia is associated with a risk of mortality in people with type 2 diabetes mellitus. Front Endocrinol. (2021) 12:783363. doi: 10.3389/fendo.2021.783363
36. Shafiee G, Keshtkar A, Soltani A, Ahadi Z, Larijani B, Heshmat R. Prevalence of sarcopenia in the world: a systematic review and meta- analysis of general population studies. J Diabetes Metab Disord. (2017) 16:21. doi: 10.1186/s40200-017-0302-x
37. Lee CG, Boyko EJ, Barrett-Connor E, Miljkovic I, Hoffman AR, Everson-Rose SA, et al. Insulin sensitizers may attenuate lean mass loss in older men with diabetes. Diabetes Care. (2011) 34:2381. doi: 10.2337/DC11-1032
38. Turner R, Murchison L, Wright AD, Oakley N, Kohner E, Hayes R, et al. United Kingdom prospective diabetes study 24: a 6-year, randomized, controlled trial comparing sulfonylurea, insulin, and metformin therapy in patients with newly diagnosed type 2 diabetes that could not be controlled with diet therapy. Ann Intern Med. (1998) 128:165–75. doi: 10.7326/0003-4819-128-3-199802010-00001
39. Sasaki T, Sugawara M, Fukuda M. Sodium–glucose cotransporter 2 inhibitor-induced changes in body composition and simultaneous changes in metabolic profile: 52-week prospective LIGHT (luseogliflozin: the Components of weight loss in Japanese patients with type 2 diabetes mellitus) study. J Diabetes Investig. (2019) 10:108–17. doi: 10.1111/jdi.12851
40. Kanda Y. Investigation of the freely available easy-to-use software “EZR” for medical statistics. Bone Marrow Transplant. (2013) 48:452–8. doi: 10.1038/bmt.2012.244
41. Ziaaldini MM, Marzetti E, Picca A, Murlasits Z. Biochemical pathways of sarcopenia and their modulation by physical exercise: a narrative review. Front Med. (2017) 4:167. doi: 10.3389/fmed.2017.00167
42. Brand-Miller JC, Holt SHA, Pawlak DB, McMillan J. Glycemic index and obesity. Am J Clin Nutr. (2002) 76:281–5. doi: 10.1093/ajcn/76.1.281s
43. Ma Y, Hébert JR, Li W, Bertone-Johnson ER, Olendzki B, Pagoto SL, et al. Association between dietary fiber and markers of systemic inflammation in the women’s health initiative observational study. Nutrition. (2008) 24:941–9. doi: 10.1016/j.nut.2008.04.005
44. Enzi G, Baritussio A, Marchiori E, Crepaldi G. Short-term and long-term clinical evaluation of a non-amphetaminic anorexiant (Mazindol) in the treatment of obesity. J Int Med Res. (1976) 4:305–18. doi: 10.1177/030006057600400504
45. Turnbaugh PJ, Ley RE, Mahowald MA, Magrini V, Mardis ER, Gordon JI. An obesity-associated gut microbiome with increased capacity for energy harvest. Nature. (2006) 444:1027–31. doi: 10.1038/nature05414
46. Kasai C, Sugimoto K, Moritani I, Tanaka J, Oya Y, Inoue H, et al. Comparison of the gut microbiota composition between obese and non-obese individuals in a Japanese population, as analyzed by terminal restriction fragment length polymorphism and next-generation sequencing. BMC Gastroenterol. (2015) 15:100. doi: 10.1186/s12876-015-0330-2
47. Flint HJ, Duncan SH, Scott KP, Louis P. Links between diet, gut microbiota composition and gut metabolism. Proc Nutr Soc. (2014) 760:13–22. doi: 10.1017/S0029665114001463
48. Cani PD, Bibiloni R, Knauf C, Neyrinck AM, Delzenne NM. Changes in gut microbiota control metabolic diet–induced obesity and diabetes in mice. Diabetes. (2008) 57:1470–81. doi: 10.2337/db07-1403.Additional
49. Furusawa Y, Obata Y, Fukuda S, Endo TA, Nakato G, Takahashi D, et al. Commensal microbe-derived butyrate induces the differentiation of colonic regulatory T cells. Nature. (2013) 504:446–50. doi: 10.1038/nature12721
50. Schiaffino S, Pereira MG, Ciciliot S, Rovere-Querini P. Regulatory T cells and skeletal muscle regeneration. FEBS J. (2017) 284:517–24. doi: 10.1111/febs.13827
51. den Besten G, van Eunen K, Groen AK, Venema K, Reijngoud DJ, Bakker BM. The role of short-chain fatty acids in the interplay between diet, gut microbiota, and host energy metabolism. J Lipid Res. (2013) 54:2325–40. doi: 10.1194/jlr.R036012
52. Canfora EE, Jocken JW, Blaak EE. Short-chain fatty acids in control of body weight and insulin sensitivity. Nat Rev Endocrinol. (2015) 11:577–91. doi: 10.1038/nrendo.2015.128
53. Kimura I, Ozawa K, Inoue D, Imamura T, Kimura K, Maeda T, et al. The gut microbiota suppresses insulin-mediated fat accumulation via the short-chain fatty acid receptor GPR43. Nat Commun. (2013) 4:1829. doi: 10.1038/ncomms2852
54. Lustgarten MS. The role of the gut microbiome on skeletal muscle mass and physical function: 2019 update. Front Physiol. (2019) 10:1435. doi: 10.3389/fphys.2019.01435
55. Islam A, Civitarese AE, Hesslink RL, Gallaher DD. Viscous dietary fiber reduces adiposity and plasma leptin and increases muscle expression of fat oxidation genes in rats. Obesity. (2012) 20:349–55. doi: 10.1038/oby.2011.341
56. Maruta H, Yoshimura Y, Araki A, Kimoto M, Takahashi Y, Yamashita H. Activation of AMP-activated protein kinase and stimulation of energy metabolism by acetic acid in L6 myotube cells. PLoS One. (2016) 11:e0158055. doi: 10.1371/journal.pone.0158055
57. Yamashita H, Maruta YH, Jozuka M, Kimura R, Iwabuchi H, Yamato M, et al. Effects of acetate on lipid metabolism in muscles and adipose tissues of type 2 diabetic otsuka long-evans tokushima fatty (OLETF) Rats. Biosci Biotechnol Biochem. (2009) 73:570–6. doi: 10.1271/bbb.80634
58. Abe T, Kearns CF, Fukunaga T. Sex differences in whole body skeletal muscle mass measured by magnetic resonance imaging and its distribution in young Japanese adults. Br J Sports Med. (2003) 37:436–40. doi: 10.1136/bjsm.37.5.436
59. Tucker LA, Thomas KS. Increasing total fiber intake reduces risk of weight and fat gains in women. J Nutr. (2009) 139:576–81. doi: 10.3945/jn.108.096685
60. Tucker LA, Kano MJ. Dietary fat and body fat: a multivariate study of 205 adult females. Am J Clin Nutr. (1992) 56:616–22. doi: 10.1093/AJCN/56.4.616
Keywords: dietary fiber intake, skeletal muscle mass, body fat mass, type 2 diabetes, muscle to body fat ratio
Citation: Takahashi F, Hashimoto Y, Kaji A, Sakai R, Kawate Y, Okamura T, Okada H, Kitagawa N, Nakanishi N, Majima S, Osaka T, Senmaru T, Ushigome E, Asano M, Hamaguchi M, Yamazaki M and Fukui M (2022) Dietary Fiber Intake Is Related to Skeletal Muscle Mass, Body Fat Mass, and Muscle-to-Fat Ratio Among People With Type 2 Diabetes: A Cross-Sectional Study. Front. Nutr. 9:881877. doi: 10.3389/fnut.2022.881877
Received: 23 February 2022; Accepted: 10 May 2022;
Published: 31 May 2022.
Edited by:
Lubia Velázquez López, Instituto Mexicano del Seguro Social, MexicoReviewed by:
Shinya Furukawa, Ehime University, JapanLilia G. Noriega, Instituto Nacional de Ciencias Médicas y Nutrición Salvador Zubirán (INCMNSZ), Mexico
Copyright © 2022 Takahashi, Hashimoto, Kaji, Sakai, Kawate, Okamura, Okada, Kitagawa, Nakanishi, Majima, Osaka, Senmaru, Ushigome, Asano, Hamaguchi, Yamazaki and Fukui. This is an open-access article distributed under the terms of the Creative Commons Attribution License (CC BY). The use, distribution or reproduction in other forums is permitted, provided the original author(s) and the copyright owner(s) are credited and that the original publication in this journal is cited, in accordance with accepted academic practice. No use, distribution or reproduction is permitted which does not comply with these terms.
*Correspondence: Yoshitaka Hashimoto, y-hashi@koto.kpu-m.ac.jp