Status of nutrition labeling knowledge, attitude, and practice (KAP) of residents in the community and structural equation modeling analysis
 Yinxia Liao1
  Jianjun Yang1,2*
- 1School of Public Health and Management, Ningxia Medical University, Yinchuan, Ningxia, China
- 2Ningxia Key Laboratory of Environmental Factors and Chronic Disease Control, Yinchuan, Ningxia, China
Objective: Unhealthy foods were a major contributor to the occurrence of chronic non-communicable diseases. The promotion of nutrition labeling in the community can effectively help residents to choose healthy foods, which plays an important role in the prevention of chronic diseases. However, the public awareness of this measure is not clear. Our study used a structural equation model based on the KAP theory to analyze the interaction mechanisms among knowledge, attitude, and practice and aimed to evaluate the relationships among nutrition knowledge, attitude, and practice of residents, which can provide the basis of policy formulation for nutrition education and behavior intervention.
Methods: We carried out a cross-sectional study from May 2022 to July 2022 in the “Community Health Service Center”, and each “Community Service Station” in Yinchuan use a self-designed questionnaire and convenience sampling to evaluate resident nutrition labeling KAP status. This study adopted the structural equation modeling approach to analyze a survey of Chinese individuals through the cognitive processing model, interrelated nutrition knowledge, nutrition label knowledge, attitude, and practice.
Results: According to the principle of sample size estimation, a total of 636 individuals were investigated, with the ratio of male to female being 1:1.2. The average score of community residents' nutrition knowledge was 7.48 ± 3.24, and the passing rate was 19.4%. Most residents had a positive attitude toward nutrition labeling, but the awareness rate was only 32.7% and the utilization rate was 38.5%. Univariate analysis showed that women had higher knowledge scores than men (p < 0.05), and young people had higher scores than older adults (p < 0.05), and the difference was significant. Based on the KAP structural equation model (SEM), residents' nutrition knowledge will directly affect their attitude toward nutrition labeling. Attitude played a greater role as an indirect effect between knowledge and behavior, while trust limits residents' practice of nutrition labeling and then affects their practice. It could be explained that nutrition knowledge was the prerequisite for label reading behavior, and attitude was the intermediary effect.
Conclusion: The nutrition knowledge and nutrition labeling knowledge of respondents hardly directly support the practice of nutrition labeling, but it can influence the use behavior by forming a positive attitude. The KAP model is suitable for explaining residents' use of nutrition labeling in the region. Future research should focus on better understanding the motivations of residents to use nutrition labeling and the opportunity to use nutrition labeling in real-life shopping settings.
1. Introduction
In recent years, fast foods, take-out foods, and prepackaged foods have become increasingly popular, with a rapid increase in the consumption rate of them (1–3), among which, the consumption rate of prepackaged foods in China has reached 59.8% (4). The poor cooking methods of take-out foods and fast foods caused a large accumulation of unhealthy ingredients in the body, including fat, salt, and sugar (1, 5). Prepackaged foods (including puffed food, beverage, pickled canned food, and leisure food) are generally high in energy, fat, and sodium and low in protein and dietary fiber (6, 7). Whether it is fast foods, take-out foods, or prepackaged foods, its rising consumption rate and accumulation of unhealthy nutrients are the key factors in causing the high incidence of chronic diseases such as obesity and diabetes (8, 9). Diet-related diseases have become more common because of changes in lifestyle and food habits, but researchers have also established that dietary modifications significantly reduce the risk of diseases (10). Individual food choices and eating behaviors are influenced by many interrelated factors which affect the results of nutrition-related public health interventions. To improve the adverse health effects of this situation, recommendations and interventions have been implemented across the globe. Nutrition labeling plays an active role as a dietary strategy as recommended by the WHO (11). In the face of increasing diet-related chronic diseases, many countries have initiated steps to include nutrition labeling on prepackaged food packets and in restaurant menus to standardize the management of nutrition labeling (12).
Nutrition labeling is not only an information tool to interpret the nutrient content and function of food but also a strategy against overweight and obesity (13), which plays a critical role in promoting healthy eating habits. Petimar et al. found that the calorie menu labeling was associated with an immediate decrease of 60 calories per transaction or 4% of total calories purchased (14). A meta-analysis expressed that food labeling decreased consumer intakes of energy by 6.6%, total fat by 10.6%, artificial trans fat by 64.3%, sodium by 8.9%, and other unhealthy dietary options by 13.0% while increasing vegetable consumption by 13.5% (15). The implementation of nutrition labeling and sugar labeling can contribute to the lower risk of cardiovascular diseases and cancer and kidney diseases, thereby reducing the prevalence of chronic diseases and increasing life expectancy (16, 17). In addition, under the Nutrition Labeling and Education Act (NLEA) promulgated by the United States in 1990, nutrition labeling will be required for all retail food products to facilitate consumers to obtain more nutrition information and maintain healthy dietary practices (18). Although the nutrition labeling system has been introduced in China as early as 1994 (19) and has been revised several times, the practice of nutrition labeling has not been actually promoted until the General Rules of National Prepackaged Food Nutrition Labels (GB 28050-2013) were enacted in 2013 (20, 21). Since then, the labeling rate of nutrition labeling in prepackaged foods has been significantly improved (22). Since then, the labeling rate of nutrition labeling in prepackaged foods has been significantly improved. However, the actual utilization of nutrition labeling was in fact lower than that reported (23), possibly because the complex design of nutrition labeling is puzzling, including energy conversion and professional terms description (24, 25). Previous studies have found that the longer a consumer gazed at the nutrition claim, the more likely the product with a nutrition claim was bought (26). It is also reported that consumers who regularly use the nutrition labeling seem to have a higher diet quality (27).
The knowledge, attitude, and practice (KAP) model is a theory to explain an individual healthy behavior (28) and the model figures that there are two key steps to changing behavior: establishing beliefs and changing attitudes. Up to now, the KAP model has been widely applied to health education in the fields of prevention of primary infectious diseases (e.g., schistosomiasis, tuberculosis, malaria, and AIDS) (29–31) and control of chronic diseases (e.g., diabetes and hypertension) (32, 33). However, few studies have explored the relationships among knowledge, attitude, and practice behavior of nutrition labels based on the KAP theory (34–36). The use of nutrition labeling is a dietary self-management behavior and is closely related to their own nutrition knowledge and health beliefs. Therefore, we adopted the KAP model as a framework to explore the relationships between them, and the new findings may contribute to future nutrition education to promote nutrition label use in China.
2. Hypotheses of the KAP model
According to the KAP theory, there is a causal relationship among knowledge, attitude, and practice (37). However, KAP are potential variables that are difficult to measure directly. The traditional statistical methods cannot deal with these potential variables effectively, while the structural equation model (SEM) integrates the traditional statistical analysis methods, such as confirmatory factor analysis, path analysis, and multiple regression analysis, leading to a new multivariate statistical technology. It can not only analyze and deal with measurement errors but also analyze the structural relationship between potential variables (38, 39) and directly display the correlation between the variables through the path diagram. In addition, it can also explore the causal relationship between potential variables and quantitatively evaluate the direct and indirect effects of variables (40), as shown in Figure 1.
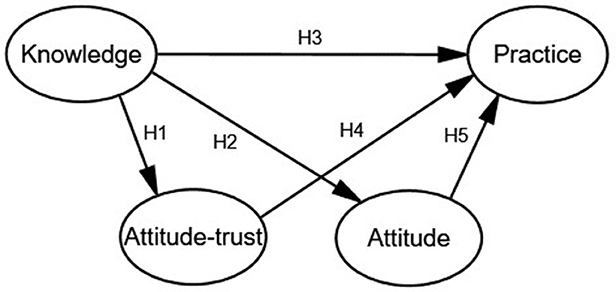
Figure 1. The KAP constructed equation model.
Knowledge means the ability of understanding and using nutrition information, through education, learning experience, and identifying the nutrition label. Attitude refers to the feeling or opinions of community residents on nutrition labeling in some situations, including credibility, helpfulness, and necessity. Practice refers to the use or application of nutrition labeling by community residents. Based on the KAP model, it is predicted that nutrition knowledge will positively and indirectly affect practice through attitude change, and nutrition knowledge may also directly affect nutrition labeling practice. We put forward the following five assumptions based on the relevant literature on the knowledge, attitude, and practice structure model published by Zeng Y, Kwak C, Zeying H, and Misra R.
Hypothesis 1(H1): Community residents who have higher nutrition knowledge scores are more likely to trust nutrition labeling.
Hypothesis 2(H2): Community residents who have higher nutrition knowledge scores are more likely to have a positive attitude toward labeling.
Hypothesis 3(H3): Community residents who have higher nutrition knowledge scores are more likely to use nutrition labels.
Hypothesis 4(H4): Community residents who have more trust in nutrition labeling are more likely to use it.
Hypothesis 5(H5): Community residents who have a more positive attitude toward nutrition labeling are more likely to use it.
Thus, we attempted to analyze the interactions among community residents' nutrition labeling knowledge, attitude, and practice by using the KAP model to construct a structural equation. Meanwhile, we should also explore residents' cognition and use behaviors of nutrition labeling, as well as the influencing factors so that the resident can have a better understanding of nutrition labels and habits of food choice.
3. Materials and methods
3.1. Materials
A cross-sectional questionnaire survey was conducted using convenience sampling and anonymously in a community health service center in Yinchuan, Ningxia, from 1 May 2022 to 16 July 2022. Investigators will be rigorously trained before the investigation, and the data collected will be kept strictly confidential by the research team. The data were collected by a combination of online and onsite. The respondents include adults over 18 years old who have lived in the community for a long time (more than one year), excluding residents with serious diseases and unable to communicate. After informed consent was obtained from each participant, questionnaires are distributed and filled out. The sample size calculation is as follows: , (where α: significance level, when α= 0.05, Z1−α/2 = 1.96, n:sample content,δ: allowable error, and P:estimation value of population rate π). The average awareness rate of the nutrition label is approximately 40%, that is, P = 0.4, α = 0.05, and δ = 0.04, the sample size was expanded by 10% considering non-response, and 636 residents were eventually included.
3.2. Methods and collection data
This study is based on KAP model (41). The questionnaire is based on the questionnaire designed by the Center for Disease Control and Prevention (CDC) of China, then revised according to Cui (42) (Cronbach's alpha = 0.967, Kaiser–Meyer–Olkin = 0.960, p < 0.005) and Liu (43), and finally verified by expert review. Two pre-surveys were conducted in a small sample of 62 adults, which were revised according to the feedback. We should ensure that the reliability and validity of the final questionnaire were qualified (Cronbach's alpha = 0.922, Kaiser–Meyer–Olkin = 0.887, p < 0.001). The questionnaire includes 50 questions in three parts as follows: basic demographic information, nutrition knowledge, and nutrition labeling KAP; each part is relatively independent. The first part includes answering questions such as age, gender, educational level, marital status, occupation, monthly income, self-reported illness or physical condition, and medical and nutrition education, and this part is not scored. The second part includes answering questions about the main effects of core nutrients (such as protein, fat, carbohydrates, and sodium) and the recommended intake of sodium in Dietary Guidelines for Chinese Residents. In this part, multiple choice questions (single-choice question), 1 point for the right choice. Multiple choice questions (select one or more answer choices), with 0.5 points for each correct item. The third part includes answering the contents of nutrition labeling, the meaning of NRV, and the types of nutrients that are mandatory to be labeled, with 1 point for the right choice. In this part, the questions about residents' understanding, attitude, trust, and helpfulness of nutrition labeling are evaluated by a five-point Likert scale, ranging from 1 “strongly disagree” to 5 “strongly agree”. The scores are 1, 2, 3, 4, and 5, respectively, which increase in turn.
The number of correct answers to “What are the parts of food nutrition labels” divided by the total number of samples, which is the awareness rate of nutrition labels, expressed as a percentage. Regarding the numerical expressions of credibility, helpfulness, and necessity, we combine “strongly agree” and “agree” as positive, “neither agree nor disagree” as modest, and “strongly disagree” and “disagree” as negative. The higher the score, the higher the residents' understanding of food nutrition labels, the more positive their attitude, and the more willing they are to use nutrition labels when shopping. Data were collected in “A Community Health Service Center” and an online questionnaire platform “Wenjuanwang” (https://www.wenjuan.com/).
4. Data analysis methods
Data analysis was performed in three stages. First, the data were analyzed using EpiData3.1 data entry. Second, SPSS 24.0 (IBM, NY, United States) was used for statistical analysis and reliability and validity tests. If the quantitative data were subjected to the normal distribution, it is described by mean standard deviation (mean ± SD); On the contrary, it is described by median or interquartile value. If the data submitted to normal distribution and homogeneity of variance, a one-way analysis of variance or chi-square test was used. Otherwise, the Wilcoxon rank-sum test is adopted for comparison. Finally, the KAP structural equation model (SEM) of nutrition labeling for community residents was constructed by using AMOS 24.0 (IBM, NY, United States) software, and the model was revised by Modification Indices. The model fitting was evaluated with χ2 -value, GFI (goodness-of-fit index), AGFI (adjusted goodness-of-fit index), TLI (Tucker–Lewis index), CFI (comparative fit index), NFI (normed fit index), IFI (incremental fit index), and RMSEA (root mean square error of approximation). The test level was 0.05, and p < 0.05 indicated that the difference was statistically significant.
5. Results
5.1. Demographic data analysis
The sociodemographic characteristics of the participants are presented in Table 1. A total of 636 people were investigated, including 285 men and 351 women, mean age was approximately 46.8 ± 17.0 years with a minimum age of 18 years and a maximum age of 75 years. The most frequent age group was 35–44 years (21.9%). More than half of the residents have received a high school education or above (67.7%). Residents with a monthly income between 5,000 and 10,000 CNY are the most, account for 34.6%, and with monthly income above 20,000 CNY being the least, accounting for only 1.9%; and 74.7% of the residents are married.
Table 1. Sociodemographic characteristics of the whole sample.
5.2. Knowledge, attitude, and practice of nutrition labeling among residents by different gender
The scores of nutrition labeling knowledge, attitude, and practice of women were higher than those of men. There were no significant differences in genders in understanding nutrition labeling information and technical term descriptions (p > 0.05), but there were significant differences in understanding nutritional content, numerical information, and the function of nutritional content (p < 0.05). In terms of nutrition labeling attitude, women showed significantly higher scores (p < 0.05) in necessity and helpfulness except credibility, compared to men. It indicated that women had richer nutrition labeling knowledge, more positive attitudes toward nutrition labeling, and used nutrition labeling more frequently, which was related to the fact that the frequency of undertaking food purchasing and cooking was higher in women than in men. It might be because women received medical or nutrition-related training more frequently than men, as shown in Table 2.
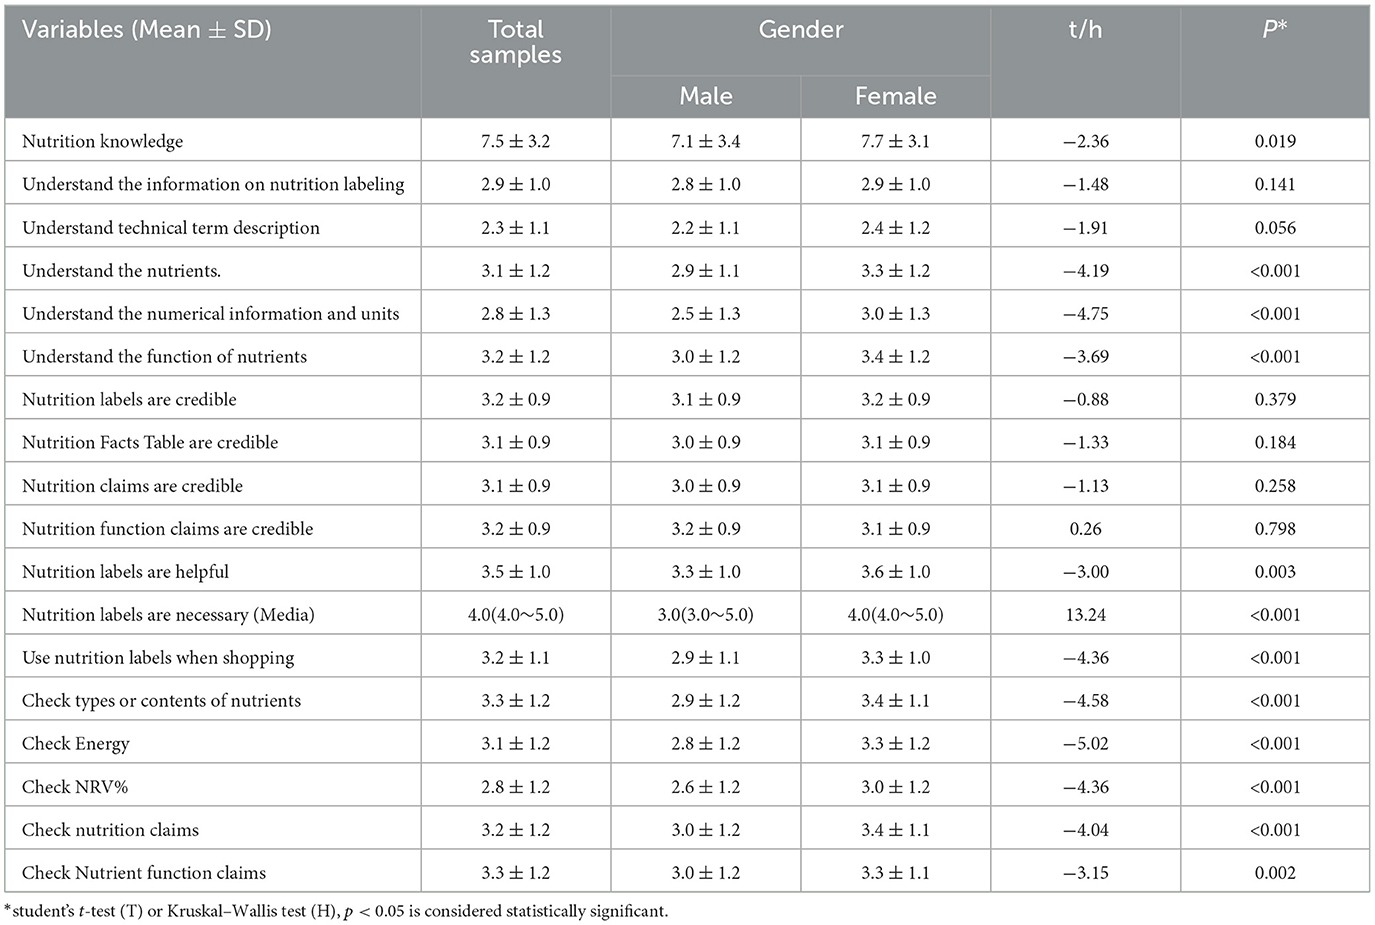
Table 2. Mean scores on knowledge, attitude, and practice scales completed by 636 residents, by gender.
5.3. Knowledge, attitude, and practice of nutrition labeling among residents by different economic conditions
The residents with a higher monthly household income had higher nutrition knowledge scores, and the difference was significant (p < 0.05). The residents with better economic conditions scored higher than those with poorer economic conditions in nutrition labeling knowledge, attitude, and practice, with a significant difference (p < 0.05). However, whether residents checked nutrition claims and nutrient function claims during shopping was not significantly different with respect to their socioeconomic status (p > 0.05), as shown in Table 3.
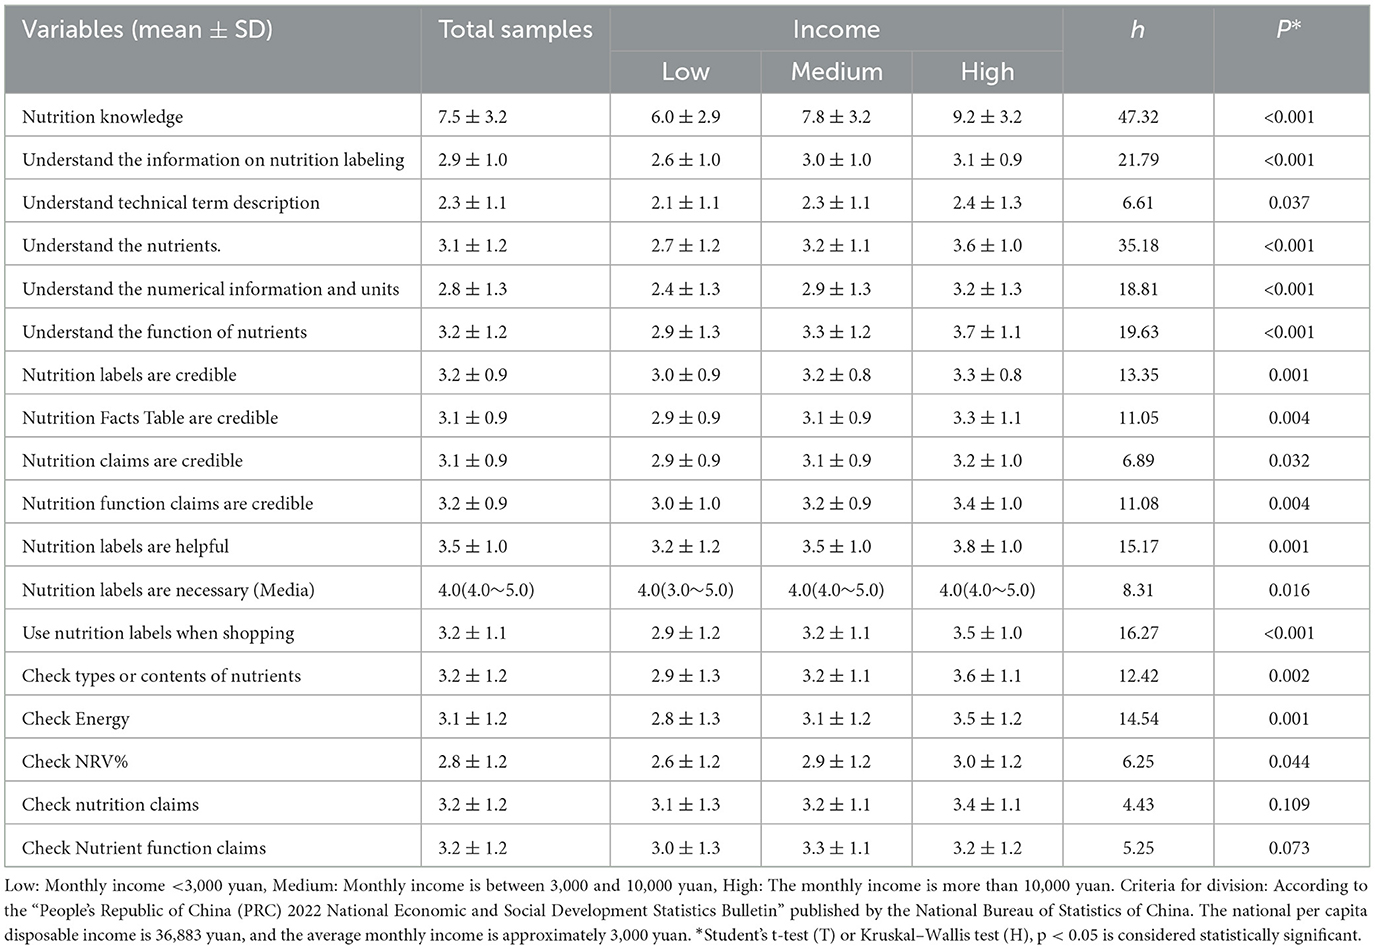
Table 3. Mean scores on knowledge, attitude, and practice scales completed by 636 residents, by income.
Only 25.5% of the residents could understand the information on the nutrition labeling, with the worst understanding of the description of professional terms and the better understanding of the role of nutrients. In total, 76.1% considered it necessary to implement nutrition labeling, and 45.8% of the residents would check the nutrition labeling, but only 38.5% of them said that the nutrition labeling could affect their shopping behavior. Residents still had an inherent distrust on the authenticity of nutrition labeling, with 20.5% of the residents considered that the nutrition labeling was generally untrustworthy, 23.6% considered that the nutrition table was inaccurate, 23.0% considered that the nutrition claims were untrue, and 21% considered that the nutrition function claims were untrustworthy. It can be seen that although residents would check the nutrition label, it does not necessarily affect their shopping behavior, as shown in Table 4.
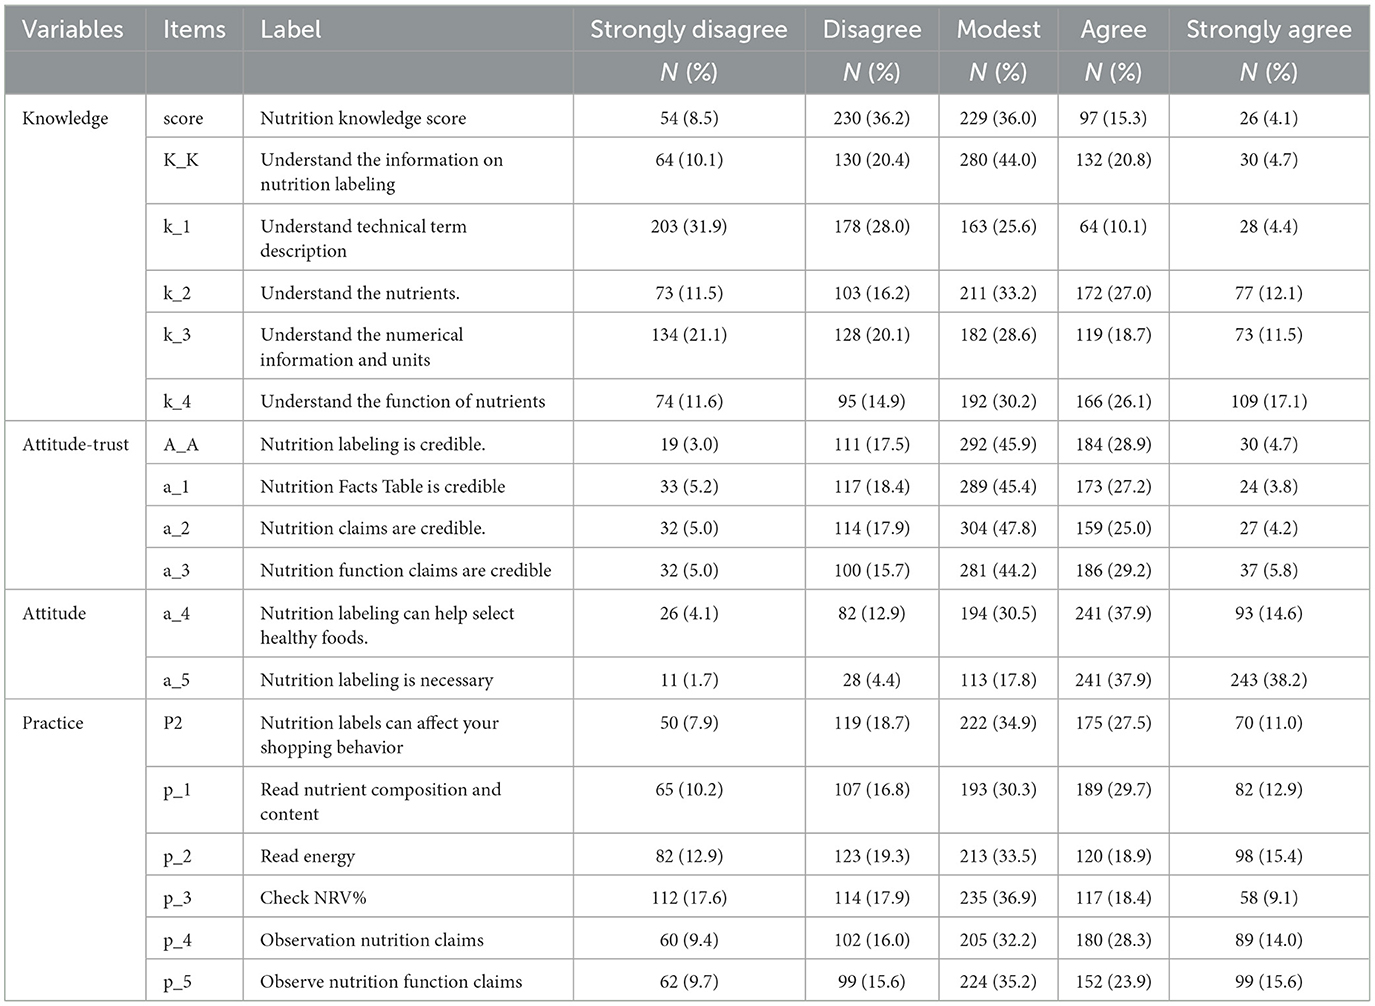
Table 4. Description of variables and summary statistics.
5.4. Discriminant validity analysis and testing the fit of the model
Exploratory factor analysis (EFA) examined the factor structure and adjusted the number of items. Pearson's correlation test was used to analyze the relationships among knowledge, attitude, and behavior. The discriminant validity issue was examined by the square root of the average variance extracted (AVE). There was no identification validity problem in this data, as the value of the square root of the AVE was higher than its correlation with other constructs (44), as shown in Table 5.
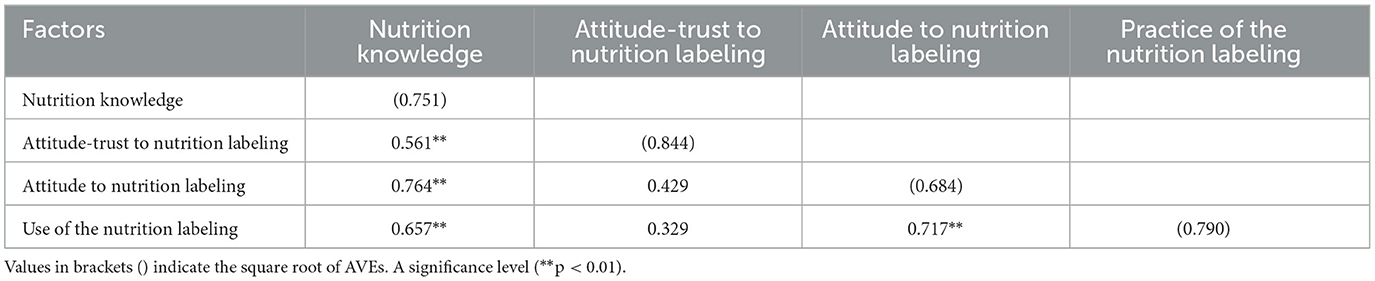
Table 5. Factor correlations and discriminant validity.
Kaiser–Meyer–Olkin (KMO) test and Bartlett's test of sphericity (BTS) revealed that KMO=0.914, BTS was significant (χ2 = 9,834.497, p < 0.001), and the condition of EFA was met, which suggests that these items are suitable for factor analysis (45). The consistency of all scales was tested by composite reliability (CR), and the findings that the average variance extracted (AVE) values exceeded 0.50 for all constructs suggested that the latent constructs retained a minimum of 50% variance. The reliability of the samples was tested by Cronbach's α coefficient, which showed that Cronbach's α = 0.897 for the total scale, and each scale coefficient was >0.83, suggesting good reliability of the questionnaire, as shown in Table 6.
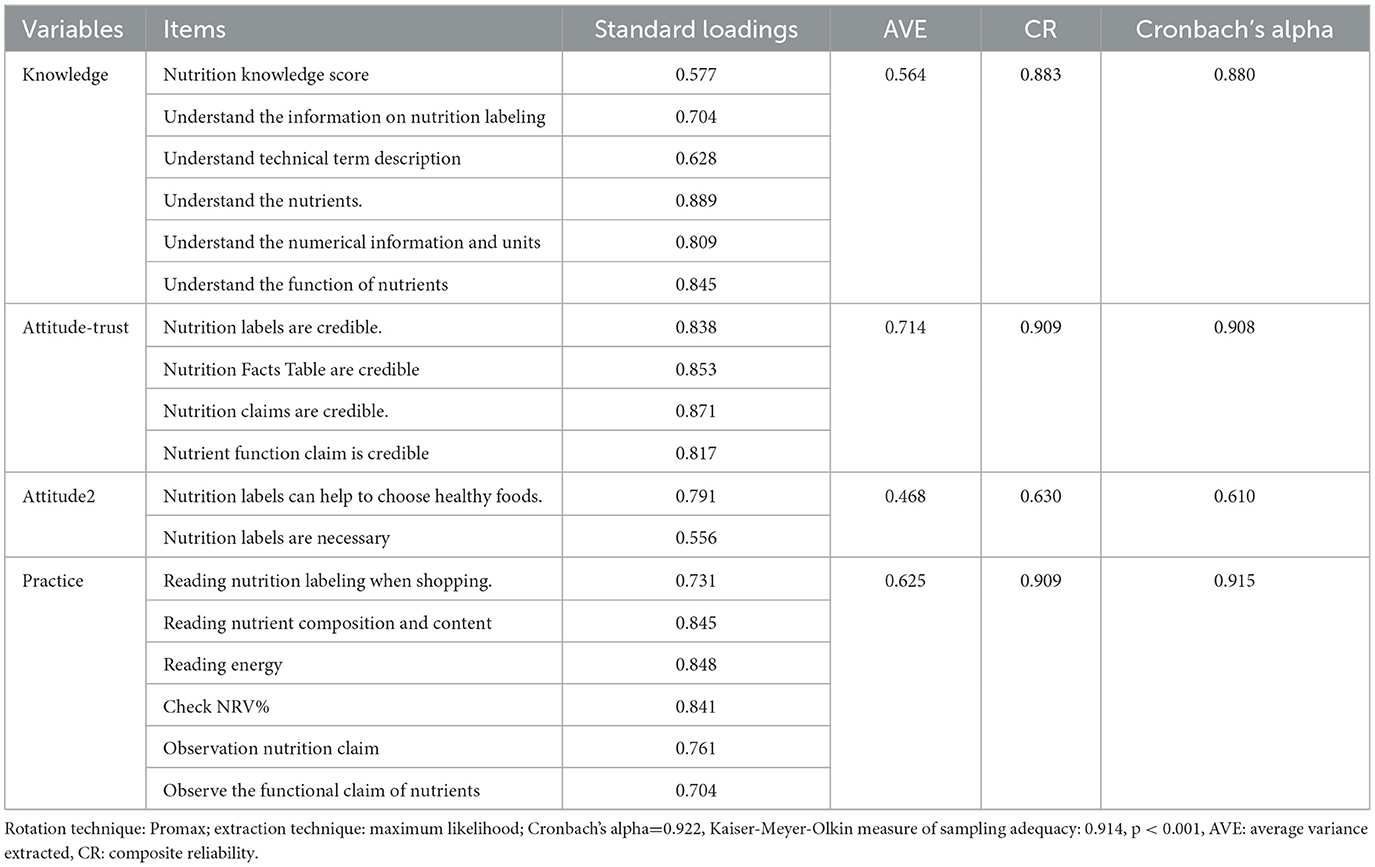
Table 6. Factor loadings and convergent validity results.
5.5. Structural equation modeling fitting for nutrition labels
This study investigates whether nutrition knowledge and attitude affect residents' nutrition label use behavior, whether attitude plays an intermediary role between knowledge and use behavior (46), and whether knowledge can directly affect use behavior. We reviewed the relevant references and subdivided the problem of attitude dimension because we find that when all six attitude problems are included in the model, the final model showed unsatisfactory fitness to the data. To solve the problem of unsatisfactory data fitting, we subdivide attitude factors into two potential variables, attitude–trust and attitude, and establish KAP structural equations. First, we established the K-A(trust)-P structural equation. We found that there was only a slight correlation between attitude (trust) and practice, with a path coefficient of 0.003, and the correlation between them was not significant (p = 0.941). Then, we established the KAP structural equation model and found that there was a significant positive correlation among knowledge, attitude, and practice, and the path coefficient was > 0. In order to observe the correlation between two attitudes potential variables and practice at the same time. Our research group finally combined the two models together to form a new model (Figure 2). The results showed that the path coefficient from attitude (trust) to practice was −0.059, showing a negative correlation. The path coefficient from attitude to practice was 0.517, and there was a positive correlation.
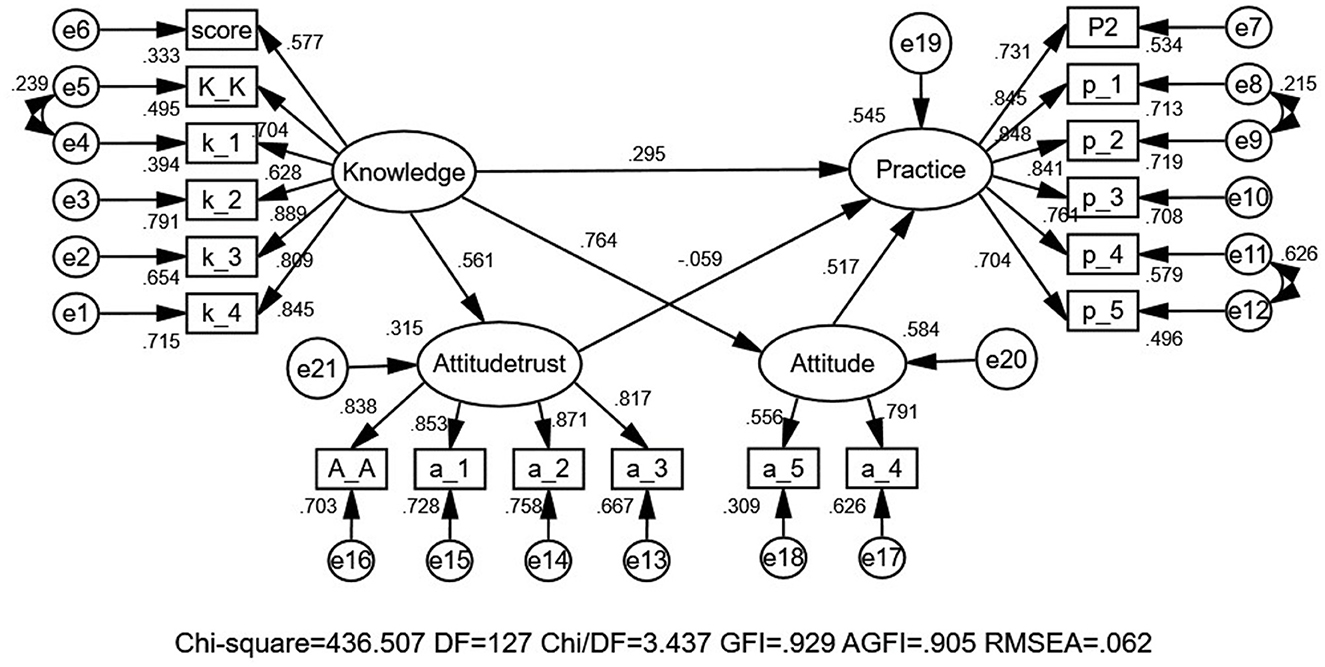
Figure 2. The KAP structural equation model of the nutrition label.
The model fitted the total samples and explored the relationships among knowledge, attitude, and behavior as latent variables. The fitting index of the structural model (CMIN = 436.507, DF = 127, and CMIN/DF = 3.437 (p < 0.05); GFI = 0.929 and AGFI = 0.905; TLI = 0.951, CFI = 0.959, NFI = 0.944, IFI = 0.959, and RMSEA = 0.062) outperformed the respective threshold value, signifying that the data fit the structural model satisfactorily (Table 7).
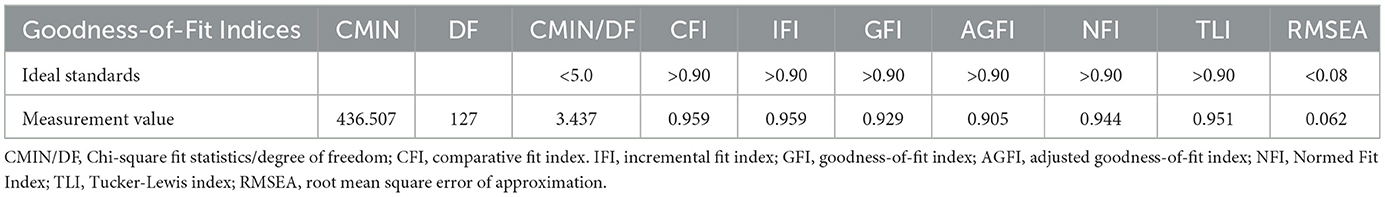
Table 7. Model fitness indices for the modified model.
As shown in Figure 2, Table 8. Hypothesis 1: The path coefficient from knowledge to attitude–trust is 0.561 (p < 0.001), which indicates that residents' nutritional knowledge level is positively and significantly associated with their trust. Hypothesis 2: The path coefficient from knowledge to attitude is 0.764 (p < 0.001), which indicates that residents' nutritional knowledge level is positively and significantly associated with their attitudes. Hypothesis 3: The path coefficient from knowledge to practice is 0.295 (p = 0.001), which indicates that residents' nutrition knowledge will directly impact their use of nutrition labeling, with a positive significant correlation. Hypothesis 4: The path coefficient from attitude–trust to practice is −0.059(p = 0.171), indicating that residents' trust in nutrition labeling was inversely related to practice, and the path coefficient was not insignificant. Hypothesis 5: The path coefficient from attitude to practice is 0.517 (p < 0.001), which indicates that residents' nutrition attitude will impact their use of nutrition labeling, with a positive significant correlation. Thus, hypothesis 5 indicated that attitude played a greater role as an indirect effect between knowledge and behavior, while hypothesis 4 indicates that trust limits residents' practice of nutrition labeling. It could be explained that nutrition knowledge was the prerequisite for label reading behavior, and attitude was the intermediary effect.
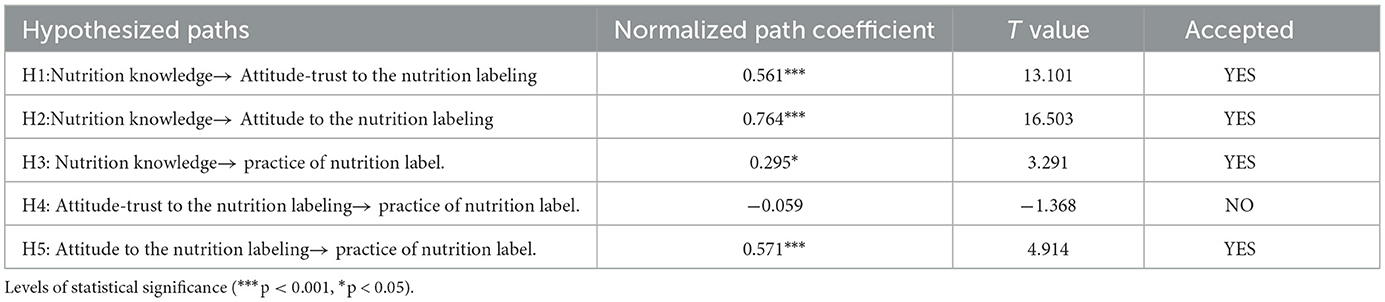
Table 8. Test results of the hypothesis.
6. Discussion
The results of this research indicated that the overall cognition level of community residents on nutrition knowledge was low, with an awareness rate of 32.7%, which was unsatisfactory and lower than the national average level (47). Residents have a positive attitude toward nutrition labeling. Approximately 76.1% of the residents indicate that it was necessary to mark the nutrition label on the food packaging; 52.5% of the residents believed that nutrition labeling could help healthy eating or shopping choices in the future, and 33.6% of the residents considered that the nutrition labeling was credible. In total, 38.5% of participants indicated that nutrition labeling would affect their shopping behavior. However, only 25.3% of the residents could understand nutrition labeling, indicating that most of the residents had a positive attitude toward nutrition labeling, but they lack a correct understanding of nutrition labeling and doubt their authenticity. The main reason may be that the promotion of nutrition labeling in China is done mainly to increase the reliability and marking rate of labels, rather than educating residents on nutrition knowledge popularization, label content interpretation, and use training.
Previous studies have shown that there are still existing obvious gaps between the identification of nutrition labeling and use behavior in real life. Especially, young people who are active consumers of prepackaged foods, have plenty of chances to contact with nutrition labeling but rarely use them effectively in fact. The practice of nutrition labeling not only depends on whether to establish health belief and implement restaurant menu labeling (48, 49) but also depends on demographic, social, and psychological factors of the population. (50). In this study, we found that residents who were young, female, having high education level, and having high socioeconomic status had higher awareness of nutrition labeling and more positive attitudes, and the frequency of checking nutrition labeling is also higher, which was consistent with previous studies (51, 52). With increasing attention to weight loss, calorie intake restriction, and own health in recent years, nutrition labeling can be an effective tool to directly obtain the nutrition information of packaged food for consumers, which can also help consumers to make a healthy choice. Therefore, nutrition labeling plays an indispensable role in helping residents maintain healthy eating habits (53).
The advantage of this study is its adoption of the mature KAP model to analyze Chinese community residents' cognitive status of nutrition labeling, which was divided into knowledge, attitude, and practice, and then establishing the structural equation. Regarding statistical methodological strength, structural equation modeling is superior to multiple linear regression modeling. The structural equation model can analyze multiple dependent variables at the same time, and its application is helpful to scientifically analyze the relationship between indicators. In this study, SEM is helpful to analyze the direct effects of the nutrition label KAP and to reveal these relationships. However, there are still a few limitations in the present study. First of all, more rigorous survey questions need to be designed. For example, participants were likely to make inaccurate responses, since the nutrition labeling contains a lot of information and residents are likely to confuse the list of ingredients with the nutrition fact table. Furthermore, we only used one topic to assess the residents' previous nutrition education experience, and we also tested the residents' subjective knowledge. In future research, we need more objective scales to measure residents' subjective knowledge of nutrition labeling, rather than using simple self-reporting questions, rather than through the use of simple self-reported questions. Finally, our sample size was small, drawn by the convenience sampling method, and hardly ensured that the findings above could be replicated within behavioral studies. Other mediating factors (e.g., peer or parental impact on their use of nutrition labeling, understanding of diet-related disease information, taste or sensory attributes of the product) might more effectively explain that residents' use of nutrition labeling was not included in the study and need to be explored in future studies.
Behavior changes of community residents were divided into three continuous processes: knowledge acquisition, belief generation, and behavior formation, which are positive relations (path coefficients > 0). In this study, the path analysis demonstrated that the path coefficient between nutrition labeling knowledge and trust was 0.561 (p < 0.05), and the path coefficient between nutrition labeling knowledge and attitude was 0.764 (p < 0.05), with a significant positive correlation between them, indicating that residents could form a more positive attitude toward the nutrition labeling if they were knowledgeable about the nutrition labeling. Evelyn et al. (54), Rimpeekool et al. (55), Jackey et al. (56), and Cannoosamy et al. (57) also reported similar results in their respective investigations.
Previous studies have suggested more nutrition knowledge, and health-motivated residents might be more skeptical about nutrition claims and nutrition function claims, thus limiting residents' practice of nutrition labeling. We also tested this relationship, and the correlation analysis found that there was a significant positive correlation between nutrition knowledge and trust (path coefficient = 0.561, p < 0.05), the trust was negatively correlated with nutrition practice, but it was not significant (path coefficient = −0.059, p > 0.05), which may be the most residents are skeptical about the authenticity of nutrition labeling in this study. Residents' trust score is low, which leads to a negative correlation between trust and the practice of nutrition labeling, which was the same as the previous study.
We found that more nutrition knowledge and positive attitudes could increase the practice of nutrition labeling among residents in this research, which was consistent with the results of previous studies (58–61). It means that based on the model, consumers are likely to establish positive beliefs, and finally change use behaviors, once they receive nutrition education (55). However, it should be noted that the residents' trust in nutrition labeling was not significant with their frequency of using nutrition labeling. Therefore, in this study, attitude is a psychological reaction (including helpfulness and necessity) to convince ourselves that nutrition labeling is helpful and useful to select healthy foods, which will further change our practice of nutrition labeling (62, 63).
In summary, we confirmed that residents' nutrition knowledge could be directly converted into nutrition labeling reading behavior or indirectly through changing their attitudes. Residents with higher nutrition labeling knowledge scores and more positive attitude towards nutrition labeling seem to be more likely to obtain the information provided on nutrition labeling. It reflected that knowledge of nutrition was the basis for changing the practice of nutrition labeling. Rich nutrition knowledge can promote the use of nutrition labeling, while poor nutrition knowledge will limit their practice. Therefore, we must pay attention to the synchronous development of nutrition labeling KAP.
7. Conclusion and recommendations
The KAP model is suitable for analyzing the use behaviors of nutrition labeling by local residents. There was a direct and indirect correlation between nutrition knowledge and the practice of nutrition labeling. The attitude of nutrition labeling was positively affected by knowledge, while the use behavior of nutrition labeling was positively affected by knowledge and attitude.
To improve the lifestyle of residents and correctly use nutrition labeling, the following policy recommendations are offered. First, more public education programs (e.g., printing graphic brochures or posters, learning websites, and special lectures) should be implemented in schools and communities. The purpose of public education programs is to make the public aware of “the availability of nutrition information in nutrition labeling and the importance of that information in maintaining healthy dietary practices” to improve their nutrition literacy. Specifically, the interpretation of nutrition labeling needs to be included in the Dietary Guidelines for Chinese Residents and should be disseminated in the annual National Nutrition Week activity. The theme of National Nutrition Week 2022 is Learn How to Cook, How to Select Ingredients Reasonably, and Check Nutrition Labeling. The guideline, “Learn to read food labeling and choose prepackaged foods reasonably”, highlights the core value of “Check Nutrition Labeling”. Second, the concept and function of NRV% and core nutrients on the nutrition facts table, especially sodium and fat, should be conveyed transparent. It is suggested to mark NRV% explanation on food packaging to ensure consumers understanding. Then, it is necessary to strengthen the nutrition education of residents so that they fully understand the meaning of nutrition claims and nutrient function claims and avoid confusing nutrition function claims and health food function claims.
Finally, it will appeal to the relevant departments to implement effective supervision and inspection to ensure the accuracy of nutrition labeling information, which can in turn enhance consumers' confidence in the nutrition labeling. With the government as the leading role and the participation of the whole society, we should strengthen the publicity and education of labeling knowledge and improve residents' nutritional literacy and cognitive attitude toward labeling knowledge to change their behaviors.
Data availability statement
The raw data supporting the conclusions of this article will be made available by the authors, without undue reservation.
Ethics statement
The studies involving human participants were reviewed and approved by Ningxia Medical University Ethics Committee. The patients/participants provided their written informed consent to participate in this study.
Author contributions
JY conceived and designed this research and revised the manuscript. YL was responsible for data analyses and prepared the manuscript. Both authors have read and approved the final version.
Funding
This research was funded by the National Natural Science Foundation of China (Grant number: 82060597), the key research project of Ningxia (Grant number: 2021BEG03031), and New University Think Tank Project in Ningxia—Health Ningxia Service Research Center (Number: 2018-12).
Conflict of interest
The authors declare that the research was conducted in the absence of any commercial or financial relationships that could be construed as a potential conflict of interest.
Publisher's note
All claims expressed in this article are solely those of the authors and do not necessarily represent those of their affiliated organizations, or those of the publisher, the editors and the reviewers. Any product that may be evaluated in this article, or claim that may be made by its manufacturer, is not guaranteed or endorsed by the publisher.
Supplementary material
The Supplementary Material for this article can be found online at: https://www.frontiersin.org/articles/10.3389/fnut.2023.1097562/full#supplementary-material
References
1. Janssen HG, Davies IG, Richardson LD, Stevenson L. Determinants of takeaway and fast food consumption: a narrative review. Nutr Res Rev June. (2018) 31:16–34. doi: 10.1017/S0954422417000178
2. Juul F, Parekh N, Martinez-Steele E, Monteiro CA, Chang VW. Ultra-processed food consumption among US adults from 2001 to 2018. Am J Clin Nutr. (2022) 115:211–21. doi: 10.1093/ajcn/nqab305
3. Wang L, Martínez Steele E, Du M, Pomeranz JL, O'Connor LE, Herrick KA, et al. Trends in consumption of ultraprocessed foods among US youths aged 2-19 years, 1999-2018. Jama. (2021) 326:519–30. doi: 10.1001/jama.2021.10238
4. Zhang J, Wang Z, Du W, Su C, Zhang J, Jiang H, et al. Intake of pre-packaged foods among Chinese adults aged 18-59 years old in 15 provinces, (2015). Wei Sheng Yan Jiu. (2018) 47:183–7. doi: 10.1016/j.jand.2017.08.103
5. Jaworowska A BT, Long R. Nutritional composition of takeaway food in the UK. Nutr Food Sci. (2014) 44:414. doi: 10.1108/NFS-08-2013-0093
6. Richonnet C Mosser F Favre E Robert M Martin F Thiebaut I Nutritional Nutritional quality and degree of processing of children's foods assessment on the French market. Nutrients. (2021) 14:1. doi: 10.3390/nu14010171
7. Popkin BM, Ng SW. The nutrition transition to a stage of high obesity and noncommunicable disease prevalence dominated by ultra-processed foods is not inevitable. Obes Rev. (2022) 23:e13366. doi: 10.1111/obr.13366
8. Jaworowska A, Blackham T, Davies IG, Stevenson L. Nutritional challenges and health implications of takeaway and fast food. Nutr Rev. (2013) 71:310–8. doi: 10.1111/nure.12031
9. Li M Shi Z Ultra-processed food consumption associated with overweight/obesity among chinese adults-results from china health and nutrition survey 1997-2011. Nutrients. (2021) 13:8. doi: 10.3390/nu13082796
10. Nasir A, Bullo MMH, Ahmed Z, Imtiaz A, Yaqoob E, Jadoon M, et al. Nutrigenomics: epigenetics and cancer prevention: a comprehensive review. Crit Rev Food Sci Nutr. (2020) 60:1375–87. doi: 10.1080/10408398.2019.1571480
11. Ni Mhurchu C, Eyles H, Jiang Y, Blakely T. Do nutrition labels influence healthier food choices? Analysis of label viewing behaviour and subsequent food purchases in a labelling intervention trial. Appetite. (2018) 121:360–5. doi: 10.1016/j.appet.2017.11.105
12. Kasapila W, Shaarani SM. Legislation–impact and trends in nutrition labeling: a global overview. Crit Rev Food Sci Nutr. (2016) 56:56–64. doi: 10.1080/10408398.2012.710277
13. Gearhardt AN, Bragg MA, Pearl RL, Schvey NA, Roberto CA, Brownell KD. Obesity and public policy. Annu Rev Clin Psychol. (2012) 8:405–30. doi: 10.1146/annurev-clinpsy-032511-143129
14. Petimar J, Zhang F, Cleveland LP, Simon D, Gortmaker SL, Polacsek M, et al. Estimating the effect of calorie menu labeling on calories purchased in a large restaurant franchise in the southern United States: quasi-experimental study. BMJ (Clinical research ed). (2019) 367:l5837. doi: 10.1136/bmj.l5837
15. Siyi S, Ashkan A, Masha S, Wenjie M, Daniel M, Jessica S, et al. A meta-analysis of food labeling effects on consumer diet behaviors and industry practices. Am J Prev Med. (2019) 56:1–15. doi: 10.1016/j.amepre.2018.09.024
16. Kim J, Dorgan JF, Kim H, Kwon O, Kim Y, Kim Y, et al. Association between Use of Nutrition Labels and Risk of Chronic Kidney Disease: the Korean National Health and Nutrition Examination Survey (KNHANES) 2008-2019. Nutrients. (2022) 14:9. doi: 10.3390/nu14091731
17. Huang Y, Kypridemos C, Liu J, Lee Y, Pearson-Stuttard J, Collins B, et al. Cost-effectiveness of the US food and drug administration added sugar labeling policy for improving diet and health. Circulation. (2019) 139:2613–24. doi: 10.1161/CIRCULATIONAHA.118.036751
18. Tillotson JE. United-States nutrition labeling and education act of (1990). Nutr Rev. (1991) 49:273–6. doi: 10.1111/j.1753-4887.1991.tb07419.x
19. Ministry of Light Industry, Department of Commerce, Ministry of Agriculture . Labelling of foods for Special Nutrient; GB13432-1992. Beijing: The State Bureau of Quality and Technical Supervision, PRC (1992).
20. Ministry of Health (MoH), PRC. General Rules for Nutrition Labeling of Pre-Packaged Food; GB28050-2011. Beijing, China: Ministry of Health (MoH), PRC. (2011).
21. Huang L, Li N, Barzi F, Ma G, Trevena H. Dunford, et al. A systematic review of the prevalence of nutrition labels and completeness of nutrient declarations on pre-packaged foods in China. J Public Health (Oxford, England). (2015) 37:649–58. doi: 10.1093/pubmed/fdu091
22. Liu J. The Baseline Survey of Nutrition Label on Pre-Packaged Food in China. Beijing: Chinese Center for Disease Control and Prevention (2015).
23. Cowburn G, Stockley L. Consumer understanding and use of nutrition labelling: a systematic review. Public Health Nutr. (2005) 8:21–8. doi: 10.1079/PHN2005666
24. Persoskie A, Hennessy E, Nelson WL. US consumers' understanding of nutrition labels in 2013: the importance of health literacy. Prev Chronic Dis. (2017) 14:E86. doi: 10.5888/pcd14.170066
25. Van der Horst K Bucher T Duncanson K Murawski B Labbe D Consumer understanding perception perception and interpretation of serving size information on food labels: a scoping review. Nutrients. (2019) 11:9. doi: 10.3390/nu11092189
26. Steinhauser J, Janssen M, Hamm U. Who buys products with nutrition and health claims? A purchase simulation with eye tracking on the influence of consumers' nutrition knowledge and health motivation. Nutrients. (2019) 11:9. doi: 10.3390/nu11092199
27. Buyuktuncer Z, Ayaz A, Dedebayraktar D, Inan-Eroglu E, Ellahi B, Besler HT. Promoting a healthy diet in young adults: the role of nutrition labelling. Nutrients. (2018) 10:1–12. doi: 10.3390/nu10101335
28. Cleland J. A critique of KAP studies and some suggestions for their improvement. Stud Fam Plann. (1973) 4:42–7. doi: 10.2307/1964829
29. Herbuela V, de Guzman FS, Sobrepeña GD, Claudio ABF, Tomas ACV, Arriola-Delos Reyes CM, et al. Knowledge, attitude, and practices regarding dengue fever among pediatric and adult in-patients in metro manila, philippines. Int J Environ Res Public Health. (2019) 16:23. doi: 10.3390/ijerph16234705
30. Datiko DG, Habte D, Jerene D, Suarez P. Knowledge, attitudes, and practices related to TB among the general population of Ethiopia: findings from a national cross-sectional survey. PLoS One. (2019) 14:e0224196. doi: 10.1371/journal.pone.0224196
31. Anyolitho MK, Poels K, Huyse T, Tumusiime J, Mugabi F, Tolo CU, et al. Knowledge, attitudes, and practices regarding schistosomiasis infection and prevention: a mixed-methods study among endemic communities of western Uganda. PLoS Negl Trop Dis. (2022) 16:e0010190. doi: 10.1371/journal.pntd.0010190
32. Gautam A, Bhatta DN, Aryal UR. Diabetes related health knowledge, attitude and practice among diabetic patients in Nepal. BMC Endocr Disord. (2015) 15:25. doi: 10.1186/s12902-015-0021-6
33. Eghbali-Babadi M, Feizi A, Khosravi A, Sarrafzadegan N. The effect of training on knowledge, attitude, and practice in patients with hypertension; the application of the expanded chronic care model: a clinical trial study. Iran Red Crescent Med J. (2018) 20:e61693. doi: 10.5812/ircmj.61693
34. Huang Z, Li H, Huang J. Analysis of Chinese consumers' nutrition facts table use behavior based on knowledge-attitude-practice model. Int J Environ Res Public Health. (2021) 18:22. doi: 10.3390/ijerph182212247
35. Zeying H Beixun H Jiazhang H The The relationship between nutrition knowledge and nutrition facts table use in China: A structural equation model. Int J Environ Res Public Health. (2021). 18 (12). doi: 10.3390/ijerph18126307
36. Misra R. Knowledge, attitudes, and label use among college students. J Am Diet Assoc. (2007) 107:2130–4. doi: 10.1016/j.jada.2007.09.001
37. Alrubaiee GG Al-Qalah TAH Al-Aawar MSA Knowledge attitudes anxiety and preventive behaviours towards COVID-19 among health care providers in Yemen: an online cross-sectional survey. BMC Public Health. (2020) 20:1541. doi: 10.1186/s12889-020-09644-y
38. Zheng S, Zhao L, Ju N, Hua T, Zhang S, Liao S. Relationship between oral health-related knowledge, attitudes, practice, self-rated oral health and oral health-related quality of life among Chinese college students: a structural equation modeling approach. BMC Oral Health. (2021) 21:99. doi: 10.1186/s12903-021-01419-0
39. Tarka P. An overview of structural equation modeling: its beginnings, historical development, usefulness and controversies in the social sciences. Qual Quant. (2018) 52:313–54. doi: 10.1007/s11135-017-0469-8
40. Seer C, Sidlauskaite J, Lange F, Rodríguez-Nieto G, Swinnen SP. Cognition and action: a latent variable approach to study contributions of executive functions to motor control in older adults. Aging. (2021) 13:15942–63. doi: 10.18632/aging.203239
41. Gochman DS. Health Behavior: Emerging Research Perspectives. Health Behavior: Emerging Research Perspectives. (1998). doi: 10.1007/978-1-4899-0833-9
42. Cui, X. Study on mechanism of Changchun consumer pre-packaged food nutrition label Knowledge-Attitude-Practice investigation. Changchun: Changchun University of Chinese Medicine. (2019)
43. Liu, C. College Students' Food Nutrition Labeling K-A-P Survey and Analysis of the Influencing Factors. Guangzhou: Jinan University. (2013).
44. Kline RB. Principles and practice of structural equation modeling. J Am Statist Assoc. (2011) 101:1941–7. doi: 10.1002/0470013192.bsa655
45. Kaiser HF. An index of factorial simplicity. Psychometrika. (1974) 39:31–6. doi: 10.1007/BF02291575
46. Baron RM, Kenny DA. The moderator-mediator variable distinction in social psychological research: conceptual, strategic, statistical considerations. J Pers Soc Psychol. (1986) 51:1173–82. doi: 10.1037/0022-3514.51.6.1173
47. Zhang, J, Huang, F, Zhai, F, Zhang, B. Investigation on the consumption KAP of Pre-packaged food among urban residents in China. Food Nutr China. (2015) 21:46–8.
48. Bergman C, Tian Y, Moreo A, Raab C. Menu engineering and dietary behavior impact on young adults' kilocalorie choice. Nutrients. (2021) 13:7. doi: 10.3390/nu13072329
49. Sacco J, Lillico HG, Chen E, Hobin E. The influence of menu labelling on food choices among children and adolescents: a systematic review of the literature. Perspect Public Health. (2017) 137:173–81. doi: 10.1177/1757913916658498
50. Redmond L, Walch A. College student perceptions and utilization of food and nutrition resources on campus: study protocol. Curr Dev Nutr. (2020) 4:1740. doi: 10.1093/cdn/nzaa065_005
51. Christoph MJ, An R, Ellison B. Correlates of nutrition label use among college students and young adults: a review. Public Health Nutr. (2016) 19:2135–48. doi: 10.1017/S1368980015003183
52. Miller LM, Applegate E, Beckett LA, Wilson MD, Gibson TN. Age differences in the use of serving size information on food labels: numeracy or attention? Public Health Nutr. (2017) 20:786–96. doi: 10.1017/S1368980016003219
53. Hawkes C, Smith TG, Jewell J, Wardle J, Hammond RA, Friel S, et al. Smart food policies for obesity prevention. Lancet. (2015) 385:9985. doi: 10.1016/S0140-6736(14)61745-1
54. Evelyn H, Aziz AF, Sariman S. Associations of knowledge, attitude and practices of food label on cardiovascular diseases (CVD) risk amongst university students in Selangor, Malaysia. J Nutr Sci Vitaminol (Tokyo). (2020) 66:S275–s282. doi: 10.3177/jnsv.66.S275
55. Rimpeekool W, Banwell C, Seubsman S, Kirk M, Yiengprugsawan V, Sleigh A. “I rarely read the label”: factors that influence thai consumer responses to nutrition labels. Glob J Health Sci. (2015) 8:21–8. doi: 10.5539/gjhs.v8n1p21
56. Jackey BA, Cotugna N, Orsega-Smith E. Food label knowledge, usage and attitudes of older adults. J Nutr Gerontol Geriatr. (2017) 36:31–47. doi: 10.1080/21551197.2017.1280868
57. Cannoosamy K, Pugo-Gunsam P, Jeewon R. Consumer knowledge and attitudes toward nutritional labels. J Nutr Educ Behav. (2014) 46:334–40. doi: 10.1016/j.jneb.2014.03.010
58. Miller LM, Cassady DL. The effects of nutrition knowledge on food label use. A review of the literature. Appetite. (2015) 92:207–16. doi: 10.1016/j.appet.2015.05.029
59. Dumoitier A, Abbo V, Neuhofer ZT, McFadden BR. A review of nutrition labeling and food choice in the United States. Obesity Sci Pract. (2019) 5:581–91. doi: 10.1002/osp4.374
60. Grunert KG, Wills JM, Fernández-Celemín L. Nutrition knowledge, and use and understanding of nutrition information on food labels among consumers in the UK. Appetite. (2010) 55:177–89. doi: 10.1016/j.appet.2010.05.045
61. Giró-Candanedo M, Claret A, Fulladosa E, Guerrero L. Use and understanding of nutrition labels: impact of diet attachment. Foods. (2022) 11:13. doi: 10.3390/foods11131918
62. Nurliyana G, Norazmir MN, Anuar M. Knowledge, attitude and practices of university students regarding the use of nutritional information and food labels. Asian J Clini Nutr. (2011) 3:79–91. doi: 10.3923/ajcn.2011.79.91
Keywords: prepackaged food, nutrition labeling, knowledge-attitude-practice model, residents, structural equation model
Citation: Liao Y and Yang J (2023) Status of nutrition labeling knowledge, attitude, and practice (KAP) of residents in the community and structural equation modeling analysis. Front. Nutr. 10:1097562. doi: 10.3389/fnut.2023.1097562
Received: 14 November 2022; Accepted: 20 March 2023;
Published: 17 April 2023.
Edited by:
Mauro Serafini, University of Teramo, ItalyReviewed by:
Zuraidah Zainol, Sultan Idris University of Education, MalaysiaGreta Krešić, University of Rijeka, Croatia
Copyright © 2023 Liao and Yang. This is an open-access article distributed under the terms of the Creative Commons Attribution License (CC BY). The use, distribution or reproduction in other forums is permitted, provided the original author(s) and the copyright owner(s) are credited and that the original publication in this journal is cited, in accordance with accepted academic practice. No use, distribution or reproduction is permitted which does not comply with these terms.
*Correspondence: Jianjun Yang, yangjianjun_1969@163.com