 Yutao Wang1†
 Kexin Yan2†
 Jiaxing Lin1
 Yang Liu1Jianfeng Wang1Xuejie Li1Xinxin Li1Zhixiong Hua1Zhenhua Zheng1Jianxiu Shi1Siqing Sun1Jianbin Bi1*
- 1Department of Urology, China Medical University, The First Hospital of China Medical University, Shenyang, China
- 2Department of Dermatology, China Medical University, The First Hospital of China Medical University, Shenyang, China
Purpose: To identify immune-related co-expressed genes that promote CD8+ T cell infiltration in bladder cancer, and to explore the interactions among relevant genes in the tumor microenvironment.
Method: We obtained bladder cancer gene matrix and clinical information data from TCGA, GSE32894 and GSE48075. The “estimate” package was used to calculate tumor purity and immune score. The CIBERSORT algorithm was used to assess CD8+ T cell proportions. Weighted gene co-expression network analysis was used to identify the co-expression modules with CD8+ T cell proportions and bladder tumor purity. Subsequently, we performed correlation analysis among angiogenesis factors, angiogenesis inhibitors, immune inflammatory responses, and CD8+ T cell related genes in tumor microenvironment.
Results: A CD8+ T cell related co-expression network was identified. Eight co-expressed genes (PSMB8, PSMB9, PSMB10, PSME2, TAP1, IRF1, FBOX6, ETV7) were identified as CD8+ T cell-related genes that promoted infiltration of CD8+ T cells, and were enriched in the MHC class I tumor antigen presentation process. The proteins level encoded by these genes (PSMB10, PSMB9, PSMB8, TAP1, IRF1, and FBXO6) were lower in the high clinical grade patients, which suggested the clinical phenotype correlation both in mRNA and protein levels. These factors negatively correlated with angiogenesis factors and positively correlated with angiogenesis inhibitors. PD-1 and PD-L1 positively correlated with these genes which suggested PD-1 expression level positively correlated with the biological process composed by these co-expression genes. In the high expression group of these genes, inflammation and immune response were more intense, and the tumor purity was lower, suggesting that these genes were immune protective factors that improved the prognosis in patients with bladder cancer.
Conclusion: These co-expressed genes promote high levels of infiltration of CD8+ T cells in an immunoproteasome process involved in MHC class I molecules. The mechanism might provide new pathways for treatment of patients who are insensitive to PD-1 immunotherapy due to low degrees of CD8+ T cell infiltration.
Introduction
Urothelial carcinomas (UCs) are the fourth most common tumors in developed countries (1). There has been no significant improvement of patient survival over the past 15 years (2). Tumor-related fatality rates for breast cancer, prostate cancer, colorectal cancer, and lung cancer decreased by about 20–40%, while that of bladder cancer decreased by less than 5% (2). For this reason, it is important to identify treatments that improve the prognosis in bladder cancer patients. Bladder cancer is characterized by high mutation rate and many neoplastic antigens (3). Immune checkpoint treatment has become an important treatment method after adjuvant bladder cancer chemotherapy (4). PD-1 is an immune checkpoint protein on T cells that binds to PD-L1 on tumor cells, limits inflammatory and immune responses, and protects tumor cells from T-cell attack (5–8). In recent years, five therapies targeting the programmed cell death protein (PD-1) and programmed cell death ligand 1 (PD-L1) axis were approved for bladder cancer (9), improving prognosis in patients with advanced bladder cancer. Nevertheless, the therapy for progression post PD1/L1 inhibitors is now available but not curative (10). This might be due to the lack of activated T lymphocyte infiltration at the tumor site and the low expression level in the CD8+ T lymphocyte (11). These findings suggest that exploring the specific mechanisms of promoting T lymphocytes infiltration may result in improving the effective rate of PD-1 treatment.
CD4+ T cells and CD8+ T cells are modifiers that determine the clinical response in cancer immunotherapies (12). During antigen processing, exogenous antigen peptides bind to major histocompatibility complex (MHC) class II molecules and modulate immune responses of CD4+ T cells, while endogenous antigen peptides (usually 8–10 amino-acid residues long) bind to major histocompatibility complex (MHC) class I molecules and modulate immune responses of CD8+ T cells (13). Tumor antigens are degraded by immunoproteasomes and transporters in antigen-presenting cells (APC) (14), and are recognized by CD8+ T cells after binding to MHC class I (15). Bladder cancer patients with high levels of infiltration of CD8+ T cells in tumor sites showed better prognosis (16, 17). This suggests that CD8+ T cells play an important role in bladder tumor immunity. Weighted gene co-expression network analysis (WGCNA) in the R package identifies co-expressed genes with similar biological functions (18); this algorithm helps identify co-expressed genes that promote CD8+ T cell infiltration, and may identify treatment pathways for patients who are not sensitive to immunotherapy because of a low degree of T lymphocyte infiltration.
In this paper, we identified eight co-expression genes promoting CD8+ T cells in bladder cancer. These eight genes were involved in MHC class I antigen process, suggesting a positive correlation between MHC class I antigen process and CD8+ T cells infiltration level. Next, we explored the correlation of their expression with angiogenic factors, angiogenesis inhibitors, tumor purity, inflammation, and immune responses, and verified correlations of CD8+ T cell infiltration in other cancers.
Materials and Methods
Data Source
We downloaded The Cancer Genome Atlas (TCGA)-BLCA FPKM data (http://cancergenome.nih.gov/) containing 414 cancer tissue samples and 19 normal tissues. GSE32894 (19) and GSE48075 (20) were also downloaded from the GEO (http://www.ncbi.nlm.nih.gov/geo/) database whose platform is GPL6947. GSE32894 contained 308 urothelial cancer samples and GSE48075 contained 142 primary bladder samples.
Lymphocyte Proportion and Tumor Purity
CIBERSORT is an algorithm that analyzes the cell proportion in bulk tissue gene expression matrices (21). LM22 is a gene signature matrix that defines 22 immune cell subtypes; it was download from the CIBERSORT website portal (https://cibersort.stanford.edu/). We analyzed CD8+ T cell proportions based on the LM22 matrix and CIBERSORT algorithm, and samples with P < 0.05 was considered to be significant and were considered in this study. The Estimation of Stromal and Immune cells in Malignant Tumor tissues using Expression data (ESTIMATE) is a method that infers the fraction of stromal and immune cells using gene expression signatures (22). Using the ESTIMATE package, we calculated stromal Scores, immune Scores, and tumor purity in each bladder cancer sample.
WGCNA
WGCNA is a system biology approach that converts co-expression correlations into connection weights or topology overlap values (18). We used it to determine CD8+ T cell co-expressed genes. The expression patterns were similar for genes involved in the same pathway or biological process (23). In this paper, to build a scale-free topology network, we set the soft threshold as 5, R square = 0.98, and the number of genes in the minimum module as 30. We input the CD8+ T cell proportion, stromal scores, immune scores, and tumor purity as phenotype files. In this manner, a cluster of CD8+ T cell infiltration-related genes with similar function were identified using WGCNA (24).
Protein Network and Function Enrichment
The genes were selected using Pearson correlation coefficient >0.4 between genes and CD8+ T cell proportions. The co-expression modules of these T cell infiltration-related genes were generated using Cytoscape software. The Database for Annotation, Visualization and Integrated Discovery (DAVID, v6.8) is an open source database that performs function enrichment (25). We used the Kyoto Encyclopedia of Genes and Genomes (KEGG) (https://www.genome.jp/kegg/) (26) and Gene Ontology (GO) (http://geneontology.org/) analysis (27) to identify the biological function in each co-expression module.
The Human Protein Atlas (HPA)
The HPA database (http://www.proteinatlas.org/) was applied to show the difference of the co-expression genes in protein level, the color intensity was used to assess the protein expression level.
Immune Microenvironment Correlation Analysis
We explored the correlations between CD8+ T cells and angiogenic factors, angiogenesis inhibitors, tumor purity, inflammation, and immune responses. VEGFD (28), PDGFD (29), PDGFRA (30), FGFR1, FGFR2, FGF7, FGF12 (31), TGFBR2, and TGFBR3 (32) were considered angiogenic factors. IL12A, IL12B, IL12RB1, IL12RB2, IL10RA, IFNL1, IFNL2, and IFNL3 (33) were considered angiogenic inhibitors. Seven metagene sets included lymphocyte‐specific kinase (LCK), hemopoietic cell kinase (MCK), major histocompatibility complex class I (MHC‐I), immunoglobulin G (IgG), major histocompatibility complex class II (MHC II), signal transducer and activator of transcription 1 (STAT1), and interferon (34). All of these were considered different types of inflammation and immune responses. Next, we calculated the correlations between CD8+ T cell infiltration genes and tumor purity based on TCGA.
GSEA
Gene set enrichment analysis (GSEA) is a calculation method that determines the significance and consistency differences of a predefined dataset between two biological states (35). The gene matrix in TCGA was divided into high and low expression groups, in accordance with the median expression level of CD8+ T cell infiltration-related genes. Based on allocation, biological functions related to the high expression group was identified, allowing us to identify the mechanisms underlying the role of CD8+ T cell infiltration-related co-expression genes.
Pan-Cancer Analysis
The Tumor Immune Estimation Resource (TIMER; https://cistrome.shinyapps.io/timer/) (36) was used to analyze the correlations between CD8+ T cells and 33 types of cancer. A correlation coefficient >0.4 was considered significant.
Statistical Analysis
Statistical analysis was carried out using GraphPad Prism 8 and R 3.6.3 (https://www.r-project.org/). Student’s t-tests are used to analyze expression differences and CD8+ T cell proportion differences in subgroups. Co-expression coefficients were calculated using the Pearson correlation. The subgroups were divided based on the median value. Kaplan–Meier survival analysis was applied to generate overall survival curves and the log-rank test was used to calculate the significance. Independent prognostic factors were selected using the univariate Cox regression method. The “survival,” “ggplot2,” “corrplot,” “pheatmap,” and “limma” packages were built using R version 3.6.3. Differences with P < 0.05 were significant.
Results
CD8+ T Cell Related Modules
The results of our methodology are explained in Figure 1A. The interactions among CD8+ T cell infiltration-related co-expressed genes are shown in Figure 1B.
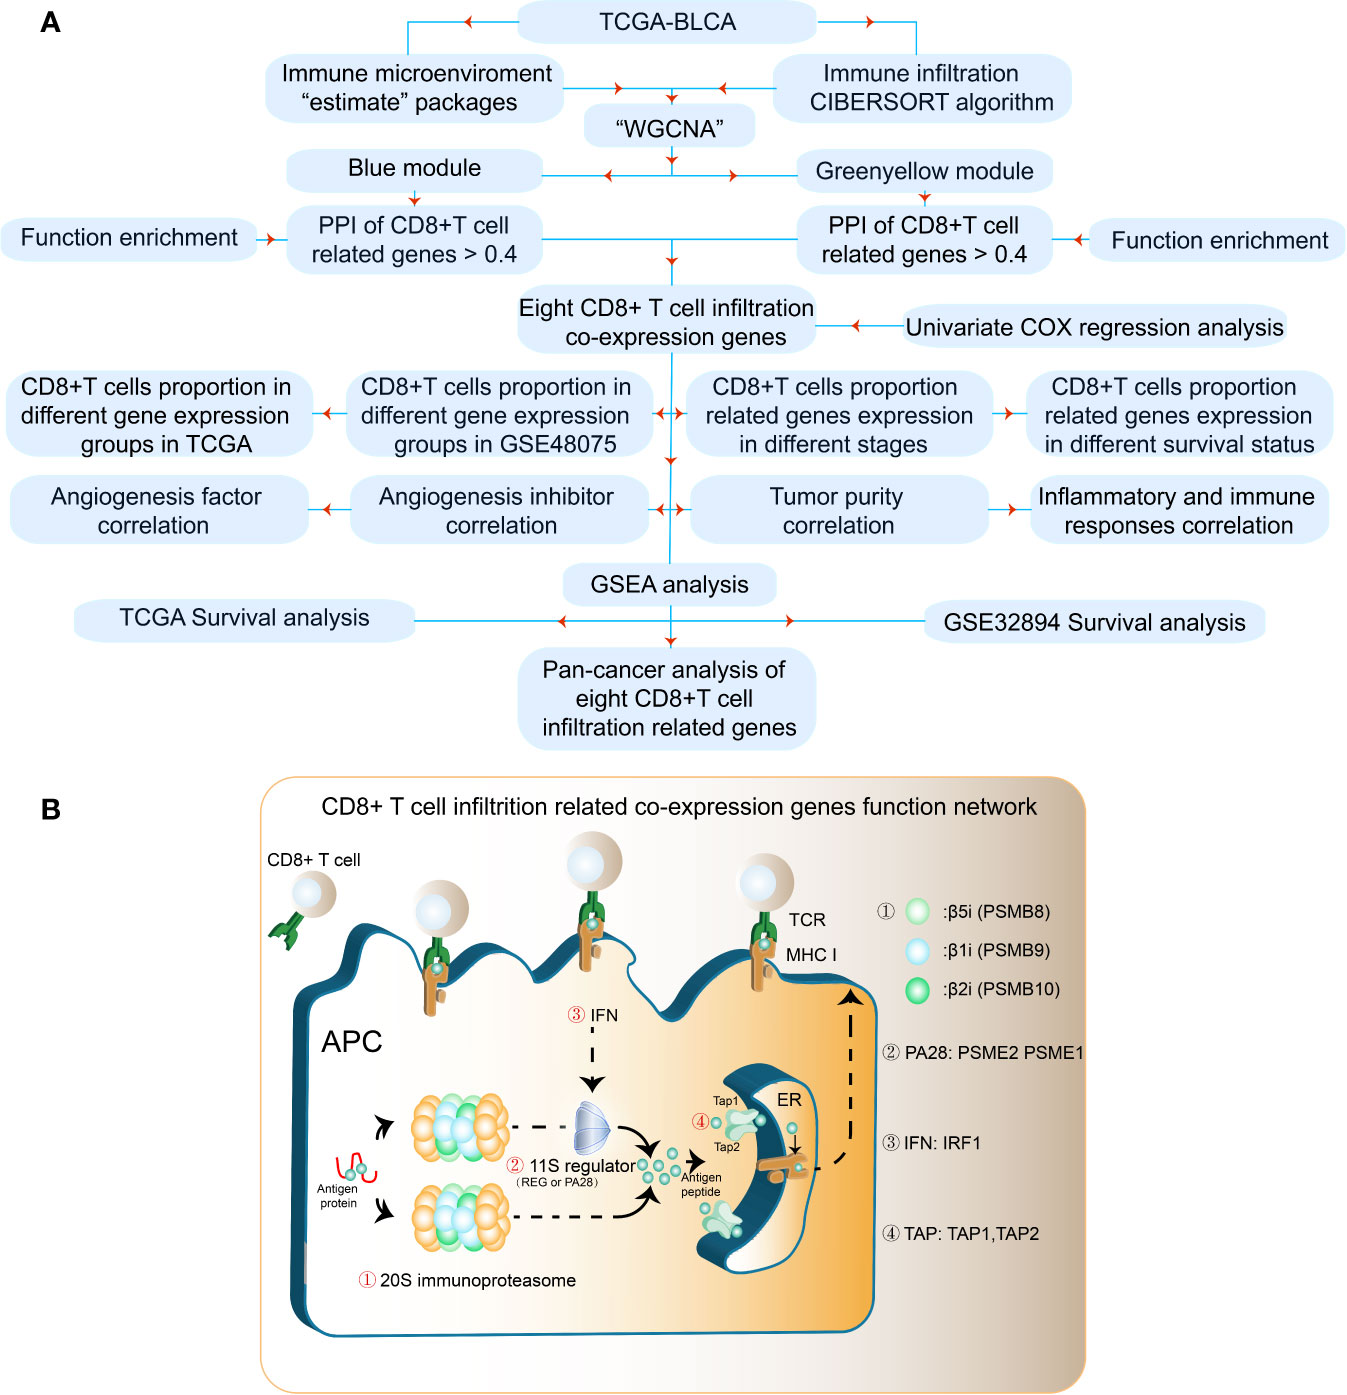
Figure 1 Flowchart for identifying CD8+ T cell-promoting co-expressed genes. (A) TCGA-BLCA FPKM contained 414 cancer tissue samples and 19 normal tissues. GSE32894 contained 308 urothelial cancer samples and GSE48075 contained 142 primary bladder samples. WGCNA was used generate a co-expression network. GO analyses were applied to identify CD8+ T cell-related modules. Independent prognostic factors were selected using univariate Cox regression. (B) The antigen peptide presentation process is shown. Immunoproteasomes are composed of 20S subunits. PSMB8, PSMB9, and PSMB10 are the core of the 20S subunit. PA28 (PSEM2) is a regulator of immunoproteasomes that enhances the activity of the 20S subunit. Transporters associated with antigen processing (TAP1 and TAP2) reside in the endoplasmic reticulum (ER), and transport antigen peptides into the ER. The IFN-regulatory factor 1 protein (IRF1) is up-regulated by IFNγ, and upregulates MHC class I antigen peptide presentation-related processes.
We obtained 243 samples with complete clinical information and proportion of immune cell infiltration assessment. The proportion of CD8+ T cells and the survival status are illustrated in Figure 2A, the red point means death status at the end point. The tumor purity heatmap is illustrated in Figure 2B. We clustered the samples by cut Height = 20,000, and 226 samples were included. The sample dendrogram of 226 samples and trait map are illustrated in Figure 2C. To build a co-expression network, we used a dynamic hybrid cutting method to build a hierarchical clustering tree, where each leaf on the tree represents a gene, and each branch represents a co-expression module; 28 co-expression models were generated (Figure 2D). The correlation coefficients among various phenotypes and co-expression modules were calculated (Figure 3A); 32 CD8+ T cell infiltration-related co-expressed genes were selected with correlation coefficients >0.4. The gene significances for these 32 CD8+ T cells related genes are displayed in Table 1. The 32 genes were mostly involved in the blue and green-yellow modules. The blue module was highly correlated with stromal Score (R2 = 0.77, P = 4.3e-79), immune score (R2 = 0.85, P = 5.2 e-112), estimate score (R2 = 0.87, P = 2.3e-123), and tumor purity (R2 = 0.88, P = 8.8e-130), while the green-yellow module showed higher correlation with CD8+ T cells (R2 = 0.66, P = 2.2e-24) (Figure 3B). Next, we explored the functions of the blue and green-yellow modules. The genes in the blue module were enriched in antigen process and presentation via MHC class II molecules (Figure 4A), while the genes in the green-yellow module were enriched in antigen process and presentation via MHC class I molecules (Figure 4B). The univariate Cox regression method was used to calculate the independent prognostic effect of 32 genes (Table 2). We focused on the green-yellow module based on the antigen presentation via MHC class I molecules, and we were interested in several genes (PSMB8, PSMB9, PSMB10, PSME2, TAP1, IRF1, FBOX6, ETV7) with independent prognostic effects (p < 0.01). The correlation between co-expression genes and CD8+ T cells proportion was showed in Figure 5A. The correlation between co-expression genes and tumor mutation burden (TMB) was showed in Figure 5B, although the correlation was not statistically significant, positive correlation between co-expression genes and tumor mutation burden was shown.
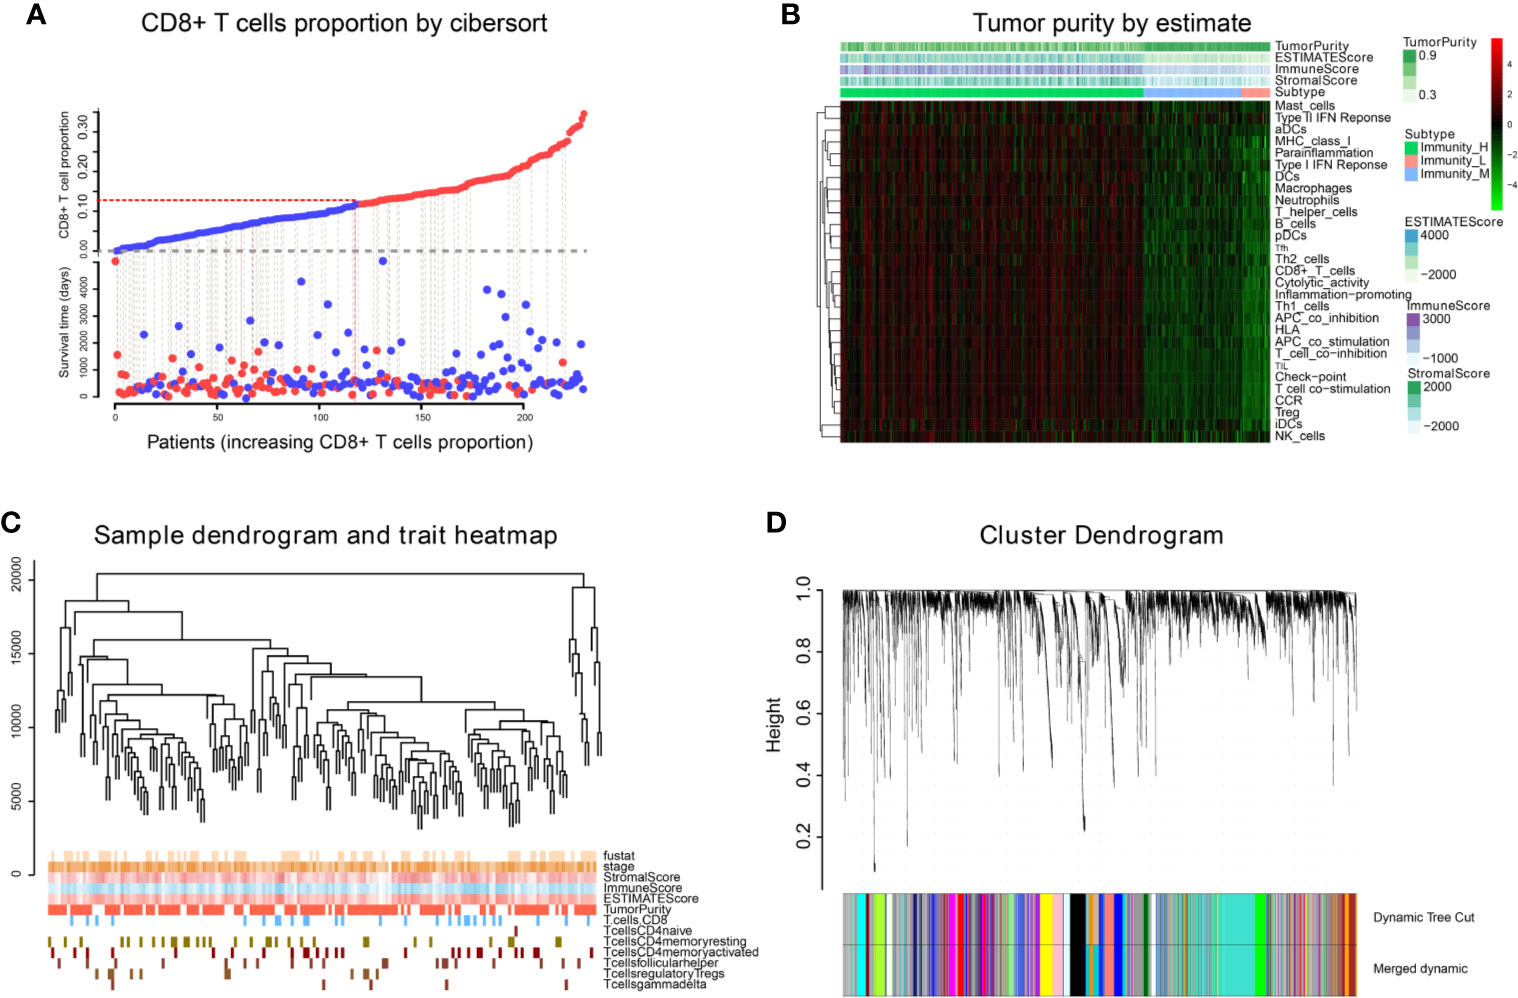
Figure 2 WGCNA analysis. (A) The infiltration proportion of CD8+ T cells in TCGA. (B) The immune score, estimate score, stromal score, and tumor purity of TCGA-BLCA are shown, and were inputted as phenotype information for WGCNA analysis. (C) We clustered the samples by cut Height = 20,000, and 226 samples were included. The sample dendrogram of 226 samples and trait map are shown. (D) Hierarchical clustering tree was built using the dynamic hybrid cutting method, where each leaf on the tree represents a gene, and each branch represents a co-expression module; 28 co-expression models were generated.
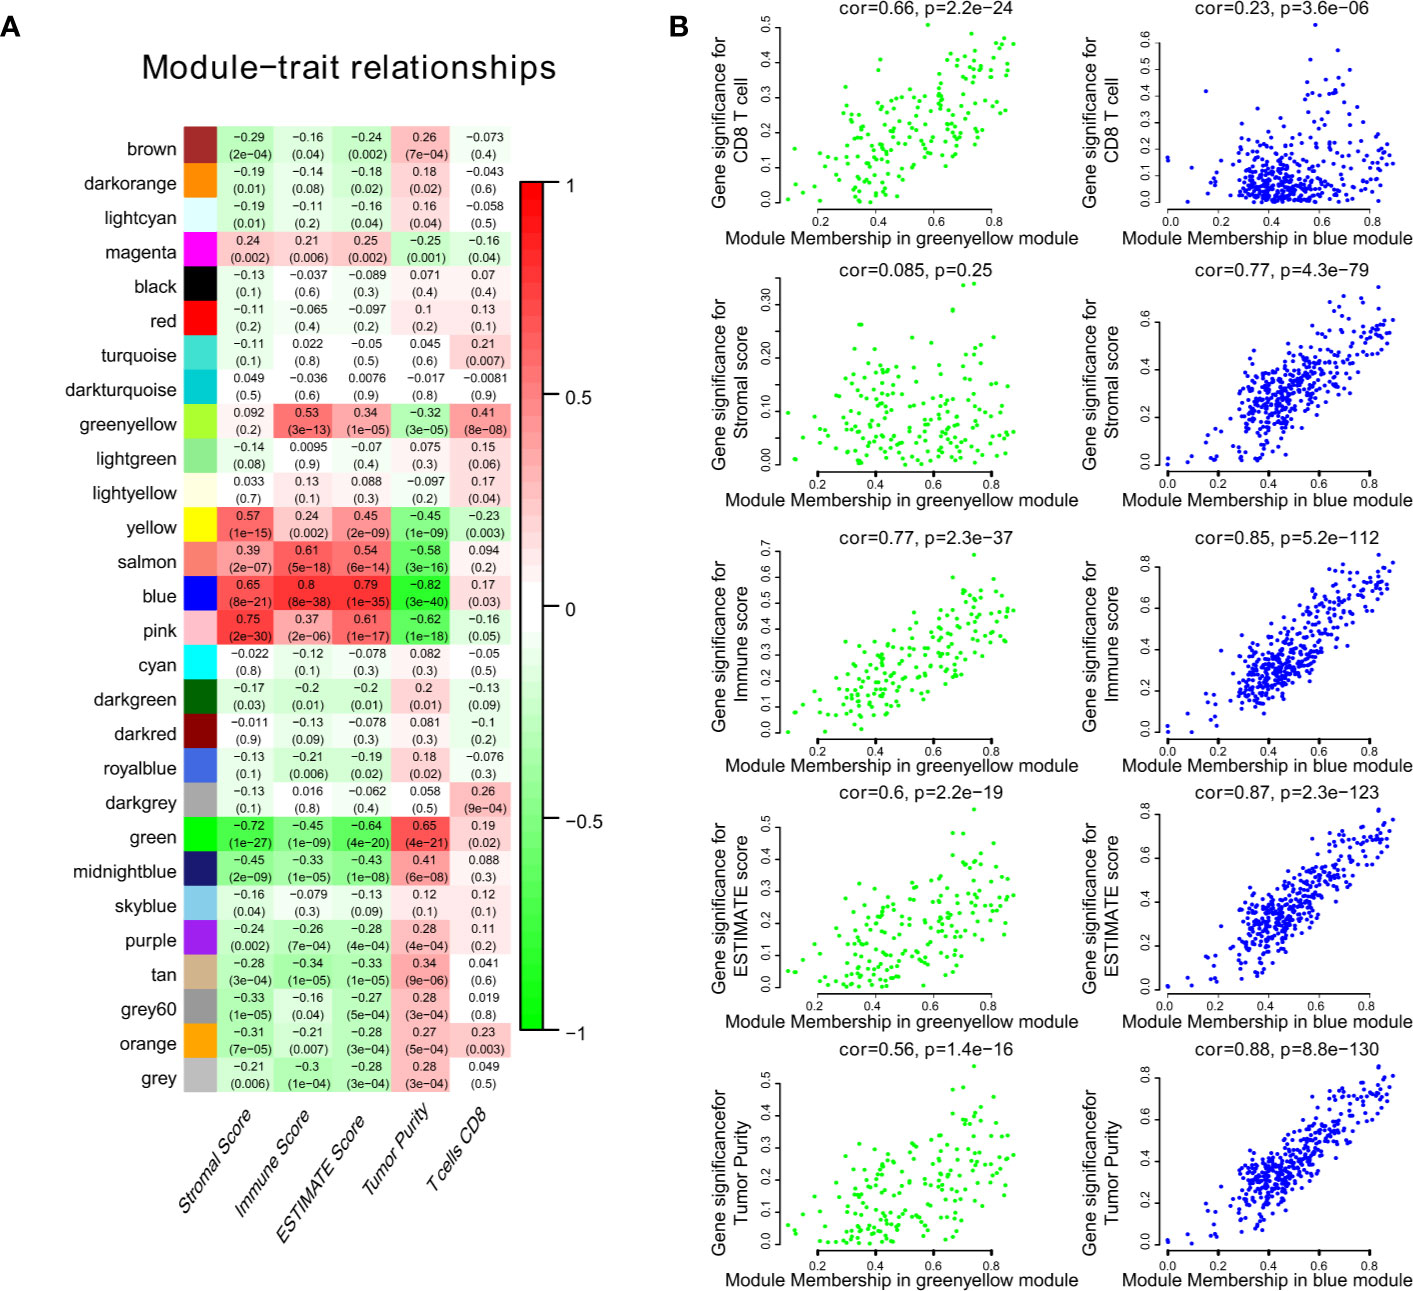
Figure 3 The result of WGCNA. (A) The correlation coefficient between different phenotypes and co-expression modules were showed. (B) The blue module was highly correlated to stromal score (R2 = 0.77, P = 4.3e-79), immune score (R2 = 0.85, P = 5.2e-112), estimate score (R2 = 0.87, P = 2.3e-123), and tumor purity (R2 = 0.88, P = 8.8e-130), while the green-yellow module showed higher correlation with CD8+ T cells (R2 = 0.66, P = 2.2e-24).
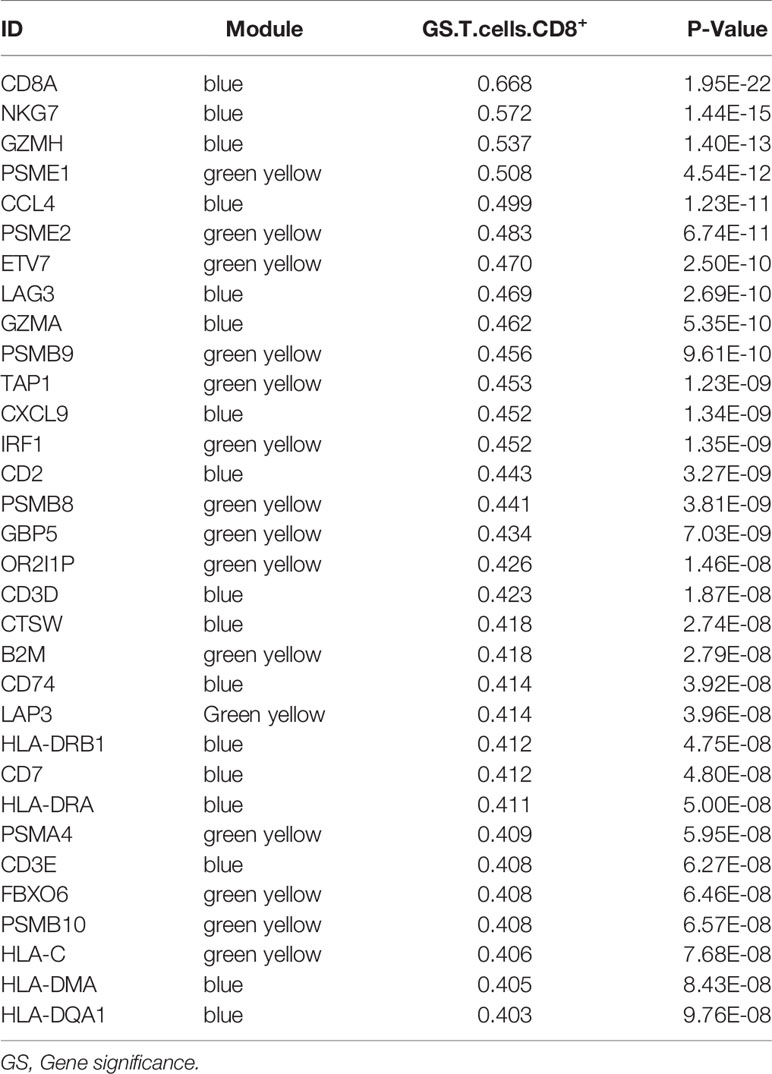
Table 1 The Module and Gene significance for CD8+ T Cells related genes.
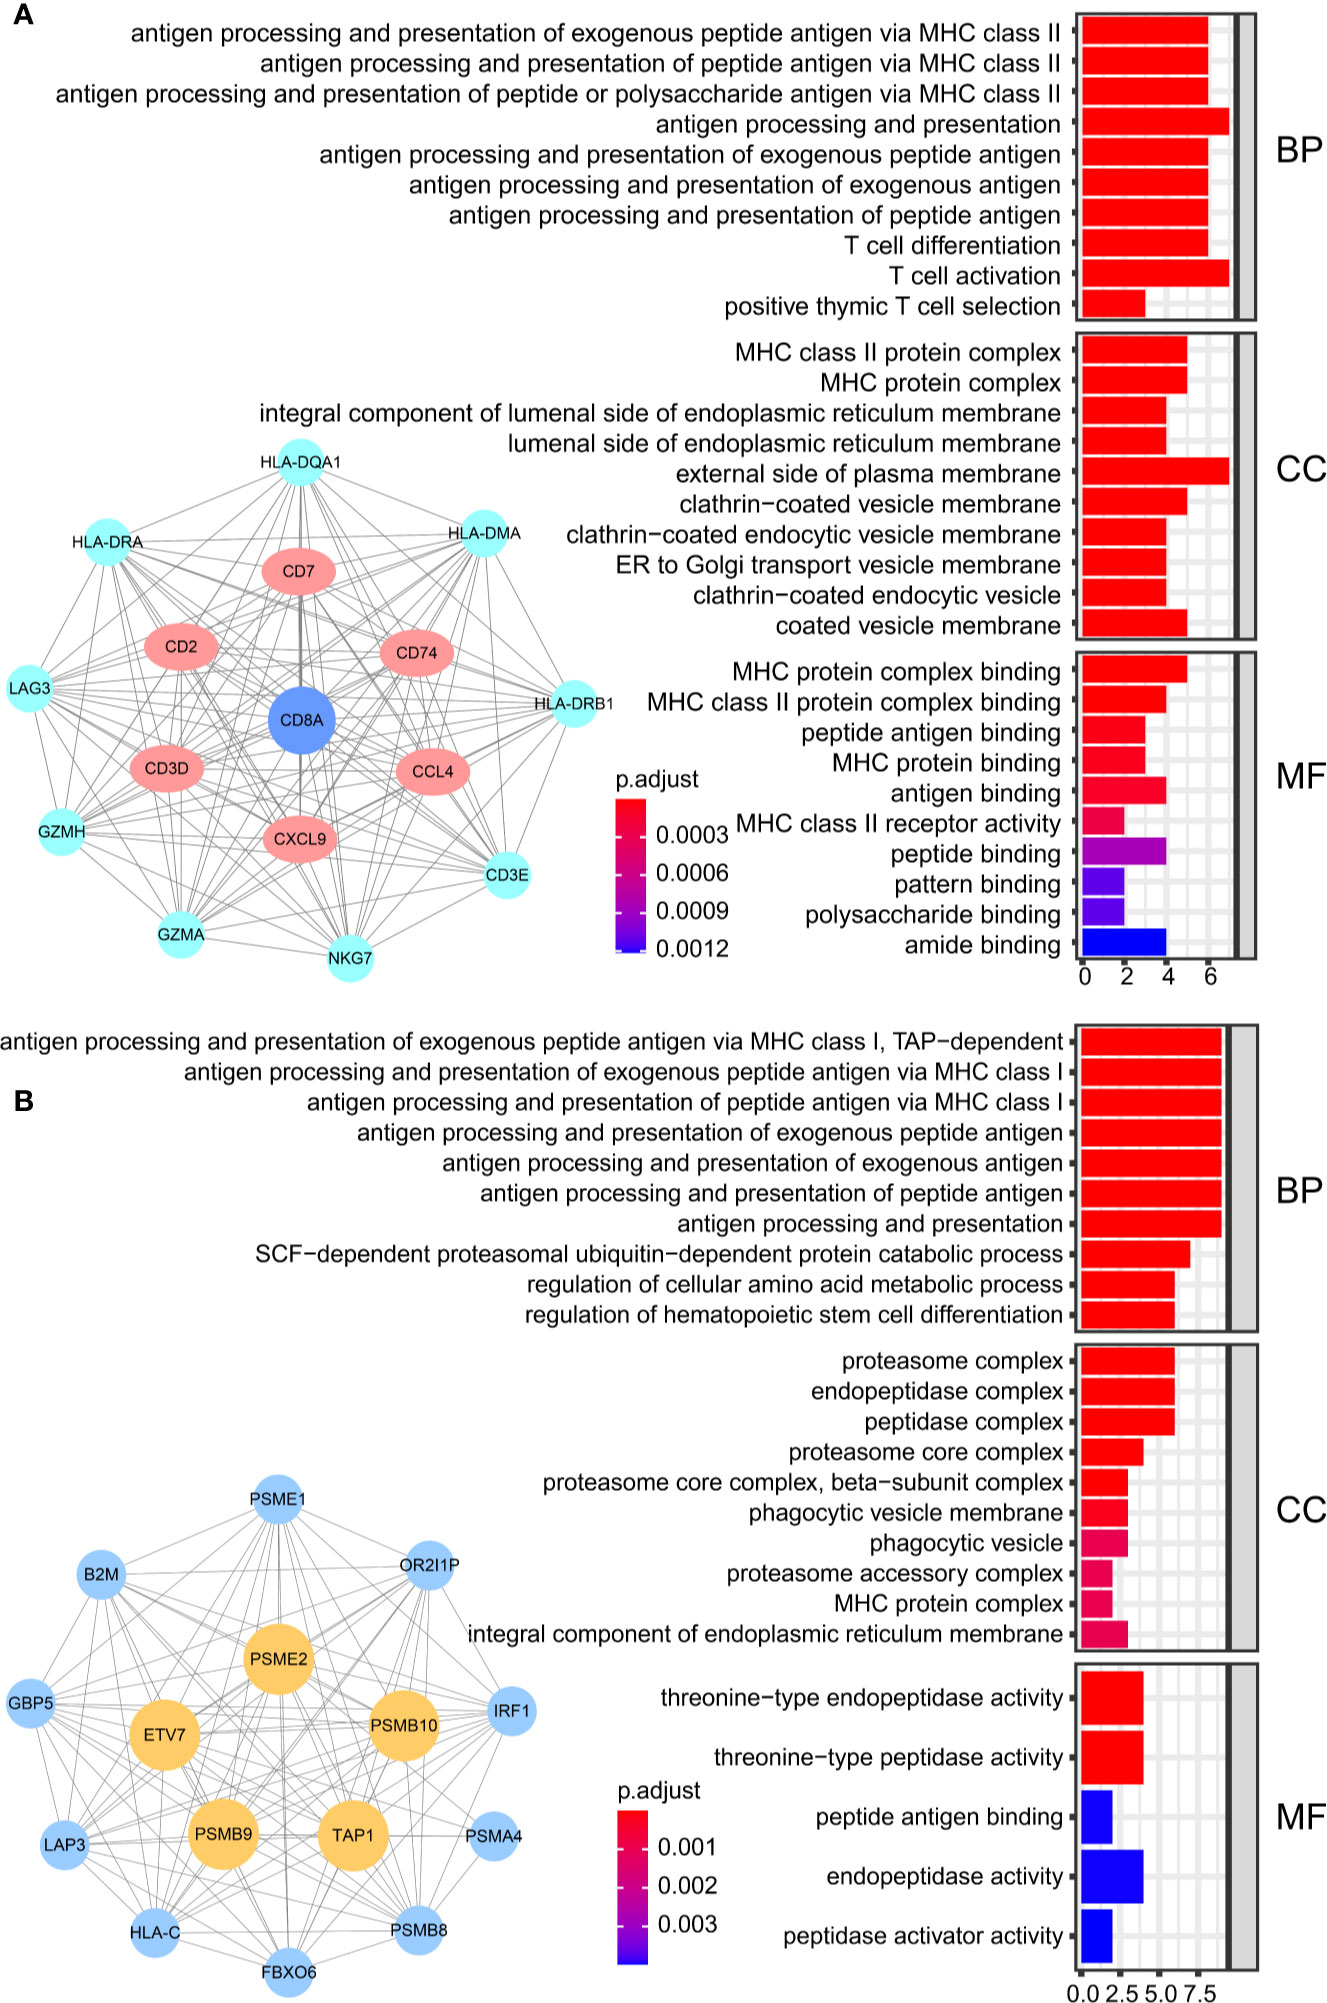
Figure 4 The result of GO analysis. (A) The genes in the blue module were enriched in antigen processing and presentation via MHC class II molecules. (B) The genes in green-yellow module were enriched in antigen processing and presentation via MHC class I molecules.
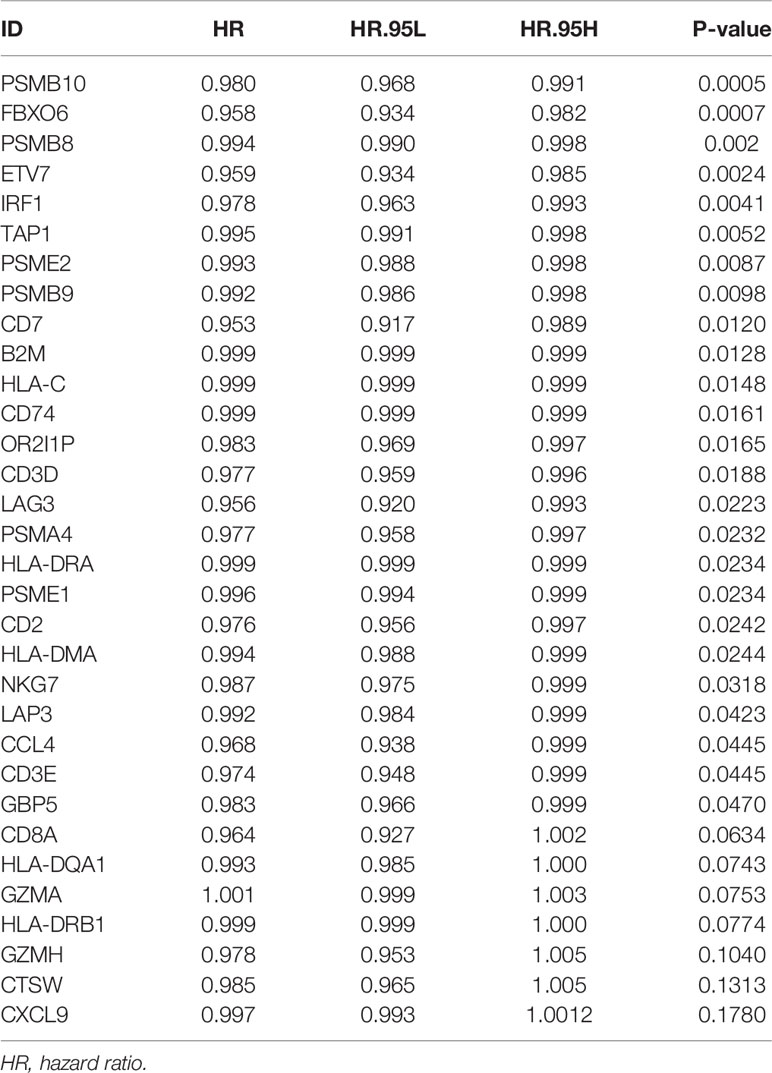
Table 2 Univariate Cox proportional hazard analysis of CD8+ T cells related genes.
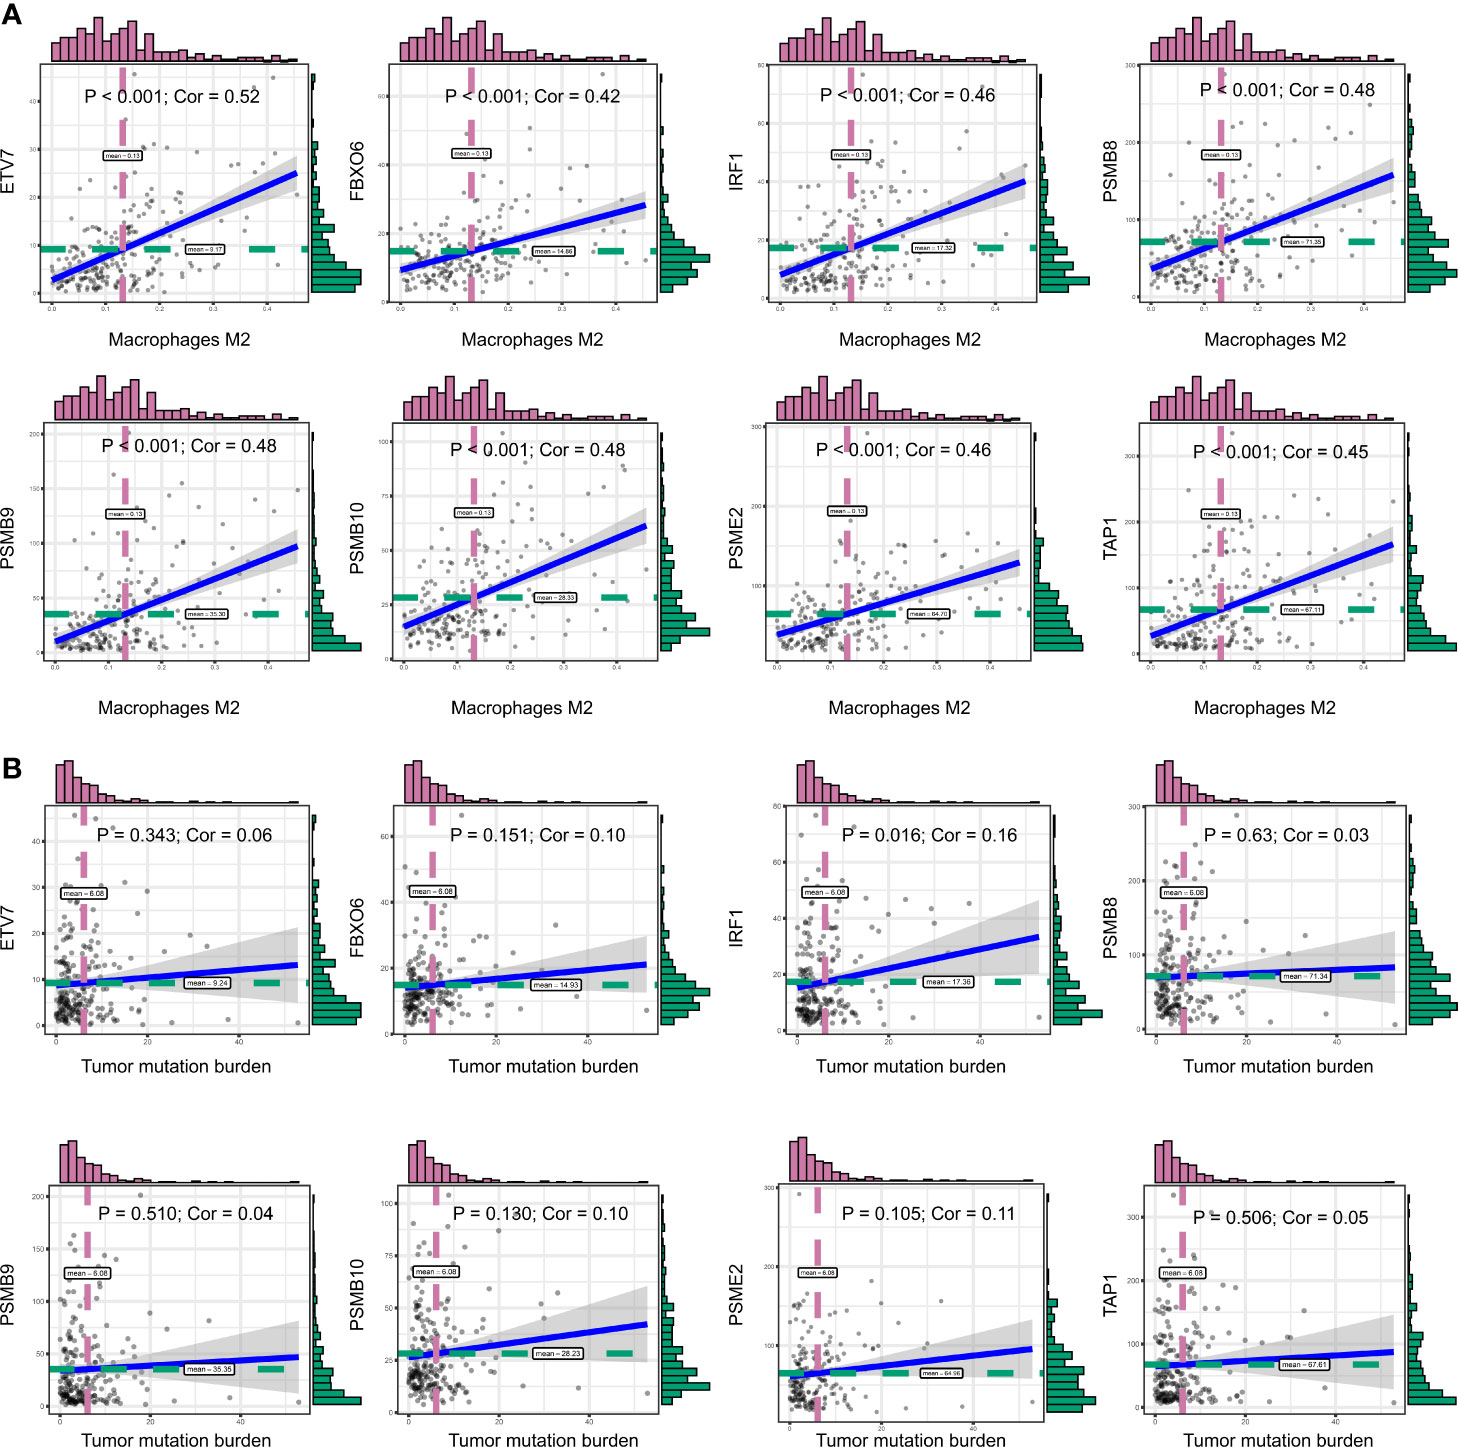
Figure 5 (A) The correlation between co-expression genes and CD8+ T cells proportion. (B) The correlation between co-expression genes and tumor mutation burden (TMB).
Clinical Phenotype Analysis
To calculate the correlations between these and CD8+ T cell infiltration proportions, subgroups were created according to the median of eight gene expression values in the TCGA-BLCA (Figure 6A) and GSE48075 (Figure 6B) cohorts. We found higher infiltration proportions in high expression groups (p < 0.05), suggesting that these genes promote CD8+ T cell infiltration. CD8+ T cell infiltration improves prognosis. Then, the various stages and statuses were applied to determine the prognosis level. For these eight genes, expression levels in stage 4 (Figure 6C) and 5-year mortality (Figure 6D) groups were significantly lower (p < 0.05).
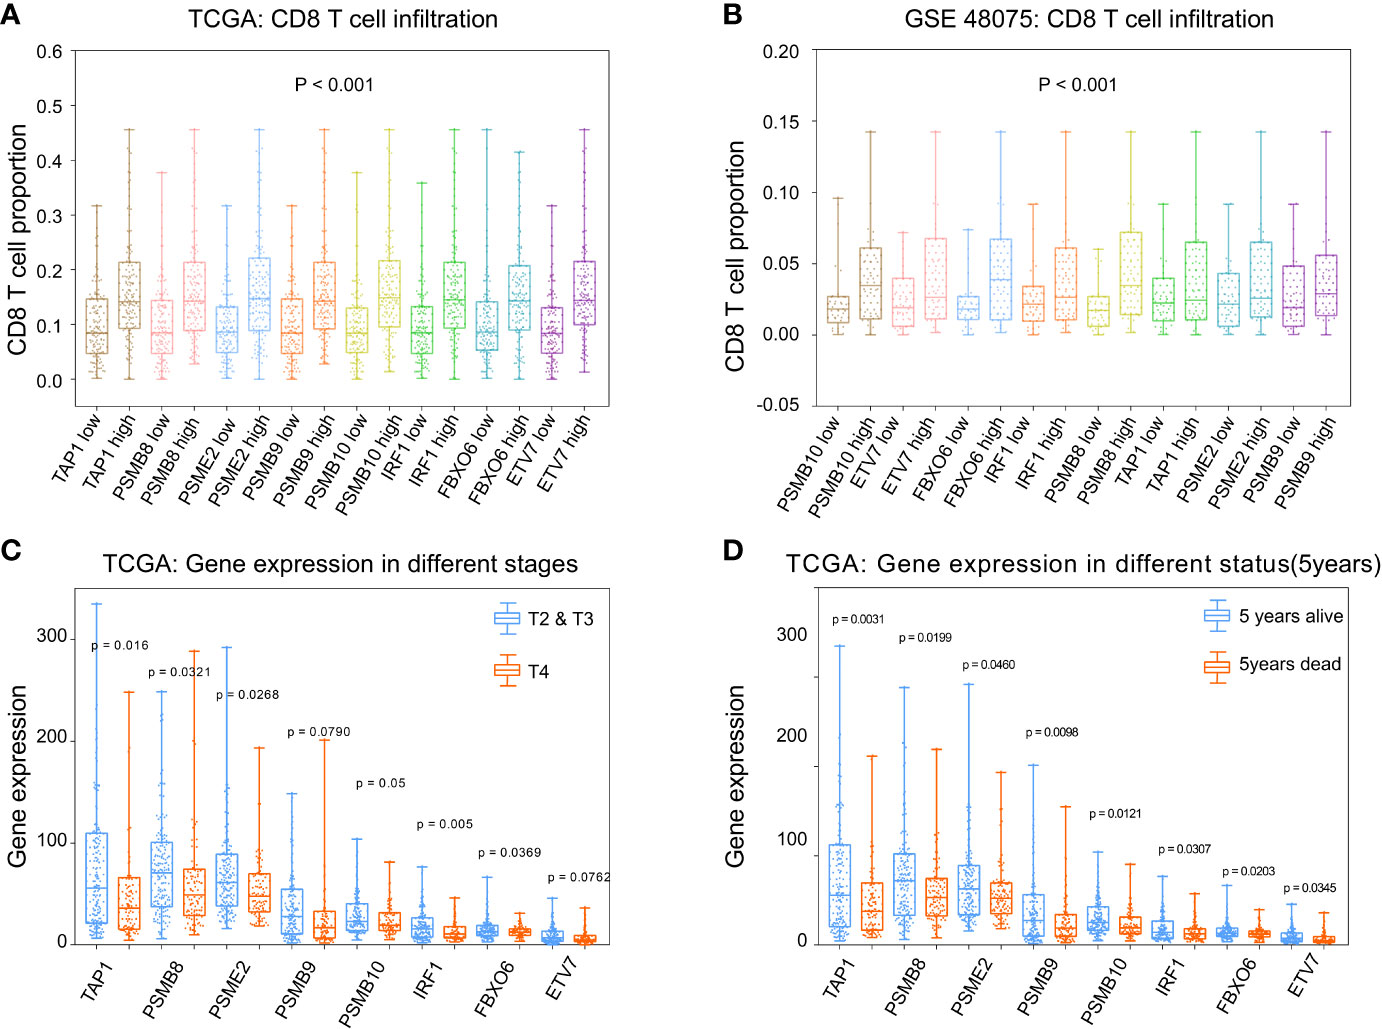
Figure 6 Phenotype analysis of PSMB8, PSMB9, PSMB10, PSME2, TAP1, IRF1, FBOX6, and ETV7 with CD8+ T cell infiltration proportions. (A) There was higher infiltration proportion in high expression groups (p < 0.05) of PSMB8, PSMB9, PSMB10, PSME2, TAP1, IRF1, FBOX6, and ETV7, suggesting that these genes promote CD8+ T cell infiltration in TCGA. (B) Higher infiltration proportions in high expression groups of PSMB8, PSMB9, PSMB10, PSME2, TAP1, IRF1, FBOX6, and ETV7, suggesting that these genes promote CD8+ T cell infiltration in GSE48075. (C) Expression level in stages 2/3 of these genes were higher than in stage 4. (D) Expression levels in the 5-year survival group of these genes were higher than those of the 5-year death group.
Immune Microenvironment Analysis
The functions of angiogenic factors and angiogenesis inhibitors are listed in Table 3. A negative correlation was found between several genes (PSMB8, PSMB9, PSMB10, PSME2, TAP1, IRF1, FBOX6, ETV7) and angiogenic factors (Figure 7A); positive correlations were found for angiogenic inhibitors (Figure 7B), suggesting that these genes might modulate vascular changes in the tumor microenvironment. With the increase of CD8+ T cell infiltration-related gene expression, there was a decreasing trend of tumor purity (Figure 7C). These findings suggest that these genes might influence bladder tumor purity and local microenvironment component proportions. To analyze the correlation between the eight genes and immune responses, we choose seven metagenes representing various types of inflammatory and immune responses. We found that PSMB8, PSMB9, PSMB10, PSME2, TAP1, IRF1, FBOX6, and ETV7 positively associated with six of these clusters, except IgG (Figure 7D).
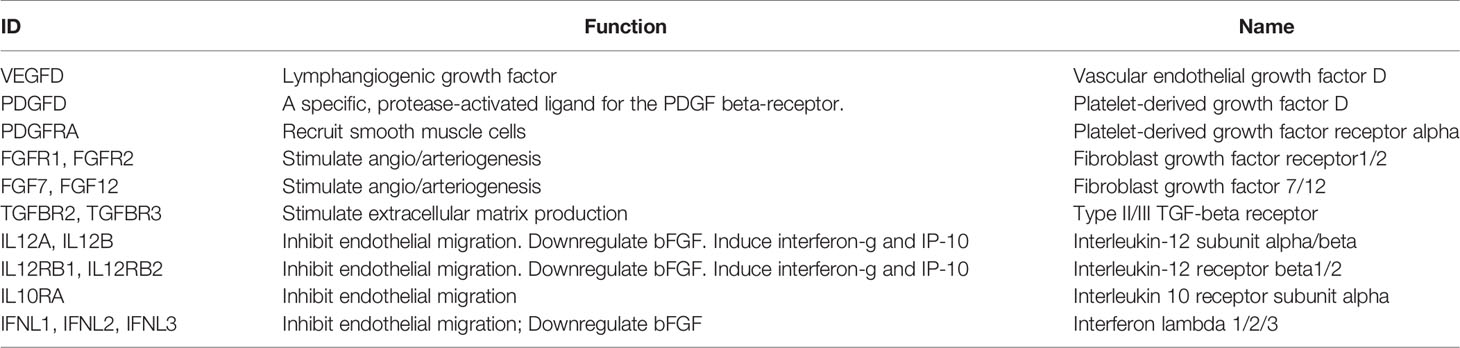
Table 3 The list of angiogenic factors and inhibitors.
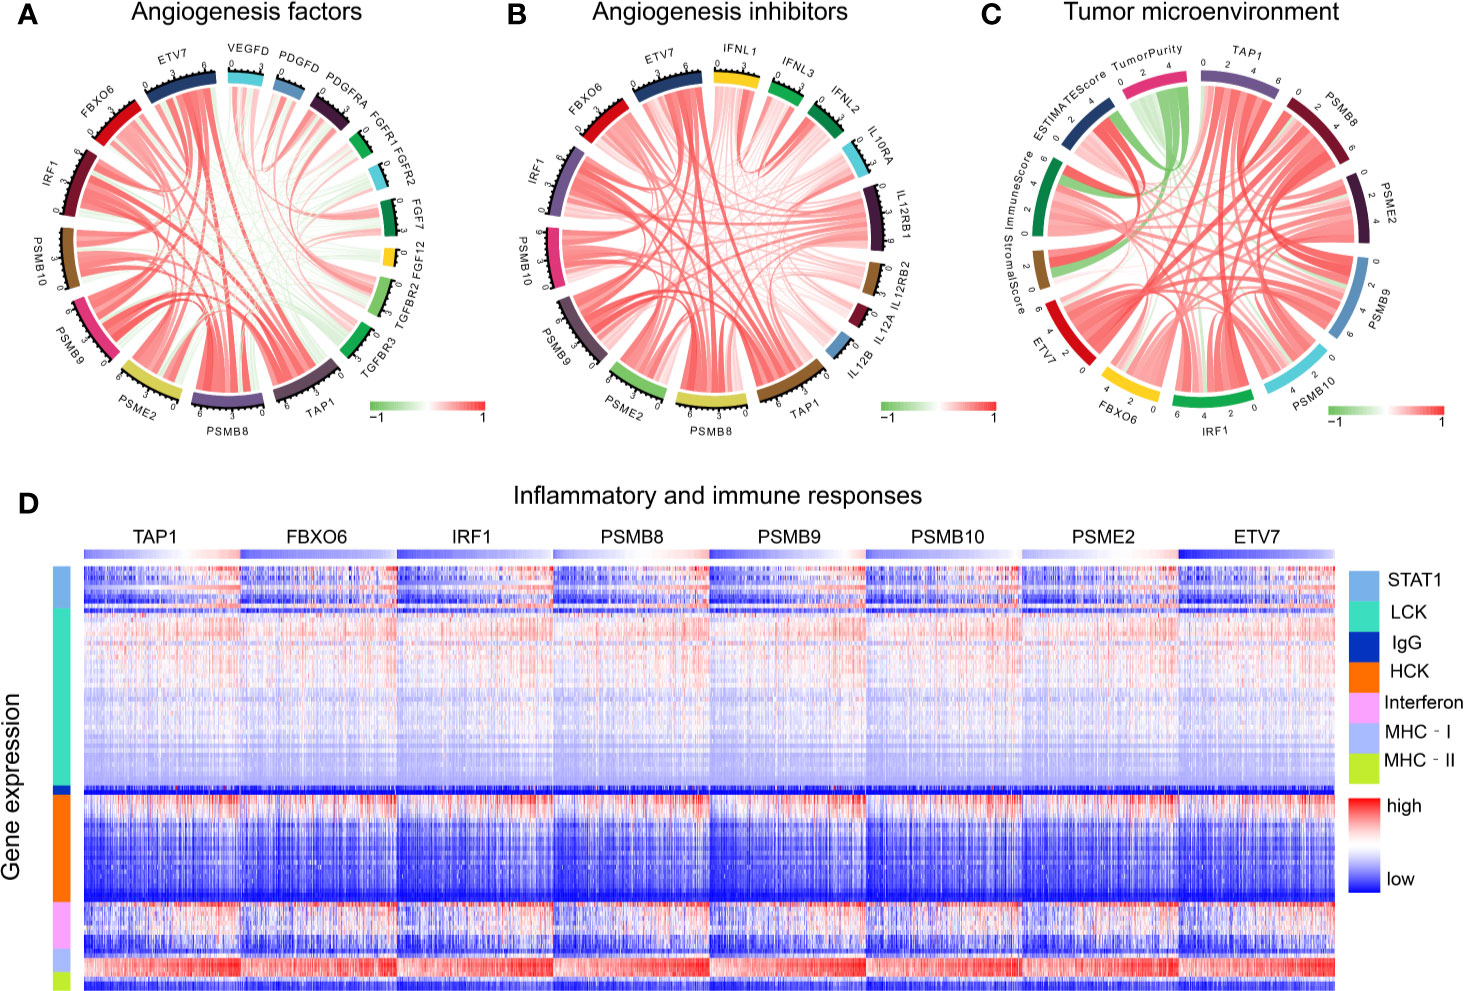
Figure 7 Tumor microenvironment analysis. (A) The correlation of CD8+ T cells infiltration promoting genes to angiogenesis factors. (B) The correlation of CD8+ T cells infiltration promoting genes to angiogenesis inhibitors. (C) The correlation of CD8+ T cell infiltration-promoting genes to tumor purity. (D) The correlation of CD8+ T cell infiltration-promoting genes to inflammatory and immune responses. These responses were induced by lymphocyte‐specific kinase (LCK), hemopoietic cell kinase (MCK), major histocompatibility complex class I (MHC‐I), immunoglobulin G (IgG), major histocompatibility complex class II (MHC II), signal transducer, activator of transcription 1 (STAT1), and interferon.
GSEA Analysis and Survival Analysis
The proteins level encoded by these genes (PSMB10, PSMB9, PSMB8, TAP1, IRF1, and FBXO6) were lower in the high clinical grade patients in the human protein atlas (HPA), which suggested the clinical phenotype correlation both in mRNA and protein levels (Figure 8A). GSEA analysis showed that antigen processing and presentation, chemokine signaling pathway, nature killer cell mediated cytotoxicity, and the T cell receptor signaling pathway were related to the high expression group (Figure 8B). The P-value is displayed Table 4. We found that these biological pathways were immune-related and were involved in tumor immunity that protects against tumor infiltration. To analyze their influence on overall survival, we performed survival analysis. The patients in low expression groups for PSMB10 (TCGA: P = 0.0044; GSE32894: P = 0.029) and ETV7 (TCGA: P < 0.0001; GSE32894: P = 0.034) showed survival risk against high expression groups (Figure 9). Despite the fact that no significant difference was detected for PSMB8, PSMB9, PSME2, TAP1, IRF1, or FBOX6, these patients showed more survival risk trends in low expression groups.
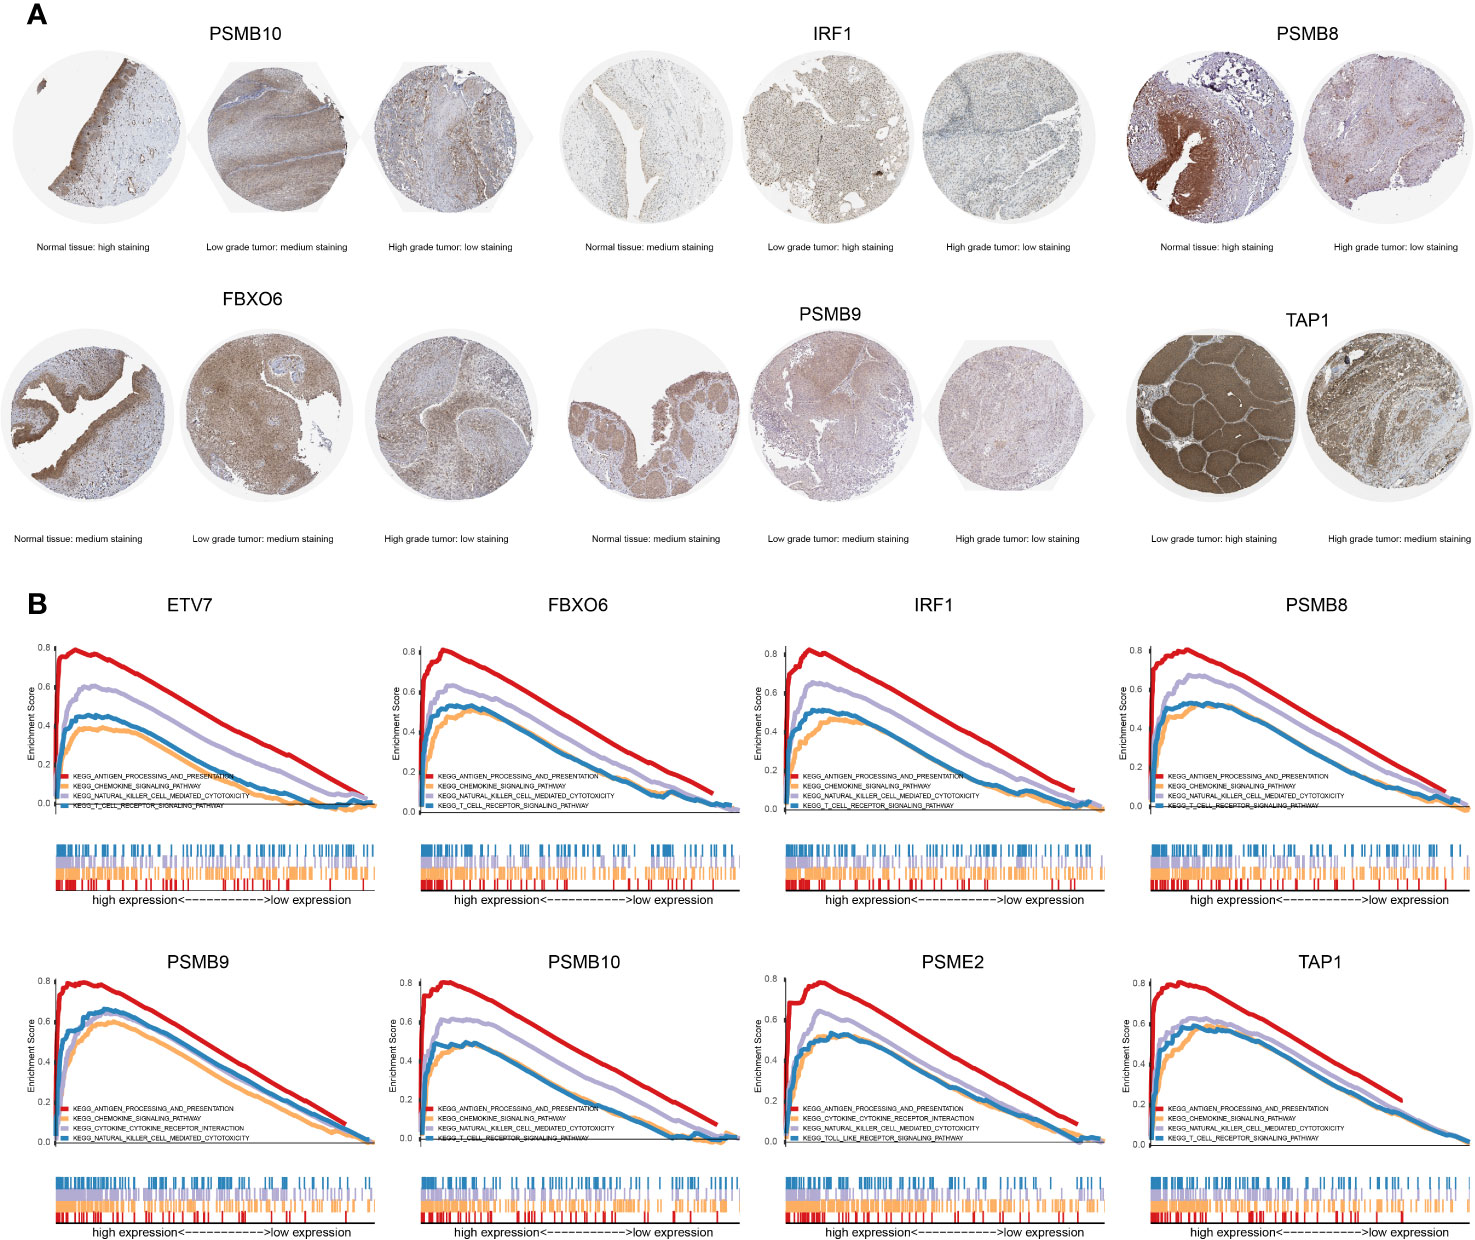
Figure 8 (A) The proteins level encoded by these genes (PSMB10, PSMB9, PSMB8, TAP1, IRF1, and FBXO6) were lower in the high clinical grade patients in the human protein atlas (HPA). (B) The results of GSEA analysis. Antigen processing and presentation, the chemokine signaling pathway, nature killer cell-mediated cytotoxicity, and the T cell receptor signaling pathway were related to the high expression group in ETV7, FBXO6, IRF1, PSMB8, PSMB9, PSMB10, PSME2, and TAP1.
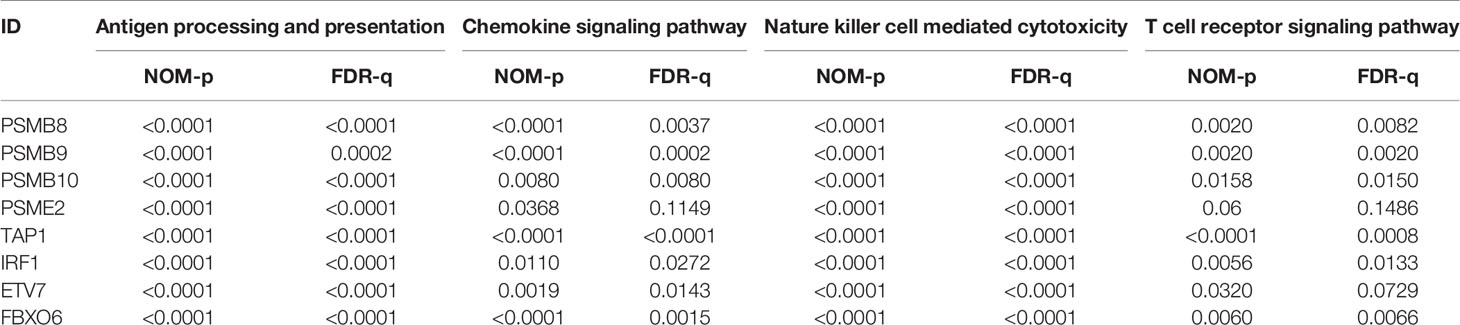
Table 4 The results of GSEA analysis.
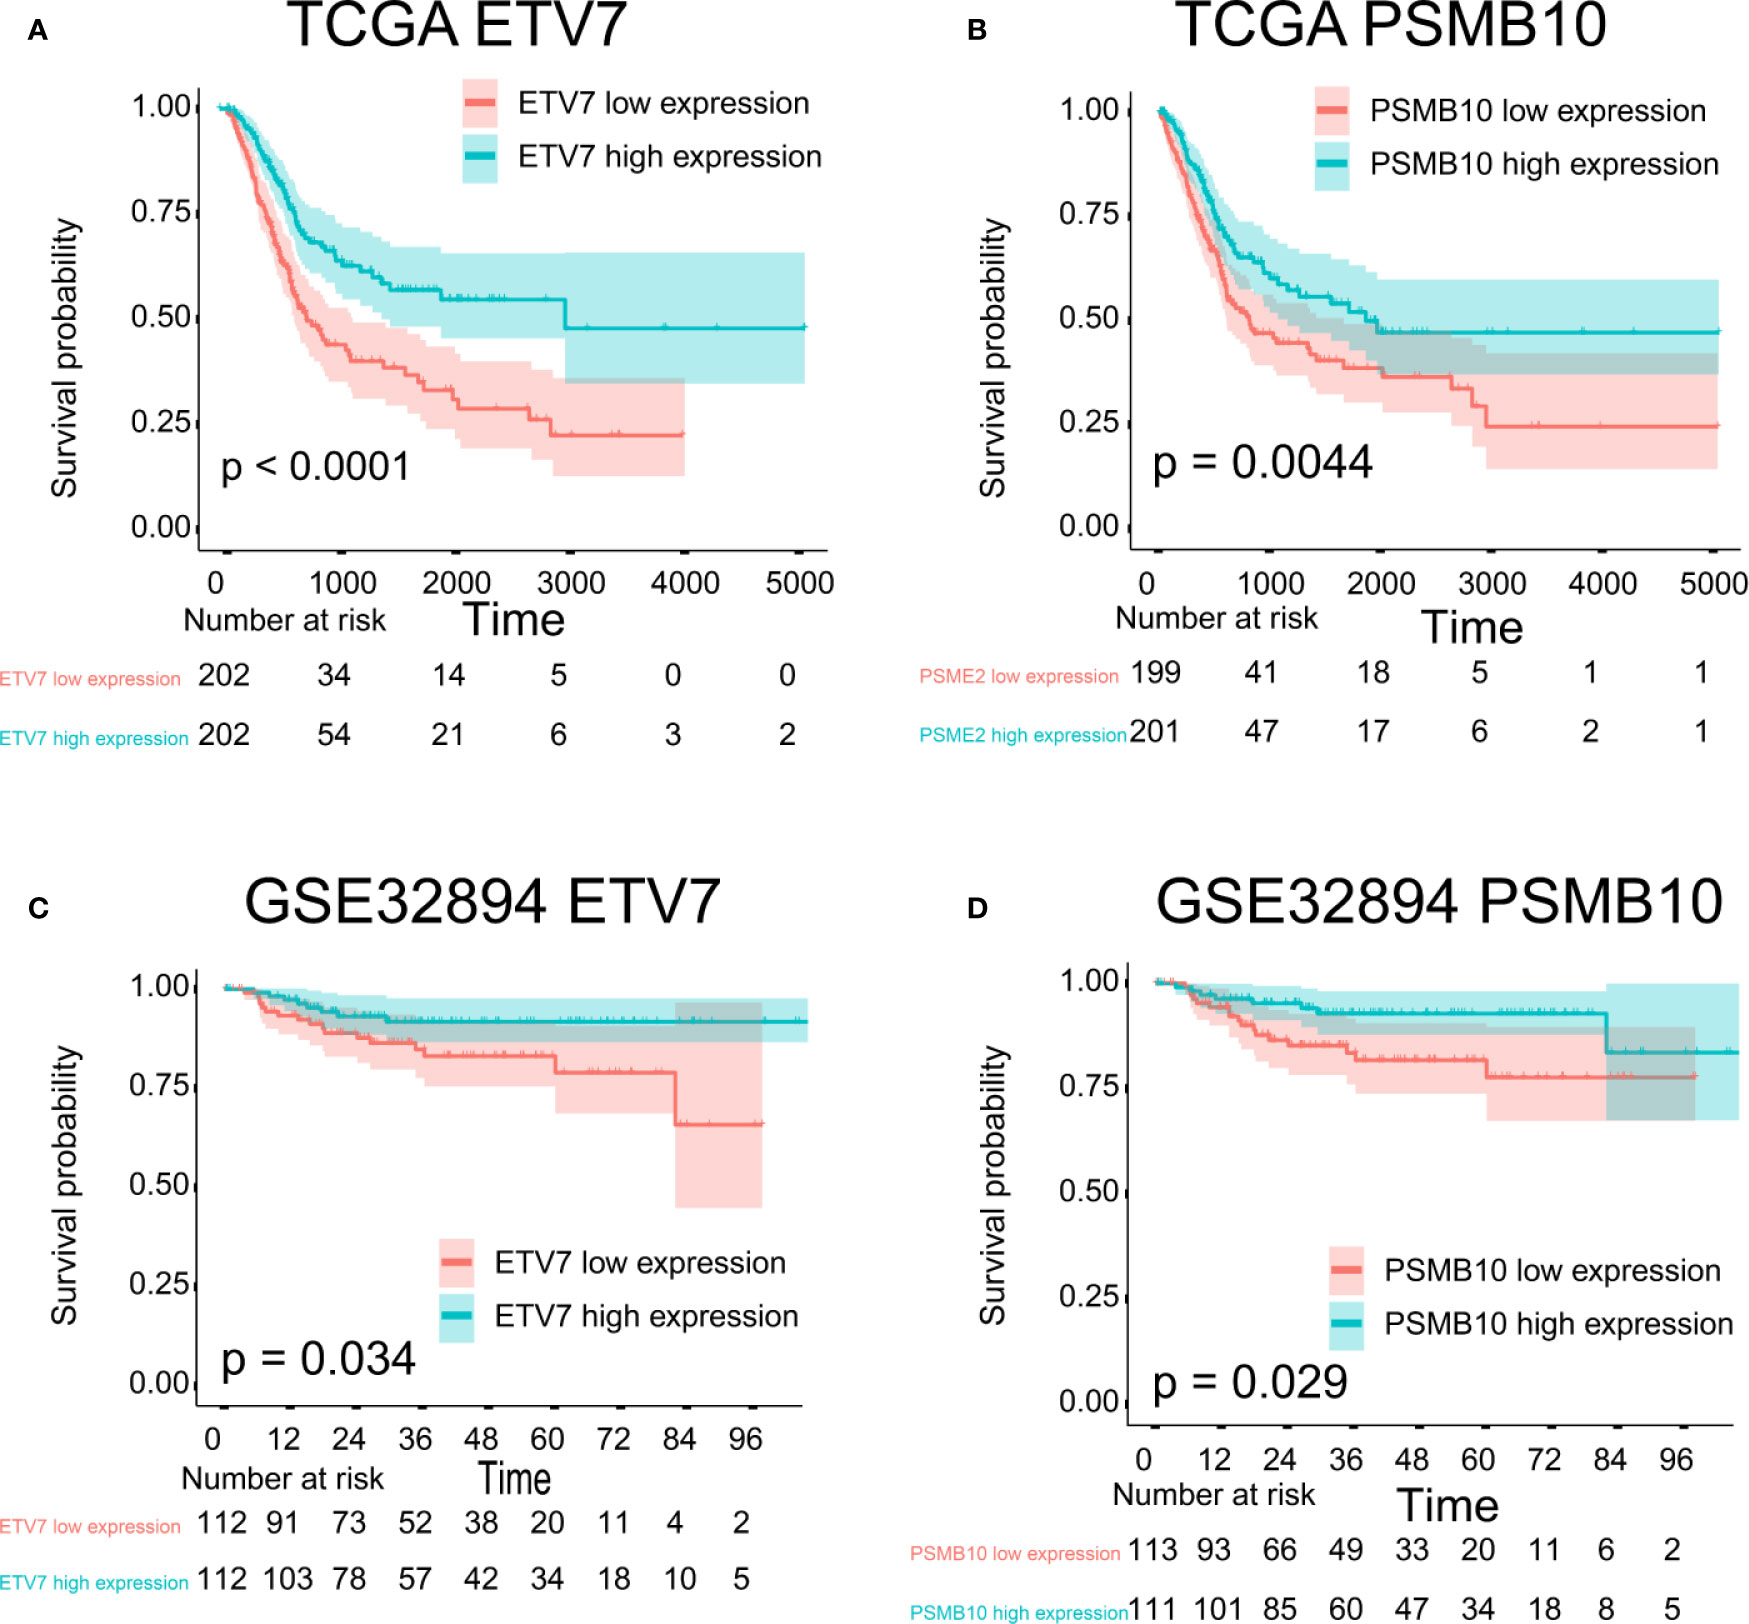
Figure 9 Survival analysis. (A) ETV7 survival analysis in TCGA, P < 0.0001. (B) PSMB10 survival analysis in TCGA, P = 0.0044. (C) ETV7 survival analysis in GSE32894, P = 0.034. (D) PSMB10 survival analysis in GSE32894, P = 0.029.
Pan-Cancer Analysis
These results demonstrated the role of PSMB8, PSMB9, PSMB10, PSME2, TAP1, IRF, FBOX6, and ETV7 in bladder cancer. Next, we analyzed the correlation between these genes and CD8+ T cell infiltration in other types of cancers. IRF1, PSMB9, TAP1, ETV7, and PSMB10 were related to CD8+ T cell infiltration proportion in thyroid carcinoma, breast invasive carcinoma, head and neck squamous cell carcinoma, hepatocellular carcinoma, lung adenocarcinoma, and skin cutaneous melanoma (Table 5). The correlations between ETV7 and PSMB10 and CD8+ T cell infiltration in other types of cancer are shown in Figure 10A.
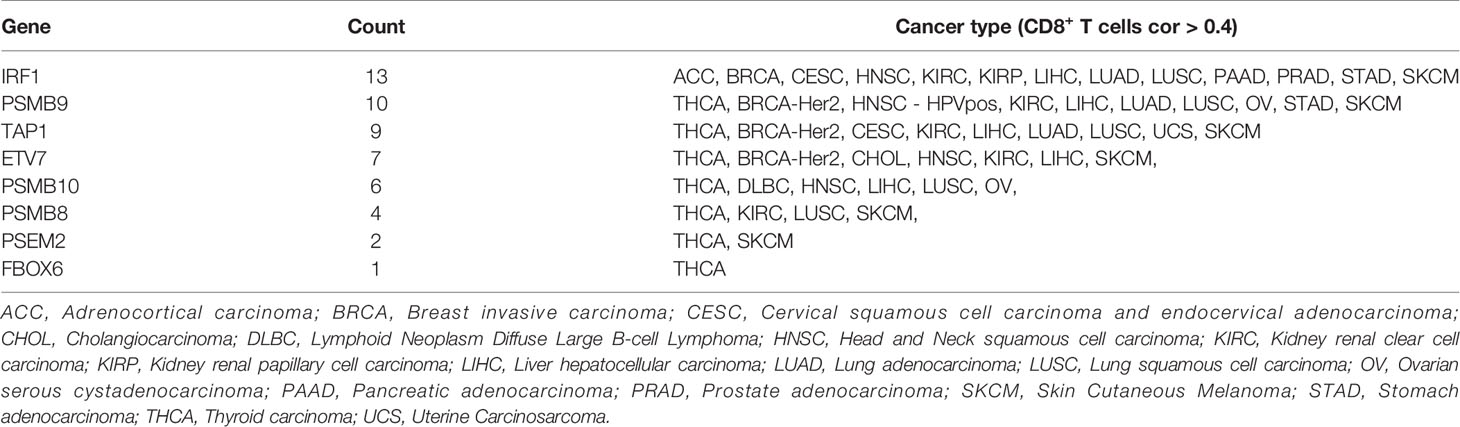
Table 5 Correlation Analysis of Candidate Factors and CD8+ T cells.
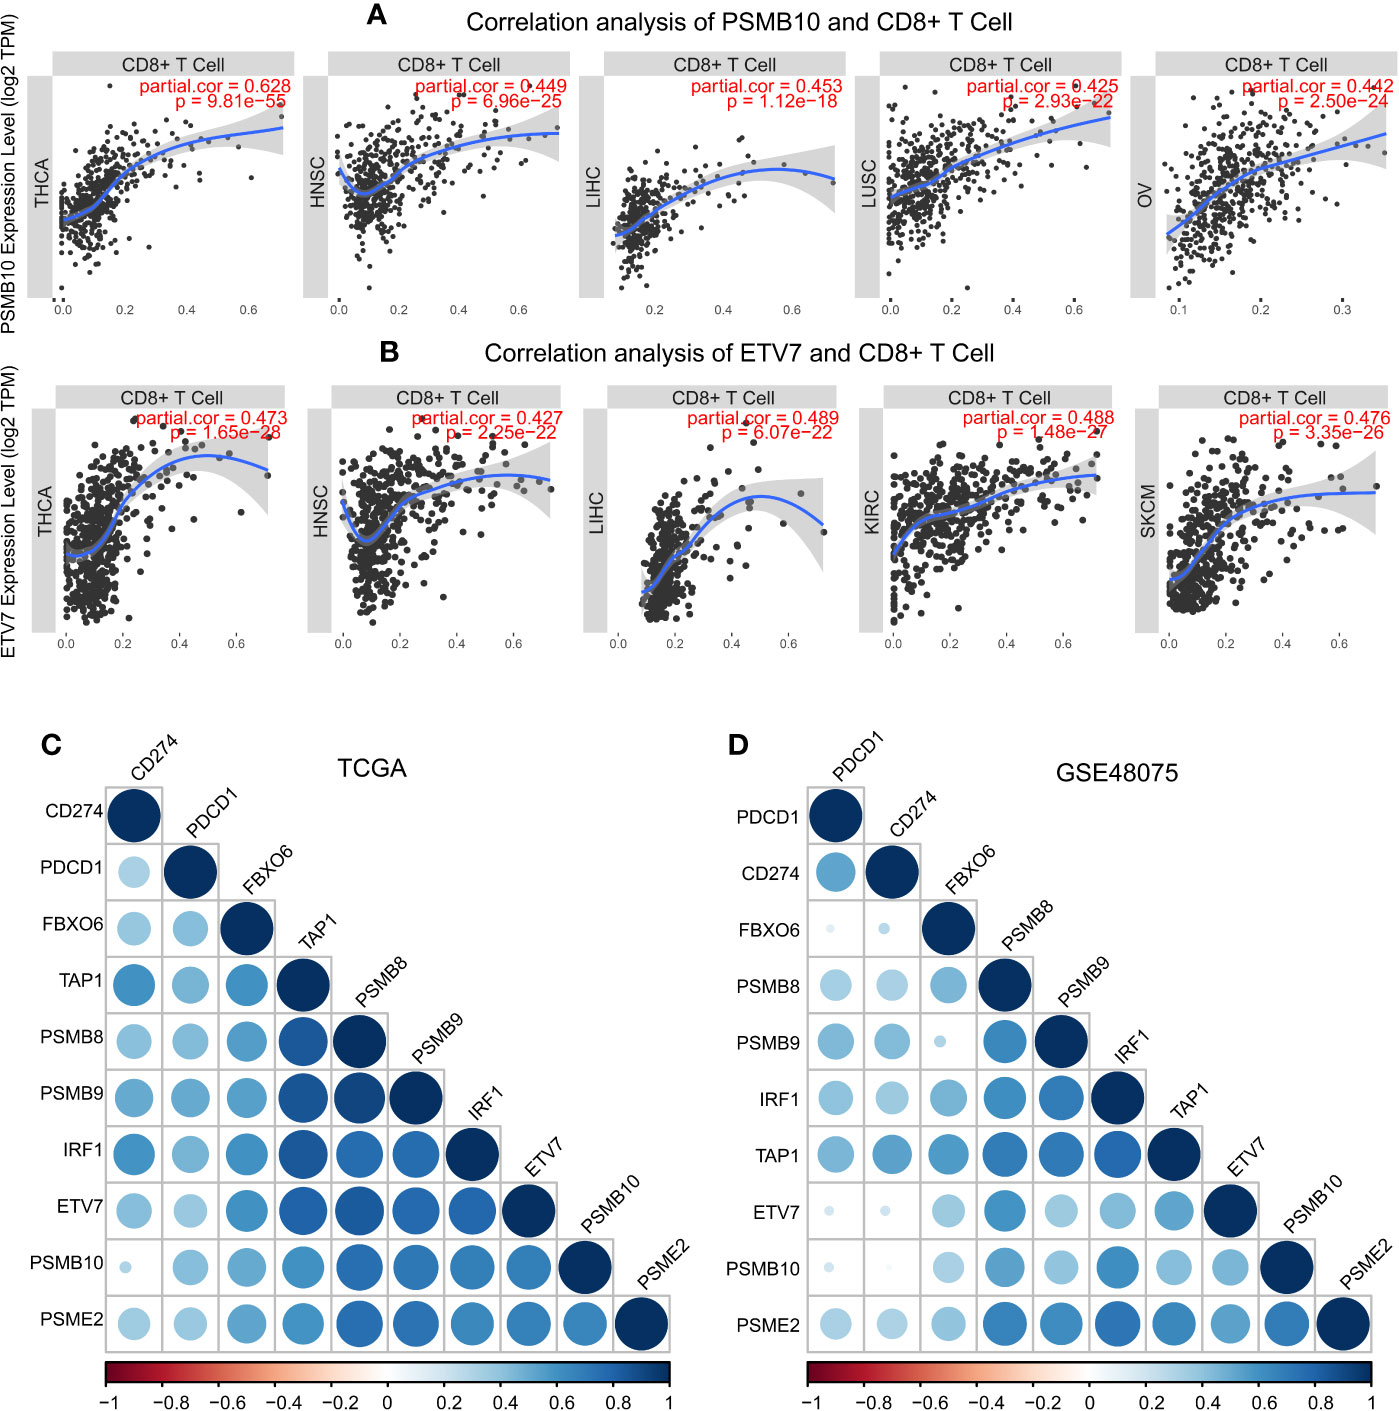
Figure 10 Pan-cancer analysis of PSMB10 and ETV7. (A) Correlation analysis of PSMB10 and CD8+ T cells. (B) Correlation analysis of ETV7 and CD8+ T cells. (C, D) PD1/PDL1 correlation analysis. A positive correlation was found between CD8+ T cells and PD1/PDL1 in TCGA and GSE48075.
Discussion
There is a growing body of evidence to suggest that anti-PD-1 therapy (primary resistance) is not effective in most bladder patients. This might be due to the lack of activated T lymphocyte infiltration at the tumor site (10, 11). In tumor immunity, tumor antigen peptides bind to MHC class I molecules, and mediate cellular immune. In the present study, we attempted to identify co-expression genes that promote CD8+ T cell infiltration based on the WGCNA algorithm. This method identified cluster of co-expressed genes promoting CD8+ T cell infiltration with the same biological function. The identification of the function of these factors may help uncover the process of promoting CD8+ T cell infiltration and to identify candidate correlation factors. We identified two CD8+ T cell co-expression modules. To select the module with immune-related function, we performed function enrichment. The genes in green-yellow modules were mostly involved in MHC class I process and presentation and proteasome in antigen presenting cells. The genes in the blue module were involved in MHC class II process and presentation. Therefore, we focused on the genes in the green-yellow module with CD8+ T cell proportion correlation >0.4. PSMB8, PSMB9, PSMB10, PSME2, TAP1, IRF1, FBOX6, and ETV7 were identified as CD8+ T cell infiltration-promoting factors with independent prognostic effects.
In the early 1990s, proteasome 20S subunit beta 8 (PSMB8, also known as LMP7) and proteasome 20S subunit beta 9 (PSMB9, also known as LMP2) were identified as proteasome subunits β5i and β1i (37–40). β5i and β1i are highly homologous to β5 and β1, which are the major components of the 20S proteasome (41). Another proteasome β2 homologous subunit β2i was identified that was encoded by proteasome 20S subunit beta 10 (PSMB10) (42–44). The proteasome has a 26S structure, including a 20S central unit and a 19S regulator. After IFN or TNF stimulation, expression levels of these three antigens process related subunits (β5i, β1i, and β2i) are upregulated, and there is neosynthesis of 20S proteasomes were called 20S immunoproteasomes (45, 46). The function of immunoproteasome is different from that of the constitutive proteasome. The antigen peptide which combined with MHC class I, hydrolyzed by immunoproteasome, has stronger CTL activation effect than that in constitutive proteasome (41, 47, 48). Gabriela et al. demonstrated a negatively impact on MHC-I surface expression and antigen presentation process in immunoproteasome triple knockout mice, and cytotoxic activity of CD8+ T cell showed a consequently reduced tendency (49). Nagayama et al. suggested that Th1 235 and Th17 differentiation was inhibited by a selective inhibitor of immunoproteasome in the murine model (50). Cathro et al. found a significant difference of immunoproteasome components in different urothelium carcinoma stages, which the immunoproteasome components in low stage level is higher (51). These findings suggest that PSMB8, PSMB9, and PSMB10 might promote CD8+ T cell infiltration based on expression of greater numbers of immunoproteasome 20S core units in bladder cancers.
The immunoproteasome is regulated by the 11S regulator (known as REG or PA28) which enhances the activity of peptidase and stimulates the production of antigen peptide (52). Proteasome activator 28 (PA28) is composed of PA28α and PA28β subunits encoded by PSME1 and PSME2 (53, 54). PA28 enhances the MHC class I antigen process by influencing peptide cleavage and release (55, 56). PA28β subunits might induce PA28α complex formation, thereby enhancing immunoproteasome activity in antigen presenting cells (57). These findings suggest that PA28β improves the MHC class I process, and the induces more effector T cells by increasing antigen presentation.
Transporters associated with antigen processing (TAP1 and TAP2) reside in the endoplasmic reticulum (ER) and transport antigen peptides into the ER, which plays a crucial role in the MHC class I antigen process (58, 59). Endoplasmic reticulum without TAP1 and TAP2 induces the dysfunction of class I MHC molecules (60–62), thereby inhibiting the activity of CD8+ T cells. TAP was demonstrated have a prognostic protective effect in lung cancer, cervical cancer, breast cancer, and head and neck cancer (63–66).
The IFN-regulatory factor 1 protein (IRF1) is up-regulated by IFNγ (67). IFNγ upregulates MHC class I antigen peptide presentation-related processes, and enhances the activity of immunoproteasome subunits (PSMB8, PSMB9, PSMB10), regulators (PSME1, PSME2), and transporters associated with antigen processing (TAP1, TAP2) (68). Leigh et al. (67) found a paucity of CD8+ T Cells in mice, induced by the lack of TAP1 and PSMB9 regulated by IRF1. These findings suggest that PSMB8, PSMB9, PSMB10, PSME2, TAP1, and IRF1 may increase the CD8+ T cell proportions by enhancing MHC class I antigen processing and presentation.
In our study, ETV7 and FBXO6 were found to be co-expressed with PSMB8, PSMB9, PSMB10, PSME2, TAP1, and IRF1. ETS variant transcription factor 7 (ETV7) is a member of the ETS transcription factors family, which are involved in cellular development and differentiation (69). F-box protein 6 (FBXO6) is a subunit of the ubiquitin protein ligase complex (70). Previous studies have demonstrated that FBXO6 inhibits tumor invasion in gastric and lung cancer; however, the underling mechanisms were not clear (71). In our co-expression analysis, we found that FBXO6 and ETVT were co-expressed with immunoproteasomes 20S, interferon-gamma regulator IRF-1, and protease activator PA28. These findings suggest that there may be a previously undiscovered pathway regulation between these two factors and the MHC I antigen presentation process.
Mariathasan et al. (72) found that the combination of TGF inhibitor- blocking and anti-pd-l1 antibody attenuated the signal transduction of TGF in stromal cells, promoted the chemotaxis of T lymphocyte cells to the tumor center, stimulated strong anti-tumor immunity effect in the mouse model. We determined the role of these factors in the clinical phenotype and tumor microenvironment, we were surprised to find that, when these co-expression factors were highly expressed, the purity of the tumor was significantly reduced, the expression of TGFBR2 and the TGFBR3 were declined, the immune inflammatory response was weakened, the clinical stage of the patient was reduced, and the 5-year survival prognosis improved. Angiogenic factors also play an important role in tumor progression.
We also found that, when expression levels of these factors are low, expression levels of angiogenic factors increase, which lead poor prognosis. We believe that these phenotypic changes are caused by these co-expression factors that enhance the process of synthesis, degradation, and transmission of tumor antigen peptides in antigen-presenting cells, thereby increasing the activity of CD8+ T cells.
Infiltration of CD8+ T cells is a precondition for tumor immunity in the tumor microenvironment (73). The adaptive immune response was enhanced as antigen recognition increased (74). There are currently many mechanisms that can cause anti-PD1 drug resistance, including the decline in CD8+ T cell infiltration, antigen recognition disorders, and defective PD-1 expression. A correlation analysis is shown in Figure 10 that demonstrates that these genes promote PD-1 expression. These data suggest that the PSMB8, PSMB9, PSMB10, PSME2, TAP1, IRF1, FBOX6, and ETV7 co-expression network might improve anti-PD1 drug resistance by these mechanisms.
This article had some shortcomings. The first point was that only three cohort samples were included in this paper, more cohorts are needed for cross-validation. The second point was that this article only discussed the differences in mRNA and protein levels initially, the mechanisms still needed to be further explored.
In conclusion, PSMB8, PSMB9, PSMB10, PSME2, TAP1, IRF1, FBOX6, and ETV7 are CD8+ T cell infiltration-promoting factors. PSMB8, PSMB9, PSMB10, PSME2, TAP1, and IRF1 promote CD8+ T cell infiltration by enhancing MHC class I tumor antigen processing. Nevertheless, the mechanisms of action of FBOX6 and ETV7 remain unclear. This work might generate new concepts for development of anti-PD1 therapy for insensitive bladder patients, and may improve the prognosis in advanced bladder cancer.
Data Availability Statement
Publicly available datasets were analyzed in this study. This data can be found here: The datasets TCGA-BLCA for this study can be found in the [The Cancer Genome Atlas] [http://cancergenome.nih.gov/)].The datasets GSE32894 and GSE48075 for this study can be found in the [GEO] [http://www.ncbi.nlm.nih.gov/geo/].
Author Contributions
YW conceived and designed the experiments, authored or reviewed drafts of the paper, and approved the final draft. KY analyzed the data, prepared figures and/or tables, and approved the final draft. JL performed the experiments, authored or reviewed drafts of the paper, and approved the final draft. YL performed the experiments, authored or reviewed drafts of the paper, and approved the final draft. JW performed the experiments, authored or reviewed drafts of the paper, and approved the final draft. XJL performed the experiments, authored or reviewed drafts of the paper, and approved the final draft. XXL performed the experiments, authored or reviewed drafts of the paper, and approved the final draft. ZH performed the experiments, authored or reviewed drafts of the paper, and approved the final draft. JS performed the experiments, authored or reviewed drafts of the paper, and approved the final draft. SS performed the experiments, authored or reviewed drafts of the paper, and approved the final draft. JB conceived and designed the experiments, authored or reviewed drafts of the paper, and approved the final draft. All authors contributed to the article and approved the submitted version.
Conflict of Interest
The authors declare that the research was conducted in the absence of any commercial or financial relationships that could be construed as a potential conflict of interest.
Acknowledgments
We want to thank TCGA, GEO for free use.
References
1. Miller KD, Siegel RL, Lin CC, Mariotto AB, Kramer JL, Rowland JH, et al. Cancer treatment and survivorship statistics, 2016. CA Cancer J Clin (2016) 66(4):271–89. doi: 10.3322/caac.21349
2. Powles T, Eder JP, Fine GD, Braiteh FS, Loriot Y, Cruz C, et al. MPDL3280A (anti-PD-L1) treatment leads to clinical activity in metastatic bladder cancer. Nature (2014) 515:558–62. doi: 10.1038/nature13904
3. Robertson AG, Kim J, Al-Ahmadie H, Bellmunt J, Guo G, Cherniack AD, et al. Comprehensive Molecular Characterization of Muscle-Invasive Bladder Cancer. Cell (2018) 174:1033. doi: 10.1016/j.cell.2018.07.036
4. Funt SA, Rosenberg JE. Systemic, perioperative management of muscle-invasive bladder cancer and future horizons. Nat Rev Clin Oncol (2017) 14:221–34. doi: 10.1038/nrclinonc.2016.188
5. Chen DS, Irving BA, Hodi FS. Molecular pathways: next-generation immunotherapy–inhibiting programmed death-ligand 1 and programmed death-1. Clin Cancer Res (2012) 18:6580–7. doi: 10.1158/1078-0432.CCR-12-1362
6. Topalian SL, Drake CG, Pardoll DM. Immune checkpoint blockade: a common denominator approach to cancer therapy. Cancer Cell (2015) 27:450–61. doi: 10.1016/j.ccell.2015.03.001
7. Jiang X, Wang J, Deng X, Xiong F, Ge J, Xiang B, et al. Role of the tumor microenvironment in PD-L1/PD-1-mediated tumor immune escape. Mol Cancer (2019) 18:10. doi: 10.1186/s12943-018-0928-4
8. Ribas A. Adaptive Immune Resistance: How Cancer Protects from Immune Attack. Cancer Discovery (2015) 5:915–9. doi: 10.1158/2159-8290.CD-15-0563
9. Aggen DH, Drake CG. Biomarkers for immunotherapy in bladder cancer: a moving target. J Immunother Cancer (2017) 5:94. doi: 10.1186/s40425-017-0299-1
10. Topalian SL, Hodi FS, Brahmer JR, Gettinger SN, Smith DC, McDermott DF, et al. Safety, activity, and immune correlates of anti-PD-1 antibody in cancer. N Engl J Med (2012) 366:2443–54. doi: 10.1056/NEJMoa1200690
11. Ren D, Hua Y, Yu B, Ye X, He Z, Li C, et al. Predictive biomarkers and mechanisms underlying resistance to PD1/PD-L1 blockade cancer immunotherapy. Mol Cancer (2020) 19:19. doi: 10.1186/s12943-020-1144-6
12. van der Leun AM, Thommen DS, Schumacher TN. CD8+ T cell states in human cancer: insights from single-cell analysis. Nat Rev Cancer (2020) 20:218–32. doi: 10.1038/s41568-019-0235-4
13. Borst J, Ahrends T, Bąbała N, Melief C, Kastenmüller W. CD4+ T cell help in cancer immunology and immunotherapy. Nat Rev Immunol (2018) 18:635–47. doi: 10.1038/s41577-018-0044-0
14. Rock KL, York IA, Goldberg AL. Post-proteasomal antigen processing for major histocompatibility complex class I presentation. Nat Immunol (2004) 5:670–7. doi: 10.1038/ni1089
15. Townsend A, Trowsdale J. The transporters associated with antigen presentation. Semin Cell Biol (1993) 4:53–61. doi: 10.1006/scel.1993.1007
16. Lin CT, Tung CL, Tsai YS, Shen CH, Jou YC, Yu MT, et al. Prognostic relevance of preoperative circulating CD8-positive lymphocytes in the urinary bladder recurrence of urothelial carcinoma. Urol Oncol (2012) 30:680–7. doi: 10.1016/j.urolonc.2010.08.009
17. Byrne A, Savas P, Sant S, Li R, Virassamy B, Luen SJ, et al. Tissue-resident memory T cells in breast cancer control and immunotherapy responses. Nat Rev Clin Oncol (2020) 17:341–8. doi: 10.1038/s41571-020-0333-y
18. Langfelder P, Horvath S. WGCNA: an R package for weighted correlation network analysis. BMC Bioinf (2008) 9:559. doi: 10.1186/1471-2105-9-559
19. Sjödahl G, Lauss M, Lövgren K, Chebil G, Gudjonsson S, Veerla S, et al. A molecular taxonomy for urothelial carcinoma. Clin Cancer Res (2012) 18:3377–86. doi: 10.1158/1078-0432.CCR-12-0077-T
20. Choi W, Porten S, Kim S, Willis D, Plimack ER, Hoffman-Censits J, et al. Identification of distinct basal and luminal subtypes of muscle-invasive bladder cancer with different sensitivities to frontline chemotherapy. Cancer Cell (2014) 25:152–65. doi: 10.1016/j.ccr.2014.01.009
21. Chen B, Khodadoust MS, Liu CL, Newman AM, Alizadeh AA. Profiling Tumor Infiltrating Immune Cells with CIBERSORT. Methods Mol Biol (2018) 1711:243–59. doi: 10.1007/978-1-4939-7493-1_12
22. Yoshihara K, Shahmoradgoli M, Martínez E, Vegesna R, Kim H, Torres-Garcia W, et al. Inferring tumour purity and stromal and immune cell admixture from expression data. Nat Commun (2013) 4:2612. doi: 10.1038/ncomms3612
23. Jiang J, Sun X, Wu W, Li L, Wu H, Zhang L, et al. Construction and application of a co-expression network in Mycobacterium tuberculosis. Sci Rep (2016) 6:28422. doi: 10.1038/srep28422
24. Miller JA, Cai C, Langfelder P, Geschwind DH, Kurian SM, Salomon DR, et al. Strategies for aggregating gene expression data: the collapseRows R function. BMC Bioinf (2011) 12:322. doi: 10.1186/1471-2105-12-322
25. Huang DW, Sherman BT, Tan Q, Collins JR, Alvord WG, Roayaei J, et al. The DAVID Gene Functional Classification Tool: a novel biological module-centric algorithm to functionally analyze large gene lists. Genome Biol (2007) 8:R183. doi: 10.1186/gb-2007-8-9-r183
26. Kanehisa M, Sato Y. KEGG Mapper for inferring cellular functions from protein sequences. Protein Sci (2002) 29(1):28–35. doi: 10.1002/pro.3711
27. Ashburner M, Ball CA, Blake JA, Botstein D, Butler H, Cherry JM, et al. Gene ontology: tool for the unification of biology. The Gene Ontology Consortium. Nat Genet (2002) 25:25–9. doi: 10.1038/75556
28. Young L, Lee HS, Inoue Y, Moss J, Singer LG, Strange C, et al. Serum VEGF-D a concentration as a biomarker of lymphangioleiomyomatosis severity and treatment response: a prospective analysis of the Multicenter International Lymphangioleiomyomatosis Efficacy of Sirolimus (MILES) trial. Lancet Respir Med (2013) 1:445–52. doi: 10.1016/S2213-2600(13)70090-0
29. Bergsten E, Uutela M, Li X, Pietras K, Ostman A, Heldin CH, et al. PDGF-D is a specific, protease-activated ligand for the PDGF beta-receptor. Nat Cell Biol (2001) 3:512–6. doi: 10.1038/35074588
30. Demoulin JB, Essaghir A. PDGF receptor signaling networks in normal and cancer cells. Cytokine Growth Factor Rev (2014) 25:273–83. doi: 10.1016/j.cytogfr.2014.03.003
31. Dieci MV, Arnedos M, Andre F, Soria JC. Fibroblast growth factor receptor inhibitors as a cancer treatment: from a biologic rationale to medical perspectives. Cancer Discovery (2013) 3:264–79. doi: 10.1158/2159-8290.CD-12-0362
32. Folkman J, Klagsbrun M. Angiogenic factors. Science (1987) 235:442–7. doi: 10.1126/science.2432664
33. Del Vecchio M, Bajetta E, Canova S, Lotze MT, Wesa A, Parmiani G, et al. Interleukin-12: biological properties and clinical application. Clin Cancer Res (2007) 13:4677–85. doi: 10.1158/1078-0432.CCR-07-0776
34. Rody A, Holtrich U, Pusztai L, Liedtke C, Gaetje R, Ruckhaeberle E, et al. T-cell metagene predicts a favorable prognosis in estrogen receptor-negative and HER2-positive breast cancers. Breast Cancer Res (2009) 11:R15. doi: 10.1186/bcr2234
35. Subramanian A, Tamayo P, Mootha VK, Mukherjee S, Ebert BL, Gillette MA, et al. Gene set enrichment analysis: a knowledge-based approach for interpreting genome-wide expression profiles. Proc Natl Acad Sci U S A (2005) 102:15545–50. doi: 10.1073/pnas.0506580102
36. Li T, Fan J, Wang B, Traugh N, Chen Q, Liu JS, et al. TIMER: A Web Server for Comprehensive Analysis of Tumor-Infiltrating Immune Cells. Cancer Res (2017) 77:e108–108e110. doi: 10.1158/0008-5472.CAN-17-0307
37. Ortiz-Navarrete V, Seelig A, Gernold M, Frentzel S, Kloetzel PM, Hämmerling GJ. Subunit of the ‘20S’ proteasome (multicatalytic proteinase) encoded by the major histocompatibility complex. Nature (1991) 353:662–4. doi: 10.1038/353662a0
38. Brown MG, Driscoll J, Monaco JJ. Structural and serological similarity of MHC-linked LMP and proteasome (multicatalytic proteinase) complexes. Nature (1991) 353:355–7. doi: 10.1038/353355a0
39. Kelly A, Powis SH, Glynne R, Radley E, Beck S, Trowsdale J. Second proteasome-related gene in the human MHC class II region. Nature (1991) 353:667–8. doi: 10.1038/353667a0
40. Glynne R, Powis SH, Beck S, Kelly A, Kerr LA, Trowsdale J. A proteasome-related gene between the two ABC transporter loci in the class II region of the human MHC. Nature (1991) 353:357–60. doi: 10.1038/353357a0
41. Groettrup M, Kirk CJ, Basler M. Proteasomes in immune cells: more than peptide producers. Nat Rev Immunol (2010) 10:73–8. doi: 10.1038/nri2687
42. Groettrup M, Kraft R, Kostka S, Standera S, Stohwasser R, Kloetzel PM. A third interferon-gamma-induced subunit exchange in the 20S proteasome. Eur J Immunol (1996) 26:863–9. doi: 10.1002/eji.1830260421
43. Nandi D, Jiang H, Monaco JJ. Identification of MECL-1 (LMP-10) as the third IFN-gamma-inducible proteasome subunit. J Immunol (1996) 156:2361–4.
44. Hisamatsu H, Shimbara N, Saito Y, Kristensen P, Hendil KB, Fujiwara T, et al. Newly identified pair of proteasomal subunits regulated reciprocally by interferon gamma. J Exp Med (1996) 183:1807–16. doi: 10.1084/jem.183.4.1807
45. Boes B, Hengel H, Ruppert T, Multhaup G, Koszinowski UH, Kloetzel PM. Interferon gamma stimulation modulates the proteolytic activity and cleavage site preference of 20S mouse proteasomes. J Exp Med (1994) 179:901–9. doi: 10.1084/jem.179.3.901
46. Akiyama K, Yokota K, Kagawa S, Shimbara N, Tamura T, Akioka H, et al. cDNA cloning and interferon gamma down-regulation of proteasomal subunits X and Y. Science (1994) 265:1231–4. doi: 10.1126/science.8066462
47. Groettrup M, van den Broek M, Schwarz K, Macagno A, Khan S, de Giuli R, et al. Structural plasticity of the proteasome and its function in antigen processing. Crit Rev Immunol (2001) 21:339–58. doi: 10.1615/CritRevImmunol.v21.i4.30
48. Kloetzel PM. Antigen processing by the proteasome. Nat Rev Mol Cell Biol (2001) 2:179–87. doi: 10.1038/35056572
49. Guimarães G, Gomes M, Campos PC, Marinho FV, de Assis N, Silveira TN, et al. Immunoproteasome Subunits Are Required for CD8+ T Cell Function and Host Resistance to Brucella abortus Infection in Mice. Infect Immun (2018) 86:e00615-17 doi: 10.1128/IAI.00615-17
50. Nagayama Y, Nakahara M, Shimamura M, Horie I, Arima K, Abiru N. Prophylactic and therapeutic efficacies of a selective inhibitor of the immunoproteasome for Hashimoto’s thyroiditis, but not for Graves’ hyperthyroidism, in mice. Clin Exp Immunol (2012) 168:268–73. doi: 10.1111/j.1365-2249.2012.04578.x
51. Cathro HP, Smolkin ME, Theodorescu D, Jo VY, Ferrone S, Frierson HF Jr. Relationship between HLA class I antigen processing machinery component expression and the clinicopathologic characteristics of bladder carcinomas. Cancer Immunol Immunother (2010) 59:465–72. doi: 10.1007/s00262-009-0765-9
52. Knowlton JR, Johnston SC, Whitby FG, Realini C, Zhang Z, Rechsteiner M, et al. Structure of the proteasome activator REGalpha (PA28alpha). Nature (1997) 390:639–43. doi: 10.1038/37670
53. Ma CP, Slaughter CA, DeMartino GN. Identification, purification, and characterization of a protein activator (PA28) of the 20 S proteasome (macropain). J Biol Chem (1992) 267:10515–23.
54. Dubiel W, Pratt G, Ferrell K, Rechsteiner M. Purification of an 11 S regulator of the multicatalytic protease. J Biol Chem (1992) 267:22369–77.
55. Dick TP, Ruppert T, Groettrup M, Kloetzel PM, Kuehn L, Koszinowski UH, et al. Coordinated dual cleavages induced by the proteasome regulator PA28 lead to dominant MHC ligands. Cell (1996) 86:253–62. doi: 10.1016/s0092-8674(00)80097-5
56. Li J, Gao X, Ortega J, Nazif T, Joss L, Bogyo M, et al. Lysine 188 substitutions convert the pattern of proteasome activation by REGgamma to that of REGs alpha and beta. EMBO J (2001) 20:3359–69. doi: 10.1093/emboj/20.13.3359
57. Ossendorp F, Fu N, Camps M, Granucci F, Gobin SJ, van den Elsen PJ, et al. Differential expression regulation of the alpha and beta subunits of the PA28 proteasome activator in mature dendritic cells. J Immunol (2005) 174:7815–22. doi: 10.4049/jimmunol.174.12.7815
58. Neefjes JJ, Momburg F, Hämmerling GJ. Selective and ATP-dependent translocation of peptides by the MHC-encoded transporter. Science (1993) 261:769–71. doi: 10.1126/science.8342042
59. Shepherd JC, Schumacher TN, Ashton-Rickardt PG, Imaeda S, Ploegh HL, Janeway CA Jr, et al. TAP1-dependent peptide translocation in vitro is ATP dependent and peptide selective. Cell (1993) 74:577–84. doi: 10.1016/0092-8674(93)80058-m
60. Monaco JJ, Cho S, Attaya M. Transport protein genes in the murine MHC: possible implications for antigen processing. Science (1990) 250:1723–6. doi: 10.1126/science.2270487
61. Spies T, Bresnahan M, Bahram S, Arnold D, Blanck G, Mellins E, et al. A gene in the human major histocompatibility complex class II region controlling the class I antigen presentation pathway. Nature (1990) 348:744–7. doi: 10.1038/348744a0
62. Trowsdale J, Hanson I, Mockridge I, Beck S, Townsend A, Kelly A. Sequences encoded in the class II region of the MHC related to the ‘ABC’ superfamily of transporters. Nature (1990) 348:741–4. doi: 10.1038/348741a0
63. Chen HL, Gabrilovich D, Tampé R, Girgis KR, Nadaf S, Carbone DP. A functionally defective allele of TAP1 results in loss of MHC class I antigen presentation in a human lung cancer. Nat Genet (1996) 13:210–3. doi: 10.1038/ng0696-210
64. Einstein MH, Leanza S, Chiu LG, Schlecht NF, Goldberg GL, Steinberg BM, et al. Genetic variants in TAP are associated with high-grade cervical neoplasia. Clin Cancer Res (2009) 15:1019–23. doi: 10.1158/1078-0432.CCR-08-1207
65. Leibowitz MS, Andrade Filho PA, Ferrone S, Ferris RL. Deficiency of activated STAT1 in head and neck cancer cells mediates TAP1-dependent escape from cytotoxic T lymphocytes. Cancer Immunol Immunother (2011) 60:525–35. doi: 10.1007/s00262-010-0961-7
66. Henle AM, Nassar A, Puglisi-Knutson D, Youssef B, Knutson KL. Downregulation of TAP1 and TAP2 in early stage breast cancer. PloS One (2017) 12:e0187323. doi: 10.1371/journal.pone.0187323
67. White LC, Wright KL, Felix NJ, Ruffner H, Reis LF, Pine R, et al. Regulation of LMP2 and TAP1 genes by IRF-1 explains the paucity of CD8+ T cells in IRF-1-/- mice. Immunity (1996) 5:365–76. doi: 10.1016/s1074-7613(00)80262-9
68. Tanaka K, Kasahara M. The MHC class I ligand-generating system: roles of immunoproteasomes and the interferon-gamma-inducible proteasome activator PA28. Immunol Rev (1998) 163:161–76. doi: 10.1111/j.1600-065x.1998.tb01195.x
69. Gu X, Shin BH, Akbarali Y, Weiss A, Boltax J, Oettgen P, et al. Tel-2 is a novel transcriptional repressor related to the Ets factor Tel/ETV-6. J Biol Chem (2001) 276:9421–36. doi: 10.1074/jbc.M010070200
70. Fagerberg L, Hallström BM, Oksvold P, Kampf C, Djureinovic D, Odeberg J, et al. Analysis of the human tissue-specific expression by genome-wide integration of transcriptomics and antibody-based proteomics. Mol Cell Proteomics (2014) 13:397–406. doi: 10.1074/mcp.M113.035600
71. Cai L, Li J, Zhao J, Guo Y, Xie M, Zhang X, et al. Fbxo6 confers drug-sensitization to cisplatin via inhibiting the activation of Chk1 in non-small cell lung cancer. FEBS Lett (2019) 593:1827–36. doi: 10.1002/1873-3468.13461
72. Mariathasan S, Turley SJ, Nickles D, Castiglioni A, Yuen K, Wang Y, et al. TGFβ attenuates tumour response to PD-L1 blockade by contributing to exclusion of T cells. Nature (2018) 554:544–8. doi: 10.1038/nature25501
73. Xiao J, Liu QY, Du JH, Zhu WL, Li QY, Chen XL, et al. Integrated analysis of physiological, transcriptomic and metabolomic responses and tolerance mechanism of nitrite exposure in Litopenaeus vannamei. Sci Total Environ (2020) 711:134416. doi: 10.1016/j.scitotenv.2019.134416
Keywords: CD8+ T cells, antigen presentation, weighted gene co-expression network analysis, immune microenvironment, bladder cancer
Citation: Wang Y, Yan K, Lin J, Liu Y, Wang J, Li X, Li X, Hua Z, Zheng Z, Shi J, Sun S and Bi J (2020) CD8+ T Cell Co-Expressed Genes Correlate With Clinical Phenotype and Microenvironments of Urothelial Cancer. Front. Oncol. 10:553399. doi: 10.3389/fonc.2020.553399
Received: 18 April 2020; Accepted: 20 October 2020;
Published: 19 November 2020.
Edited by:
Michal Mego, Campus Bio-Medico University, ItalyReviewed by:
Mohammed Imran Khan, Western University, CanadaGuru Sonpavde, Dana–Farber Cancer Institute, United States
Copyright © 2020 Wang, Yan, Lin, Liu, Wang, Li, Li, Hua, Zheng, Shi, Sun and Bi. This is an open-access article distributed under the terms of the Creative Commons Attribution License (CC BY). The use, distribution or reproduction in other forums is permitted, provided the original author(s) and the copyright owner(s) are credited and that the original publication in this journal is cited, in accordance with accepted academic practice. No use, distribution or reproduction is permitted which does not comply with these terms.
*Correspondence: Jianbin Bi, bijianbin@hotmail.com
†These authors have contributed equally to this work