 Jie JiangChong LiuGuoyong Xu
 Tuo LiangChaojie YuShian LiaoZide ZhangZhaojun LuZequn WangJiarui ChenTianyou ChenHao Li
 Xinli Zhan*
- Spinal Orthopedic Ward, The First Clinical Affiliated Hospital of Guangxi Medical University, Nanning, China
Introduction: This study aimed to identify important genes associated with melanoma to further develop new target gene therapies and analyze their significance concerning prognosis.
Materials and methods: Gene expression data for melanoma and normal tissue were downloaded from three databases. Differentially co-expressed genes were identified by WGCNA and DEGs analysis. These genes were subjected to GO, and KEGG enrichment analysis and construction of the PPI visualized with Cytoscape and screened for the top 10 Hub genes using CytoHubba. We validated the Hub gene’s protein levels with an immunohistochemical assay to confirm the accuracy of our analysis.
Results: A total of 435 differentially co-expressed genes were obtained. Survival curves showed that high expression of FOXM1,\ EXO1, KIF20A, TPX2, and CDC20 in melanoma patients with 5 of the top 10 hub genes was associated with reduced overall survival (OS). Immunohistochemistry showed that all five genes were expressed at higher protein levels in melanoma than in paracancerous tissues.
Conclusion: FOXM1, EXO1, KIF20A, TPX2, and CDC20 are prognosis-associated core genes of melanoma, and their high expression correlates with the low prognosis of melanoma patients and can be used as biomarkers for melanoma diagnosis, treatment, and prognosis prediction.
Introduction
Melanoma, a highly malignant tumor originating from melanocytes, most commonly occurs in the skin and can evolve from a congenital benign cell nevus or develop from a dysplastic nevus. According to a 2014 article on the epidemiology of melanoma: men are about 1.5 times more likely to develop melanoma than women; the development of malignant melanoma may be associated with changes in external environmental factors (e.g., UV exposure) (1). In the past few years, the primary means of treating melanoma have included: surgery, medication, and radiation therapy (2). A review of the literature on microsurgery versus extensive local excision for melanoma showed that after controlling for potential confounding variables, patients treated for melanoma with microsurgery were more likely to be alive at five years than those treated for melanoma with extensive local excision (3). Despite the many treatment options for melanoma, patient survival is still limited.
In recent years, with the rapid development of bioinformatics technology, bioinformatics has become increasingly popular for studying the molecular mechanisms of diseases and discovering disease-specific biomarkers that are increasingly being used to diagnose and treat diseases accurately (4–6). Weighted gene co-expression network analysis (WGCNA), one of the bioinformatics analysis methods, describes co-expression patterns between genes in microarray samples, providing new insights for predicting the function of co-expressed genes and the development of diseases (7). Differentially expressed genes(DEGs) are widely used in cancer research and are excellent cancer research methods (8–10). It provides a genomics-based method for discovering changes in gene expression levels between experimental and control groups (11). We could look for potential disease-related biomarkers in genes with significant differences in gene expression. Thus, we have combined the two approaches by combining genes from relevant modules obtained by the WGCNA method with differentially expressed genes to enhance the discrimination of genes that are expected to be candidate markers of disease.
In this study, in order to obtain melanoma hub genes, we analyzed melanoma mRNA expression data downloaded from the UCSC database, GTEx database, and GEO database by WGCNA method and differential expression gene method. We further verified our analysis’s accuracy and reliability by GO enrichment analysis, KEGG pathway enrichment analysis, protein-protein functional interaction network (PPI), survival analysis, and immunohistochemistry experiments to validate the results obtained from the analysis.
Materials and Methods
Data Download
Gene expression data for melanoma were downloaded from UCSC Xena (http://xena.ucsc.edu/) and the GEO database (https://www.ncbi.nlm.nih.gov/gds/). Furthermore, we downloaded all the data and corresponding clinical information on melanoma from the UCSC Xena database free of charge. Data downloaded from the UCSC Xena database contained 471 melanoma samples; gene expression data for 813 normal skin samples were downloaded from the GTEx database (https://www.gtexportal.org/home/); the number of melanoma cases for which all clinical information was complete was 322. In total, 55,188 genes were included in our acceptance of our subsequent analysis. On the other hand, we downloaded melanoma sample GSE3189 from the GEO database, a dataset containing 45 melanoma samples, 18 nevus samples, and 7 normal skin samples (12). We removed 18 moles from the sample. This dataset was studied using the platform GPL96 [HG-U133A] Affymetrix Human Genome U133A Array. Based on the manufacturer’s annotation files, we converted the probe files into gene symbols and removed duplicate probes, all expression data were transformed by log2, and the data were standardized. Eventually, a total of 12,549 genes were included for our subsequent analysis.
Using WGCNA to Identify Key Co-Expression Modules
WGCNA is a framework for establishing and analyzing weighted gene co-expression networks and is a widely used bioinformatics analysis method that uses the interrelationship between two variables to study biological networks. In this study, all statistical analysis operations were performed based on R (x64 version 4.0.2). We used the R package (WGCNA) to construct a gene co-expression network from the gene expression data of melanoma from UCSC Xena and the gene expression data of melanoma data of GSE3189 from the GEO database (7). To construct the scale-free network, we use the R command: softPower =sft$powerEstimate, which commands R to automatically select the optimal power value, which ends up with a soft threshold of 12 for the UCSC Xena database and 5 for the GEO database. We then construct the adjacency matrix by the following formula: aij = power (Sij, β) = |Sij|^β (aij denotes the adjacency matrix between gene i and gene j; Sij denotes a similarity matrix completed by Pearson correlations for all gene pairs.; β denotes the soft threshold). Subsequently, we calculated the degree of dissimilarity between the nodes and converted the adjacency matrix into a TOM matrix. After that, we identified gene networks/modules using a dynamic shear tree algorithm. We correlated previously computed module features with clinical features to investigate the co-expression network’s functional modules further. As a result, the modules that were subsequently selected were closely correlated with clinical features and were selected by us for subsequent analyses. More detailed methods have been elucidated in detail by previous researchers (7).
Identification of Differentially Expressed Genes and Selection of Significantly Expressed Modules
We used the R package (Limma) to perform differentially expressed genes (DEGs) analysis on gene expression data from both databases (13). To identify DEGs between melanoma and normal tissues, we performed the differential analysis of gene expression matrices from the two databases using the limma package, respectively. Cut off value was set to |logFC|>=1, adjusted P-value<0.05. We then used the R package (pheatmap) to construct heat maps of the DEGs filtered from the two databases; the R package (ggplot2) to plot the DEGs volcanoes. Next, co-expression genes extracted from the co-expression network overlapped with DEGs were used to identify potential prognostic genes. The overlapping portions of genes were used for subsequent analysis using the R package (VeenDiagram) (14)to visualize and plot the genes’ overlapping portions into Veen diagrams.
GO Enrichment Analysis and KEGG Pathway Enrichment Analysis of Target Genes
To explore the overlapping parts of Gene Ontology (GO) (15) and KEGG pathway enrichment analysis (16), we used the R package (clusterProfiler, org.Hs.eg.db, enrichplot, ggplot2) (17) for analysis and visualization. The cut off value is set to p-value<0.05. The GO enrichment analysis consists of three main panels, namely Cellular component (CC), Biological process (BP), and Molecular function (MF). KEGG pathway enrichment analysis was mainly enriched in Melanoma, Transcriptional misregulation in cancer.
Construction of Protein-Protein Interaction Networks and Screening of Hub Genes
We used the STRING (https://string-db.org/) (18) online database to construct protein-protein interaction (PPI) networks for overlapping partial genes. Subsequently, the resulting PPI network is imported into Cytoscape (v3.8.0) to visualize the PPI. We used a plugin in Cytoscape (CytoHubba) (19) to find Hub genes in these genes. We used the MCC algorithm, and the top 10 genes obtained to the MCC algorithm were used as the central genes for our study.
The Relationship Between Hub Genes and Prognosis, and Their Expression in Various Subgroups
In this study, to verify Hub genes’ reliability, we used information from patients whose clinical information was complete for survival analysis. All patients were divided into two groups based on Hub genes’ median expression value, with patients greater than or equal to the median value assigned to the high expression group and patients less than the median value assigned to the low expression group. We plotted the Kaplan-Meier univariate survival analysis of overall survival (OS) using the R package (survival, survminer) for the top 10 hub genes. To further explore the effect of Hub genes on prognosis, we analyzed the relationship between five Hub genes and survival status and survival time using multivariate COX regression and constructed a prognostic model. We calculated the risk value of each patient and included patients with higher than average risk values in the high-risk group and those with lower or equal risk values in the low-risk group, and subsequently plotted Kaplan-Meier curves according to the high-risk and low-risk groups. Subsequently, we analyzed the top 10 Hub genes concerning disease-free survival using the online database GEPIA2 (http://gepia.cancer-pku.cn/). After that, we explored the differential expression of Hub genes in cancer and normal tissues, plotting each Hub genes’ expression levels in different subgroups between cancer and normal tissues as a box line graph.
Immunohistochemistry
We used tumor sections and normal skin sections of melanoma patients who underwent surgical treatment at the First Clinical Affiliated Hospital of Guangxi Medical University for immunohistological studies, which were approved by the Ethics Department of the First Clinical Affiliated Hospital of Guangxi Medical University and conformed to the World Medical Association Declaration of Helsinki. We performed immunohistological analysis of six pairs (melanoma and normal skin) of pathological sections for each gene. Immunohistochemical staining of formalin-fixed melanoma tissue samples and paraffin-embedded and paracancerous tissue samples were performed. The FOXM1 and TPX2 antibodies for immunohistochemical staining were purchased from the Abcam; the KIF20A antibody was purchased from the Bioss; the CDC20 antibody was purchased from the Proteintech; the EXO1 antibody was purchased from the Abclonal. After removing paraffin, hydration, and sealing, the specimens were mixed with anti-FOXM1, KIF20A, TPX2, CDC20, and EXO1 and incubated overnight at 4°C (dilution ratios of 1:250, 1:200, 1:4000, 1:300, 1:100, respectively). Finally, in order to calculate the positivity rate of immunohistology images more precisely, we performed statistical analysis of images from immunohistology studies using Image J software. We then performed statistical analysis of the immunohistological positive rate for melanoma and the immunohistological positive rate for normal skin samples using the paired sample mean t-test in IBM SPSS Statistics 25 software. Finally, we use GraphPad Prism 8 to visualize the statistical results.
Results
Construction of Weighted Gene Co-Expression Modules
To identify modules associated with prognosis in patients with melanoma, we performed gene co-expression network analysis of gene expression matrices from the UCSC Xena database and GSE3189 using the WGCNA package. There are six co-expression modules constructed from UCSC Xena database expression data (Figure 1A) and seven co-expression modules constructed from GSE3189 (Figure 2A), not including the grey module cluster to which it is assigned. We developed a heat map module features’ relationship, which was used to assess each co-expression module’s relationship with two clinical features (normal and cancer). The two modules’ features are shown in Figure 1B and Figure 2B. From the pictures, we can find that the highest correlation between the magenta module in UCSC Xena and the blue module in GSE3189 and normal organization (magenta module: r=-0.98, P-value<1e-200; blue module: r=-0.96, P-value<1e-200). Therefore, we extracted the genes from these two modules to further dig deeper into the useful information in them.
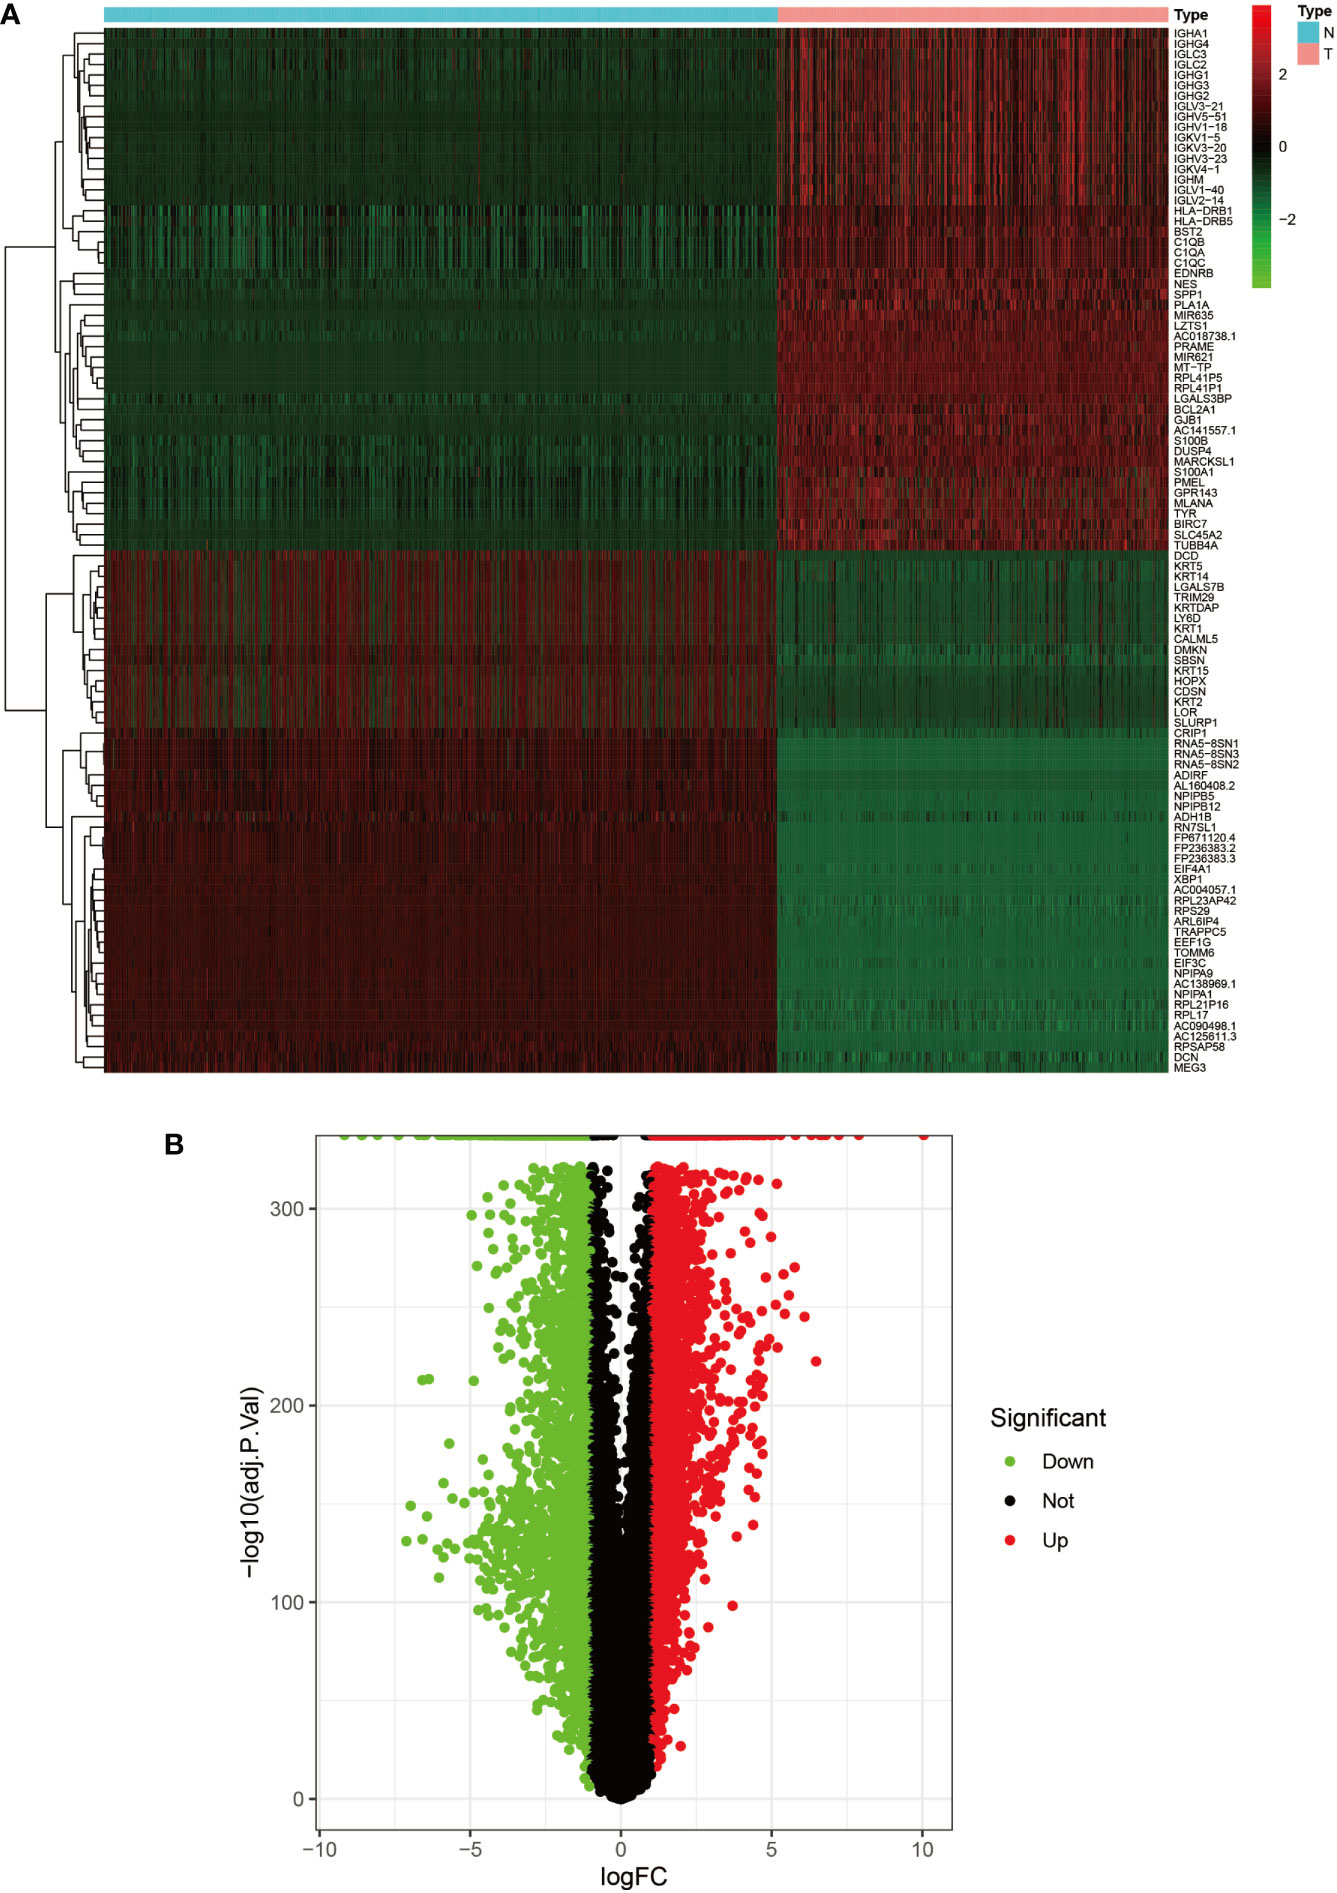
Figure 1 Heat map and volcano map of DEGs from the UCSC Xena database. (A) Heat map of the top 50 upregulated and top 50 down-regulated DEGs obtained from the identification. The red part indicates upregulated genes, and the green part indicates down-regulated genes. (B) Volcano plot with cut off value set to |logFC|>1,P-value<0.05. Red dots indicate upregulated genes, green dots indicate down-regulated genes, and black represents non-significant genes.
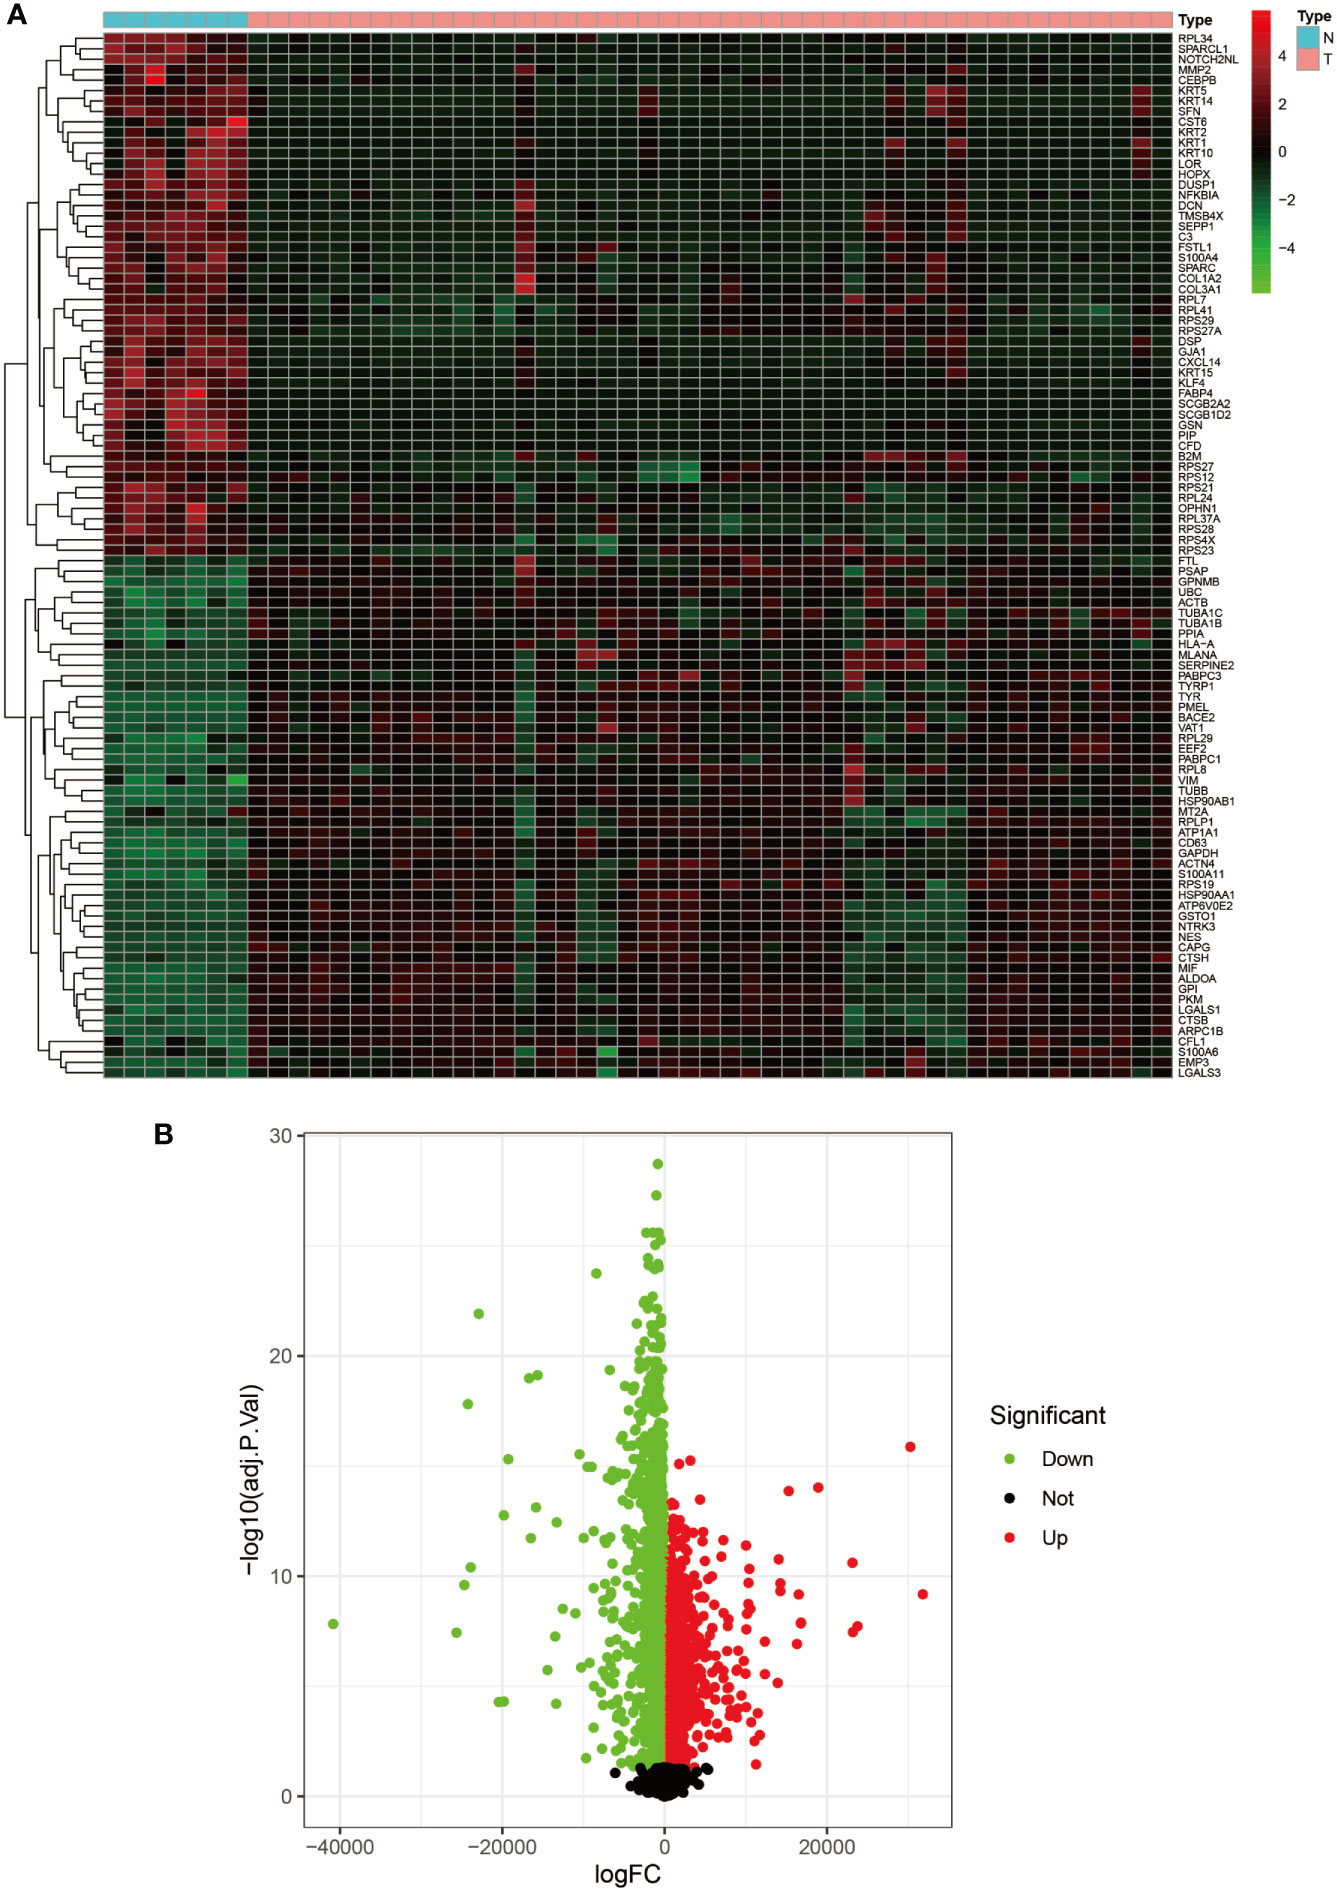
Figure 2 Heat map and volcano map of GSE3189. (A) Heat map of the top 50 upregulated and top 50 down-regulated DEGs obtained from the identification. The red part indicates upregulated genes, and the green part indicates down-regulated genes. (B) Volcano plot with cut off value set to |logFC|>1,P-value<0.05. Red dots indicate upregulated genes, green dots indicate down-regulated genes, and black represents non-significant genes.
Identification of DEGs and Gene Identification With Co-Expression Modules
We set the cut-off value for DEGs as |logFC|>=1, adjusted P-value<0.05, and a total of 6609 DEGs were identified in the UCSC Xena dataset; heat maps and volcanoes of DEGs are shown in Figure 3; 6223 DEGs were identified in the GSE3198 dataset; heat maps and volcanoes of differential genes See Figure 4. We present the top 100 differentially expressed genes calculated from the GEO database in Table 1; the top 100 differentially expressed genes calculated from the UCSC Xena database are presented in Table 2. Genes from the magenta module in UCSC Xena and genes from the blue module in GSE3189, as well as DEGs from both databases, yielded a total of 435 overlapping genes extracted for subsequent analysis (Figure 5).
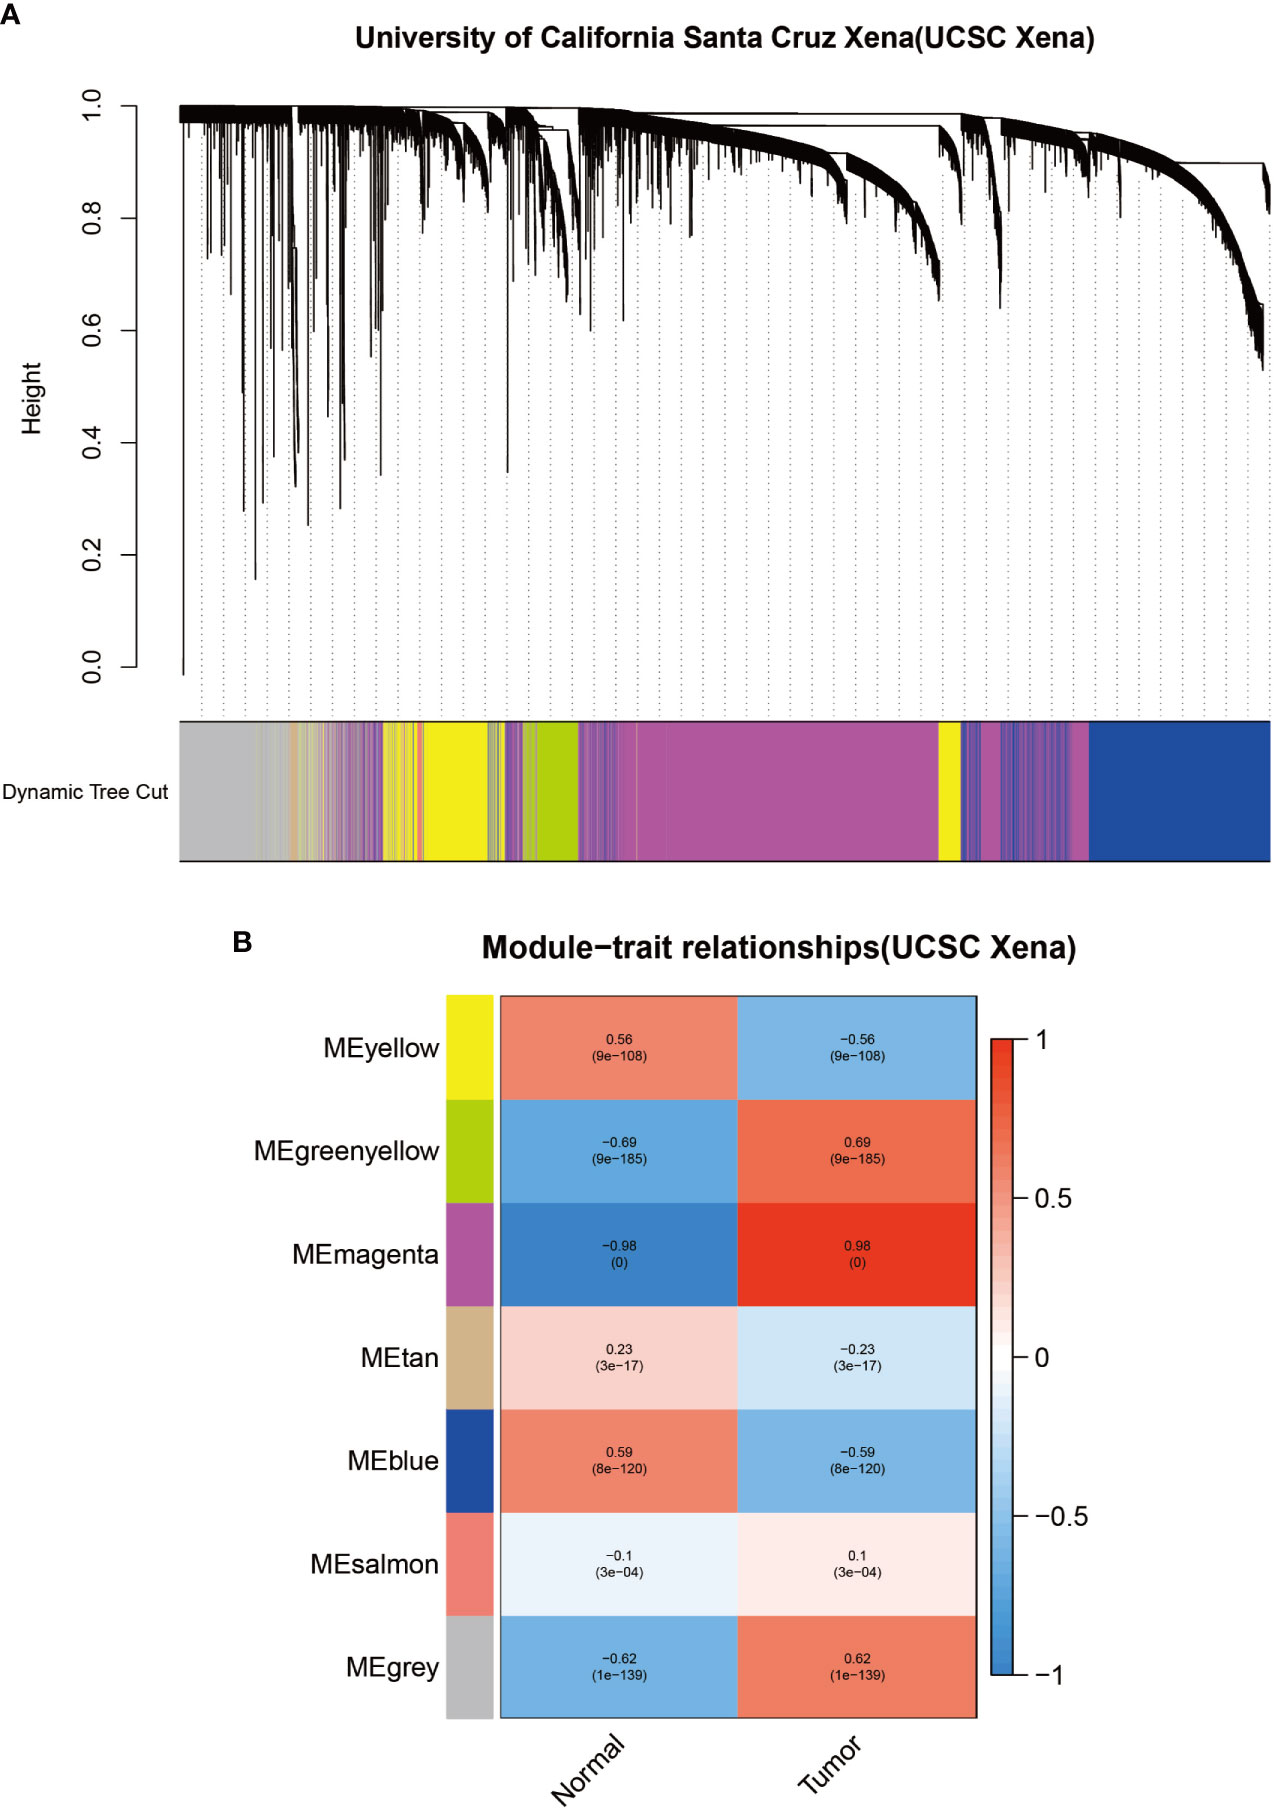
Figure 3 Identification of modules associated with clinical information in the UCSC Xena database. (A) Clustered tree diagram of co-expression network modules sorted by gene-level clustering of matrices obtained by Equation 1-TOM. Each color represents a different co-expressed gene. (B) Relationship diagram of the features of the modules. Each row corresponds to a color module, and each column corresponds to a clinical feature (normal and cancer). Each cell contains the correlation and P-value of the corresponding module.
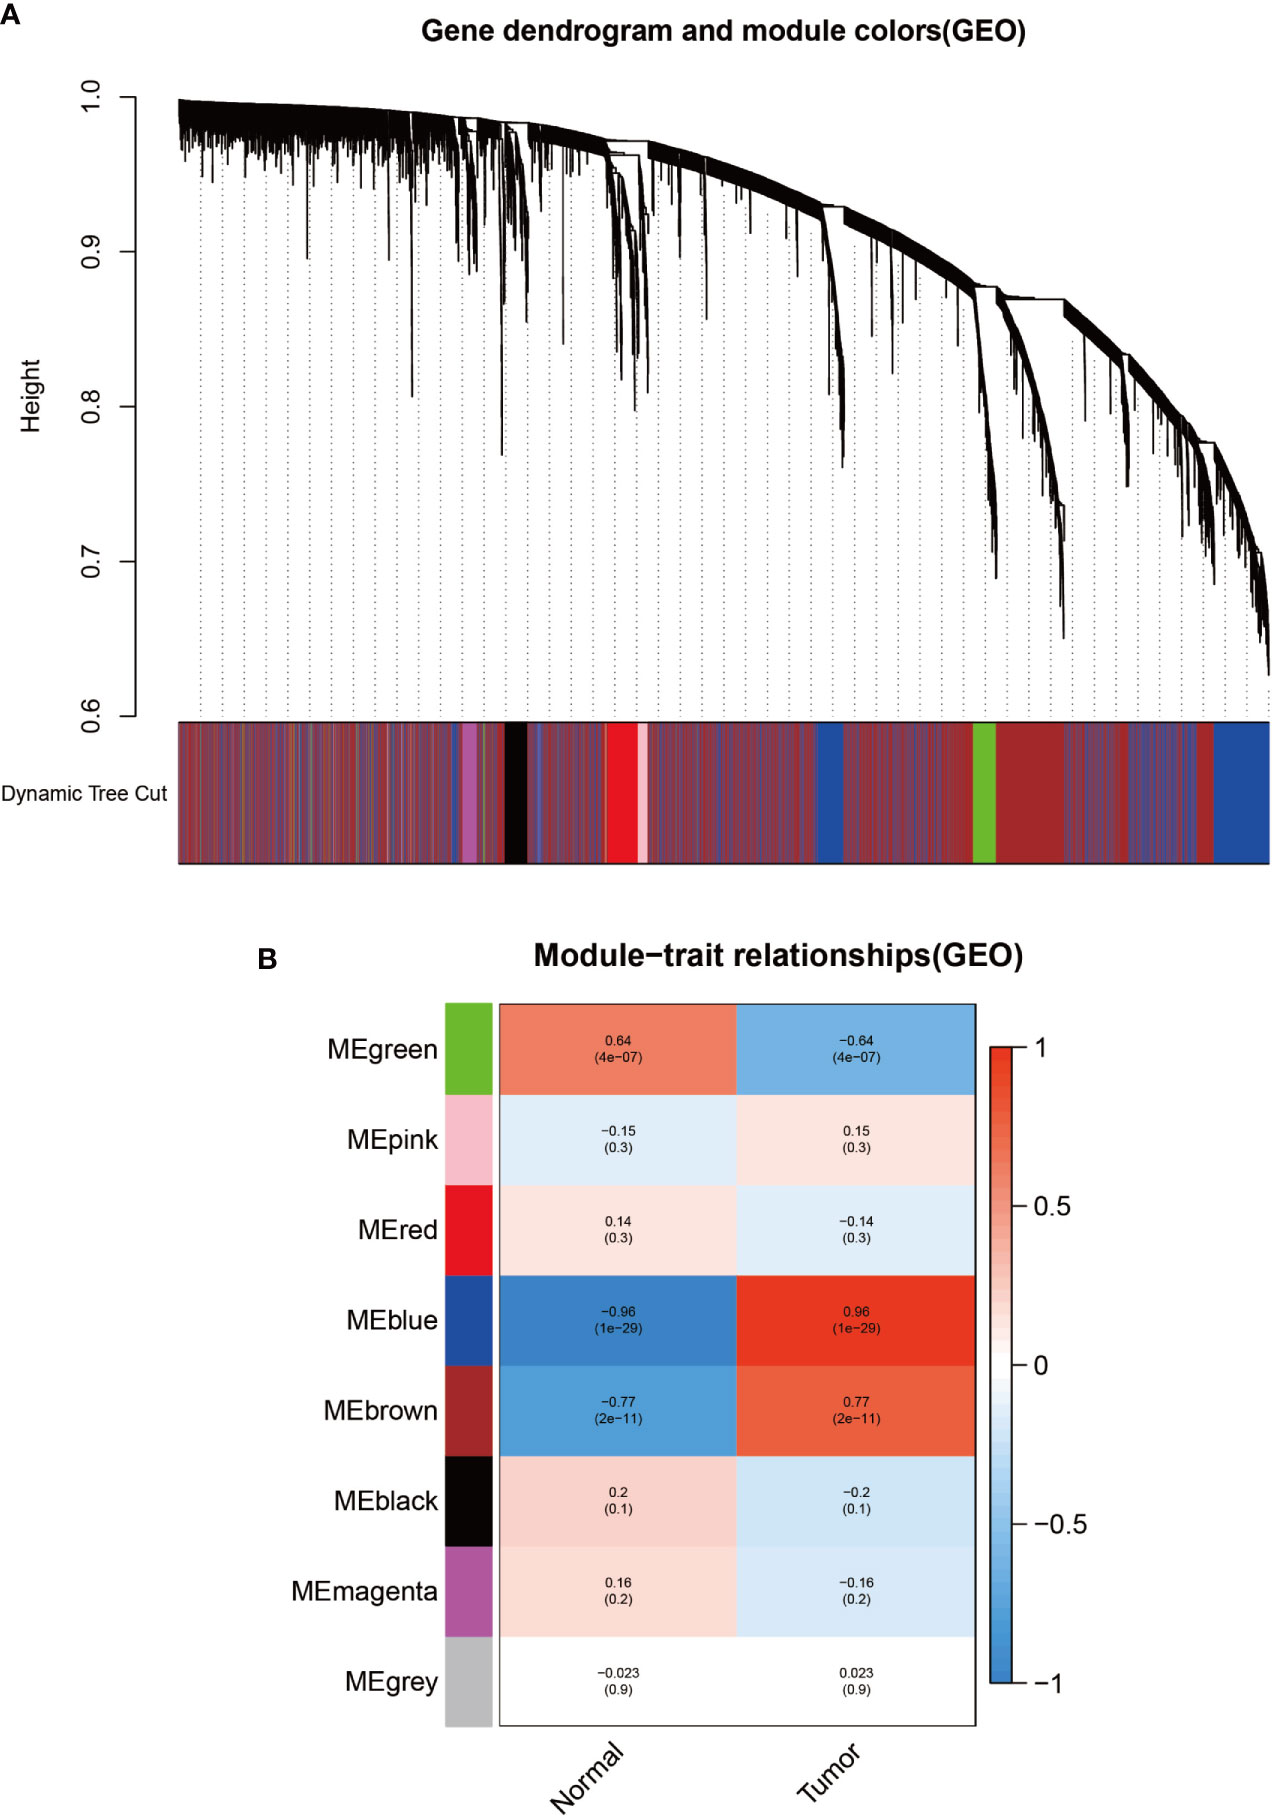
Figure 4 Identification of modules related to clinical information in the GSE3189 database. (A) Clustered tree diagram of co-expression network modules sorted by gene-level clustering of matrices obtained by Equation 1-TOM. Each color represents a different co-expressed gene. (B) Relationship diagram of the features of the modules. Each row corresponds to a color module, and each column corresponds to a clinical feature (normal and cancer). Each cell contains the correlation and P-value of the corresponding module.
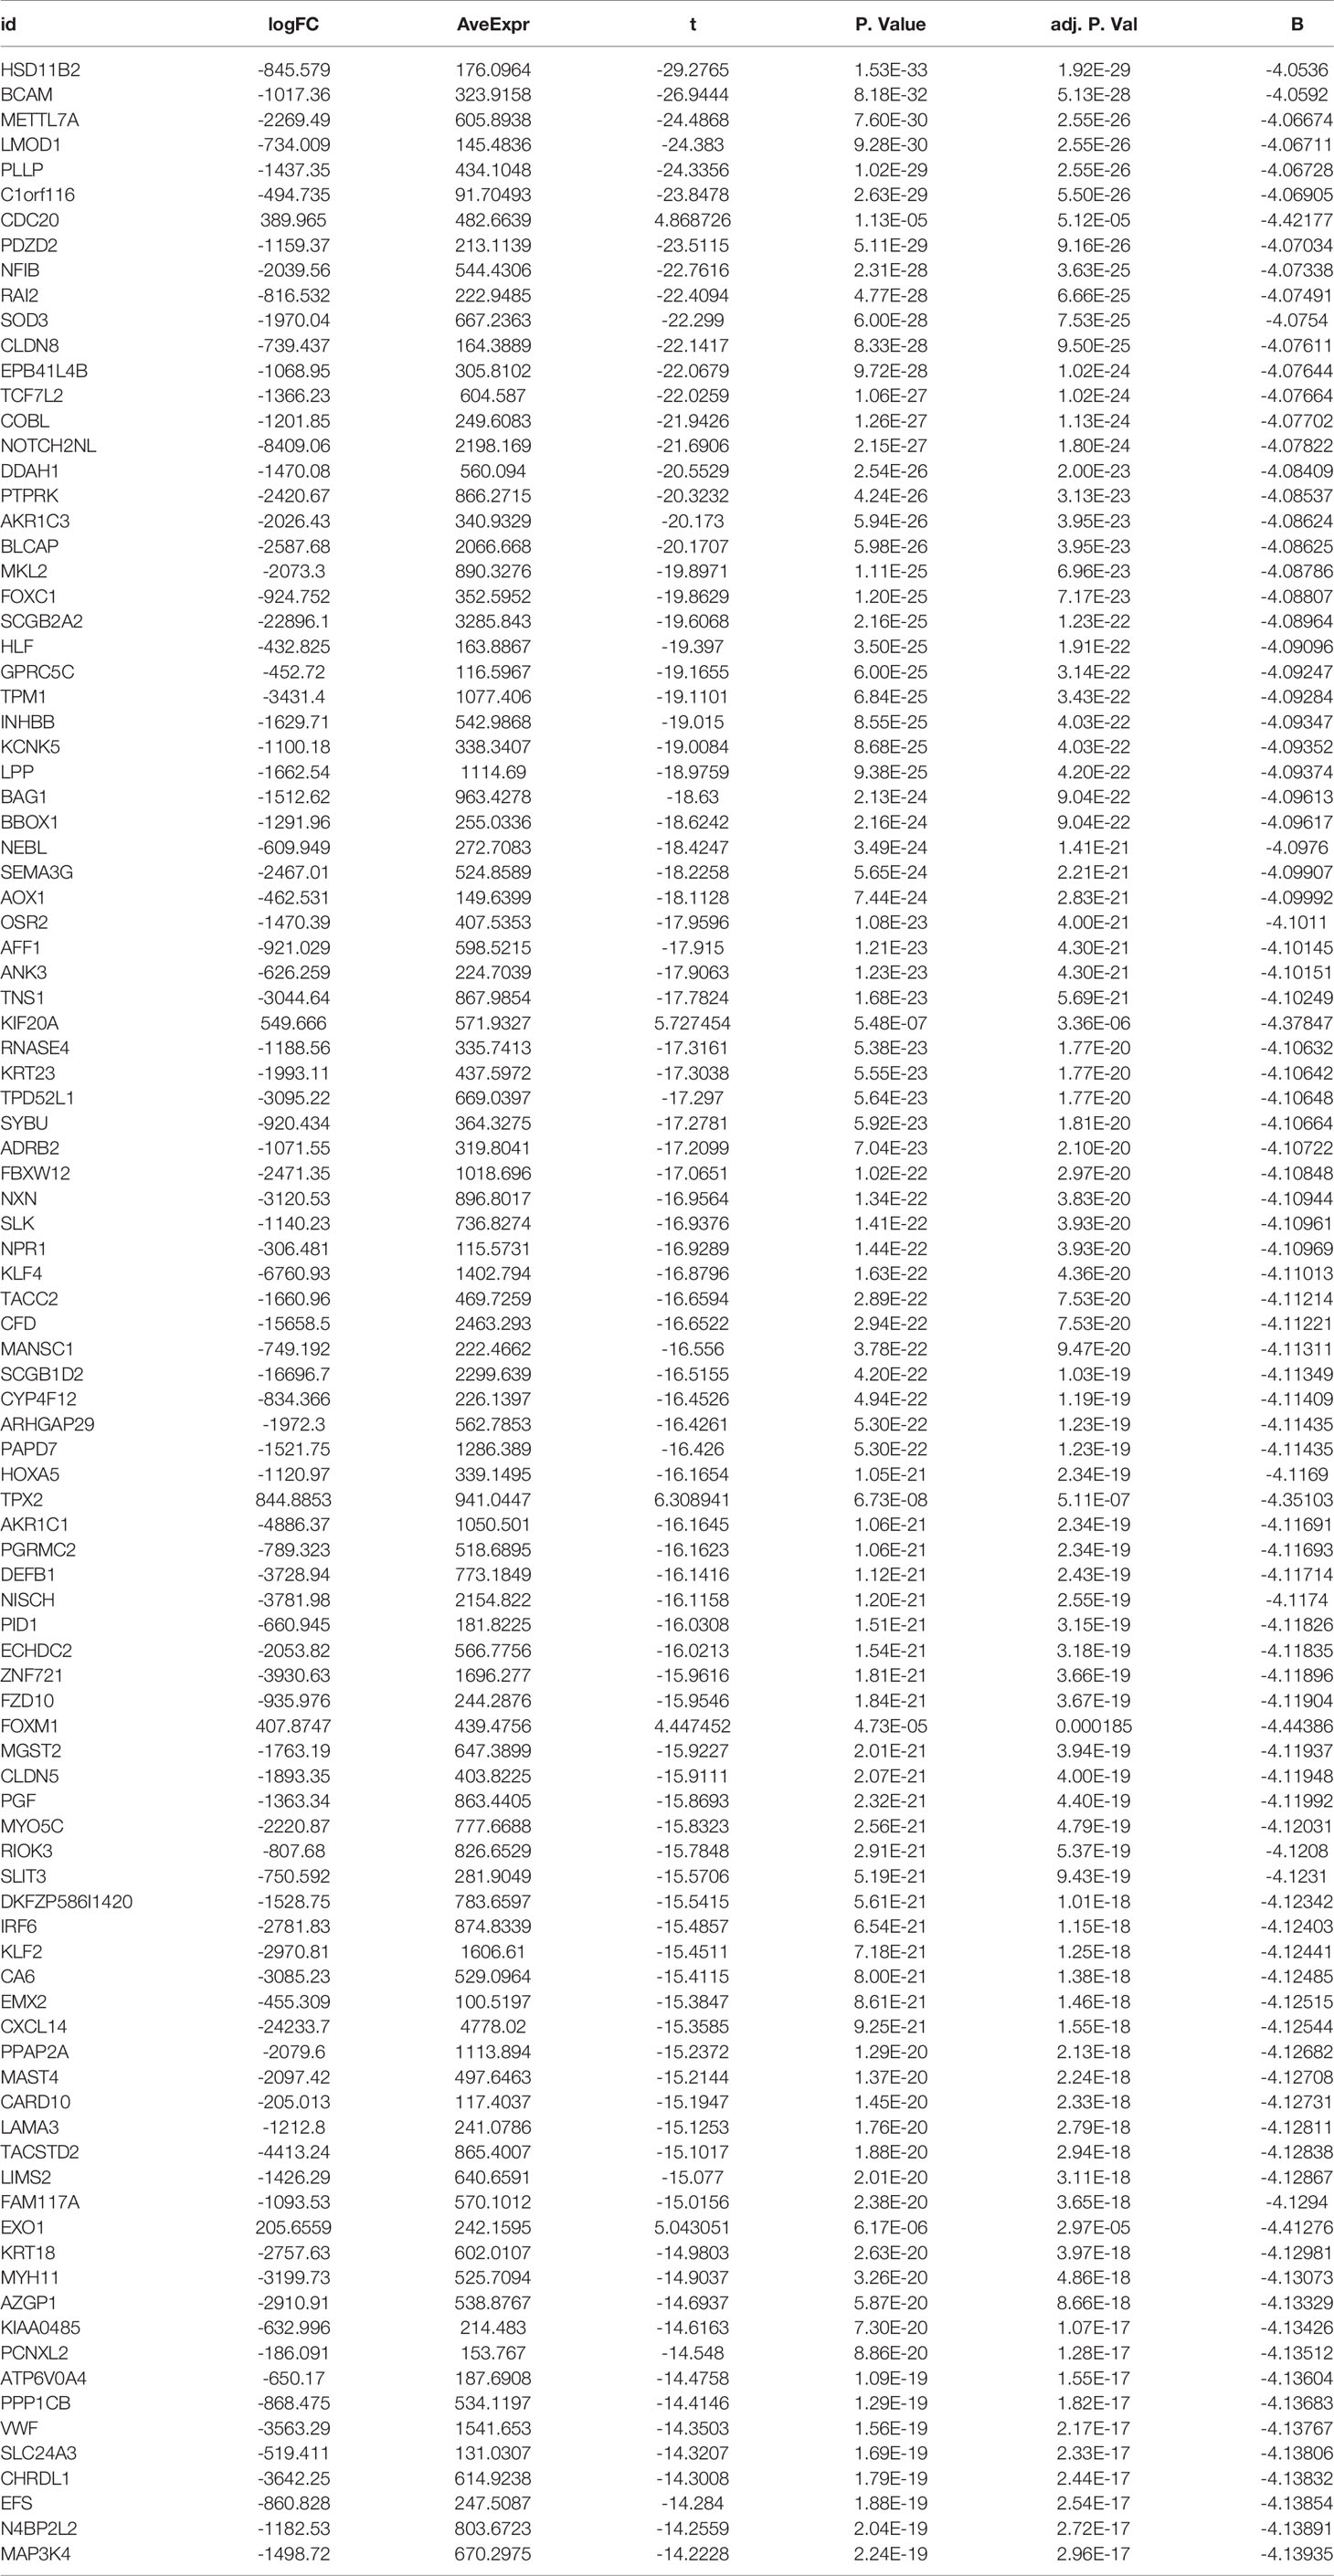
Table 1 Top 100 differentially expressed genes from UCSC Xena database differential expression analysis.
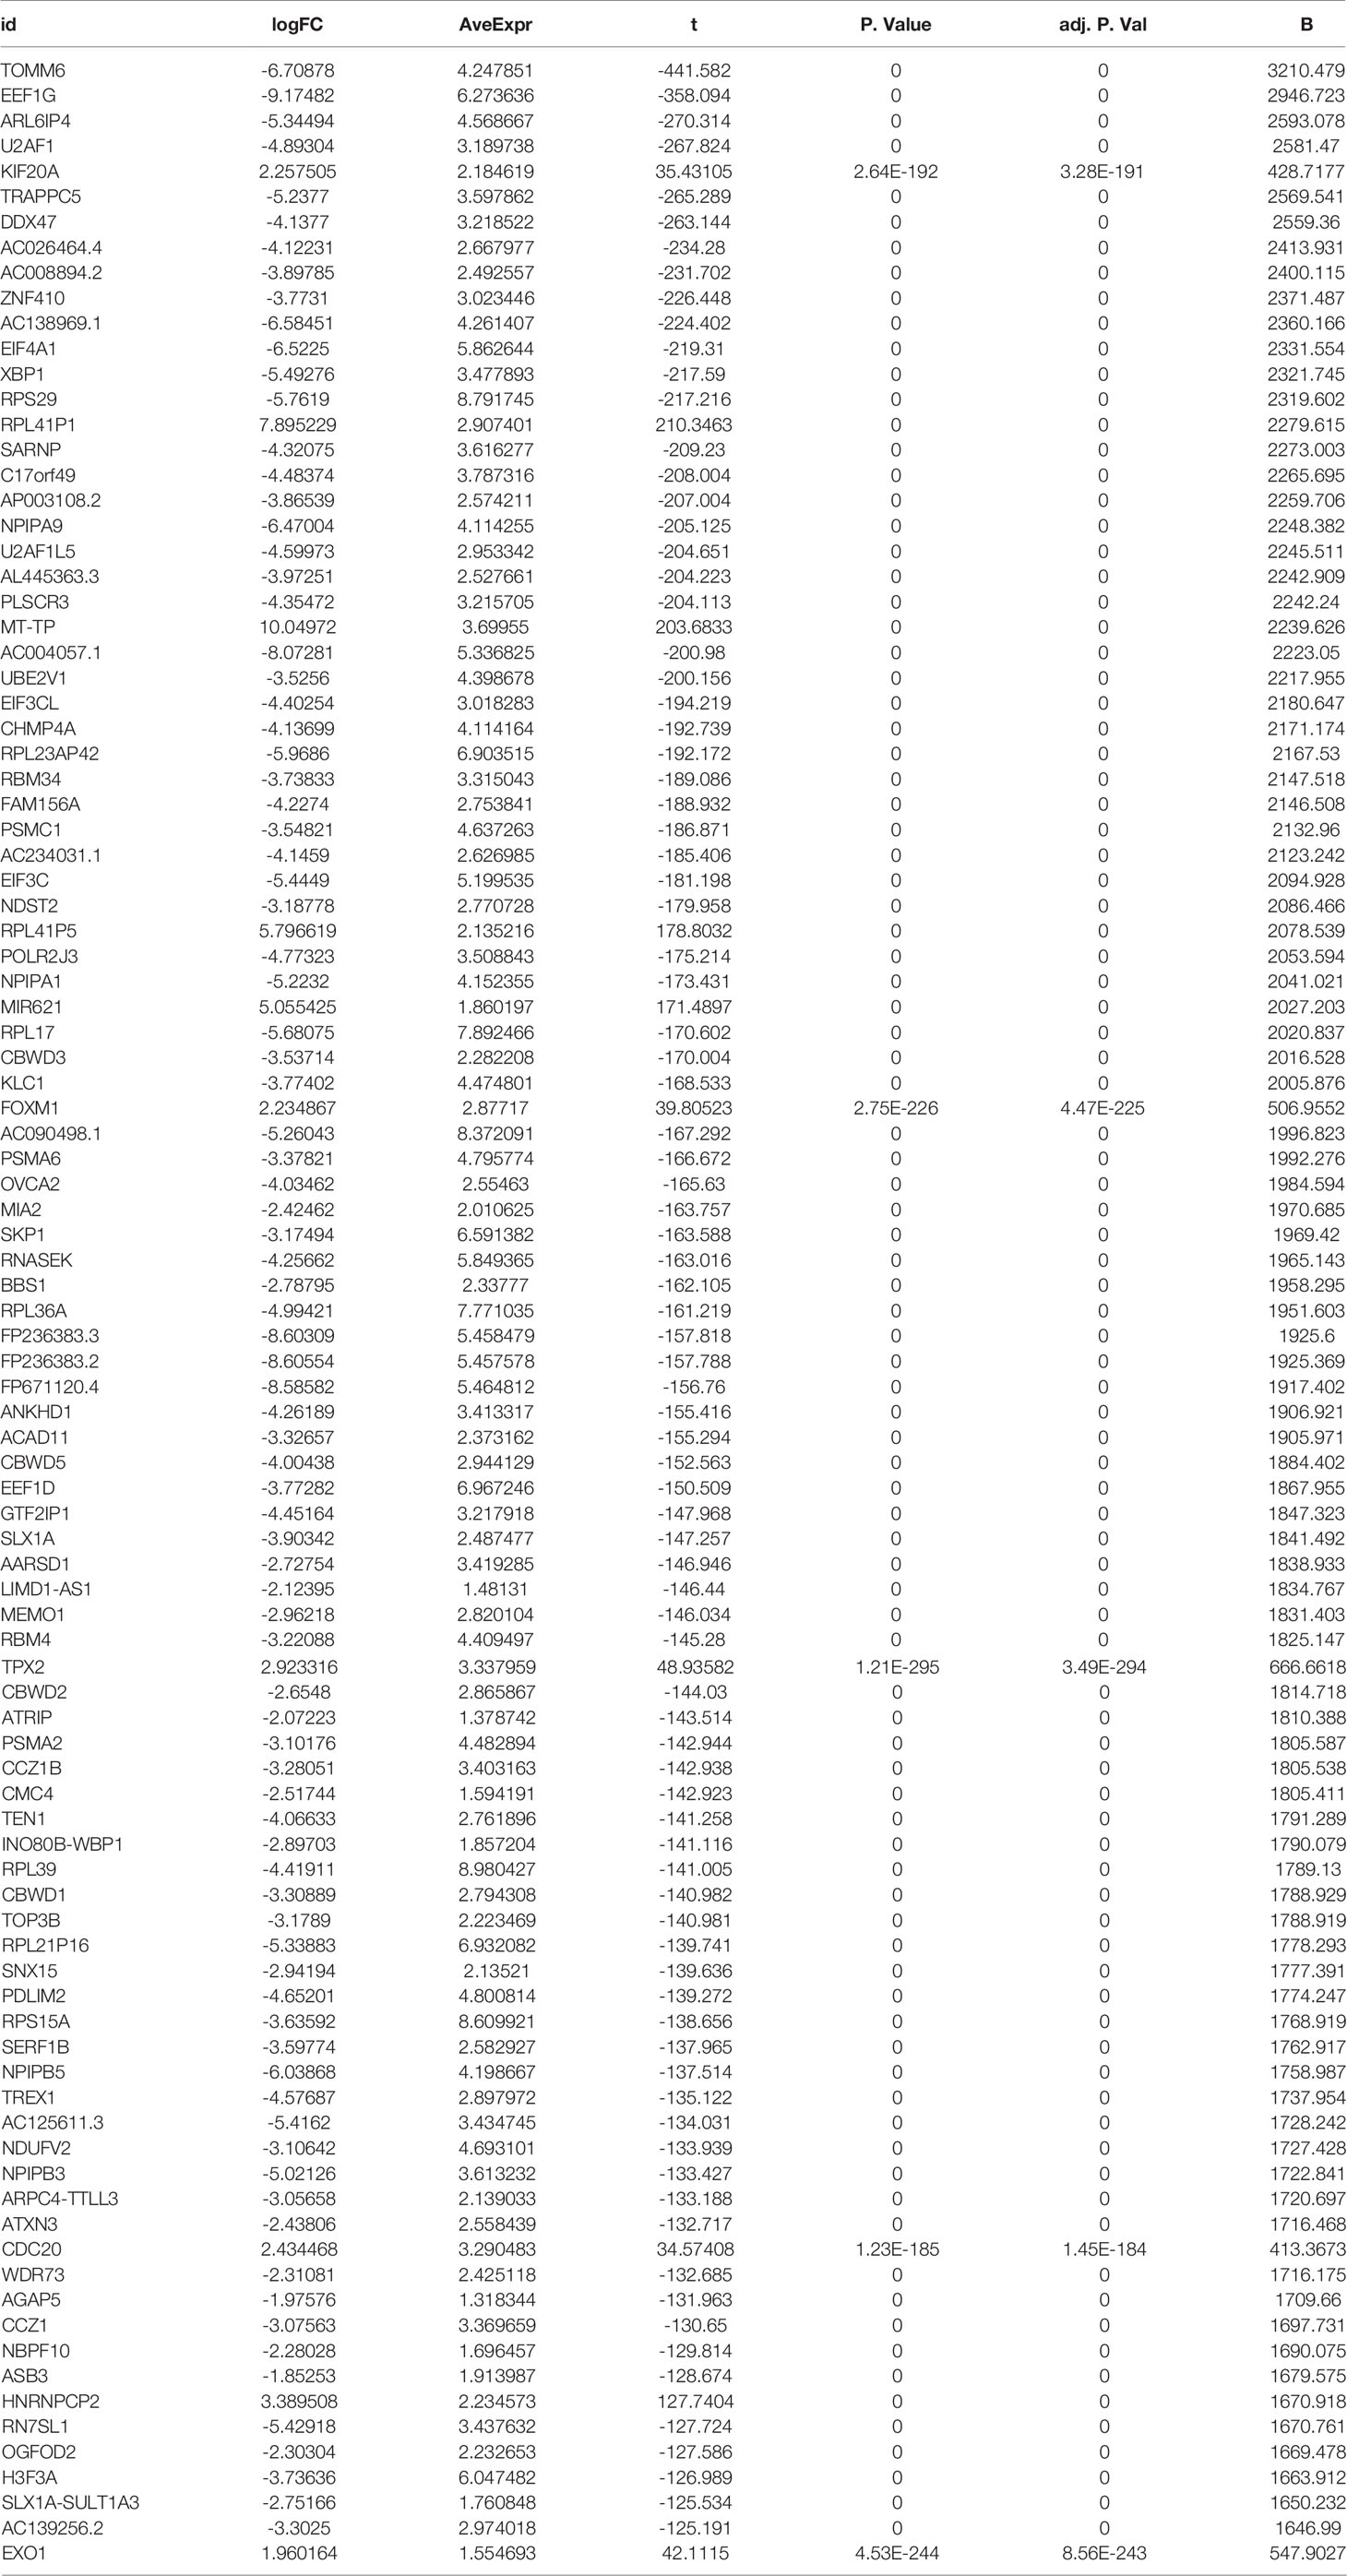
Table 2 Top 100 differentially expressed genes from GEO database differential expression analysis.
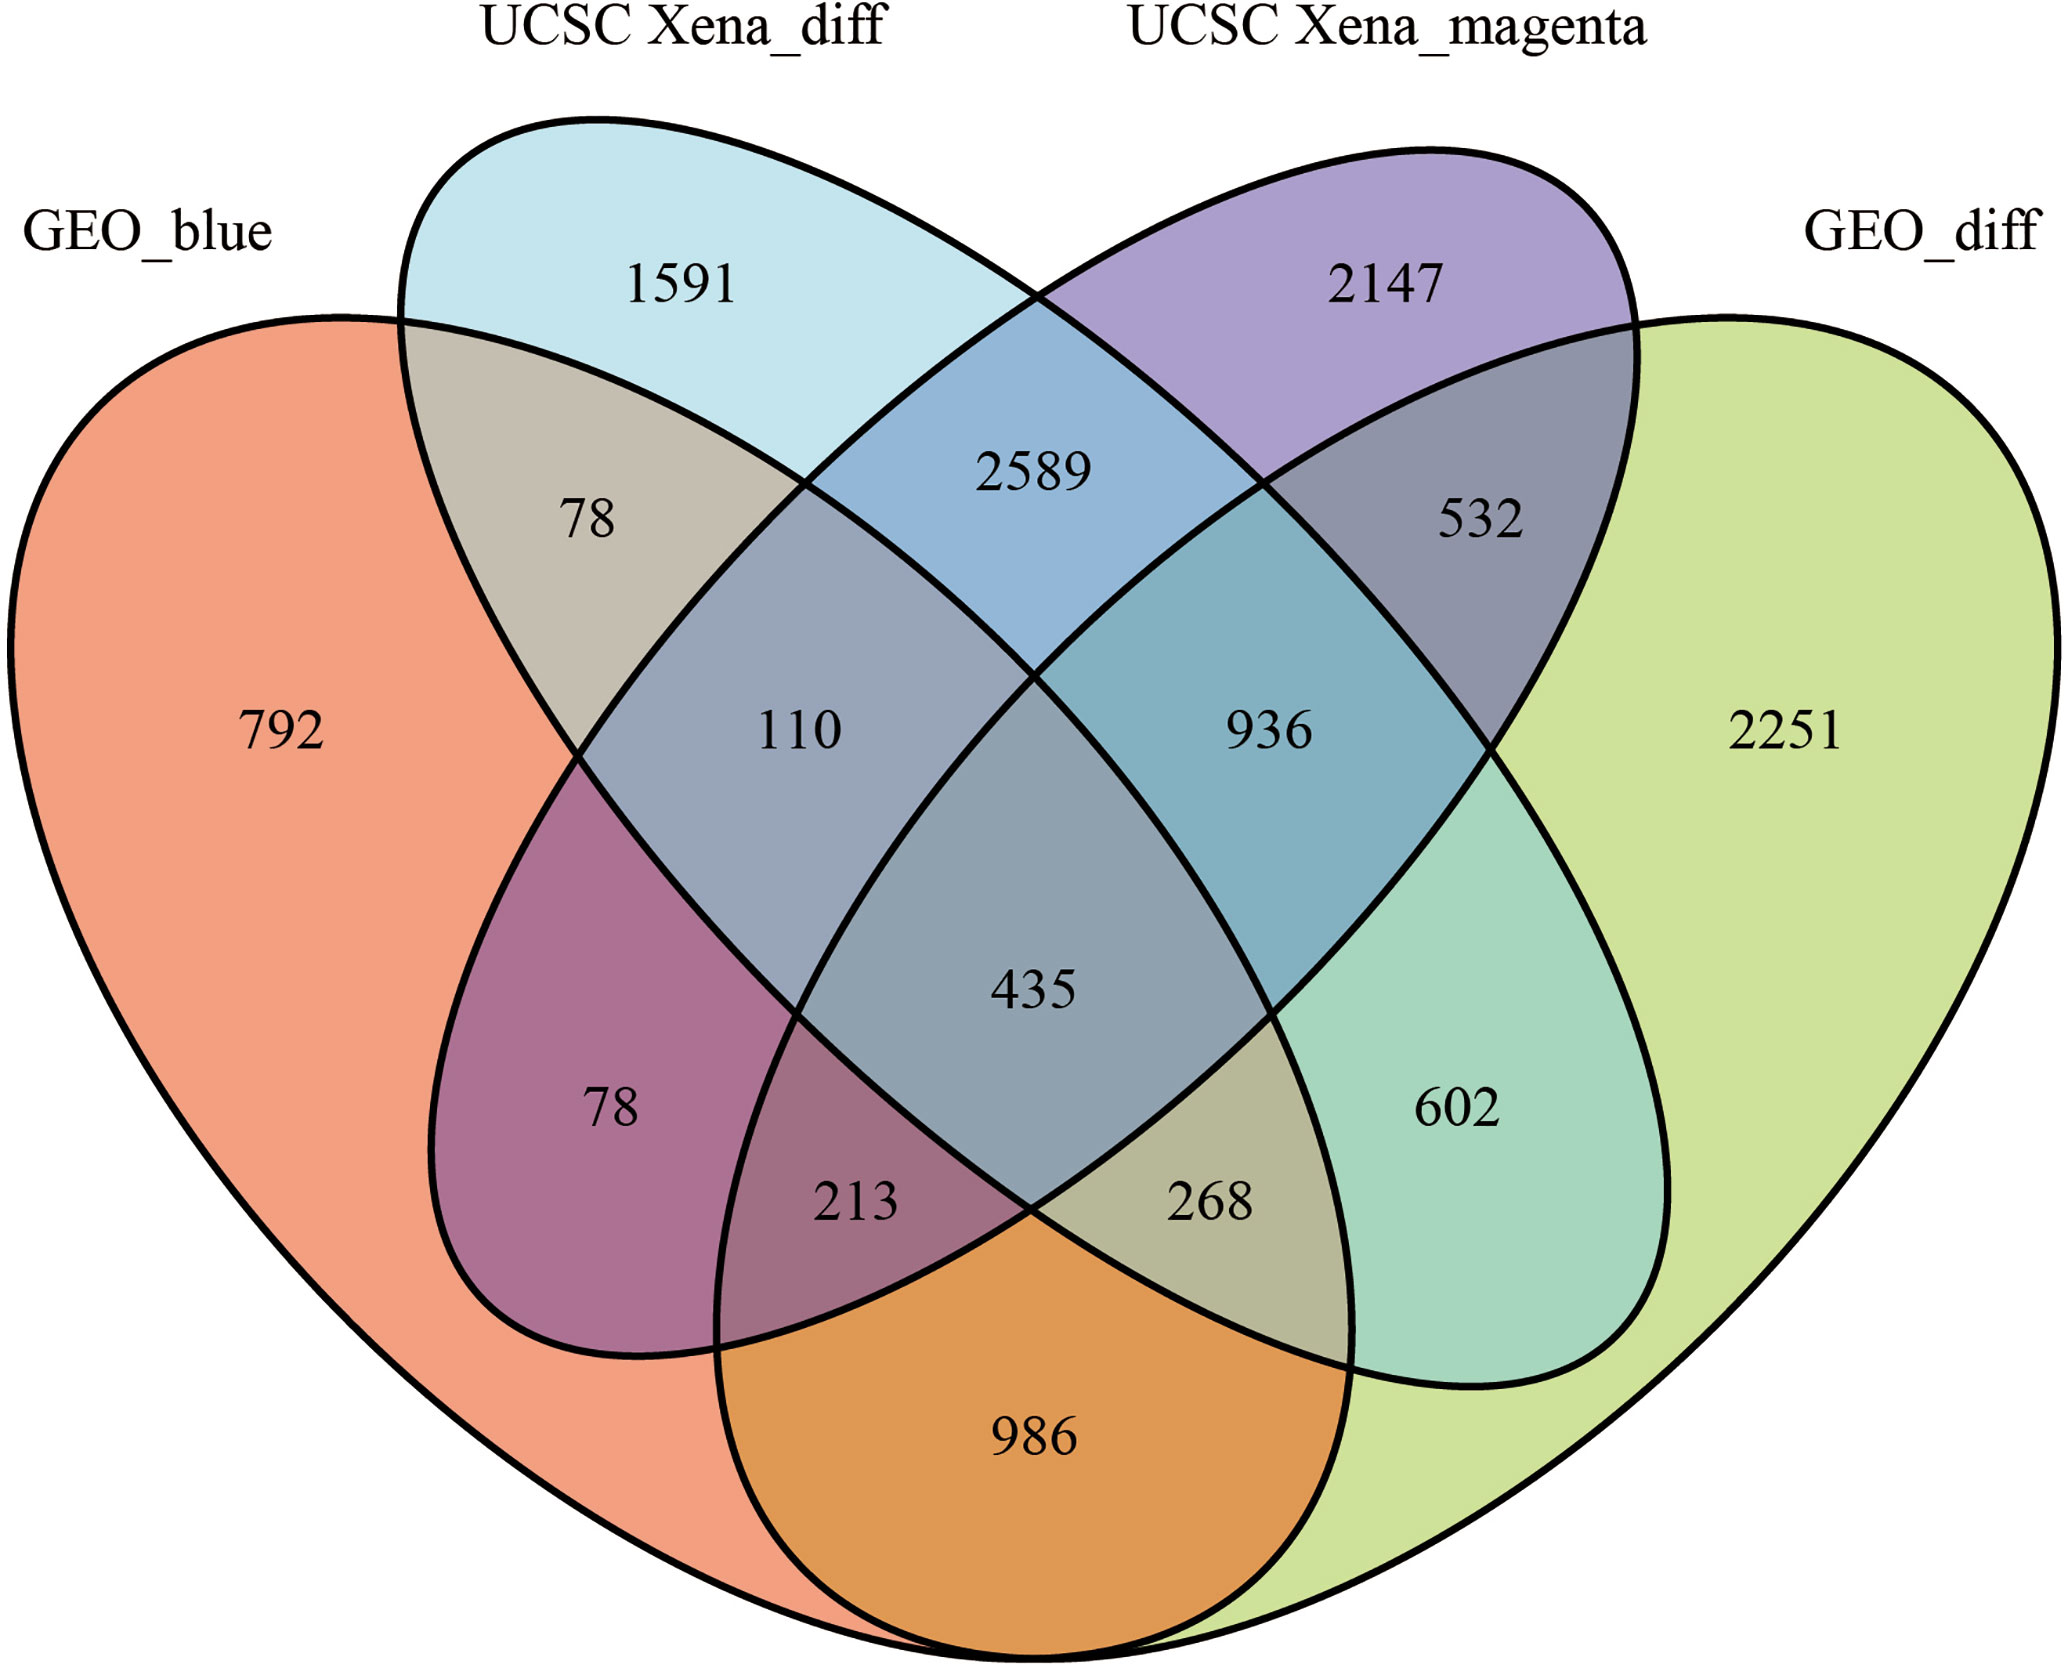
Figure 5 The veen plots between DEGs and co-expression modules. Geo_blue indicates the most significant module identified by WGCNA analysis of GSE3189; UCSC Xena_diff indicates DEGs identified by the UCSC Xena database; UCSC Xena_magenta indicates DEGs identified by WGCNA analysis The most significant modules out; GEO_diff indicates DEGs identified by GSE3189.
GO Enrichment Analysis of 435 Genes and KEGG Pathway Enrichment Analysis
We performed GO enrichment analysis, and KEGG pathway enrichment analysis further explores the 435 genes’ potential functions in the overlapping sections. We learned from the GO enrichment analysis that BP was primarily enriched in neutrophil degranulation and neutrophil activation involved in the immune response. CC was mainly enriched in vacuolar and lysosomal membranes. MF was mainly enriched in histone deacetylase binding and integrin-binding (Figure 6A). KEGG pathway enrichment analysis was mainly distributed in the melanoma, Transcriptional misregulation in cancer, and Mismatch repair pathways (Figure 6B).
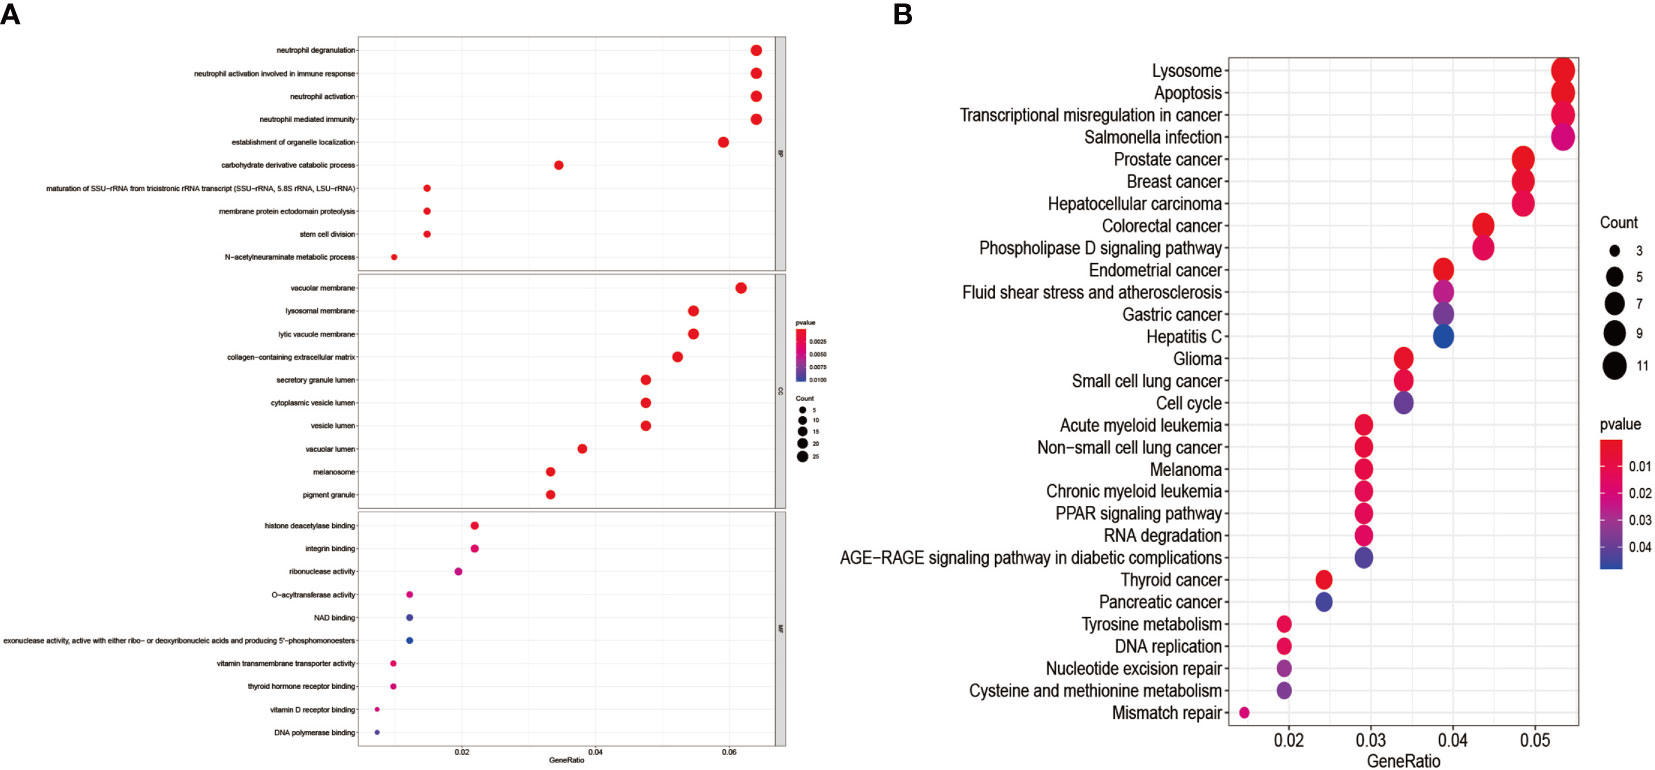
Figure 6 GO enrichment analysis and KEGG pathway enrichment analysis of DEGs. (A) shows the GO enrichment analysis of DEGs; (B) shows the DEGs’ KEGG pathway enrichment analysis.
PPI Construction and Hub Gene Identification
We imported 435 genes from the overlapping parts into the STRING online database to obtain the PPI network. Subsequently, the PPI network was imported into Cytoscape software to visualize the PPI (Figure 7A) using the MCC algorithm in the CytoHuba plugin to filter the top 10 Hub genes from the PPI network (Figure 7B). We ranked the top 10 Hub genes based on their MCC algorithm scores, which were Aurora Kinase B (AURKB), Exonuclease 1 (EXO1), Kinesin Family Member 20A (KIF20A), TPX2 Microtubule Nucleation Factor (TPX2), Assembly Factor For Spindle Microtubules(ASPM), Mitotic Arrest Deficient 2 Like 1 (MAD2L1), Forkhead Box M1(FOXM1), Cell Division Cycle 20(CDC20), Non-SMC Condensin I Complex Subunit H(NCAPH), Baculoviral IAP Repeat Containing 5(BIRC5).
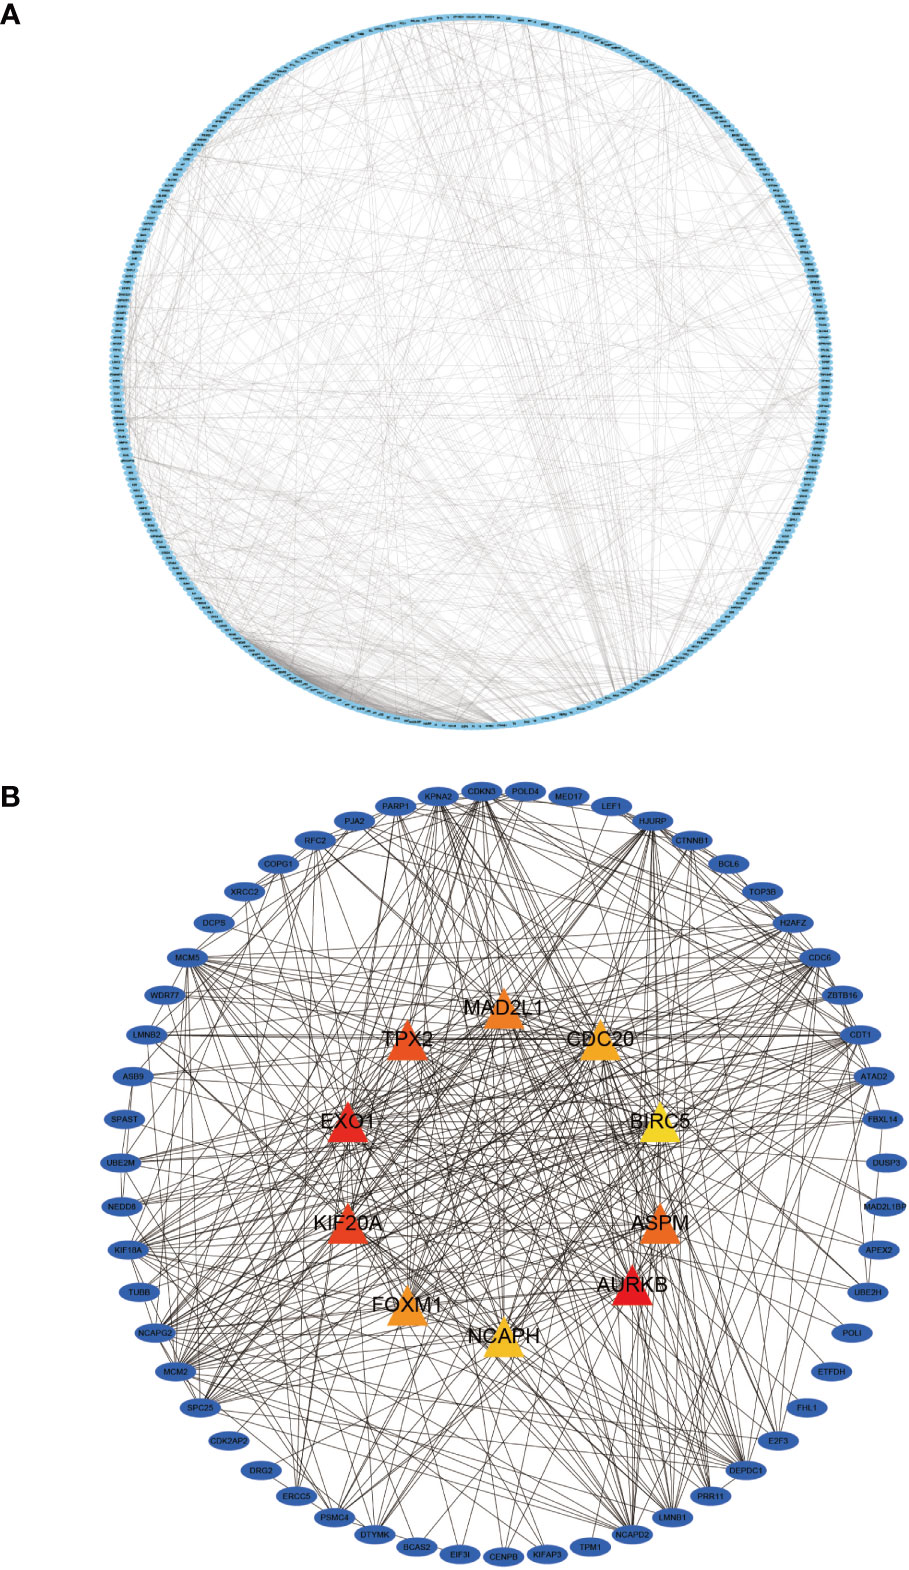
Figure 7 Protein-protein interaction (PPI) network diagram of DEGs and visualization of the Hub gene. (A) shows the PPI network diagram derived from the STRING input library; (B) shows the Hub gene identified by Cytohubba.
Prognostic Value of Hub Genes and Validation of Protein Expression
We further analyzed the top 10 Hub genes (AURKB, EXO1, KIF20A, TPX2, ASPM, MAD2L1, FOXM1, CDC20, NCAPH, BIRC5) that were screened by the CytoHubba plugin. We analyzed the relationship between the top 10 Hub genes and prognosis separately and plotted univariate survival curves for overall survival using the R package based on the Kaplan-Meier method. Kaplan-Meier analysis showed (Figure 8) that 5 of the top 10 Hub genes (FOXM1, EXO1, KIF20A, TPX2, CDC20) were significantly correlated with prognosis (p<0.01), and that the relationship between all five hub genes and the prognosis of melanoma patients was such that high expression of the gene was accompanied by low patient Prognosis. In addition, we analyzed the survival curves of the prognostic models constructed based on these five Hub genes, as shown in Figure 8K. The survival rate in the high-risk group was much lower than that in the low-risk group, and the difference was statistically significant (P-value < 0.05). We used the GEPIA2 database to predict disease-free survival for the top 10 Hub genes, and the predictions are shown in Figure 9. We divided all patients into two groups according to metastasis and primary status of the tumor. From Figure 10A, we found that the mean expression value of ASPM was significantly higher in the metastatic group than in the primary group (P-value<0.001); in Figure 10B, we found that the expression value of AURB was significantly higher in the primary group than in the metastatic group (P-value=0.003).
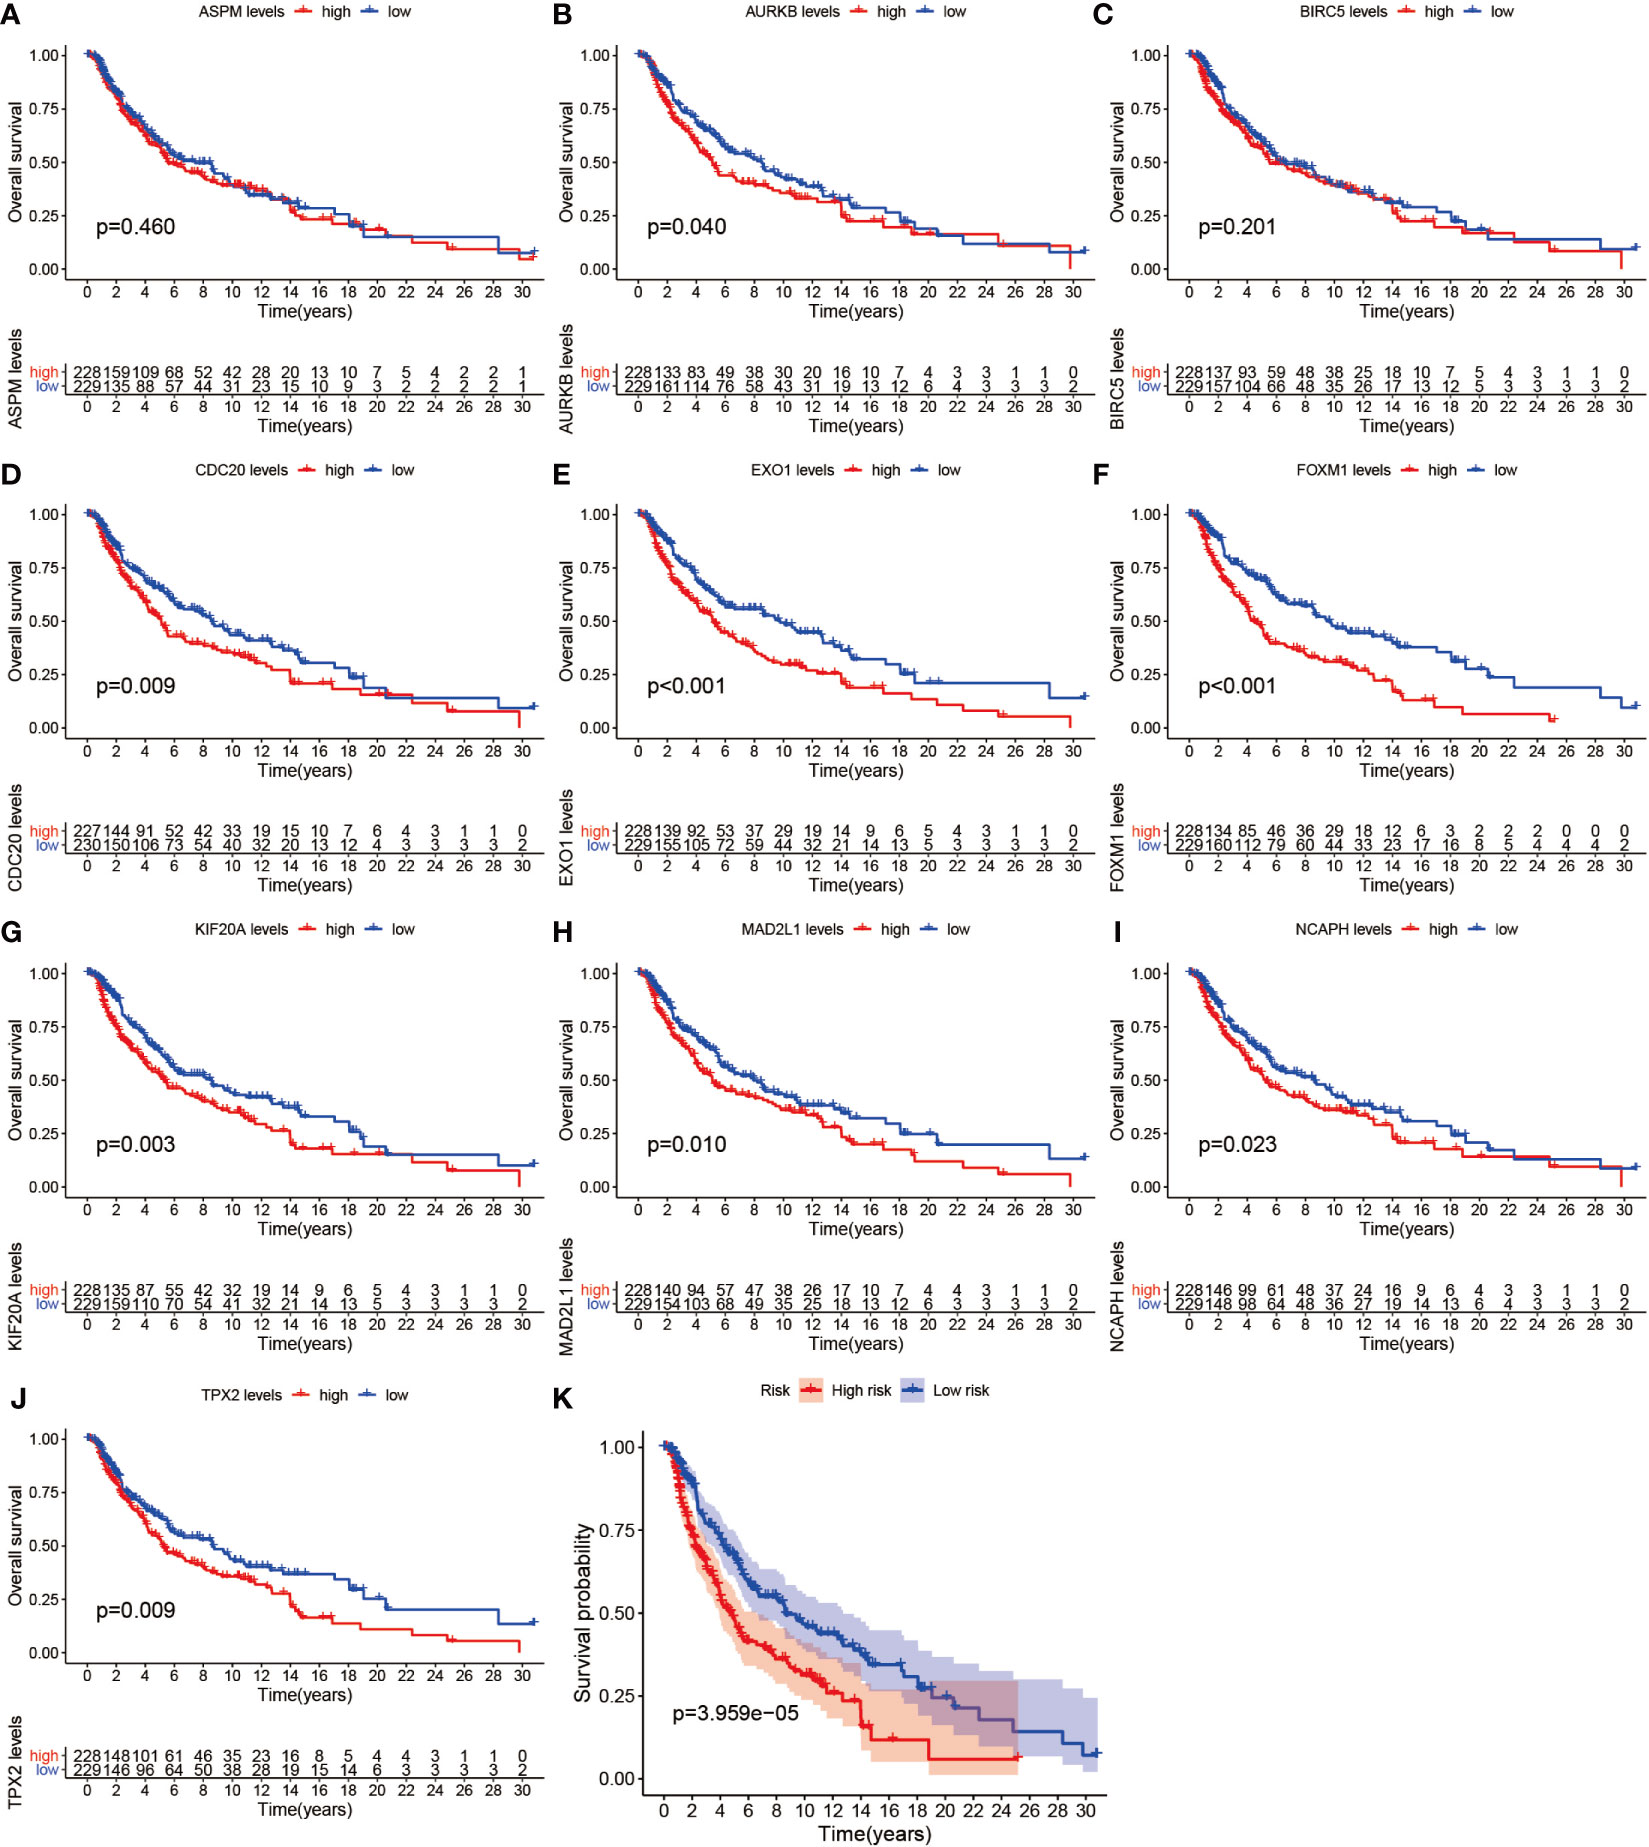
Figure 8 Survival analysis. (A–J) shows the survival curves of the first 10 Hub genes. (K) shows the survival curves for high-risk and low-risk based on the prognostic model.
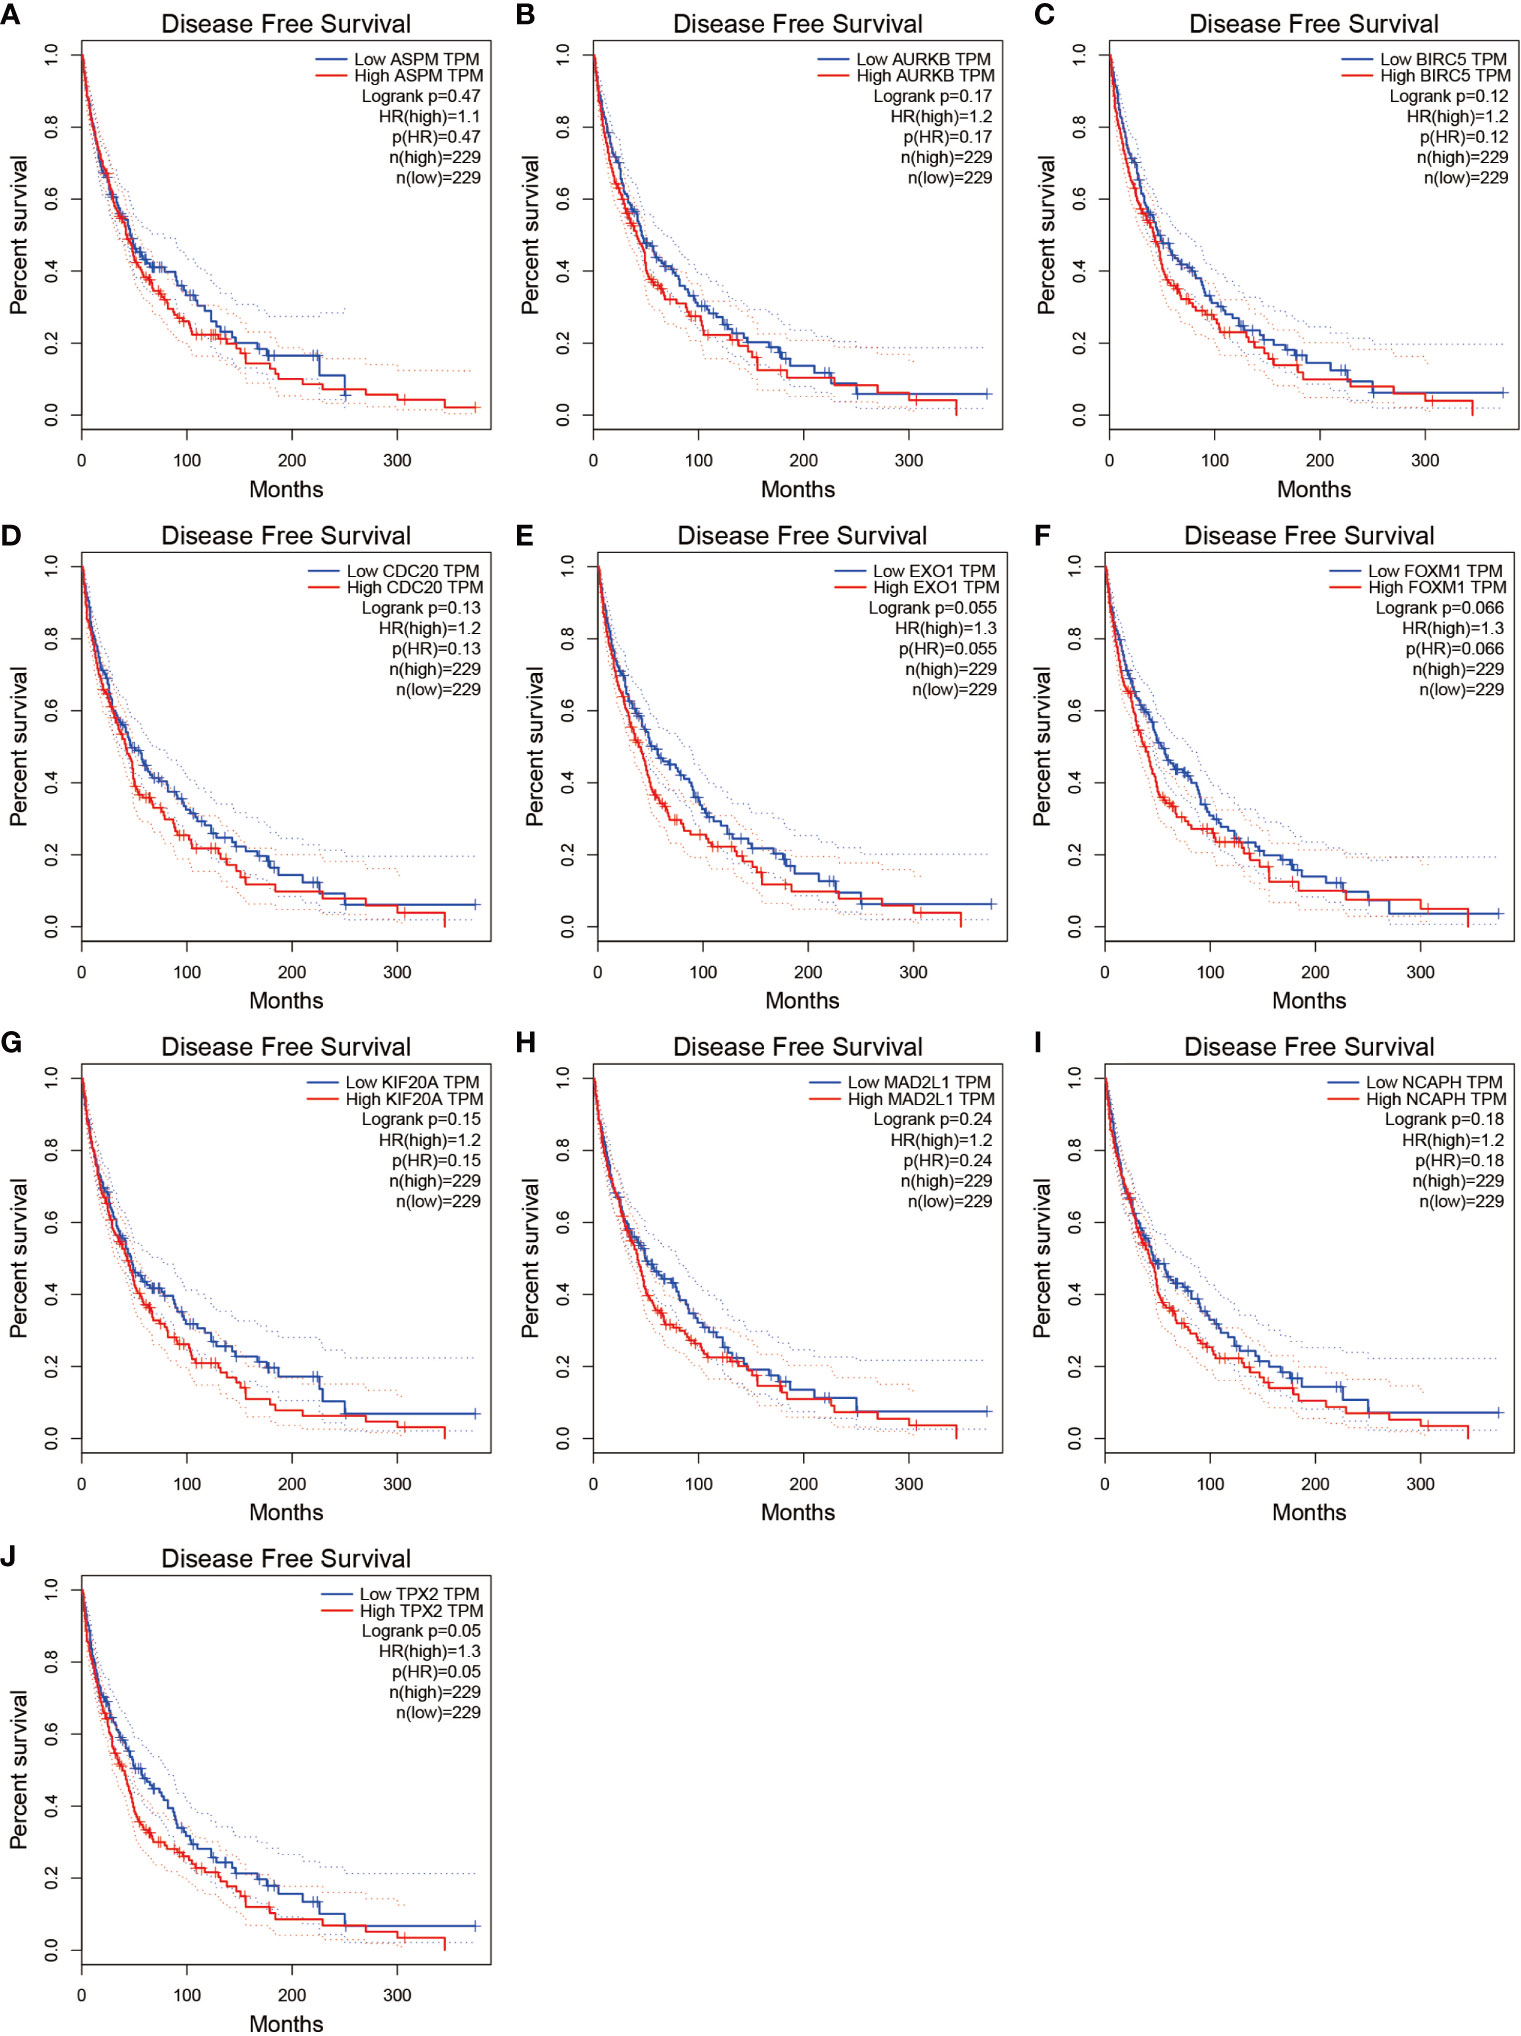
Figure 9 Disease-free survival for the top 10 Hub genes. (A–J) show the curves of disease-free survival based on the GEPIA2 database.
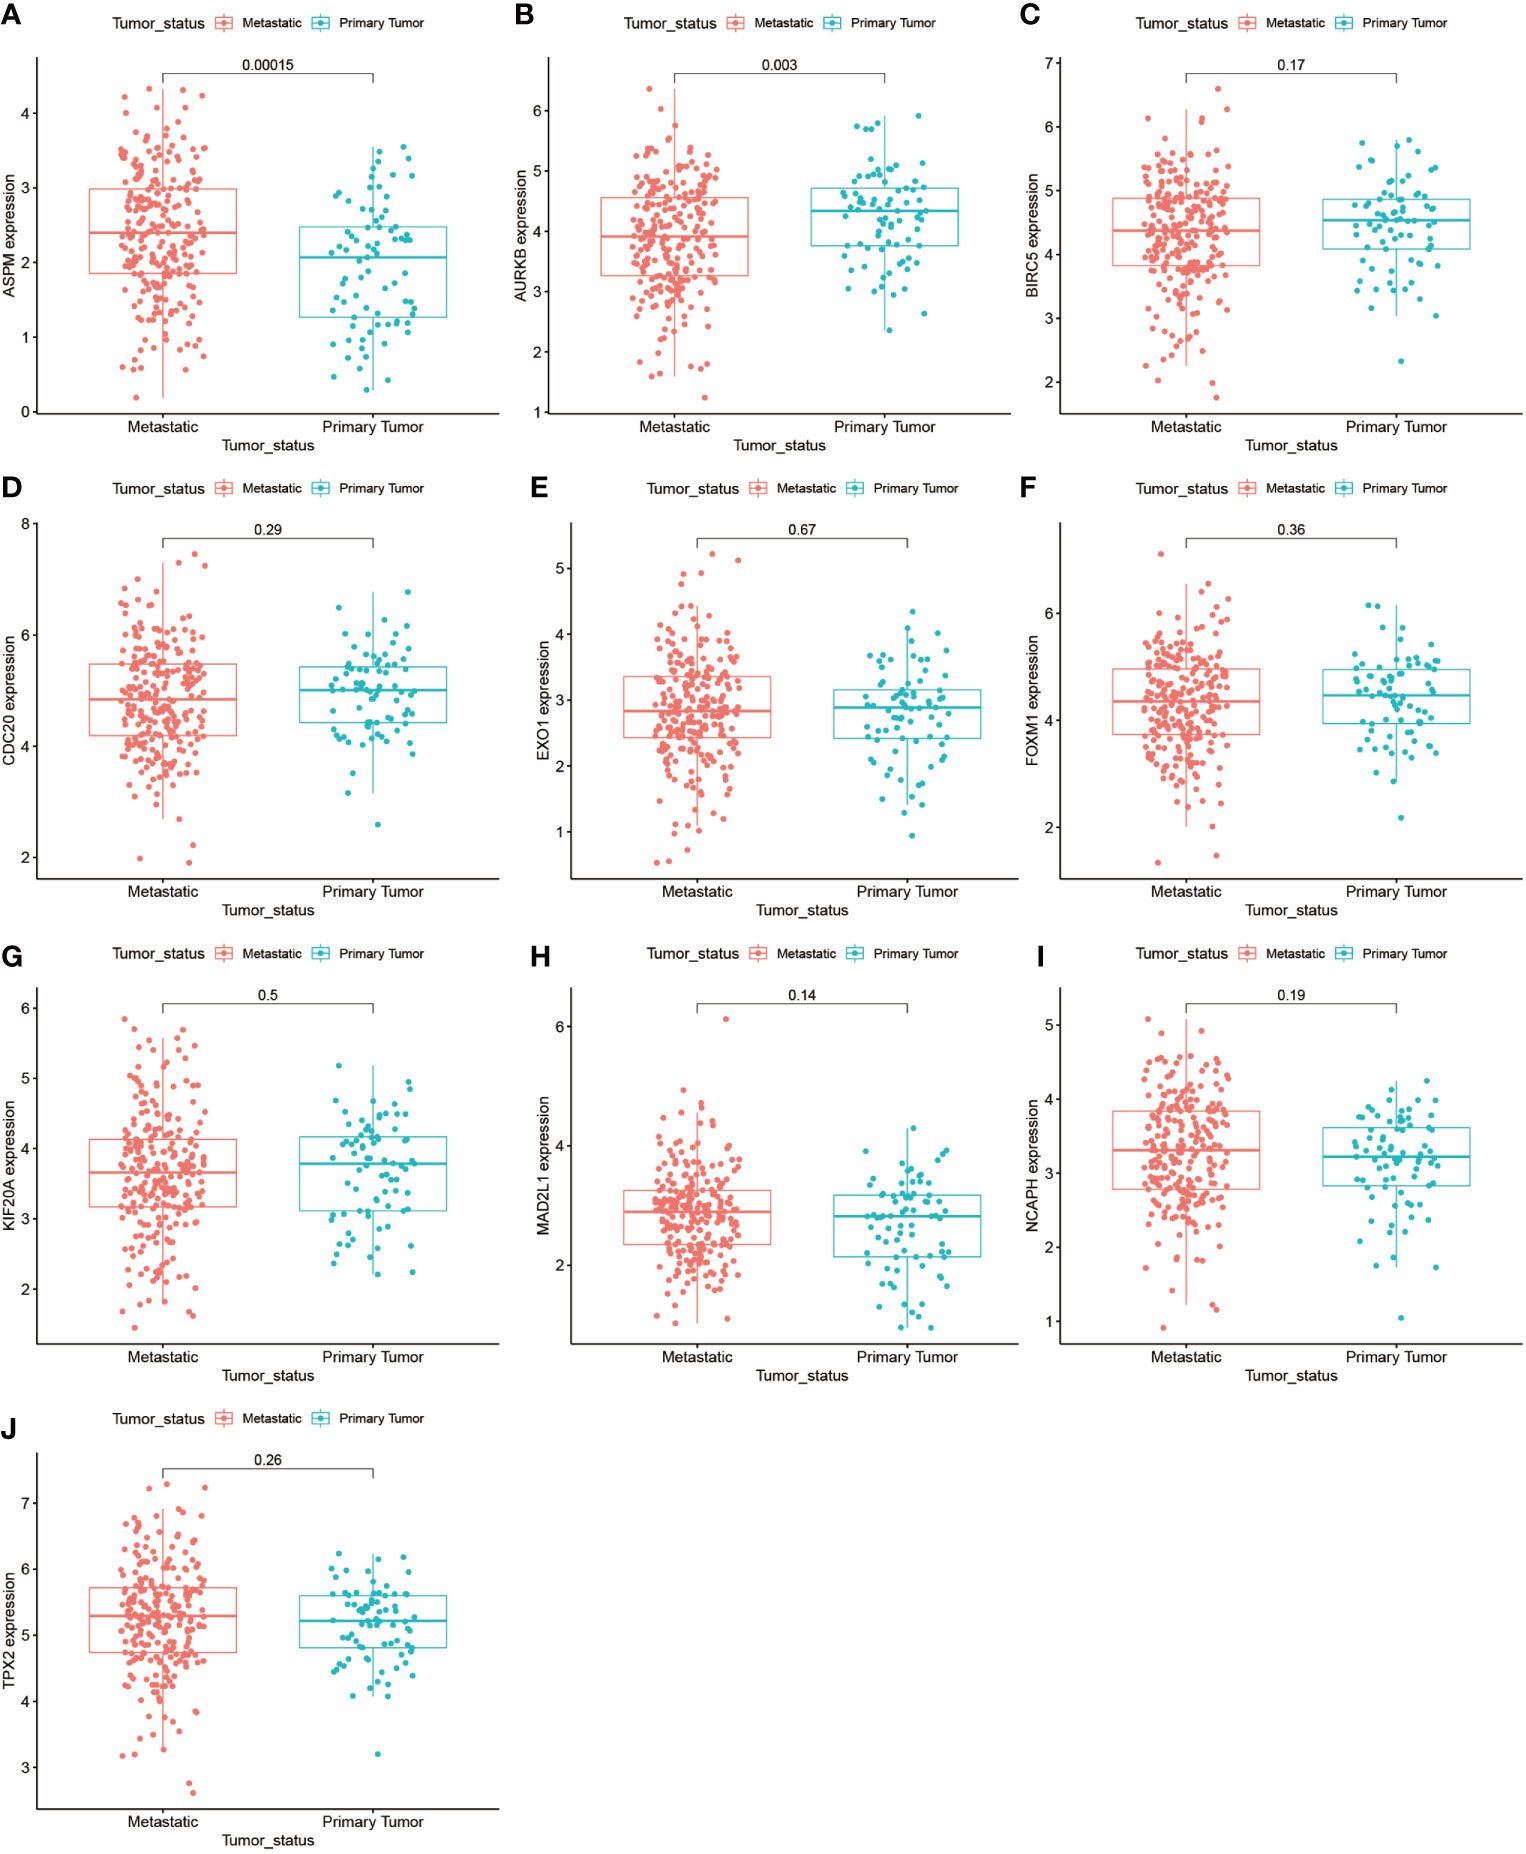
Figure 10 Gene expression of the top 10 Hub genes in the metastasis and primary tumor groups. (A–J) demonstrate the differences in gene expression of the top 10 Hub genes in the metastasis-bearing group and in the primary tumor group.
Immunohistochemistry
After a series of laboratory manipulations, we completed specific staining of all pathological tissue sections for labeled antibodies. All immunohistological images were observed under an inverted microscope and images were collected, and we compared the staining differences between melanoma specimens and paraneoplastic tissue specimens. We performed immunohistological staining analysis on a total of 60 pathological tissue sections of six pairs (melanoma tissue and normal skin tissue) for each gene, and the positive rate of each image was counted using Image J software. After IBM SPSS Statistics 25 paired sample mean t-test, finally, we visualized the statistical results using GraphPad Prism 8. After analysis of 60 immunohistochemical images, we found that these five Hub genes were significantly more abundantly expressed in melanoma than in paraneoplastic tissue. This result also further validates the accuracy and validity of our bioinformatics analysis. We selected from 60 immunohistochemical images the images with the most significant differences between these 5 Hub genes in melanoma and paracancerous tissue in Figures 11A1–M2. In addition, we counted the positive rate of immunohistological images of six pairs of pathological tissue sections for each antibody separately, and from Figures 11P–T we found that the positive rate of immunohistochemical staining for these five genes in melanoma was significantly higher than that in paraneoplastic tissue, and the difference was statistically significant.
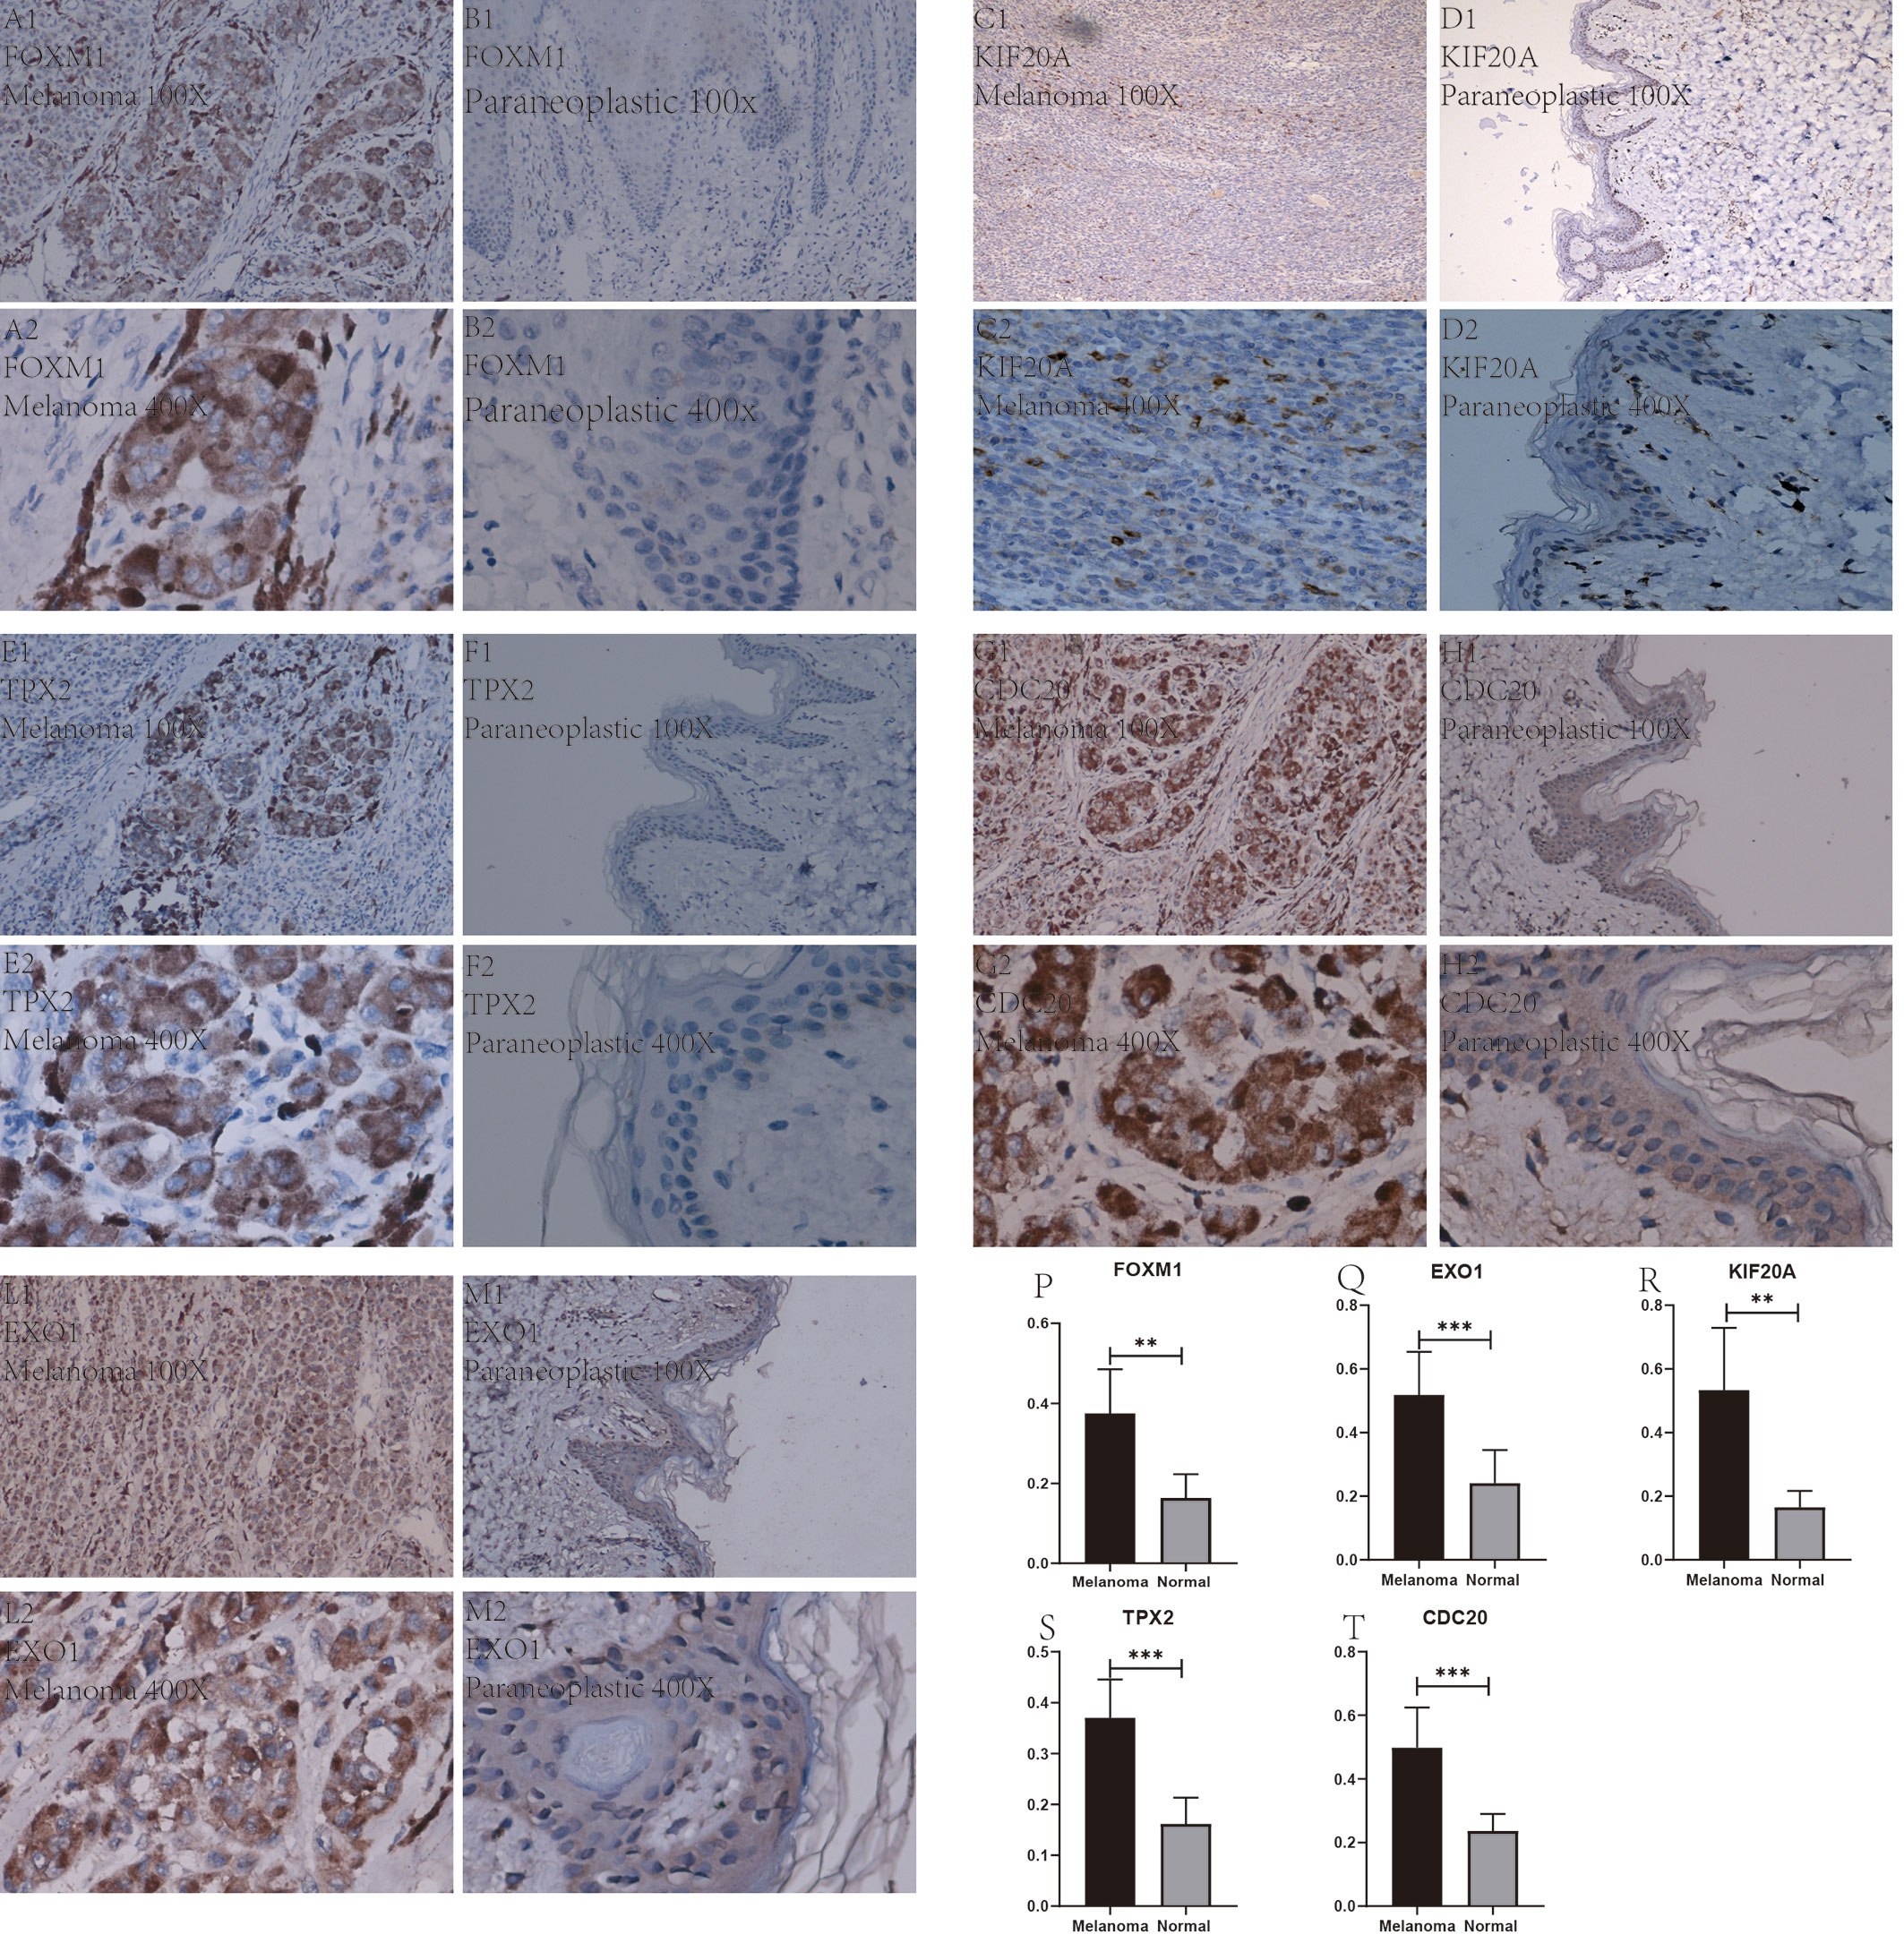
Figure 11 Immunohistochemical plots of the five Hub genes associated with prognosis and statistical analysis of the positivity rate. (A1–M2) show the protein expression of each gene in melanoma and in the paracancerous tissue. (P–T) shows the statistical analysis of the staining positivity rate for each gene in melanoma and in the paracancerous tissue. **representative P-value < 0.01, ***representative P-value < 0.001.
Discussion
Melanoma is associated with many factors, is more common in light-skinned races, and has a family history of occurrence. Although melanoma treatment has improved from before, the prognosis for melanoma patients is low due to the lack of precise molecular markers. Therefore, there is an urgent need to identify better and more accurate biomarkers to utilize in the prognosis, diagnosis, and treatment of melanoma. In our study, we used integrated bioinformatics to analyze a total of 435 critical genes with co-expression trends identified in the UCSC Xena, GTEx database, and the GSE3189 database. These genes were subjected to GO enrichment analysis based on the R package (clusterProfiler), mainly enriched in neutrophil activation involved in immune response, stem cell division, and melanosome. As early as 2011, it was noted that there might be a close relationship between neutrophil activation and cancer (20). Moreover, the relationship between the stem cell division and melanosome and cancer has also been reported in the literature (21, 22). Similarly, these genes were subjected to KEGG pathway enrichment analysis based on the R package (clusterProfiler), and the enrichment results showed that these genes were associated with various cancer pathways, including melanoma, endometrial cancer, prostate cancer, etc.; they were also enriched in transcriptional dysregulation pathways in cancer. In humans, dysregulation of genes such as cofactors and chromatin can lead to many diseases (23). These genes are even enriched in the melanoma pathway, suggesting that these genes are strongly associated with melanoma. Besides, we screened for the top 10 hub genes associated with melanoma based on how the MCC score was calculated for the CytoHubba plugin in Cytoscape. We also found that by analyzing the survival of melanoma patients corresponding to high and low expression of these genes, five of the top 10 hub genes were strongly associated with survival, and all showed that high expression of the genes was associated with a low prognosis in melanoma patients. Finally, we performed immunohistochemical analysis using the HPA database and showed that all four genes showed increased expression in melanoma tumor tissues, whereas their expression was not evident in normal tissues.
FOXM1, also known as Forkhead Box M1, is a gene that encodes a protein that is a transcriptional activator involved in cell proliferation. FOXM1 acts downstream of the PI3K-AKT pathway, the Ras-ERK pathway, the JNK/p38MAPK signaling cascade and is essential for cell proliferation, differentiation, senescence, DNA damage and repair, and control of the cell cycle (24). It has also been reported that FOXM1 was overexpressed in a variety of human cancers and that the oncogenic potential of this gene is based on its ability to reactivate target genes involved in different stages of cancer development (25). It has been shown that the positive feedback of FOXM1 promotes the growth and invasion of gastric cancer and that FOXM1 promotes gastric cancer progression by interacting with PVT1 (26). FOXM1 has also been reported in non-serious epithelial ovarian carcinoma: FOXM1 was upregulated in all epithelial ovarian cancers (27). It has also been shown that the FOXM1-PSMB4 axis can play a catalytic role in the proliferation and development of cervical cancer (28). More surprisingly, FOXM1 plays a vital role in many other cancers (29–32). In our study, FOXM1 was upregulated in tumor tissues compared to normal tissues, suggesting a significant correlation with melanoma. Previous studies have shown that higher levels of FOXM1 in tumor tissues have been strongly associated with low prognosis in melanoma patients, consistent with our study (33–35). Kinesin Family Member 20A (KIF20A) is also a protein-encoding gene, and what is known about the diseases associated with this gene is mainly familial restriction Familial Isolated Restrictive Cardiomyopathy and Charcot- Marie-Tooth Disease, Type 4C. Research has also been conducted on the role of this gene in cancer. It has been reported that patients with bladder cancer with high expression of KIF20A have poorer tumor stages and that KIF20A promotes metastasis and proliferation of bladder cancer cells (36). Also, it has been shown that skin tumor thickness in KIF20A-positive patients with primary melanoma is significantly greater than skin tumor thickness in patients negative for this gene and that KIF20A-positive patients are more likely to relapse earlier (37). It is well known that while tumor recurrence has a very significant relationship with patient prognosis, this indirectly suggests that KIF20A is associated with survival in melanoma patients, which is consistent with the results of our study. The TPX2 Microtubule Nucleation Factor (TPX2) is a protein-coding gene. The main diseases known to be associated with the TPX2 gene include Capillary Leak Syndrome and Colorectal Cancer. It has been shown that activation of TPX2 expression increases the invasion and proliferation of cervical cancer, promoting cancer development (38). A study of TPX2 in esophageal cancer showed that the 5-year survival rate of esophageal cancer patients with concomitant high TPX2 expression levels was significantly lower than that of esophageal cancer patients with low TPX2 expression levels (39). Interestingly, in our study, patients with high TPX2 expression of melanoma had a relatively shorter overall survival than patients with low expression. Cell Division Cycle 20 (CDC20) is also a protein-coding gene. The main diseases known to be associated with this gene are Ceroid Lipofuscinosis, Neuronal, 2. Back in 2015, there were reports that CDC20 could be used as a novel cancer treatment modality (40). In hepatocellular carcinoma, the upregulation of CDC20 expression predicted a decline in overall survival and disease-free survival (41). Exonuclease 1 (EXO1) is a protein-coding gene. Diseases associated with EXO1 include Werner’s syndrome and Aicardi-Goutieres syndrome. In a recent article on the regulation of bladder cancer cells by phospholipase C-ϵ through EXO1, the authors noted that gene expression of EXO1 was significantly higher in 72 bladder cancer tissue specimens than in 24 adjacent paracancerous tissue samples (42). These five genes have been well-reported in other cancers, and there is not enough evidence to confirm their role in melanoma. In summary, the expression of the five hub genes we studied were all strongly associated with cancer, and in our study, high levels of expression of these genes were accompanied by shorter survival times for melanoma patients.
Our study combines the WGCNA approach with the DEGs approach through bioinformatics, searching for Hub genes through CytoHubba, a Cytoscape plugin, performing GO enrichment analysis and KEGG pathway analysis of the resulting intersection genes, as well as gene expression of different genes in the metastatic and primary tumor groups, and for the top 10 hub genes Survival analysis and prediction of disease-free survival with the GEPIA database were performed. Finally, the accuracy of our analysis was validated by immunohistochemistry experiments. The protein expression of FOXM1, KIF20A, TPX2, CDC20, and EXO1 was higher in melanoma than in paraneoplastic tissues, consistent with our analysis results. Our study, like others, has limitations regarding the different tumor types. Although we identified potential prognostic genes between melanoma and normal tissue using three different sources of databases with two different bioinformatics analyses, it was less accurate for each of the different subtypes of melanoma patients. Besides, this study should have done more adequate experiments to verify the role of the genes derived from our analysis in melanoma.
In conclusion, by combining the WGCNA analysis method with differentially expressed gene analysis, our study identified the genes FOXM1, KIF20A, TPX2, CDC20, and EXO1 highly correlated with survival melanoma patients and have the potential to serve as a prognostic biomarker in melanoma. Finally, we verified the accuracy and feasibility of our analysis results through immunohistochemistry experiments.
Conclusion
FOXM1, KIF20A, TPX2, CDC20, and EXO1 are hub genes of melanoma prognostic, and their high expression is strongly associated with low prognosis in melanoma patients. FOXM1, KIF20A, TPX2, CDC20, and EXO1 could be used as biomarkers for melanoma diagnosis, treatment, and prognosis prediction.
Data Availability Statement
The original contributions presented in the study are included in the article/supplementary material. Further inquiries can be directed to the corresponding author.
Ethics Statement
The studies involving human participants were reviewed and approved by Ethical Review Committee of the First Clinical Affiliated Hospital of Guangxi Medical University. Written informed consent for participation was not required for this study in accordance with the national legislation and the institutional requirements.
Author Contributions
JJ, CL, and XZ designed the study. GX, TL, SL, and CY analyzed the data. ZZ, ZL, ZW, JC, TC, and HL visualized the figures. JJ wrote and revised the manuscript. CL and XZ revised the manuscript. All co-authors participated in the laboratory operations. All authors contributed to the article and approved the submitted version.
Funding
This study was supported by the Youth Science Foundation of Guangxi Medical University, Grant/Award Numbers: GXMUYFY201712; Guangxi Young and Middle-aged Teacher’s Basic Ability Promoting Project, Grant/Award Number: 2019KY0119; and National Natural Science Foundation of China, Grant/Award Numbers: 81560359, 81860393.
Conflict of Interest
The authors declare that the research was conducted in the absence of any commercial or financial relationships that could be construed as a potential conflict of interest.
Acknowledgments
We thank all the people who contributed to this study.
Abbreviations
WGCNA, Weighted gene co-expression network analysis; DEGs, Differentially expressed genes; PPI, protein-protein functional interaction network; GO, Gene Ontology; CC, Cellular component; BP, Biological process; MF, Molecular function; OS, overall survival.
References
1. Rastrelli M, Tropea S, Rossi CR, Alaibac M. Melanoma: epidemiology, risk factors, pathogenesis, diagnosis and classification In Vivo. In Vivo (2014) 28:1005–11.
2. Pavri SN, Clune J, Ariyan S, Narayan D. Malignant Melanoma: Beyond the Basics. Plast Reconstr Surg (2016) 138:330e–40e. doi: 10.1097/PRS.0000000000002367
3. Hanson J, Demer A, Liszewski W, Foman N, Maher I. Improved overall survival of melanoma of the head and neck treated with Mohs micrographic surgery versus wide local excision. J Am Acad Dermatol (2020) 82(1):149–55. doi: 10.1016/j.jaad.2019.08.059
4. Best MG, Wesseling P, Wurdinger T. Tumor-Educated Platelets as a Noninvasive Biomarker Source for Cancer Detection and Progression Monitoring. Cancer Res (2018) 78:3407–12. doi: 10.1158/0008-5472.CAN-18-0887
5. Chu H-W, Chang K-P, Hsu C-W, Chang IY-F, Liu H-P, Chen Y-T, et al. Identification of Salivary Biomarkers for Oral Cancer Detection with Untargeted and Targeted Quantitative Proteomics Approaches. Mol Cell Proteomics (2019) 18:1796–806. doi: 10.1074/mcp.RA119.001530
6. Shan C, Zhang Y, Hao X, Gao J, Chen X, Wang K. Biogenesis, functions and clinical significance of circRNAs in gastric cancer. Mol Cancer (2019) 18:136. doi: 10.1186/s12943-019-1069-0
7. Langfelder P, Horvath S. WGCNA: an R package for weighted correlation network analysis. BMC Bioinf (2008) 9:559. doi: 10.1186/1471-2105-9-559
8. Unfried JP, Serrano G, Suárez B, Sangro P, Ferretti V, Prior C, et al. Identification of Coding and Long Noncoding RNAs Differentially Expressed in Tumors and Preferentially Expressed in Healthy Tissues. Cancer Res (2019) 79(20):5167–80. doi: 10.1158/0008-5472.CAN-19-0400
9. Ma Q, Xu Y, Liao H, et al. Identification and validation of key genes associated with non-small-cell lung cancer. J Cell Physiol (2019) 234:22742–52. doi: 10.1002/jcp.28839
10. Grossi E, Raimondi I, Goñi E, González J, Marchese FP, Chapaprieta V, et al. A lncRNA-SWI/SNF complex crosstalk controls transcriptional activation at specific promoter regions. Nat Commun (2020) 11(1):936. doi: 10.1038/s41467-020-14623-3
11. San Segundo-Val I, . Sanz-Lozano CS. Introduction to the Gene Expression Analysis Methods. Mol Biol (2016) 1434:29–43. doi: 10.1007/978-1-4939-3652-6_3
12. Talantov D, Mazumder A, . Yu JX, Briggs T, Jiang Y, Backus J, et al. Novel genes associated with malignant melanoma but not benign melanocytic lesions. Clin Cancer Res (2005) 11:7234–42. doi: 10.1158/1078-0432.CCR-05-0683
13. Ritchie ME, Phipson B, Wu Di, Hu Y, . Law CW, Shi W, et al. limma powers differential expression analyses for RNA-sequencing and microarray studies. Nucleic Acids Res (2015) 43:e47. doi: 10.1093/nar/gkv007
14. Chen H, . Boutros PC. VennDiagram: a package for the generation of highly-customizable Venn and Euler diagrams in R BMC. bioinformatics (2011) 12:35. doi: 10.1186/1471-2105-12-35
15. Gaudet P, Dessimoz C. Gene Ontology: Pitfalls, Biases, and Remedies. Methods Mol Biol (2017) 1446:189–205. doi: 10.1007/978-1-4939-3743-1_14
16. Kanehisa M, Furumichi M, Tanabe M, Sato Y, Morishima K. KEGG: new perspectives on genomes, pathways, diseases and drugs. Nucleic Acids Res (2017) 45:D353–D61. doi: 10.1093/nar/gkw1092
17. Yu G, Wang L-G, Han Y, He Q-Y. clusterProfiler: an R package for comparing biological themes among gene clusters. OMICS (2012) 16:284–87. doi: 10.1089/omi.2011.0118
18. Szklarczyk D, Morris JH, Cook H, Kuhn M, Wyder S, Simonovic M, et al. The STRING database in 2017: quality-controlled protein-protein association networks, made broadly accessible. Nucleic Acids Res (2017) 45:D362–8. doi: 10.1093/nar/gkw937
19. Shannon P, Markiel A, Ozier O, Baliga NS, Wang JT, Ramage D, et al. Cytoscape: a software environment for integrated models of biomolecular interaction networks. Genome Res (2003) 13:(11)2498–504. doi: 10.1101/gr.1239303
20. Mantovani A, Cassatella MA, Costantini C, Jaillon S. Neutrophils in the activation and regulation of innate and adaptive immunity. Nat Rev Immunol (2011) 11:519–31. doi: 10.1038/nri3024
21. Biton M, Haber AL, Rogel N, Burgin G, Beyaz S, Schnell A, et al. T Helper Cell Cytokines Modulate Intestinal Stem Cell Renewal and Differentiation. Cell (2018) 175(5):1307–20 .e22. doi: 10.1016/j.cell.2018.10.008
22. Dror S, Sander L, Schwartz H, Sheinboim D, Barzilai A, Dishon Y, et al. Melanoma miRNA trafficking controls tumour primary niche formation. Nat Cell Biol (2016) 18(9):1006–17. doi: 10.1038/ncb3399
23. Lee TI, Young RA. Transcriptional regulation and its misregulation in disease. Cell (2013) 152:1237–51. doi: 10.1016/j.cell.2013.02.014
24. Yao S, Fan LY, Lam EW. The FOXO3-FOXM1 axis: A key cancer drug target and a modulator of cancer drug resistance. Semin Cancer Biol (2018) 50:77–89. doi: 10.1016/j.semcancer.2017.11.018
25. Gartel AL. FOXM1 in Cancer: Interactions and Vulnerabilities. Cancer Res (2017) 77:3135–39. doi: 10.1158/0008-5472.CAN-16-3566
26. Xu MD, Wang Y, Weng W, Wei P, Qi P, Zhang Q, et al. PVT1A Positive Feedback Loop of lncRNA- and FOXM1 Facilitates Gastric Cancer Growth and Invasion. Clin Cancer Res (2017) 23:(8)2071–80. doi: 10.1158/1078-0432.CCR-16-0742
27. Tassi RA, Todeschini P, Siegel ER, et al. FOXM1 expression is significantly associated with chemotherapy resistance and adverse prognosis in non-serous epithelial ovarian cancer patients. (2017) 36:63. doi: 10.1186/s13046-017-0536-y
28. Zhou DM, Liu J, Liu F, Luo GW, Li HT, Zhang R, et al. A novel FoxM1-PSMB4 axis contributes to proliferation and progression of cervical cancer. Biochem Biophys Res Commun (2020) 521(3):746–52. doi: 10.1016/j.bbrc.2019.10.183
29. Li XY, Wu HY, Mao XF, Jiang LX, Wang YX. USP5 promotes tumorigenesis and progression of pancreatic cancer by stabilizing FoxM1 protein. Biochem Biophys Res Commun (2017) 492:48–54. doi: 10.1016/j.bbrc.2017.08.040
30. Cui J, Shi M, Xie D, Wei D, Jia Z, Zheng S, et al. FOXM1 promotes the warburg effect and pancreatic cancer progression via transactivation of LDHA expression. Clin Cancer Res (2014) 20(10):2595–606. doi: 10.1158/1078-0432.CCR-13-2407
31. Zhou Z, Chen H, Xie R, Wang H, Li S, Xu Q, et al. Epigenetically modulated FOXM1 suppresses dendritic cell maturation in pancreatic cancer and colon cancer. Mol Oncol (2019) 13(4):873–93. doi: 10.1002/1878-0261.12443
32. Arceci A, Bonacci T, Wang X, Stewart K, Damrauer JS, Hoadley KA, et al. FOXM1 Deubiquitination by USP21 Regulates Cell Cycle Progression and Paclitaxel Sensitivity in Basal-like Breast Cancer. Cell Rep (2019) 26:3076–86.e6. doi: 10.1016/j.celrep.2019.02.054
33. Puig-Butille JA, Vinyals A, Ferreres JR, Aguilera P, Cabré E, Tell-Martí G, et al. AURKA Overexpression Is Driven by FOXM1 and MAPK/ERK Activation in Melanoma Cells Harboring BRAF or NRAS Mutations: Impact on Melanoma Prognosis and Therapy. J Invest Dermatol (2017) 137(6):1297–310. doi: 10.1016/j.jid.2017.01.021
34. Kruiswijk F, Hasenfuss SC, Sivapatham R, Baar MP, Putavet D, Naipal KA, et al. Targeted inhibition of metastatic melanoma through interference with Pin1-FOXM1. signaling (2016) 35(17):2166–77. doi: 10.1038/onc.2015.282
35. Kuzu OF, Gowda R, Sharma A, Noory MA, Kardos G, Madhunapantula SV, et al. Identification of WEE1 as a target to make AKT inhibition more effective in melanoma. Cancer Biol Ther (2018) 19(1):53–62. doi: 10.1080/15384047.2017.1360446
36. Shen T, Yang L, Zhang Z, Yu J, Dai L, Gao M, et al. KIF20A Affects the Prognosis of Bladder Cancer by Promoting the Proliferation and Metastasis of Bladder Cancer Cells. Dis Markers (2019) 2019:4863182. doi: 10.1155/2019/4863182
37. Yamashita J, Fukushima S, Jinnin M, Honda N, Makino K, Sakai K, et al. Kinesin family member 20A is a novel melanoma-associated antigen. Acta Derm Venereol (2012) 92(6):593–7. doi: 10.2340/00015555-1416
38. Song T, Xu A, Zhang Z, Gao F, Zhao L, Chen X, et al. CircRNA hsa_circRNA_101996 increases cervical cancer proliferation and invasion through activating TPX2 expression by restraining miR-8075. J Cell Physiol (2019) 234:14296–305. doi: 10.1002/jcp.28128
39. Sui C, Song Z, Yu H, Wang HJ. Prognostic significance of TPX2 and NIBP in esophageal cancer;. Oncol Lett (2019) 18:4221–29. doi: 10.3892/ol.2019.10747
40. Wang L, Zhang J, Wan L, Zhou X, Wang Z, Wei WJ. Targeting Cdc20 as a novel cancer therapeutic strategy. Pharmacol Ther (2015) 151:141–51. doi: 10.1016/j.pharmthera.2015.04.002
41. Zhuang L, Yang Z, Meng ZJ. Upregulation of BUB1B, CCNB1, CDC7, CDC20, and MCM3 in Tumor Tissues Predicted Worse Overall Survival and Disease-Free Survival in Hepatocellular Carcinoma Patients. BioMed Res Int (2018) 2018:7897346. doi: 10.1155/2018/7897346
Keywords: melanoma, weighted gene co-expression network analysis, differential expression gene analysis, biomarker, predict prognosis, immunohistochemistry
Citation: Jiang J, Liu C, Xu G, Liang T, Yu C, Liao S, Zhang Z, Lu Z, Wang Z, Chen J, Chen T, Li H and Zhan X (2021) Identification of Hub Genes Associated With Melanoma Development by Comprehensive Bioinformatics Analysis. Front. Oncol. 11:621430. doi: 10.3389/fonc.2021.621430
Received: 26 October 2020; Accepted: 19 March 2021;
Published: 12 April 2021.
Edited by:
Igor Puzanov, University at Buffalo, United StatesReviewed by:
Jennifer Yunyan Zhang, Duke University, United StatesGagan Chhabra, University of Wisconsin-Madison, United States
Copyright © 2021 Jiang, Liu, Xu, Liang, Yu, Liao, Zhang, Lu, Wang, Chen, Chen, Li and Zhan. This is an open-access article distributed under the terms of the Creative Commons Attribution License (CC BY). The use, distribution or reproduction in other forums is permitted, provided the original author(s) and the copyright owner(s) are credited and that the original publication in this journal is cited, in accordance with accepted academic practice. No use, distribution or reproduction is permitted which does not comply with these terms.
*Correspondence: Xinli Zhan, zhanxinli_215@163.com