 Chaofeng Liang1†‡
 Yujie Zhao1‡
 Cunte Chen1†‡Shuxin Huang1Tairan Deng1Xiangbo Zeng1
 Jiaxiong Tan2†
 Xianfeng Zha3†
 Shaohua Chen1*†
 Yangqiu Li1*†
- 1Key Laboratory for Regenerative Medicine of Ministry of Education, Institute of Hematology, School of Medicine, Jinan University, Guangzhou, China
- 2Department of Hematology, First Affiliated Hospital, Jinan University, Guangzhou, China
- 3Department of Clinical Laboratory, First Affiliated Hospital, Jinan University, Guangzhou, China
Thymocyte selection-associated HMG box (TOX) is a transcription factor that belongs to the high mobility group box (HMG-box) superfamily, which includes four subfamily members: TOX, TOX2, TOX3, and TOX4. TOX is related to the formation of multiple malignancies and contributes to CD8+ T cell exhaustion in solid tumors. However, little is known about the role of TOX genes in hematological malignancies. In this study, we explored the prognostic value of TOX genes from 40 patients with de novo acute myeloid leukemia (AML) by quantitative real-time PCR (qRT-PCR) in a training cohort and validated the results using transcriptome data from 167 de novo AML patients from the Cancer Genome Atlas (TCGA) database. In the training cohort, higher expression of TOX and TOX4 was detected in the AML samples, whereas lower TOX3 expression was found. Moreover, both the training and validation results indicated that higher TOX2, TOX3, and TOX4 expression of AML patients (3-year OS: 0% vs. 37%, P = 0.036; 3-year OS: 4% vs. 61%, P < 0.001; 3-year OS: 0% vs. 32%, P = 0.010) and the AML patients with highly co-expressed TOX, TOX2, TOX4 genes (3-year OS: 0% vs. 25% vs. 75%, P = 0.001) were associated with poor overall survival (OS). Interestingly, TOX2 was positively correlated with CTLA-4, PD-1, TIGIT, and PDL-2 (rs = 0.43, P = 0.006; rs = 0.43, P = 0.006; rs = 0.56, P < 0.001; rs = 0.54, P < 0.001). In conclusion, higher expression of TOX genes was associated with poor OS for AML patients, which was related to the up-regulation of immune checkpoint genes. These data might provide novel predictors for AML outcome and direction for further investigation of the possibility of using TOX genes in novel targeted therapies for AML.
Introduction
In recent years with the improvement of chemotherapy regimens and the development of hematopoietic stem cell transplantation technology, acute myeloid leukemia (AML) patient treatment has achieved certain curative effects. However, there is still a high risk of relapse and a low disease-free survival rate (1, 2). The immune escape of tumor cells is a crucial cause of relapse and refractory AML (3). It has been shown that in the tumor microenvironment, tumor cells induce the expression of immune checkpoint (IC) genes, such as programmed cell death protein 1 (PD-1), cytotoxic T lymphocyte-associated molecule-4 (CTLA-4), and lymphocyte-activation gene 3 (LAG-3), leading to T cell exhaustion and immune escape (4–9). Clinical trials of targeted inhibitory antibodies, such as anti-PD-1 and anti-CTLA-4, in solid tumors have demonstrated their significant effects (10). In contrast, the clinical effectiveness of such immune therapies appears to be relatively different for different AML cases and clinical trials with different outcomes (11–13). Therefore, it is worth exploring the immune biomarkers that may be related to the effects of immune checkpoint blockade and revision of T cell exhaustion as well as their association with clinical outcome in AML (14).
Thymocyte selection-associated HMG box (TOX), a transcription factor that can bind to DNA, belongs to the high mobility group box (HMG-box) superfamily. TOX includes four subfamily members (TOX1-4, TOX1 is also known as TOX) (15). TOX is a crucial transcription factor related to the development of malignancies and contributing to CD8+ T cell exhaustion in patients with solid tumors (16–18). For example, TOX is positively correlated with larger tumor size, lower differentiation, later tumor node metastasis (TNM) stage, and facilitating endocytic recycling of PD-1 (17). In tumor-infiltrating CD8+ T cells from human melanoma and non-small cell lung cancer (NSCLC), increased expression of TOX in CD8+ T cells is associated with high expression of PD-1 (19). In contrast, there are few studies on TOX genes in hematological malignancies. TOX is highly expressed in acute lymphoblastic leukemia (ALL), particularly in T cell - ALL (T-ALL). High expression of TOX inhibits the function of the repair factors KU70/KU80 causing abnormal non-homologous end joining (NHEJ) repair (17). Although TOX is positively expressed in almost all ALL cases, TOX deletion has also been detected in ALL patients (20). Therefore, the mechanism by which TOX plays a role in ALL remains to be investigated.
In our previous study, we found higher TOX expression concurrent with PD-1, Tim-3, or CD244 in T cells from patients with B cell non-Hodgkin’s lymphoma (B-NHL), which suggested that TOX may be involved in inducing CD8+ T cell exhaustion by co-regulation with immune checkpoint proteins (21).
In this study, we investigated the expression characteristics and prognostic value of the TOX genes and analyzed the correlation between TOX and IC genes in peripheral blood (PB) samples from AML patients in our clinical center. The results were further validated with high-throughput sequencing data from The Cancer Genome Atlas (TCGA) database in a more significant number of patients.
Materials and Methods
PB Sample Information
In this study, we collected PB mononuclear cells from 40 de novo AML patients with informed consent (15 males and 25 females) who ranged in age from 12 to 83 years and provided informed consent from March 2016 to March 2021. We also included 17 AML-complete response (CR) patients (11 males and 6 females) whose ages ranged from 12 to 62 years (Figure 1). In addition, we collected PB white blood cells (WBCs) from 25 healthy individuals (HIs), including 12 males and 23 females, whose ages ranged from 19 to 70 years as a control population. Overall survival (OS) was defined as the time from diagnosis to death or last follow-up. The clinical information of the patients in the training cohort was listed in Table 1. This study was approved by the Ethics Committee of the School of Medicine of Jinan University [The ethical committee study number: (2015) Lun Shen Pi Ke No. 9].
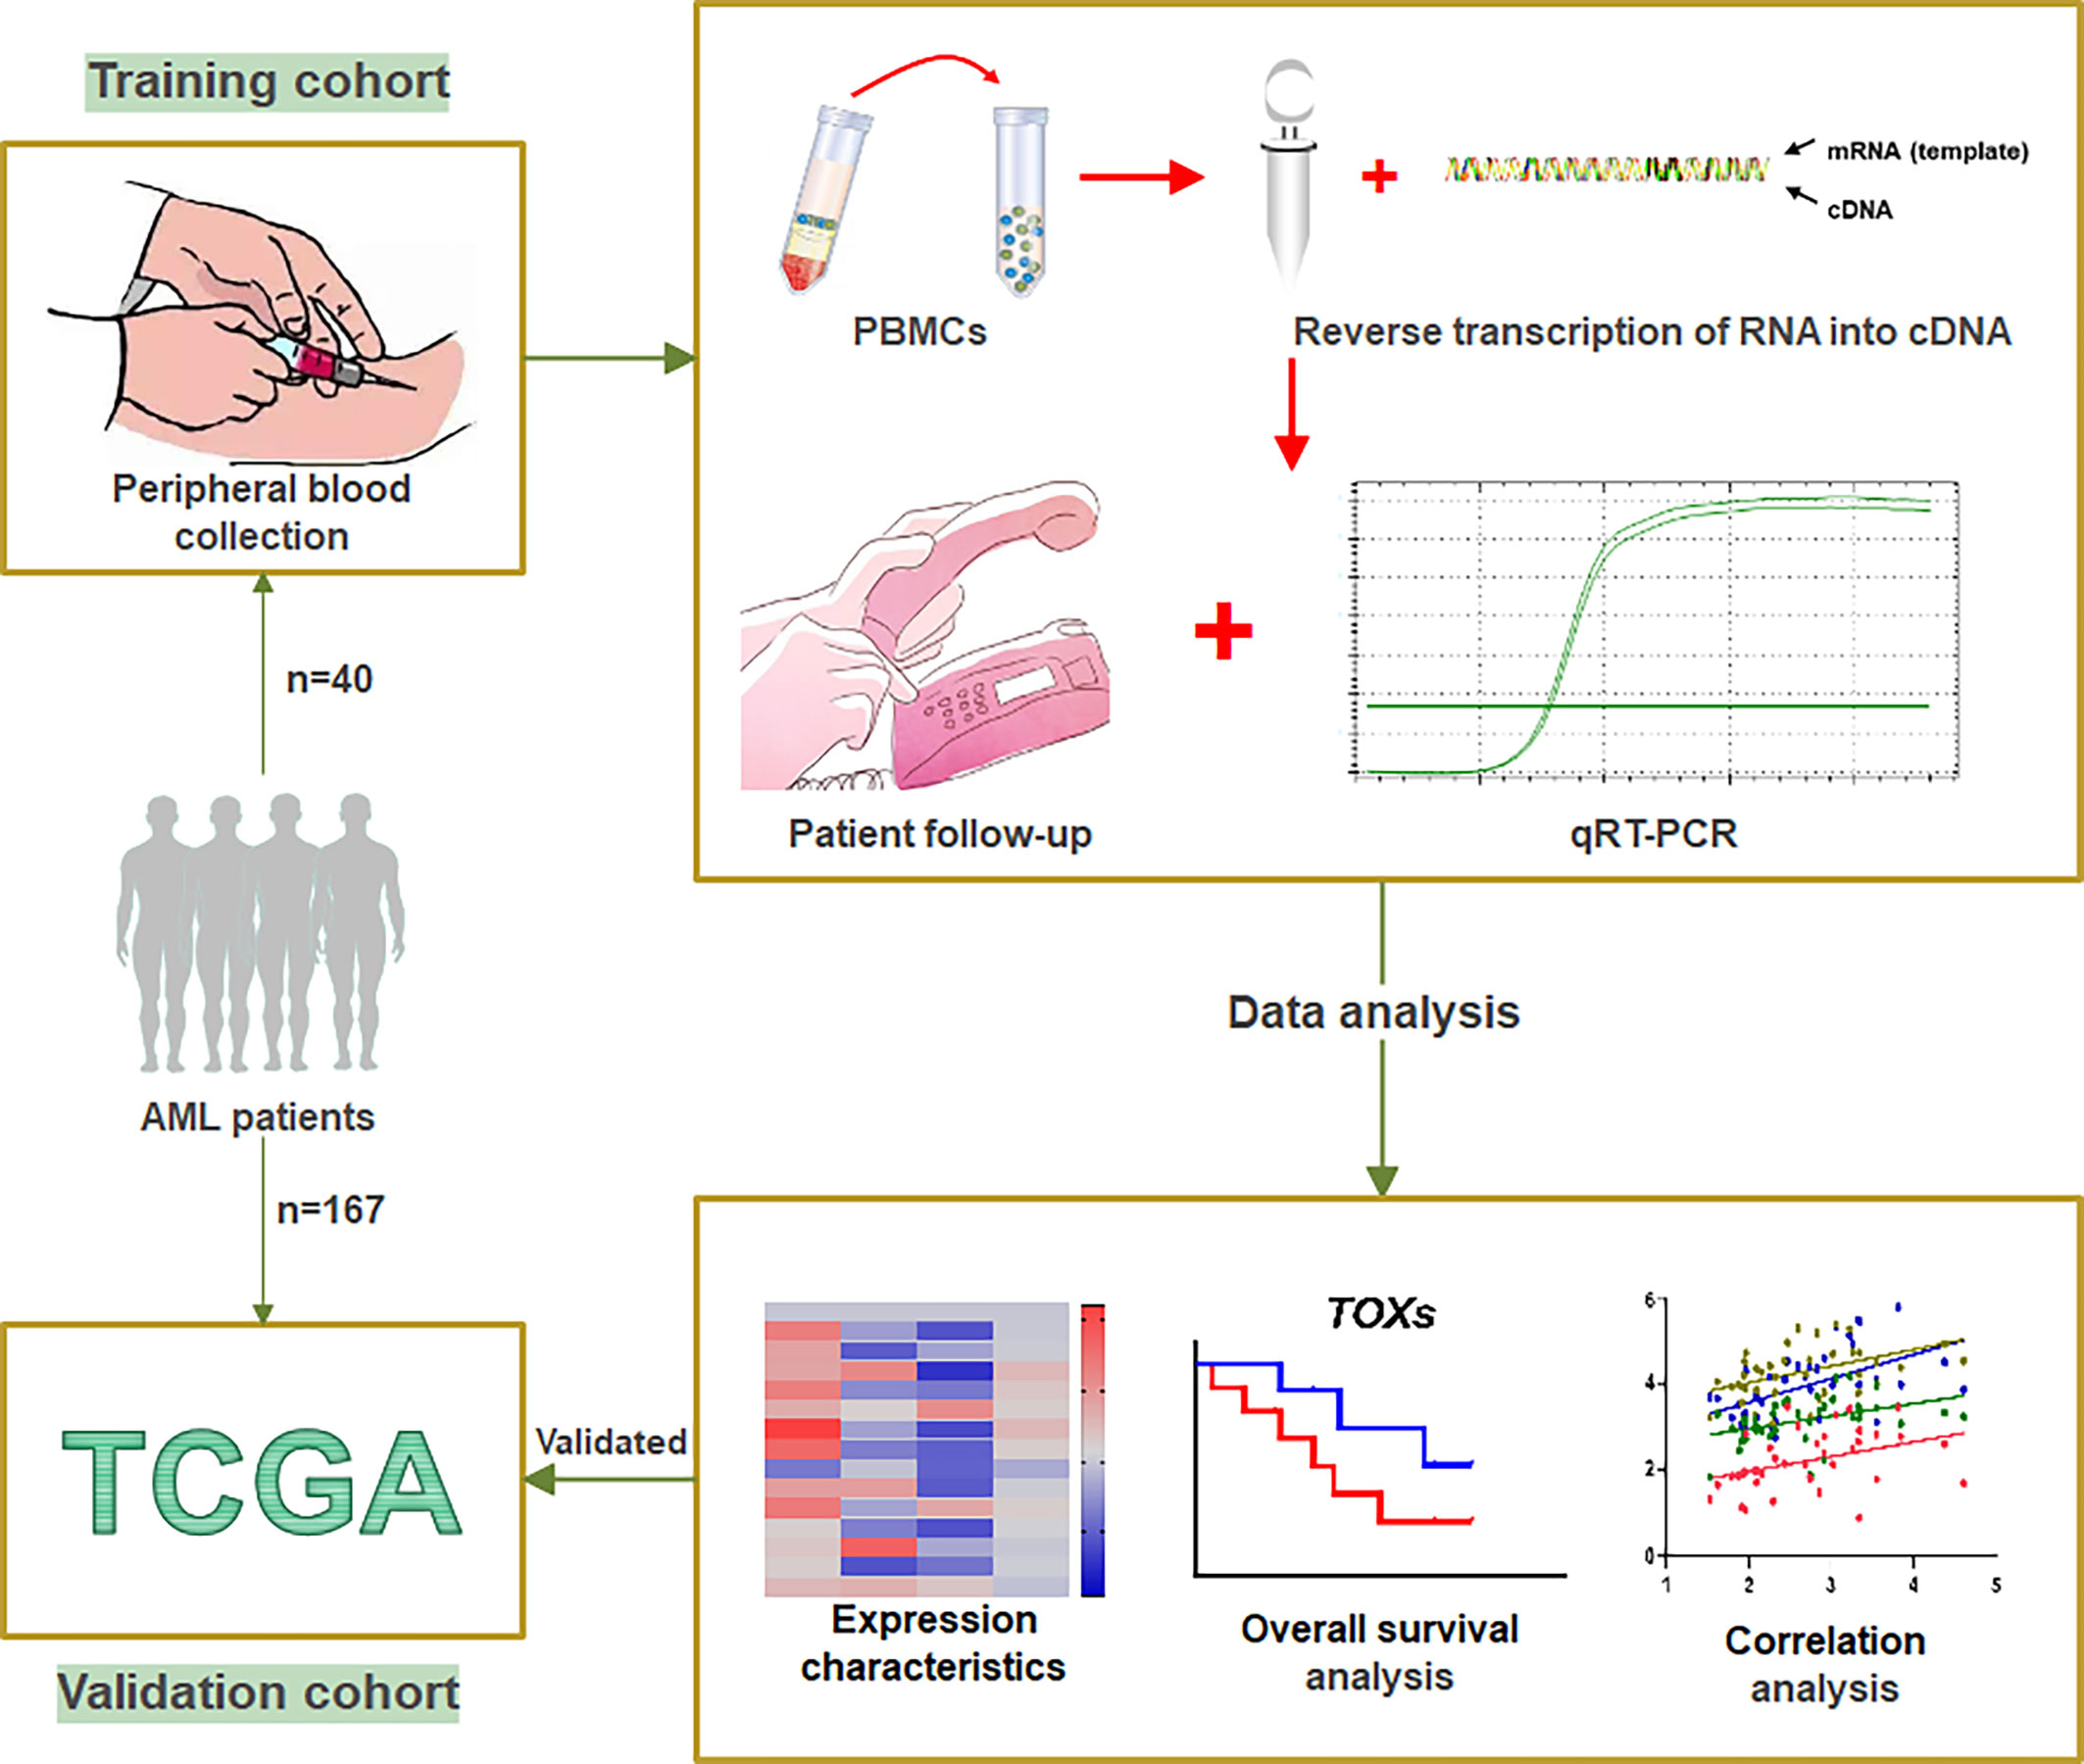
Figure 1 Workflow of study. A total of 40 AML patients from our clinical center were designated as the training cohort. Peripheral blood was collected from these patients to obtain PBMCs, which were used to translate RNA into cDNA. qRT-PCR was used to detect the expression levels of the TOX genes and ICs. After patient follow-up, the data were analyzed by expression characteristics, overall survival analysis, and correlation analysis. The gene expression data and clinical information of 167 de novo AML patients obtained from the TCGA were designated as a validation cohort. PBMCs, peripheral blood mononuclear cells; ICs, immune checkpoint genes; qRT-PCR, Quantitative Real-Time PCR; TCGA, The Cancer Genome Atlas.
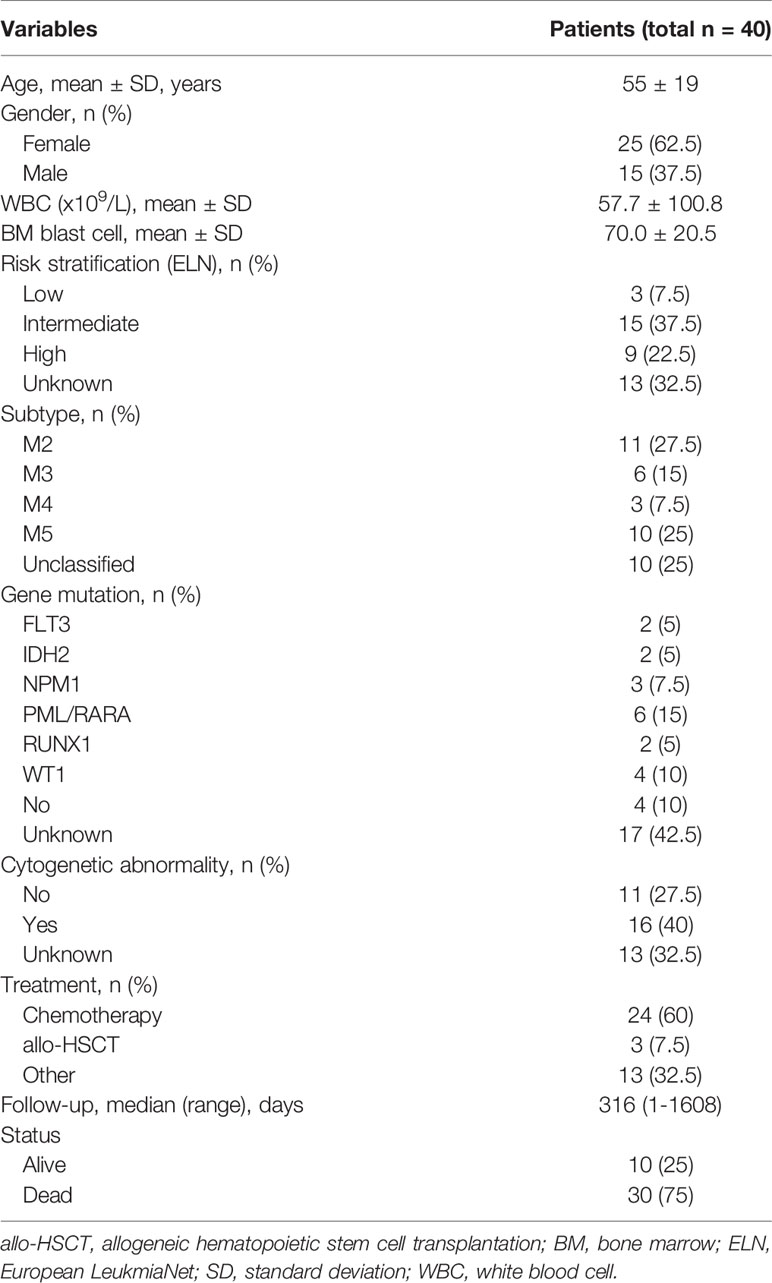
Table 1 Clinical characteristics of AML patients.
TCGA Dataset
The gene expression data and the clinical information of 167 de novo AML patients were obtained from the TCGA (https://cancergenome.nih.gov/) database by UCSC XENA (https://xenabrowser.net/datapages/) (6). The gene expression data from the TCGA database comprised the validation cohort for OS analysis and were used to validate the results of the training cohort.
Quantitative Real-Time PCR
RNA isolation was performed using peripheral blood mononuclear cells (PBMCs) samples. Reverse transcription of RNA into cDNA was performed according to the manufacturer’s instructions for the Reverse Transcription Kit (ABI, USA). The gene expression levels were quantified according to the manufacturer’s instructions in the qRT-PCR kit (TIANGEN, China) (6), and β2M was used as an internal control. The sequences of the primers used for qRT-PCR are listed in Supplementary Table 1. The gene expression results are presented as the fold change lg (2^-ΔΔCT*100).
Optimal Prognostic Cutoff Values
The Optimal prognostic cutoff values for TOX, TOX2, TOX3, and TOX4 were determined using the maximally selected rank statistics from the ‘maxstat’ R package, which was provided to the ‘survminer’ R package (22). This is an outcome-oriented method providing a value of a cut-point that corresponds to the most significant relationship with survival. According to the optimal cut-points of TOX genes, AML patients were divided into low- and high-expression groups to plot and compare Kaplan-Meier curves.
Statistical Analysis
All statistical analyses were performed using Statistical Product and Service Solutions (SPSS) (version 22.0, IBM, Armonk, NY, USA), GraphPad Prism (version 8.4.2, CA, USA), and R (version 3.6.1, https://www.r-project.org/) as appropriate. Kaplan-Meier curves were plotted according to the optimal prognostic cutoff values (Supplementary Figure S1) for continuous variables, which were obtained using the “Survminer” package, and the log-rank test was used for comparison. A Correlation heatmap was generated using the “ggcorrplot” package, and it was analyzed using Spearman’s coefficient. Univariate and multivariate COX regression analyses were used to identify independent prognostic factors. The Mann-Whitney test was used for comparison between two groups, and the Kruskal-Wallis test was used to compare multiple gene expression groups. A two-tailed p-value < 0.05 was considered statistically significant.
Results
Expression Characteristics of TOX Genes in AML
The expression level of four TOX genes was characterized for 40 AML patients, 17 AML-CR patients, and 25 HIs (Figure 2A). Compared with the HIs, TOX was highly expressed in AML (median: 2.48 vs. 1.93, P = 0.010) and AML-CR (median: 2.40 vs. 1.93, P < 0.001) patients (Figure 2B). The expression of TOX2 in the AML-CR group was higher than that in the HI group (median: 2.45 vs. 2.00, P = 0.016); however, the expression of TOX3 was lower than that in the HI group (1.53 vs. 1.97, P = 0.016). The expression characteristics of TOX4 was as follows: AML > HI > AML-CR (median: 2.10 vs. 1.95 vs. 1.81, AML vs AML-CR: P < 0.001; AML vs HI: P = 0.014; AML-CR vs HI: P = 0.042).
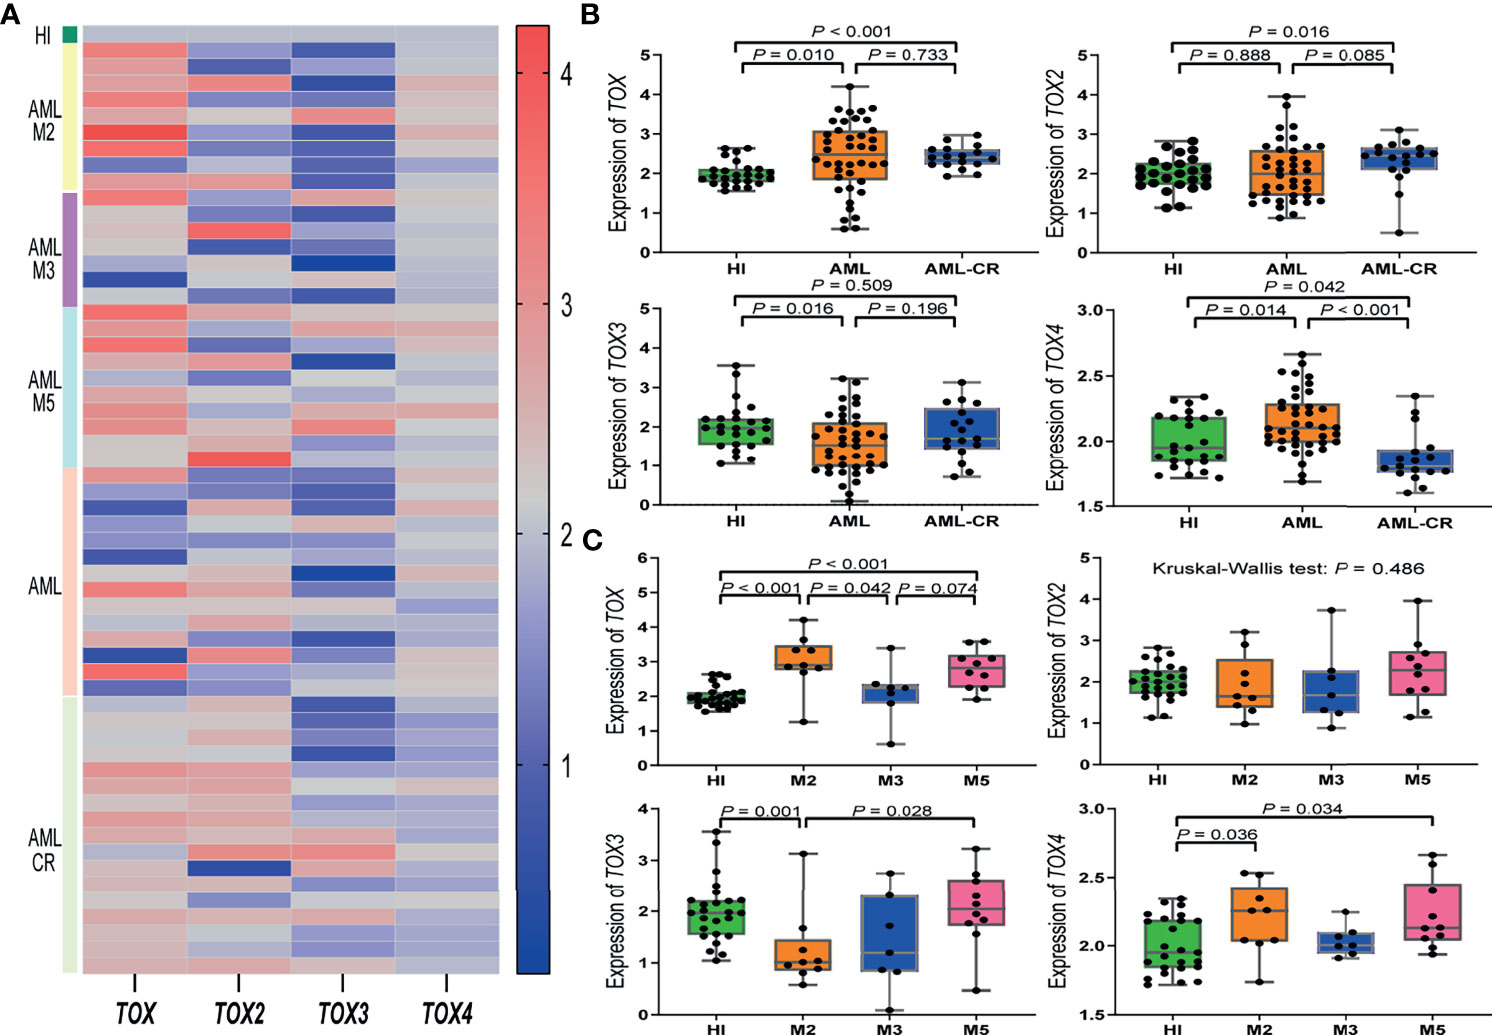
Figure 2 TOX gene expression levels in AML patients. (A) Heatmap of the expression levels of the TOX genes in AML patients from different subtypes and periods compared to a HI. (B) Expression levels of TOX genes in AML (orange) and AML-CR (blue) patients compared to HIs (green). (C) Expression levels of TOX genes in the M2 (orange), M3 (blue), and M5 (pink) subtypes in AML patients compared to HIs (green). CR, complete response; HI, healthy individuals.
We further compared the expression level of the TOX genes in different AML subtypes in comparison to HIs (median: 1.93). The expression of TOX increased significantly in AML-M2 (median: 2.90, P < 0.001) and AML-M5 (median: 2.82, P < 0.001) patients. For TOX, the expression followed the pattern AML-M2 > AML-M5 > AML-M3 (AML-M2 vs. AML-M5: P = 0.388; AML-M3 vs. AML-M5: P = 0.074; AML-M2 vs. AML-M3: P = 0.042). There was no statistically significant difference for TOX2 among the HI and AML subtypes (P = 0.486). TOX3 expression in AML-M2 patients was lower than that in HIs (median: 1.01 vs. 1.96, P = 0.028). Interestingly, although TOX3 was generally low in AML patients, its expression in AML-M5 patients (median: 2.04) was significantly higher than that in AML-M2 patients, and it had the following expression pattern: AML-M5 > AML-M3 > AML-M2 (AML-M5 vs. AML-M3: P = 0.193; AML-M3 vs. AML-M2: P = 0.837; AML-M5 vs. AML-M2: P = 0.028). The expression of TOX4 in AML-M2 (median: 2.25) and AML-M5 (median: 2.13) patients maintained an upward trend compared with the HI group (median: 1.95, P = 0.036, P = 0.034); however, there was no statistically significant difference between the AML-M3 and HI groups (Figure 2C).
Higher Expression of TOX Genes Is Associated With Poor OS in AML Patients
To investigate the role of altered TOX expression in the clinical outcome of AML patients, we collected the clinical information of the AML patients and analyzed the association between the TOX expression level and the OS of AML patients by Kaplan-Meier curves. The optimal prognostic cutoff value for TOX, TOX2, TOX3, and TOX4 was 2.26, 1.32, 1.25, and 2.49, respectively (Supplementary Figures S1A–D). Using these values, we divided the patients into high and low expression groups (Figures 3A–H). The results demonstrated that AML patients with high TOX expression were associated with short survival time and poor OS in the training cohort, but there was no statistically significant difference (3-year OS 23% vs. 32%, P = 0.269, Figure 3A). The 3-year restricted mean survival time (RMST) of the high expression group was 397 days, and the 3-year RMST of the low expression group was 578 days (Supplementary Figure S2A). Similarly, TOX expression in the TCGA data had no statistically significant difference (P = 0.080, Figure 3E). In the training cohort, AML patients with high TOX2, TOX3, and TOX4 expression had shorter survival time and more inferior OS (3-year OS: 0% vs. 37%, P = 0.036; 3-year OS: 4% vs. 61%, P < 0.001; 3-year OS: 0% vs. 32%, P = 0.010, Figures 3B–D). The 3-year RMST of the high expression group was 412, 270, 67 days, respectively, and the 3-year RMST of the low expression group was 727, 776, 531 days, respectively (Supplementary Figures S2B–D). These findings were confirmed in the validation cohort (3-year OS: 24% vs. 44%, P = 0.021; 3-year OS: 9% vs. 35%, P = 0.018; 3-year OS: 27% vs. 60%, P = 0.011, Figures 3F–H).
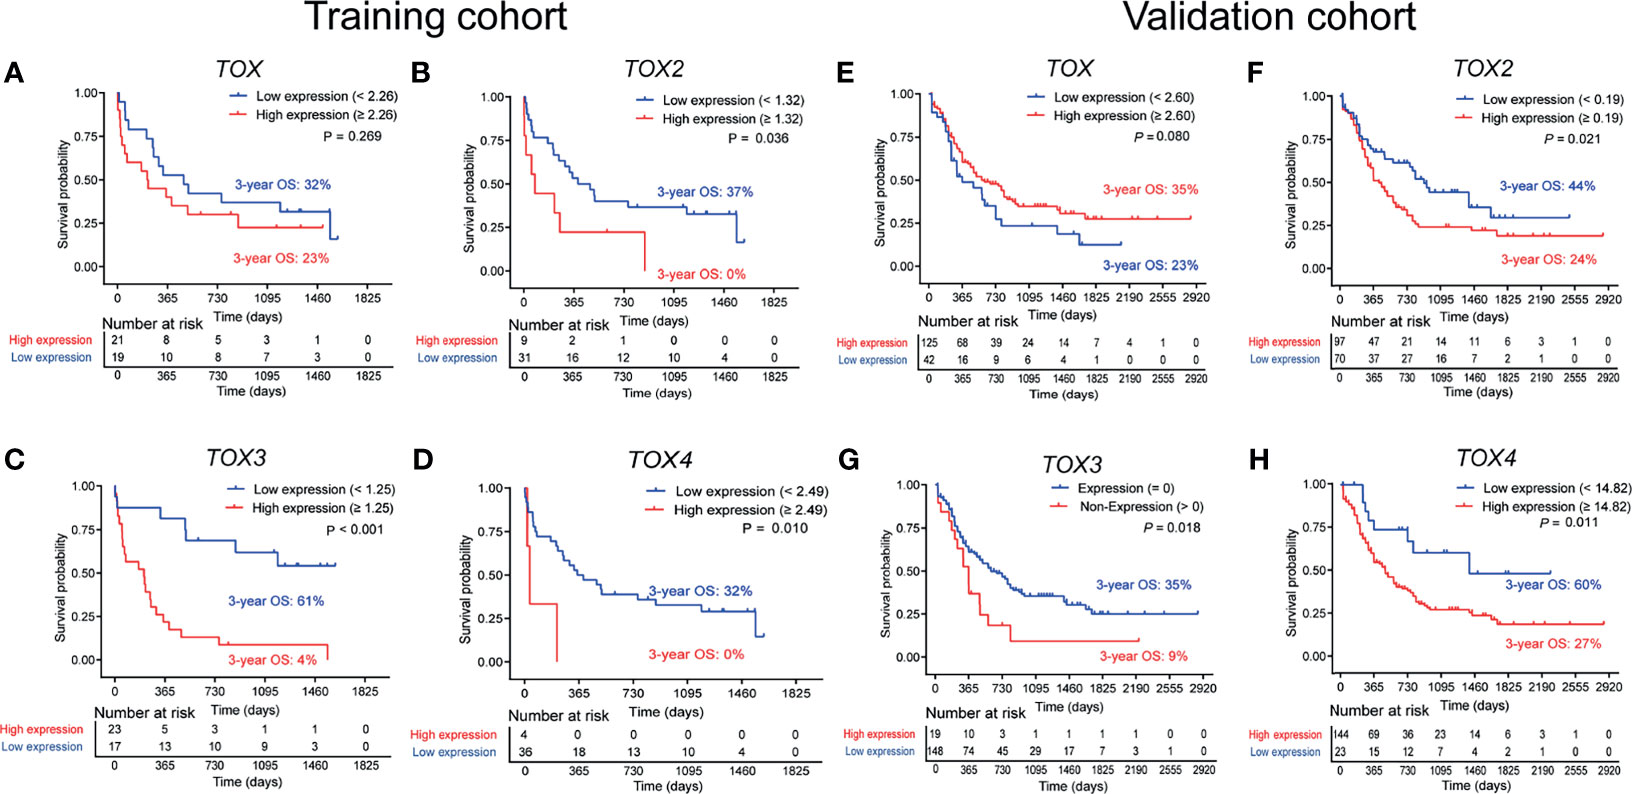
Figure 3 Overall survival (OS) analysis of TOX, TOX2, TOX3, and TOX4 from training (A–D) and validation (E–H) cohort. According to optimal cutoff values, the TOX genes were divided into High expression (red line) and Low expression (blue line) groups, which were plotted in Kaplan-Meier curves (top) with the number at risk AML patients (bottom).
Considering an additive effect on the outcome if multiple TOX genes are aberrantly elevated, we characterize the predictive value of co-expression of TOX genes in AML. Using the co-expression of TOX genes to evaluate the OS, we found that lower OS was observed in TOX2highTOX4high AML patients in comparison with TOX2highTOX4low or TOX2lowTOX4high AML patients and TOX2lowTOX4low AML patients (3-year OS: 0% vs. 25% vs. 56%, P = 0.002, Figure 4A). In addition, TOXhighTOX2highTOX4high AML patients are also related to the poor prognosis of patients (3-year OS: 0% vs. 25% vs. 75%, P = 0.001, Figure 4B). The same results were also confirmed in the validation cohort (3-year OS: 21% vs. 38% vs. 100%, P < 0.001; 3-year OS: 22% vs. 36% vs. 100%, P = 0.008, Figures 4C, D).
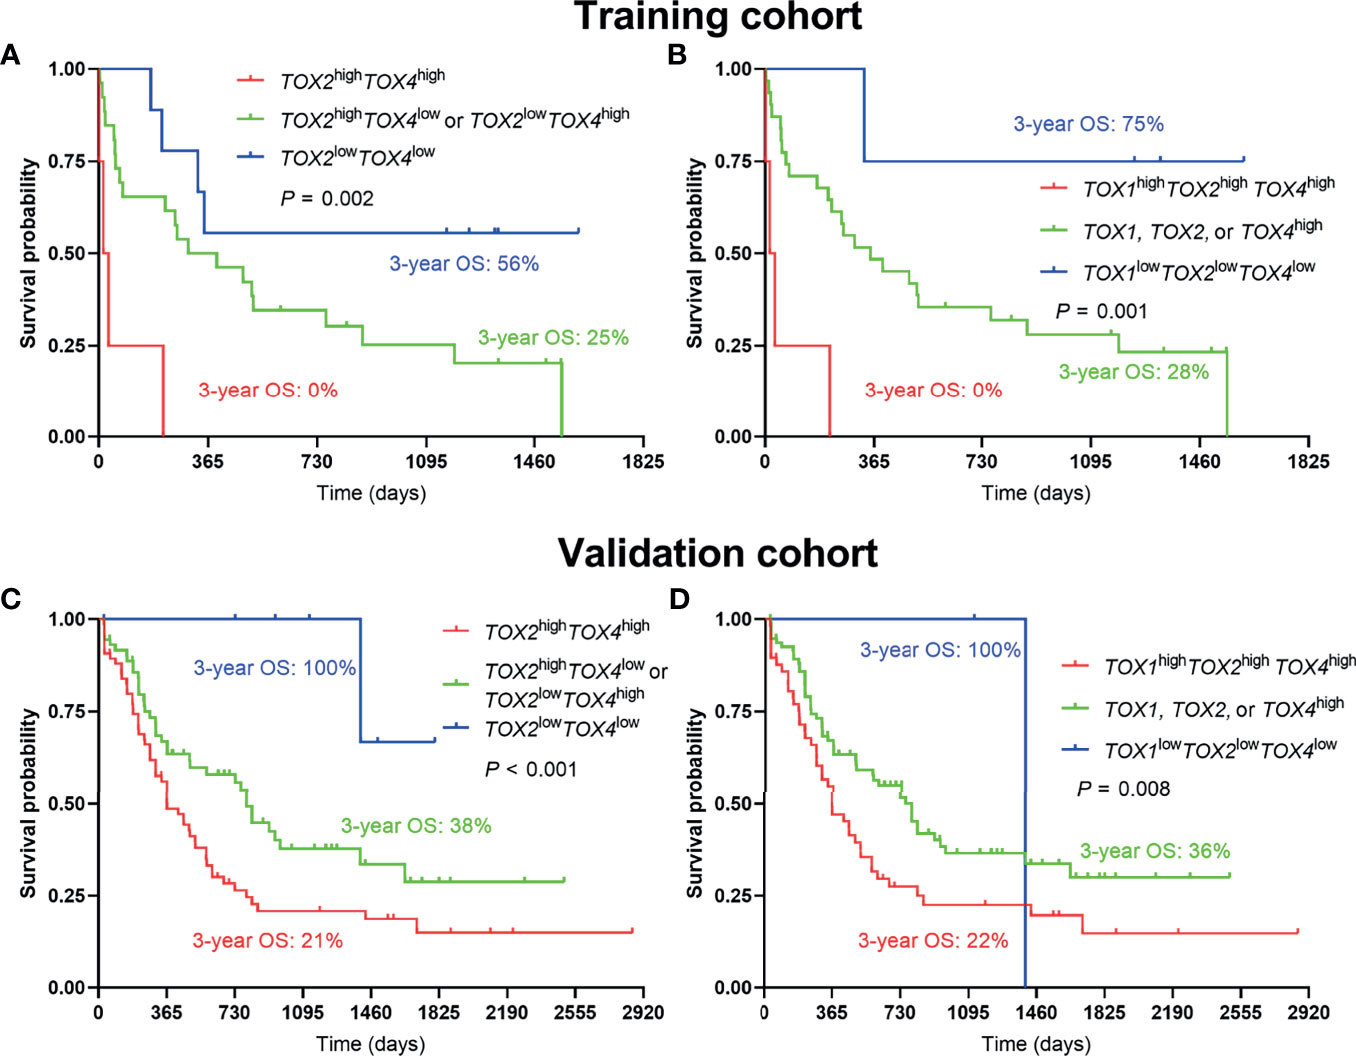
Figure 4 Co-expression of TOX genes in predicting poor OS of AML patients. Kaplan-Meier curves are shown for co-high expression, single high expression, and co-low expression of TOX2/TOX4 (A) and TOX/TOX2/TOX4 (B) in training and validation cohort (C, D).
To better understand the relationship between TOX, TOX2, TOX3, and TOX4 and other impact factors, COX regression analysis was used. When age, gender, AML subtype, ELN risk group, CBF rearrangements, hematologic parameters, treatment, TOX, TOX2, TOX3, and TOX4 were included in univariate COX regression analysis, only age, TOX2, TOX3, and TOX4 were significantly associated with poor overall survival in AML patients. Therefore, age was used for adjusting TOX2, TOX3, and TOX4 in AML patients. Importantly, we found that high expression of TOX2, TOX3, and TOX4 is an independent factor affecting survival. Compared with patients with low expression of TOX2, TOX3, and TOX4, those with high expression are at higher risk of death than those with low expression: TOX2: P = 0.005, hazard ratio (HR) = 1.03 (95% confidence interval (CI): 1.01-1.05); TOX3: P = 0.037, HR = 1.02 (95% CI: 1.00-1.04); TOX4: P = 0.032, HR = 1.03 (95% CI: 1.00-1.05). However, in the univariate COX regression model, the expression level of TOX was not significantly associated with the OS of AML patients (HR = 1.60, 95% CI: 0.77-3.35, P = 0.210, Table 2).

Table 2 Uni- and multivariate regression analysis of TOX2, TOX3, and TOX4 in AML patients.
Correlation of TOX and IC Genes Expression in AML
Based on the previous finding of TOX expression concurrent with that of PD-1 and Tim-3 in T cells from patients with lymphoma (21), we analyzed the correlation of the gene expression level of the TOX genes and IC genes in AML patients (Figures 5A–C). Significantly, TOX2 has a positive correlation with TIGIT, PD-1, CTLA-4, and PDL2 (rs = 0.43, P = 0.006; rs = 0.43, P = 0.006; rs = 0.56, P < 0.001; rs = 0.54, P < 0.001). Moreover, the expression levels of TOX and TOX4 had a positive correlation (rs = 0.41, P = 0.008), while the expression level of TOX and TOX2 demonstrated a trend toward a negative correlation (rs = -0.133, P = 0.412). Interestingly, there was a significantly negative correlation between TOX and TOX2 expression in the TCGA dataset (rs = -0.23, P = 0.003). These results were confirmed in the validation cohort (rs = 0. 34, P < 0.001; rs = 0.29, P < 0.001; rs = 0. 44, P < 0.001; rs = 0. 26, P < 0.001, Figure 5B).
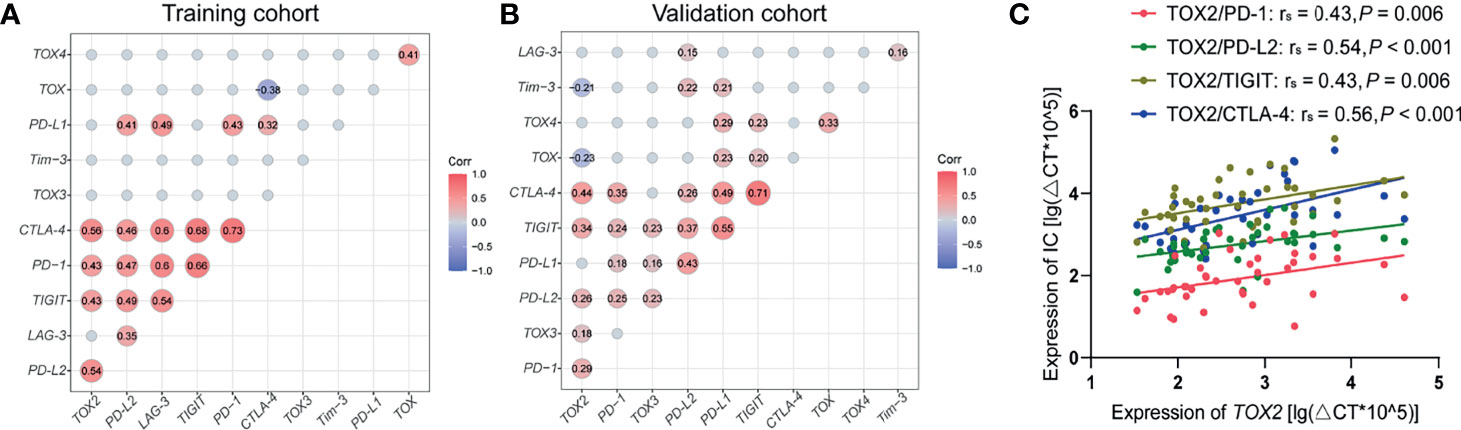
Figure 5 Correlation between TOX and IC genes in peripheral blood from AML patients. (A) Correlation matrix heatmap showing the relationship between TOX and IC genes from training (A) and validation (B) cohort. Correlated genes (P < 0.05) are displayed in red (positive correlation) or blue (negative correlation), and the degree of correlation is represented by the number in the middle of the circle and the shade of the color. (B) Correlations between the expression levels of TOX2 and that of PD-1 (red), PD-L2 (green), TIGIT (brown), and CTLA-4 (blue) from training cohort (C). IC, immune checkpoint.
Discussion
The biomarkers for AML outcome, particularly those related to immune suppression, which often occurs in cancer immune escape, are far from clear. Recent studies have shown that TOX is a crucial transcription factor that contributes to T cell exhaustion and is involved in tumor development (16, 23). However, how TOX is altered in AML remains unclear. In this study, we explored the expression characteristics of the four TOX family members in AML samples. Interestingly, the expression patterns of the TOX genes were different with the expression of TOX and TOX4 significantly increased, TOX3 was decreased, and TOX2 demonstrated an increasing expression trend. These differences may be due to the functional differences of TOXs in the AML subtypes and may be involved in clinical outcome. It is well known that AML includes eight subtypes and is a heterogeneous disease (24). For instance, AML-M3 is a particular subtype with a favorable outcome. Indeed, the expression of TOX genes in patients of different AML subtypes i.e., AML-M2, M3, and M5, was different. Overall, TOX and TOX4 had low expression in the M3 group and high expression in the M2 and M5 groups, while TOX3 was low in AML-M2 and high in AML-M5. Therefore, the study of the TOX family as a biomarker may provide particular predictive value for the study of patients with different types.
It has been reported that both TOX and TOX2 are correlated with CD8+ T cell exhaustion (25). In this study, we also found that TOX2 is positively correlated with CTLA-4, PD-1, TIGIT, and PDL-2 in AML samples from either our center or from the TCGA dataset. Previous studies have indicated that higher PD-1, PD-L1, or CTLA-4 expression is associated with poor OS in AML (6). Thus, TOX2 may be one more biomarker for predicting the T cell immune suppression related to the clinical outcome of AML. However, we did not find any association between the expression of TOX and the immune checkpoint genes. The reason for this discrepancy may be the level of TOX expression in different cells. It is possible that the association between TOX and PD-1 or CTLA-4 co-expression only occurs in T cells (21) and not PBMCs, which include a high percentage of AML cells. We found that TOX genes are also expressed in AML cell lines and primary AML cells (data not shown), which suggests that there are different patterns of expression for TOX genes in T cells and AML cells, which may play a different role. TOX3 is an essential protective transactivator in neurons (26) and plays different roles in various tumors (27–29). Moreover, TOX4 regulates the cell cycle and fate (30, 31), but there is no information regarding the expression characteristics of TOX4 in cancer or hematological malignancies. In this study, we characterized the expression patterns of TOX3 and TOX4 in AML. Interestingly, the expression of TOX3 was significantly decreased and different from the other TOX genes, while TOX4 was highly expressed. Whether these genes play different regulatory roles in AML requires further investigation. We also considered whether there is any correlation or complementation between the expression of the TOX genes. From our results, we could find a positive correlation between TOX and TOX4 in the training and validation groups, while a negative correlation or correlation trend between TOX and TOX2 expression was found. Whether this is complementary regulation remains an open question.
To further discuss the role of the altered expression of the TOX genes in AML, we explored the association between the expression of the TOX genes and the OS of AML patients. Our results demonstrated that AML patients with high TOX2 expression have an inferior OS. Combined with the finding that TOX2 positively correlates with IC genes and is highly expressed in AML-CR patients, overexpression of TOX2 together with T cell exhaustion may be a reason why AML patients have poor OS. It is worth further investigating the value in predicting OS for AML by evaluating the co-expression of TOX with immune checkpoint genes (32). Although the expression of TOX3 is decreased in AML, patients with higher TOX3 expression have an inferior 3-year OS, the function of TOX3 is needed to further characterize. Moreover, we found that patients with increased TOX3 expression are primarily AML-M5 patients. These findings may provide a precise and valuable predictor of OS for AML. Similarly, higher expression of TOX4 is also related to poor prognosis. An interesting finding is that when the TOX, TOX2, TOX4 genes co-expressed highly in AML patients, the prognosis of these patients is significantly poor. This finding indicates that TOX genes play a negative role in AML patients to a large extent. Overall, TOX genes may be potential biomarkers for predicting clinical outcomes in AML, and their blockade may be considered a new direction for the treatment of AML patients.
In summary, in this study, we characterized the altered expression of TOX genes in AML and defined their different roles. We also demonstrated that TOX2 is positively correlated with the CTLA-4, PD-1, TIGIT, and PDL-2 genes. Moreover, higher expression of TOX2, TOX3, and TOX4 of AML patients and the AML patients with highly co-expressed TOX, TOX2, TOX4 genes were associated with poor OS for AML patients, which may be related to the upregulation of immune checkpoint genes. These data indicate that TOX genes may be novel predictors for clinical outcomes in AML. Moreover, TOX, as the upstream molecule of immune checkpoint proteins, is not only expressed in AML cells but also associated with T cell exhaustion, which might provide direction for future investigations of the possibility of the dual effect of TOX targeted inhibition, inhibiting proliferation of AML cells and revising T cell exhaustion and restoring anti-AML T cell function.
Data Availability Statement
The original contributions presented in the study are included in the article/Supplementary Material. Further inquiries can be directed to the corresponding authors.
Ethics Statement
The studies involving human participants were reviewed and approved by Ethics Committee of the School of Medicine of Jinan University. Written informed consent to participate in this study was provided by the participants’ legal guardian/next of kin.
Author Contributions
SC and YL contributed to the concept development and study design and edited the manuscript. CL performed the experiments, interpreted the data, and wrote the manuscript. YZ and CC helped write the manuscript. SH, TD, and XBZ supported reviewing the references and preparing figures. JT and XFZ collected the clinical information and provided clinical peripheral blood samples. All authors contributed to the article and approved the submitted version.
Funding
This work was supported by grants from the National Natural Science Foundation of China (Nos. 82070152, 81770152, and 81570143), the Guangzhou Science and Technology Project (Nos. 201807010004 and 201803040017), and the Training Program of Innovation and Entrepreneurship for Undergraduates of Jinan University (No. CX20150).
Conflict of Interest
The authors declare that the research was conducted in the absence of any commercial or financial relationships that could be construed as a potential conflict of interest.
Publisher’s Note
All claims expressed in this article are solely those of the authors and do not necessarily represent those of their affiliated organizations, or those of the publisher, the editors and the reviewers. Any product that may be evaluated in this article, or claim that may be made by its manufacturer, is not guaranteed or endorsed by the publisher.
Supplementary Material
The Supplementary Material for this article can be found online at: https://www.frontiersin.org/articles/10.3389/fonc.2021.740642/full#supplementary-material
Supplementary Table 1 | Primers for qRT-PCR.
Supplementary Figure 1 | Optimal cutoff values for TOX, TOX2, TOX3, and TOX4 from training (A–D) and validation (E–H) cohort.
Supplementary Figure 2 | Relationship between RMST and the expression levels of AML patients. RMST, restricted mean survival time.
Abbreviations
AML, acute myeloid leukemia; allo-HSCT, allogeneic hematopoietic stem cell transplantation; B-NHL, B-non-Hodgkin’s lymphoma; BM, bone marrow; CI, confidence interval; CR, complete response; CTLA-4, cytotoxic T lymphocyte-associated molecule-4; ELN, European LeukmiaNet, HI, healthy individuals; HMG-box, high mobility group box; HR, hazard ratio; ICs, immune checkpoint genes; LAG-3, lymphocyte-activation gene 3; NHEJ, non-homologous end joining; NSCLC, non-small cell lung cancer; OS, overall survival; PB, peripheral blood; PBMCs, peripheral blood mononuclear cells; PD-1, programmed cell death protein 1; qRT-PCR, quantitative real-time PCR; RMST, restricted mean survival time; SD, standard deviation; SPSS, Statistical Product and Service Solutions; T-ALL, T cell - acute lymphoblastic leukemia; TCGA, The Cancer Genome Atlas; TNM, tumor node metastasis; TOX, thymocyte selection-associated HMG box; WBC, white blood cell.
References
1. Döhner H, Weisdorf DJ, Bloomfield CD. Acute Myeloid Leukemia. N Engl J Med (2015) 373(12):1136–52. doi: 10.1056/NEJMra1406184
2. Stein EM, Tallman MS. Emerging Therapeutic Drugs for AML. Blood (2016) 127(1):71–8. doi: 10.1182/blood-2015-07-604538
3. Mougiakakos D. The Induction of a Permissive Environment to Promote T Cell Immune Evasion in Acute Myeloid Leukemia: The Metabolic Perspective. Front Oncol (2019) 9:1166. doi: 10.3389/fonc.2019.01166
4. Kursunel MA, Esendagli G. A Co-Inhibitory Alliance in Myeloid Leukemia: TIM-3/Galectin-9 Complex as a New Target for Checkpoint Blockade Therapy. EBioMedicine (2017) 23:6–7. doi: 10.1016/j.ebiom.2017.08.002
5. Kasakovski D, Xu L, Li Y. T Cell Senescence and CAR-T Cell Exhaustion in Hematological Malignancies. J Hematol Oncol (2018) 11(1):91. doi: 10.1186/s13045-018-0629-x
6. Chen C, Liang C, Wang S, Chio CL, Zhang Y, Zeng C, et al. Expression Patterns of Immune Checkpoints in Acute Myeloid Leukemia. J Hematol Oncol (2020) 13(1):28. doi: 10.1186/s13045-020-00853-x
7. Yasinska IM, Sakhnevych SS, Pavlova L, Teo Hansen Selnø A, Teuscher Abeleira AM, Benlaouer O, et al. The Tim-3-Galectin-9 Pathway and Its Regulatory Mechanisms in Human Breast Cancer. Front Immunol (2019) 10:1594. doi: 10.3389/fimmu.2019.01594
8. Martínez-López M, Soto M, Iborra S, Sancho D. Leishmania Hijacks Myeloid Cells for Immune Escape. Front Microbiol (2018) 9:883. doi: 10.3389/fmicb.2018.00883
9. Chen C, Zeng C, Li Y. The Importance of Genomic Predictors for Clinical Outcome of Hematological Malignancies. Blood Sci (2021) 3(3):93–5. doi: 10.1097/bs9.0000000000000075
10. Wang J, Yang T, Xu J. Therapeutic Development of Immune Checkpoint Inhibitors. Adv Exp Med Biol (2020) 1248:619–49. doi: 10.1007/978-981-15-3266-5_23
11. Gale RP. Will Immune Therapy Cure Acute Myeloid Leukemia? Blood Sci (2019) 1(1):2–3. doi: 10.1097/bs9.0000000000000024
12. Zhang X, Yang Y, Fan D, Xiong D. The Development of Bispecific Antibodies and Their Applications in Tumor Immune Escape. Exp Hematol Oncol (2017) 6:12. doi: 10.1186/s40164-017-0072-7
13. Zhu R, Tao H, Lin W, Tang L, Hu Y. Identification of an Immune-Related Gene Signature Based on Immunogenomic Landscape Analysis to Predict the Prognosis of Adult Acute Myeloid Leukemia Patients. Front Oncol (2020) 10:574939. doi: 10.3389/fonc.2020.574939
14. Salik B, Smyth MJ, Nakamura K. Targeting Immune Checkpoints in Hematological Malignancies. J Hematol Oncol (2020) 13(1):111. doi: 10.1186/s13045-020-00947-6
15. O'Flaherty E, Kaye J. TOX Defines a Conserved Subfamily of HMG-Box Proteins. BMC Genomics (2003) 4(1):13. doi: 10.1186/1471-2164-4-13
16. Liang C, Huang S, Zhao Y, Chen S, Li Y. TOX as a Potential Target for Immunotherapy in Lymphocytic Malignancies. Biomark Res (2021) 9(1):20. doi: 10.1186/s40364-021-00275-y
17. Lobbardi R, Pinder J, Martinez-Pastor B, Theodorou M, Blackburn JS, Abraham BJ, et al. TOX Regulates Growth, DNA Repair, and Genomic Instability in T-Cell Acute Lymphoblastic Leukemia. Cancer Discov (2017) 7(11):1336–53. doi: 10.1158/2159-8290.Cd-17-0267
18. Dulmage BO, Akilov O, Vu JR, Falo LD, Geskin LJ. Dysregulation of the TOX-RUNX3 Pathway in Cutaneous T-Cell Lymphoma. Oncotarget (2019) 10(33):3104–13. doi: 10.18632/oncotarget.5742
19. Kim K, Park S, Park SY, Kim G, Park SM, Cho JW, et al. Single-Cell Transcriptome Analysis Reveals TOX as a Promoting Factor for T Cell Exhaustion and a Predictor for Anti-PD-1 Responses in Human Cancer. Genome Med (2020) 12(1):22. doi: 10.1186/s13073-020-00722-9
20. Bardet V, Couque N, Cattolico L, Hetet G, Devaux I, Duprat S, et al. Molecular Analysis of Nonrandom 8q12 Deletions in Acute Lymphoblastic Leukemia: Identification of Two Candidate Genes. Genes Chromosomes Cancer (2002) 33(2):178–87. doi: 10.1002/gcc.10014
21. Huang S, Liang C, Zhao Y, Deng T, Tan J, Lu Y, et al. Increased TOX Expression Concurrent With PD-1, Tim-3, and CD244 in T Cells From Patients With Non-Hodgkin Lymphoma. Asia Pac J Clin Oncol (2021). doi: 10.1111/ajco.13545
22. Laska E, Meisner M, Wanderling J. A Maximally Selected Test of Symmetry About Zero. Stat Med (2012) 31(26):3178–91. doi: 10.1002/sim.5384
23. Guo R, Lü M, Cao F, Wu G, Gao F, Pang H, et al. Single-Cell Map of Diverse Immune Phenotypes in the Acute Myeloid Leukemia Microenvironment. biomark Res (2021) 9(1):15. doi: 10.1186/s40364-021-00265-0
24. Chen C, Chio CL, Zeng H, Li Y. High Expression of CD56 May Be Associated With Favorable Overall Survival in Intermediate-Risk Acute Myeloid Leukemia. Hematol (Amsterdam Netherlands) (2021) 26(1):210–4. doi: 10.1080/16078454.2021.1880734
25. Seo H, Chen J, González-Avalos E, Samaniego-Castruita D, Das A, Wang YH, et al. TOX and TOX2 Transcription Factors Cooperate With NR4A Transcription Factors to Impose CD8(+) T Cell Exhaustion. Proc Natl Acad Sci USA (2019) 116(25):12410–5. doi: 10.1073/pnas.1905675116
26. Yuan SH, Qiu Z, Ghosh A. TOX3 Regulates Calcium-Dependent Transcription in Neurons. Proc Natl Acad Sci USA (2009) 106(8):2909–14. doi: 10.1073/pnas.0805555106
27. Han YJ, Zhang J, Zheng Y, Huo D, Olopade OI. Genetic and Epigenetic Regulation of TOX3 Expression in Breast Cancer. PloS One (2016) 11(11):e0165559. doi: 10.1371/journal.pone.0165559
28. Zeng D, Lin H, Cui J, Liang W. TOX3 is a Favorable Prognostic Indicator and Potential Immunomodulatory Factor in Lung Adenocarcinoma. Oncol Lett (2019) 18(4):4144–52. doi: 10.3892/ol.2019.10748
29. He Y, Liu H, Chen Q, Shao Y, Luo S. Relationships Between SNPs and Prognosis of Breast Cancer and Pathogenic Mechanism. Mol Genet genomic Med (2019) 7(9):e871. doi: 10.1002/mgg3.871
30. Lee JH, You J, Dobrota E, Skalnik DG. Identification and Characterization of a Novel Human PP1 Phosphatase Complex. J Biol Chem (2010) 285(32):24466–76. doi: 10.1074/jbc.M110.109801
31. Vanheer L, Song J, De Geest N, Janiszewski A, Talon I, Provenzano C, et al. Tox4 Modulates Cell Fate Reprogramming. J Cell Sci (2019) 132(20):jcs232223. doi: 10.1242/jcs.232223
Keywords: TOX, prognosis, biomarker, immune checkpoint, acute myeloid leukemia
Citation: Liang C, Zhao Y, Chen C, Huang S, Deng T, Zeng X, Tan J, Zha X, Chen S and Li Y (2021) Higher TOX Genes Expression Is Associated With Poor Overall Survival for Patients With Acute Myeloid Leukemia. Front. Oncol. 11:740642. doi: 10.3389/fonc.2021.740642
Received: 13 July 2021; Accepted: 20 September 2021;
Published: 08 October 2021.
Edited by:
Mazdak Ganjalikhani Hakemi, Isfahan University of Medical Sciences, IranReviewed by:
Matteo Molica, S. Eugenio, Rome, ItalyAndrew Kelly, Foundation Medicine Inc., United States
Copyright © 2021 Liang, Zhao, Chen, Huang, Deng, Zeng, Tan, Zha, Chen and Li. This is an open-access article distributed under the terms of the Creative Commons Attribution License (CC BY). The use, distribution or reproduction in other forums is permitted, provided the original author(s) and the copyright owner(s) are credited and that the original publication in this journal is cited, in accordance with accepted academic practice. No use, distribution or reproduction is permitted which does not comply with these terms.
*Correspondence: Yangqiu Li, yangqiuli@hotmail.com; Shaohua Chen, jnshaohuachen@163.com
†ORCID: Yangqiu Li, orcid.org/0000-0002-0974-4036 Shaohua Chen, orcid.org/0000-0003-4945-5914 Jiaxiong Tan, orcid.org/0000-0002-5606-3962 Cunte Chen, orcid.org/0000-0003-3733-9174 Xianfeng Zha, orcid.org/0000-0002-4970-1305 Chaofeng Liang, orcid.org/0000-0002-0567-4739
‡These authors have contributed equally to this work