 Wei Li
 Yuan Sun2
- 1Department of Medical Imaging, Jiangsu Vocational College of Medicine, Yancheng, China
- 2Department of Burn and Plastic Surgery, 71st Group Army Hospital of People’s Liberation Army of China, Xuzhou, China
- 3Department of Radiology, Wuxi No. 2 People’s Hospital, Wuxi, China
Purpose: To investigate the diagnostic performance of using quantitative assessment with multiparametric MRI (mpMRI) for prediction of extraprostatic extension (EPE) in patients with prostate cancer (PCa).
Methods: We performed a computerized search of MEDLINE, Embase, Cochrane Library, Web of Science, and Google Scholar from inception until July 31, 2021. Summary estimates of sensitivity and specificity were pooled with the bivariate model, and quality assessment of included studies was performed with the Quality Assessment of Diagnostic Accuracy Studies-2. We plotted forest plots to graphically present the results. Multiple subgroup analyses and meta-regression were performed to explore the variate clinical settings and heterogeneity.
Results: A total of 23 studies with 3,931 participants were included. The pooled sensitivity and specificity for length of capsular contact (LCC) were 0.79 (95% CI 0.75–0.83) and 0.77 (95% CI 0.73–0.80), for apparent diffusion coefficient (ADC) were 0.71 (95% CI 0.50–0.86) and 0.71 (95% CI 059–0.81), for tumor size were 0.62 (95% CI 0.57–0.67) and 0.75 (95% CI 0.67–0.82), and for tumor volume were 0.77 (95% CI 0.68–0.84) and 0.72 (95% CI 0.56–0.83), respectively. Substantial heterogeneity was presented among included studies, and meta-regression showed that publication year (≤2017 vs. >2017) was the significant factor in studies using LCC as the quantitative assessment (P=0.02).
Conclusion: Four quantitative assessments of LCC, ADC, tumor size, and tumor volume showed moderate to high diagnostic performance of predicting EPE. However, the optimal cutoff threshold varied widely among studies and needs further investigation to establish.
Introduction
Extraprostatic extension (T3a and T3b) in PCa is associated with a higher risk of biochemical recurrence and metastatic disease after radical prostatectomy (RP) or radiotherapy (1, 2). Although patients who undergo RP have shown high cancer-specific survival, they have a risk of suffering from postoperative erectile dysfunction and urinary incontinence (3). Preservation of the neurovascular bundles (NVB) can improve postoperative potency rate, however, which may increase the risk of positive surgical margins, bringing about biochemical recurrence and treatment failure (4, 5). Therefore, comprehensive risk assessment and staging is of great importance, which will influence the treatment planning and management. To overcome this problem, various nomograms and guidelines were proposed to improve the preoperative risk evaluation, including Partin tables, Memorial Sloan Kettering Cancer Center nomograms, and the cancer of the prostate risk assessment score (6–8). However, these well-established measures are roughly correlated with the final pathologic stage and lacking accuracy in clinical practice (9, 10).
In recent years, mpMRI has been widely applied in detection, staging, and localization of prostate cancer (PCa). In 2012, the European Society of Urogenital Radiology (ESUR) introduced Prostate Imaging Reporting and Data System (PI-RADS) for performing, interpreting, and reporting the PCa with mpMRI (11–13), which was validated and widely used in clinical practice (14, 15). Nevertheless, for localized advantage PCa of EPE, the ESUR PI-RADS demonstrated moderate diagnostic accuracy, and mainly depended on radiologists’ own experience then short of reproducibility and inter-reader agreement (16, 17). At present, quantitative assessments of EPE with mpMRI have been intensively studied and demonstrated the potential of improving accuracy, inter-reader agreement, and pathology correlation (18, 19). In PI-RADS version 2.1, quantitative metrics such as length of capsular contact (LCC), apparent diffusion coefficient (ADC), tumor size, and tumor volume were included for assisting in prediction of EPE (13). However, these parameters have not been evaluated systematically up to date. Thus, the purpose of our study was to assess the diagnostic accuracy of using quantitative metrics for the prediction of EPE.
Methods and Materials
This systematic review and meta-analysis was performed in accordance with the preferred reporting items for systematic reviews and meta-analyses (PRISMA) guidelines (20). The primary outcome was the diagnostic performance of using mpMRI quantitative metrics of LCC, ADC, tumor size, and tumor volume as independent predictors for prediction of EPE in PCa.
Search Strategy and Selection Criteria
For this systematic review, we carried out an electronic database search of MEDLINE, Embase, Cochrane Library, Web of Science, and Google Scholar from inception until July 31, 2021, with language restricted to English. The searches were supplemented by screening references from the most recent reviews and eligible studies. The search terms combined acronyms used for MRI, PCa, EPE, and quantitative assessments as follows: ([MR] or [MRI] or [mpMRI] or [magnetic resonance] or [magnetic resonance imaging]) and ([prostate cancer] or [PCa] or [prostate carcinoma]) and ([EPE] or [extraprostatic extension] or [ECE] or [extracapsular extension]) and ([tumor size] or [tumor volume] or [tumor dimension] or [ADC] or [apparent diffusion coefficient] or [LCC] or [TCL] or [length of tumor capsular contact] or [capsule contact length] or [tumor contact length]).
Inclusion Criteria
We included studies that met all criteria as follows: (1) patients underwent mpMRI for assessment of suspected EPE; (2) with quantitative metric of LCC, ADC, tumor size, and tumor volume as independent predictors; (3) reported the true positive (TP), false positive (FP), false negative (FN), and true negative (TN), or other details for the reconstruction of 2×2 tables to evaluate the diagnostic performance; and (4) with pathological results after radical prostatectomy as the reference standard.
Exclusion Criteria
We excluded studies that satisfied any of the following criteria: (1) studies involving less than 10 participants, (2) did not use the quantitative metrics as an independent predictor but combined with other scoring system or guidelines, (3) not reported sufficient for assessing the diagnostic performance, and (4) review articles, guidelines, consensus statements, letters, editorials, and conference abstracts. The literature selection was performed by two investigators (LW and SY, with 8 and 11 years of experience in performing systematic reviews and meta-analyses) independently. All disagreements were resolved by discussion and consultation with a third investigator (WM) until consensus was reached.
Data Extraction and Quality Assessment
We used a standardized form to extract information from individual studies as follows: (1) demographic and clinical characteristics, including sample size, patient age, PSA level, and Gleason score, number of patients diagnosed with EPE; (2) study characteristics, including authors, year of publication, affiliation, country of origin, duration of patient recruitment, study design, quantitative metrics used and corresponding cutoff thresholds, number of readers and their experience, blinding; and (3) technical characteristics of mpMRI, including magnetic field strength, b values, and coil type. We used the Quality Assessment of Diagnostic Accuracy Studies-2 to evaluate the quality of studies and likelihood of bias (21), in which four domains were scored for individual study: patient selection, method of the index test (parameter measurement and use of appropriate threshold to classify lesions), using pathological results as a reference standard, and flow and timing. Data extraction was performed by one investigator (LW) and confirmed by a second investigator (SY).
Data Synthesis and Analysis
The degree of heterogeneity between studies was measured using the inconsistency index (I2): 0–40%, might or have no heterogeneity; 30–60%, moderate heterogeneity; 50–90%, substantial heterogeneity; and 75–100%, considerable heterogeneity (22). The summary estimates of sensitivity and specificity were calculated with the bivariate model and hierarchical summary receiver operating characteristic (HSROC) model (23, 24). The forest plots were used to graphically present the 95% confidence interval (95% CI) of sensitivity and specificity for each study. In addition, an HSROC curve with a 95% confidence region and prediction region was constructed to demonstrate the results. The Deeks’ funnel plot was used to estimate the publication bias, and statistical significance was determined by the Deeks’ asymmetry test (25).
In the light of varied cutoff values reported across included studies, multiple subgroup analyses were performed to assess the following various clinical settings: (1) use of tumor size ≥15 mm as the cutoff threshold, (2) use of the value of ADC mean, (3) use of LCC ≤10 mm as the cutoff threshold, (4) use of LCC ≤12 mm as the cutoff threshold, (5) use of LCC >10 mm as the cutoff threshold, (6) use of LCC >12 mm as the cutoff threshold. We performed meta-regression to explore the sources of heterogeneity. For studies using LCC as the quantitative metric, the following covariates were added to the bivariate model: (1) study design (prospective vs. retrospective), (2) patient number (≤150 vs. >150), (3) magnetic field strength (1.5 T vs. 3.0 T), (4) malignant rate (≤30 vs. >30%), (5) LCC length (≤10 vs. >10 mm, and ≤12 vs. >12 mm), (6) reader number (<2 vs. ≥2), (7) blinded to the final results (blinded vs. aware partial patient information), (8) publication year (≤2017 vs. >2017), and (9) length of tumor size (15 vs. >15 mm). All analyses were conducted using STATA 16.0, and statistical significance was set at P values less than 0.05.
Results
Literature Search
A flow chart summarizing the publication selection process is presented in Figure 1. Our literature search initially yielded 438 results, of which 251 were excluded owing to duplicates. After screening of titles and abstracts, a total of 125 results were excluded. Full-text analysis was performed among the remaining 62 potentially eligible articles, and 39 were excluded for reasons as follows: with insufficient data to reconstruct 2×2 tables (n=27), not in the field of interest (n=8), and partially overlapping patient cohort (n=4). Finally, a total of 23 studies with 3,931 participants assessing diagnostic performance of mpMRI quantitative metrics for detection of EPE were included in this study (26–48).
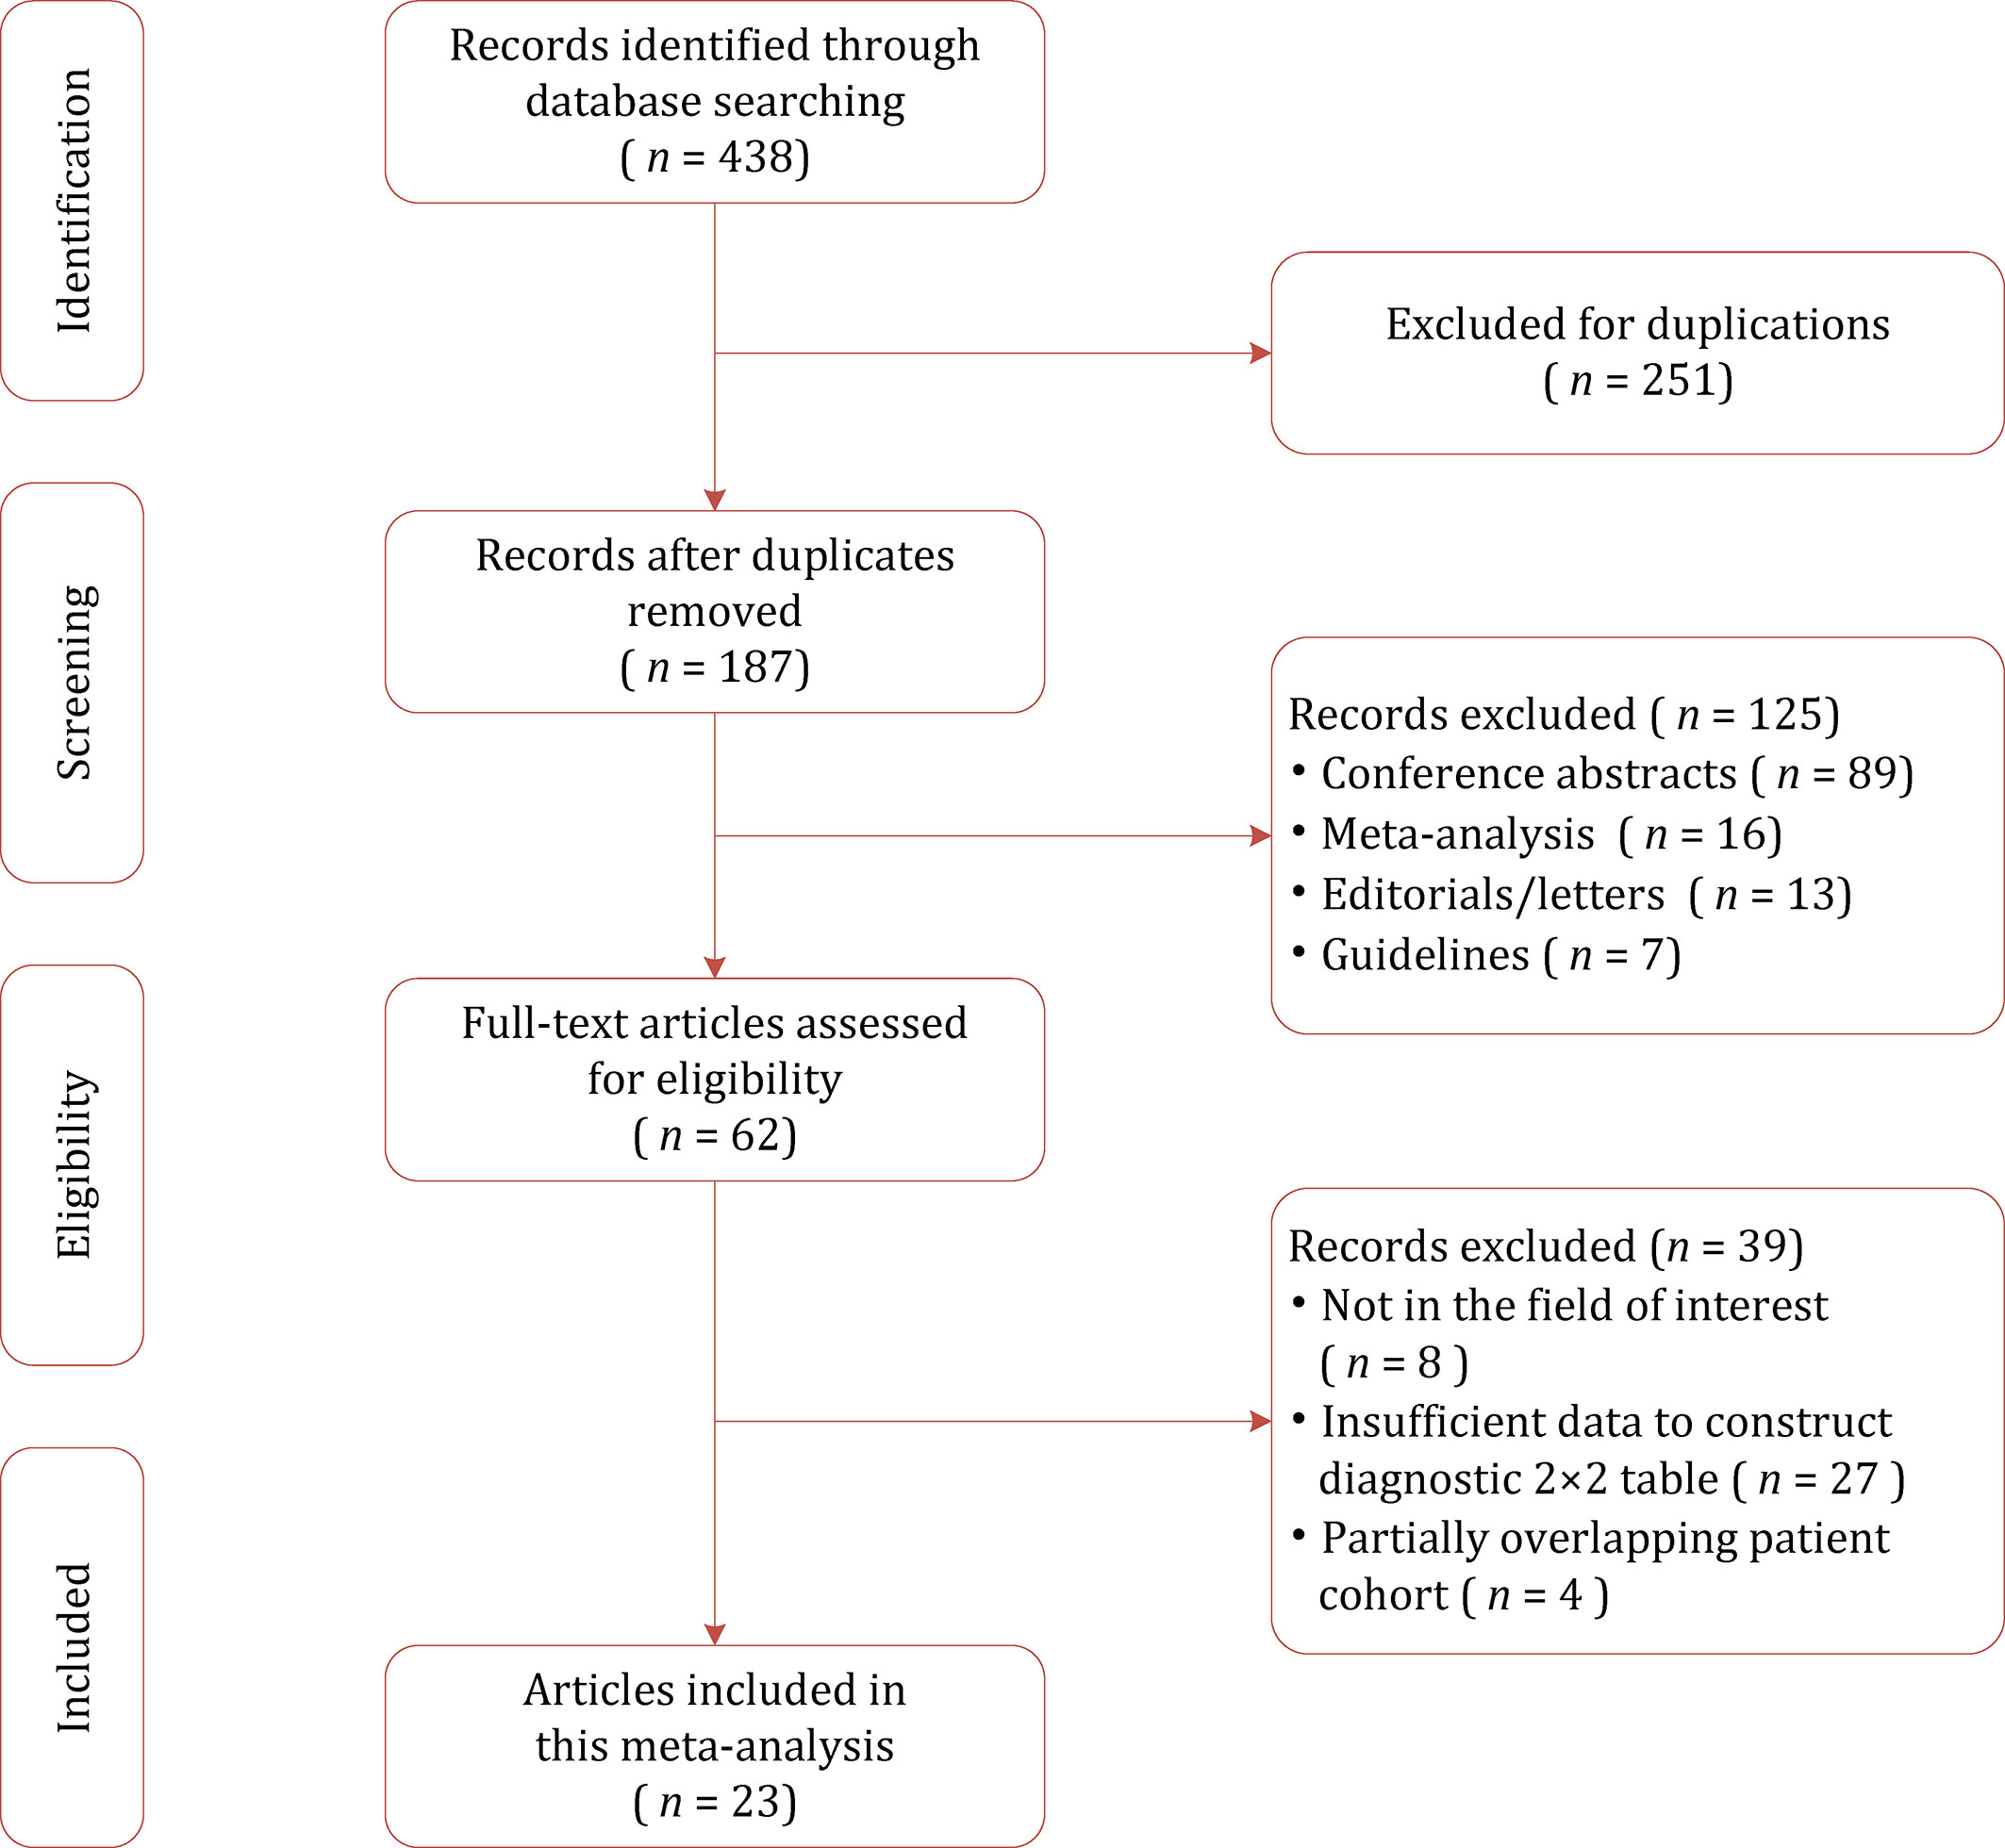
Figure 1 Study selection process for this systematic review and meta-analysis.
Characteristics of the Included Studies
The detailed demographic characteristics are summarized in Table 1. The sample size of the study population ranged from 25 to 553 patients, with a mean age of 60–68 years. Based on pathological results after RP, EPE was found in 23–67% percent of participants. The PSA levels of participants ranged from 2.1 to 58.7, with a Gleason score of 5–10. In 16 studies, LCC was used for independent predictor of EPE, with cutoff values ranging from 6 to 20 mm (27–29, 31, 32, 34–36, 38, 39, 43, 44, 46–48). In three studies, tumor size was used for independent predictor, with a cutoff value of 0.9–2.1 (33, 39, 42). The diagnostic accuracy of using ADC value as independent predictor was reported by seven studies (32, 33, 35, 39–41, 45). In five studies, tumor volume was used as independent predictor, with cutoff thresholds ranging from 15 to 19 mm (26, 27, 35, 37, 46). Regarding study design, only four studies (34, 36, 38, 39) were prospective, and all of the remaining 19 studies were retrospective in nature. In 18 studies, the MRI was performed with 3.0 T scanners, whereas in the remaining five studies, MRI was performed with 1.5 T scanners (28, 32, 33, 36, 39). The MRI images were interpreted by one to three radiologists, with experience of 2–23 years. Most studies reported that radiologists were blinded to final pathological results; however, in seven studies, the readers were aware that patients had PCa (30–32, 40, 41, 45, 46). The study characteristics are summarized in Table 2.
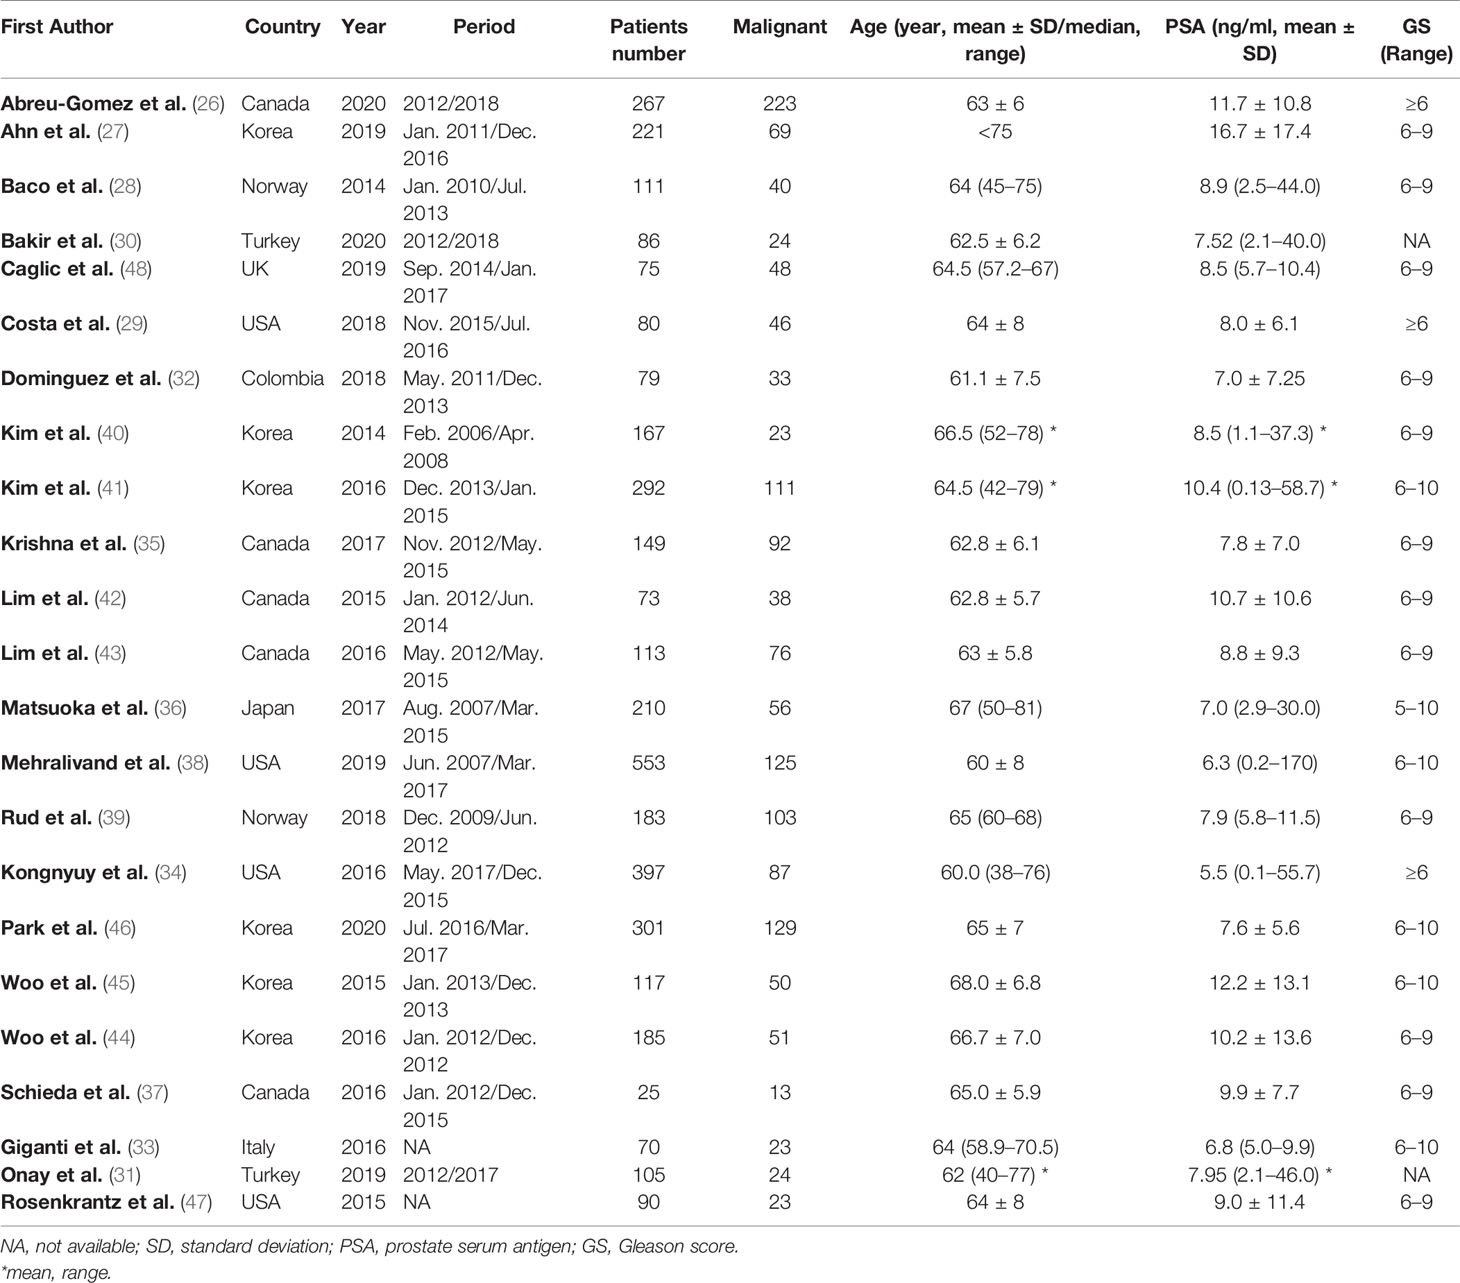
Table 1 Demographic characteristics of the included studies.
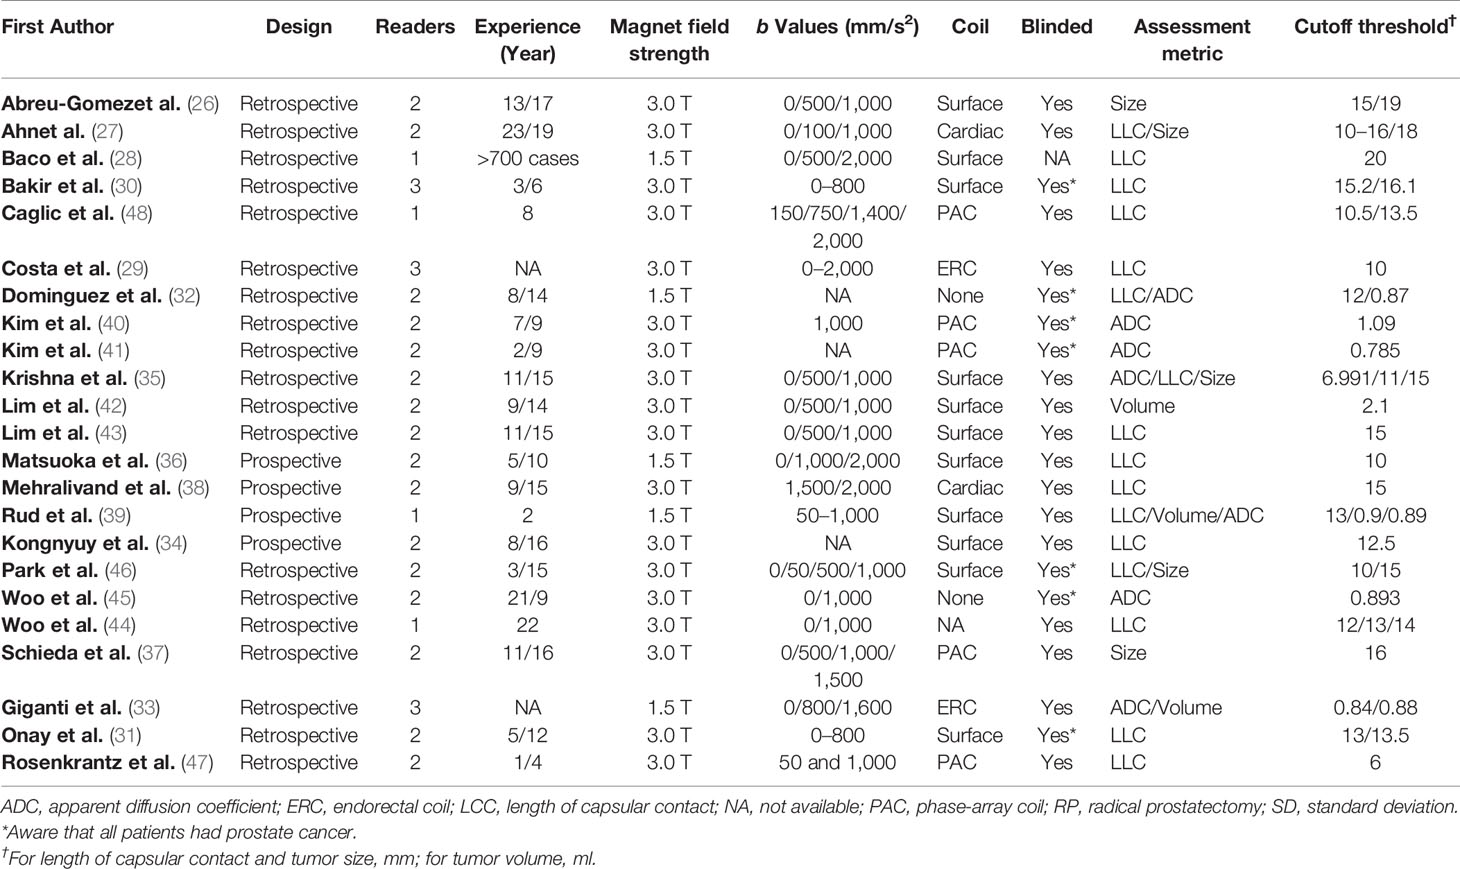
Table 2 Study Characteristics of Included Studies.
Quality Assessment
The overall quality of the included studies was not substantially high. Concerning the patient selection domain, there was generally high risk of bias because the majority of included studies were retrospective in design (34, 36, 38, 39). In four studies, patients who classified as PI-RADS score 1–3 were excluded (26, 27, 43, 48), and in two studies, the location was restricted to the anterior prostate cancer (27, 37). Regarding the index test domain, in seven studies the radiologists were aware that patients had biopsy-proven PCa but did not know the final pathological results (30–32, 40, 41, 45, 46). One study had a concern of applicability because the blinding was not reported explicitly (28). Concerning the flow and timing domain, all studies were scored as low risk of bias as patients received the same reference standard. Figure 2 shows the detailed quality assessment of included studies.

Figure 2 Grouped bar charts show the risk of bias and concerns for applicability of included studies.
Diagnostic Performance of Different Quantitative Methods
The pooled diagnostic performance of LCC, ADC, and tumor size for detection of EPE is demonstrated in Figure 3, and the HSROC curve is presented in Figure 4. Regarding LCC, the pooled sensitivity and specificity were 0.79 (95% CI 0.75–0.83, I2 = 67.8%) and 0.77 (95% CI 0.73–0.80, I2 = 89.3%), with area under HSROC curve of 0.67 (95% CI 0.60–0.73). For ADC, the pooled sensitivity and specificity were 0.71 (95% CI 0.50–0.86, I2 = 92.7%) and 0.71 (95% CI 059–0.81, I2 = 77.2%), with area under HSROC curve of 0.77 (95% CI 0.73–0.80). Regarding tumor size, the pooled sensitivity and specificity were 0.62 (95% CI 0.57–0.67, I2 = 19.8%) and 0.75 (95% CI 0.67–0.82, I2 = 82.4%), with area under HSROC curve of 0.70 (95% CI 0.66–0.74). As for tumor volume, the pooled sensitivity and specificity were 0.77 (95% CI 0.68–0.84) and 0.72 (95% CI 0.56–0.83), with area under HSROC curve of 0.78 (95% CI 0.73–0.97). The Deeks’ funnel plot and asymmetry test demonstrated that there was no significant probability of publication bias regarding the four quantitative metrics, with P values ranging from 0.34 to 0.93 (Figure 5).
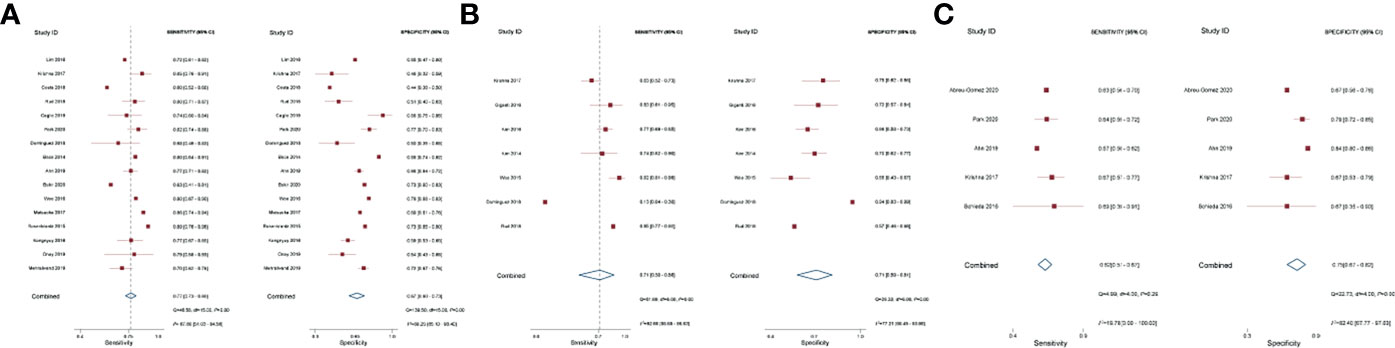
Figure 3 Coupled forest plot of pooled sensitivity and specificity. Numbers are pooled estimates with 95% CI in parentheses. Corresponding heterogeneity statistics are provided at bottom right corners. Horizontal lines indicate 95% confidence intervals. (A) Length of capsular contact; (B) apparent diffusion coefficient; (C) tumor size.
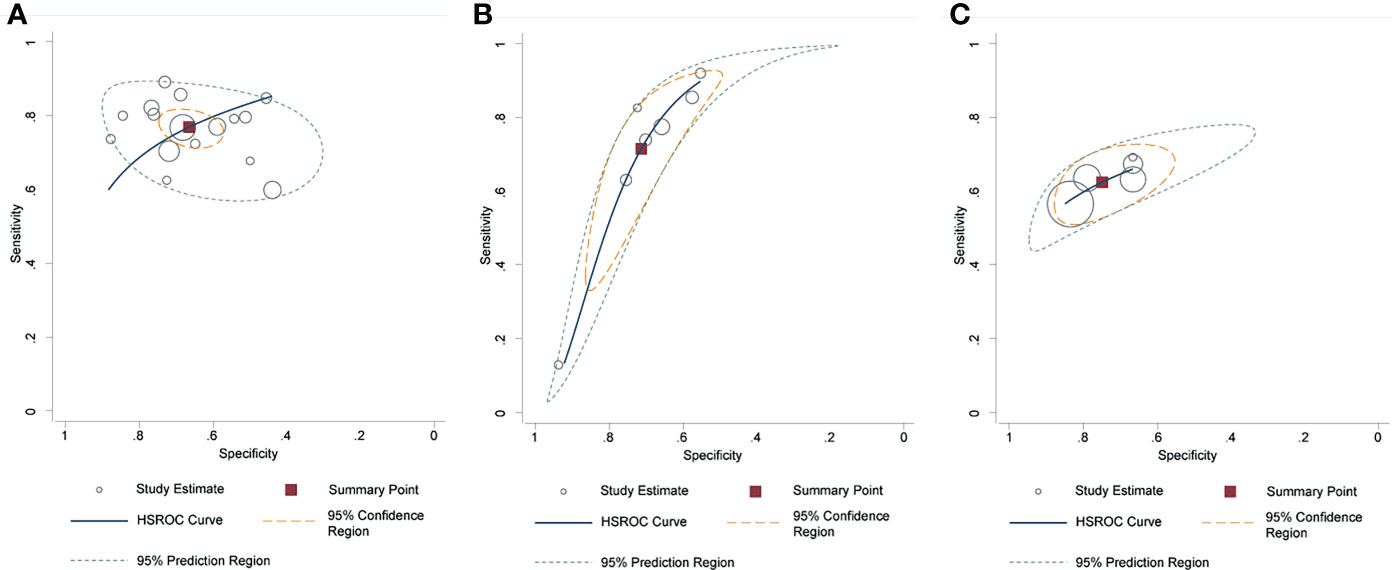
Figure 4 Hierarchic summary receiver operating characteristic plots with summary point and 95% confidence area for the overall. (A) length of capsular contact; (B) apparent diffusion coefficient; (C) tumor size.
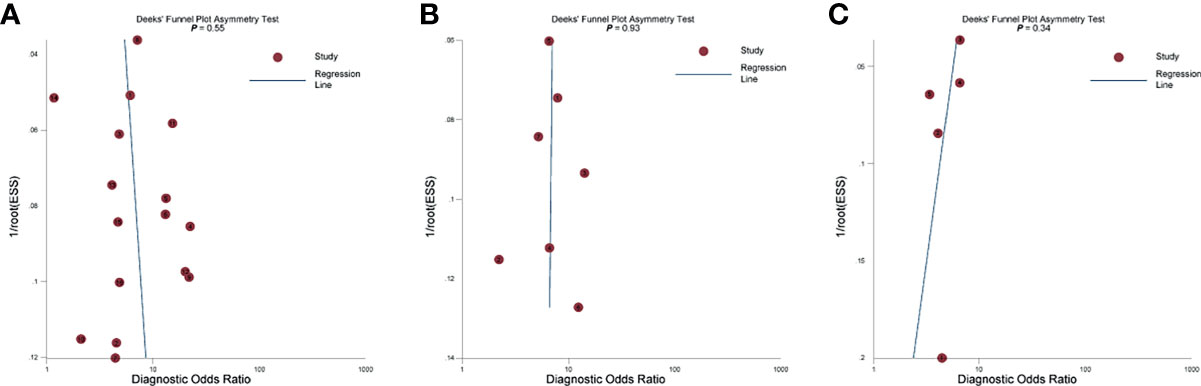
Figure 5 The Deeks’ funnel plot. (A) Length of capsular contact; (B) apparent diffusion coefficient; (C) tumor size.
We performed direct comparisons between different quantitative metrics in studies providing head-to-head comparisons. Concerning LCC vs. ADC, the pooled summary estimates based on three studies revealed that LCC yielded significantly higher specificity as compared to ADC (0.49 vs. 0.79, P=0.047); however, there was no significant difference in sensitivity (0.79 vs. 0.55, P=0.22) (32, 35, 39). As for LCC vs. tumor size, the pooled summary estimates based on three studies indicated that LCC yielded significantly higher sensitivity as compared to tumor size (0.80 vs. 0.60, P=0.003), but at the cost of decreased specificity (0.65 vs. 0.78, P=0.13) (27, 35, 46). In indirect comparisons, we noted that the pooled sensitivity of LCC and tumor volume was significantly higher than tumor size, with P values of 0.002 and 0.013, respectively. Additionally, the pooled specificity for tumor volume was significantly higher than tumor size (P=0.04). Otherwise, the indirect comparisons did not identify any statistically significant differences between these four quantitative metrics (Supplementary Table 1).
Subgroup Analysis and Meta-Regression
In view of different cutoff thresholds were used, we performed multiple subgroup analyses to evaluate various clinical settings. Regarding the tumor size, the pooled sensitivity and specificity were 0.72 (95% CI 0.47–0.89) and 0.70 (95% CI 0.56–0.82) for four studies using 15 mm as the cutoff threshold (26, 27, 35, 46). Regarding the ADC, the pooled sensitivity and specificity were 0.67 (95% CI 0.62–0.72) and 0.70 (95% CI 0.63–0.76) for six studies using ADC mean value (32, 33, 39–41). Regarding the LCC, the pooled sensitivity and specificity for six studies using a cutoff threshold ≤10 mm were 0.78 (95% CI 0.71–0.84) and 0.67 (95% CI 0.59–0.75), for 11 studies using a cutoff threshold ≤12 mm were 0.78 (95% CI 0.73–0.83) and 0.67 (95% CI 0.60–0.74), for 20 studies using a cutoff threshold >10 mm were 0.74 (95% CI 0.70–0.78) and 0.68 (95% CI 0.62–0.74), for 15 studies using a cutoff threshold >12 mm were 0.73 (95% CI 0.68–0.77) and 0.69 (95% CI 0.61–0.75).
As considerable heterogeneity existed among included studies, we performed meta-regression to investigate the sources. Concerning studies using LCC, only publication year (≤2017 vs. >2017, P=0.02) was significantly associated with heterogeneity. Other factors such as length of LCC (≤10 vs. >10 mm and ≤12 vs. >12 mm), malignant rate (≤30 vs. >30%), study design (prospective vs. retrospective), magnet field strength (1.5 vs. 3.0 T), number of readers (<2 vs. ≥2), number of patients (≤150 vs. >150), and the publication year (≤2017 vs. >2017) were not significant factors contributing to heterogeneity, with P ranging from 0.11 to 0.96. For studies using other quantitative metrics, no significant factor was found substantially associated with heterogeneity, which are demonstrated in Supplementary Table 2.
Discussion
In this meta-analysis, we investigated the diagnostic performance of several quantitative metrics with mpMRI for prediction of EPE at radical prostatectomy. The summary estimates of sensitivity and specificity for 16 studies using LCC were 0.79 (95% CI 0.75–0.83) and 0.77 (95% CI 0.73–0.80), for seven studies using ADC were 0.71 (95% CI 0.50–0.86) and 0.71 (95% CI 059–0.81), for five studies using tumor size were 0.62 (95% CI 0.57–0.67) and 0.75 (95% CI 0.67–0.82), and for three studies using tumor volume were 0.77 (95% CI 0.68–0.84) and 0.72 (95% CI 0.56–0.83), respectively. As considerable heterogeneity was observed between studies, we performed meta-regression to explore the sources. Among the several potential factors, we found that only publication year (≤2017 vs. >2017) was the significant factor responsible for heterogeneity (P=0.02). As several studies provided head-to-head comparison between LCC and ADC, as well as between LCC and tumor size, we performed direct comparison in available studies. According to our analyses, LCC was significantly inferior to ADC in specificity but was superior to tumor size in sensitivity; nevertheless, both comparisons were based on merely three studies and need more large-sample studies to validate in future.
LLC is defined as the length of prostate tumor in contact with the capsule, and the rationale behind which is that greater LCC on histopathology correlates with higher probability of EPE (49). A prior meta-analysis investigated the diagnostic accuracy of using LCC as independent predictor for detection of EPE, in which the pooled sensitivity and specificity were 0.79 and 0.67 (50). As for ADC, studies revealed that as tumor grade increases, a trend of increasing cellular density, with loss of the normal glandular structures and a decrease in the extracellular space, limiting water diffusivity and yielding lower ADC values (51, 52). ADC value has been shown to inversely correlate with pathological stage (42, 53), and a previous study demonstrated that when combining ADC value with other clinical information, the pooled sensitivity and specificity were 0.85 and 0.71 (54). The rationale of using tumor volume as predictor of EPE is based on findings that the diameter of the index lesion has a strong correlation with tumor volume at radical prostatectomy (42, 55). We performed indirect comparisons between these quantitative metrics, and the results demonstrated that the pooled sensitivity from tumor size was significantly lower than LCC (P=0.002) and tumor volume (P=0.013). Moreover, our analyses showed that the pooled specificity in tumor size was substantially lower than tumor size (P=0.04). However, these results were obtained from indirect comparisons thus should be interpreted with caution.
Considering that different cutoff thresholds were used with respect to LCC and tumor size, multiple subgroup analyses were performed to account for various outcomes. When restricted subgroup analysis to six studies using a cutoff value ≤10 mm, the pooled sensitivity and specificity were 0.78 and 0.67. In contrast, a cutoff value >10 mm yielded slightly lower sensitivity (0.74) and equivalent specificity (0.68). Likewise, a cutoff threshold ≤12 mm yielded an equivalent diagnostic performance as compared with >12 mm, with sensitivity of 0.78 vs. 0.73 and specificity of 0.67 vs. 0.69. As for the tumor size, subgroup analysis suggested that using a tumor size of 15 mm yield a moderate diagnostic performance, with sensitivity of 0.67 and specificity of 0.70. When compared with the subjective assessment that mainly depends on radiologists’ personal pattern and experience, the quantitative analysis offers several potential advantages of improving accuracy, interobserver agreement, and histopathology correlation. However, different measurement methods and tools, as well as MRI techniques and sequences, all may affect the final results, then lead to widely varied optimal cutoff values (18, 19). Regarding LCC, the reported optimal cutoff values ranged from 6 to 20 mm, with corresponding sensitivity of 0.60–0.89 and specificity of 0.44–0.88. Nevertheless, no significant difference between these cutoff thresholds. As for tumor size, although the PI-RADS recommends 15 mm for prediction of EPE, two studies demonstrated that a cutoff value of 16–18 mm yielded the best diagnostic performance (27, 37). With regard to ADC, despite that most studies included used the mean value as the assessment, two studies reported that results from ADC ratio or ADC entropy were superior to ADC mean value for distinguishing malignant from benign (33, 35). Using tumor volume as assessment for prediction of EPE was reported by merely three studies, which may be that it is often time-consuming and may require postprocessing on an independent workstation (33, 39, 43).
Our study has some limitations. First, most studies included were retrospective in study design, which resulted in a high risk regarding patient selection domain. Nevertheless, considering that nearly all studies available were retrospective, it was unfeasible to calculate summary estimates from the merely four prospective studies. Second, the heterogeneity was substantial among studies, which affected the general applicability of our study. We performed meta-regression and multiple subgroup analyses to explore the sources of heterogeneity; however, we found that most clinical covariates were not associated with the heterogeneity, thus a large proportion of which remains unexplained. Nonetheless, we applied a solid and robust methodology for this meta-analysis using the guidelines published by the Cochrane Collaboration. Third, the diagnostic results were extracted from the most accurate results; moreover, the size or length was measured using different MRI sequences or techniques. Last, the comparisons were based on indirect or merely several studies; thus, the results should be interpreted with caution.
Conclusion
The mpMRI quantitative assessments of LCC, ADC, tumor size, and tumor volume showed moderate to high diagnostic performance in the prediction of EPE, of them LCC and tumor volume demonstrated higher accuracy than other assessments. However, the optimal cutoff threshold varied widely and should be established to apply them in clinical practice.
Data Availability Statement
The original contributions presented in the study are included in the article/Supplementary Material. Further inquiries can be directed to the corresponding author.
Author Contributions
Guarantor of the article: HTX. Conception and design: WL and YS. Collection and assembly of data: YMW and FL. Data analysis and interpretation: WL, YMW, and FL. All authors contributed to the article and approved the submitted version.
Funding
This study was supported by the Natural Science Foundation of Jiangsu Vocational College of Medicine (No. 20204112).
Conflict of Interest
The authors declare that the research was conducted in the absence of any commercial or financial relationships that could be construed as a potential conflict of interest.
Publisher’s Note
All claims expressed in this article are solely those of the authors and do not necessarily represent those of their affiliated organizations, or those of the publisher, the editors and the reviewers. Any product that may be evaluated in this article, or claim that may be made by its manufacturer, is not guaranteed or endorsed by the publisher.
Supplementary Material
The Supplementary Material for this article can be found online at: https://www.frontiersin.org/articles/10.3389/fonc.2021.771864/full#supplementary-material
References
1. Tollefson MK, Karnes RJ, Rangel LJ, Bergstralh EJ, Boorjian SA. The Impact of Clinical Stage on Prostate Cancer Survival Following Radical Prostatectomy. J Urol (2013) 189:1707–12. doi: 10.1016/j.juro.2012.11.065
2. Mikel Hubanks J, Boorjian SA, Frank I, Gettman MT, Houston Thompson R, Rangel LJ, et al. The Presence of Extracapsular Extension Is Associated With an Increased Risk of Death From Prostate Cancer After Radical Prostatectomy for Patients With Seminal Vesicle Invasion and Negative Lymph Nodes. Urol Oncol (2014) 32:26.e1–7. doi: 10.1016/j.urolonc.2012.09.002
3. Quinlan DM, Epstein JI, Carter BS, Walsh PC. Sexual Function Following Radical Prostatectomy: Influence of Preservation of Neurovascular Bundles. J Urol (1991) 145:998–1002. doi: 10.1016/s0022-5347(17)38512-9
4. Swindle P, Eastham JA, Ohori M, Kattan MW, Wheeler T, Maru N, et al. Do Margins Matter? The Prognostic Significance of Positive Surgical Margins in Radical Prostatectomy Specimens. J Urol (2008) 179:S47–51. doi: 10.1016/j.juro.2008.03.137
5. Avulova S, Zhao Z, Lee D, Huang L-C, Koyama T, Hoffman KE, et al. The Effect of Nerve Sparing Status on Sexual and Urinary Function: 3-Year Results From the CEASAR Study. J Urol (2018) 199:1202–9. doi: 10.1016/j.juro.2017.12.037
6. Eifler JB, Feng Z, Lin BM, Partin MT, Humphreys EB, Han M, et al. An Updated Prostate Cancer Staging Nomogram (Partin Tables) Based on Cases From 2006 to 2011. BJU Int (2013) 111:22–9. doi: 10.1111/j.1464-410X.2012.11324.x
7. Brajtbord JS, Leapman MS, Cooperberg MR. The CAPRA Score at 10 Years: Contemporary Perspectives and Analysis of Supporting Studies. Eur Urol (2017) 71:705–9. doi: 10.1016/j.eururo.2016.08.065
8. Ohori M, Kattan MW, Koh H, Maru N, Slawin KM, Shariat S, et al. Predicting the Presence and Side of Extracapsular Extension: A Nomogram for Staging Prostate Cancer. J Urol (2004) 171:1844–9. doi: 10.1097/01.ju.0000121693.05077.3d
9. Augustin H, Fritz GA, Ehammer T, Auprich M, Pummer K. Accuracy of 3-Tesla Magnetic Resonance Imaging for the Staging of Prostate Cancer in Comparison to the Partin Tables. Acta Radiol (2009) 50:562–9. doi: 10.1080/02841850902889846
10. Gupta RT, Faridi KF, Singh AA, Passoni NM, Garcia-Reyes K, Madden JF, et al. Comparing 3-T Multiparametric MRI and the Partin Tables to Predict Organ-Confined Prostate Cancer After Radical Prostatectomy. Urol Oncol Semin Orig Investig (2014) 32:1292–9. doi: 10.1016/j.urolonc.2014.04.017
11. Barentsz JO, Richenberg J, Clements R, Choyke P, Verma S, Villeirs G, et al. ESUR Prostate MR Guidelines 2012. Eur Radiol (2012) 22:746–57. doi: 10.1007/s00330-011-2377-y
12. Weinreb JC, Barentsz JO, Choyke PL, Cornud F, Haider MA, Macura KJ, et al. PI-RADS Prostate Imaging – Reporting and Data System: 2015, Version 2. Eur Urol (2016) 69:16–40. doi: 10.1016/j.eururo.2015.08.052
13. Turkbey B, Rosenkrantz AB, Haider MA, Padhani AR, Villeirs G, Macura KJ, et al. Prostate Imaging Reporting and Data System Version 2.1: 2019 Update of Prostate Imaging Reporting and Data System Version 2. Eur Urol (2019) 76:340–51. doi: 10.1016/j.eururo.2019.02.033
14. Hamoen EHJ, Rooij M, Witjes JA, Barentsz JO, Rovers MM. Use of the Prostate Imaging Reporting and Data System (PI-RADS) for Prostate Cancer Detection With Multiparametric Magnetic Resonance Imaging: A Diagnostic Meta-Analysis. Eur Urol (2015) 67:1112–21. doi: 10.1016/j.eururo.2014.10.033
15. Woo S, Suh CH, Kim SY, Cho JY, Kim SH. Diagnostic Performance of Prostate Imaging Reporting and Data System Version 2 for Detection of Prostate Cancer: A Systematic Review and Diagnostic Meta-Analysis. Eur Urol (2017) 72:177–88. doi: 10.1016/j.eururo.2017.01.042
16. Kayat Bittencourt L, Litjens G, Hulsbergen-van de Kaa CA, Turkbey B, Gasparetto EL, Barentsz JO. Prostate Cancer: The European Society of Urogenital Radiology Prostate Imaging Reporting and Data System Criteria for Predicting Extraprostatic Extension by Using 3-T Multiparametric MR Imaging. Radiology (2015) 276:479–89. doi: 10.1148/radiol.15141412
17. Schieda N, Quon JS, Lim C, El-Khodary M, Shabana W, Singh V, et al. Evaluation of the European Society of Urogenital Radiology (ESUR) PI-RADS Scoring System for Assessment of Extra-Prostatic Extension in Prostatic Carcinoma. Eur J Radiol (2015) 84:1843–8. doi: 10.1016/j.ejrad.2015.06.016
18. Schieda N, Lim CS, Zabihollahy F, Abreu-Gomez J, Krishna S, Woo S, et al. Quantitative Prostate MRI. J Magn Reson Imaging (2020) 53:1632–45. doi: 10.1002/jmri.27191
19. Shieh AC, Guler E, Ojili V, Paspulati RM, Elliott R, Ramaiya NH, et al. Extraprostatic Extension in Prostate Cancer: Primer for Radiologists. Abdom Radiol N Y (2020) 45:4040–51. doi: 10.1007/s00261-020-02555-x
20. Liberati A, Altman DG, Tetzlaff J, Mulrow C, Gøtzsche PC, Ioannidis JPA, et al. The PRISMA Statement for Reporting Systematic Reviews and Meta-Analyses of Studies That Evaluate Healthcare Interventions: Explanation and Elaboration. Epidemiol Biostat Public Health (2009) 6:e1–34. doi: 10.1136/bmj.b2700
21. Whiting PF. QUADAS-2: A Revised Tool for the Quality Assessment of Diagnostic Accuracy Studies. Ann Intern Med (2011) 155:529. doi: 10.7326/0003-4819-155-8-201110180-00009
22. Higgins JPT, Altman DG, Gøtzsche PC, Jüni P, Moher D, Oxman AD, et al. The Cochrane Collaboration’s Tool for Assessing Risk of Bias in Randomised Trials. BMJ (2011) 343:889–93. doi: 10.1136/bmj.d5928
23. Reitsma JB, Glas AS, Rutjes AWS, Scholten RJPM, Bossuyt PM, Zwinderman AH. Bivariate Analysis of Sensitivity and Specificity Produces Informative Summary Measures in Diagnostic Reviews. J Clin Epidemiol (2005) 58:982–90. doi: 10.1016/j.jclinepi.2005.02.022
24. Rutter CM, Gatsonis CA. A Hierarchical Regression Approach to Meta-Analysis of Diagnostic Test Accuracy Evaluations. Stat Med (2001) 20:2865–84. doi: 10.1002/sim.942
25. Deeks JJ. Systematic Reviews of Evaluations of Diagnostic and Screening Tests. BMJ (2001) 323:157–62. doi: 10.1136/bmj.323.7305.157
26. Abreu-Gomez J, Walker D, Alotaibi T, McInnes MDF, Flood TA, Schieda N. Effect of Observation Size and Apparent Diffusion Coefficient (ADC) Value in PI-RADS V2.1 Assessment Category 4 and 5 Observations Compared to Adverse Pathological Outcomes. Eur Radiol (2020) 30:4251–61. doi: 10.1007/s00330-020-06725-9
27. Ahn H, Hwang SI, Lee HJ, Suh HS, Choe G, Byun S-S, et al. Prediction of Extraprostatic Extension on Multi-Parametric Magnetic Resonance Imaging in Patients With Anterior Prostate Cancer. Eur Radiol (2020) 30:26–37. doi: 10.1007/s00330-019-06340-3
28. Baco E, Rud E, Vlatkovic L, Svindland A, Eggesbø HB, Hung AJ, et al. Predictive Value of Magnetic Resonance Imaging Determined Tumor Contact Length for Extracapsular Extension of Prostate Cancer. J Urol (2015) 193:466–72. doi: 10.1016/j.juro.2014.08.084
29. Costa DN, Passoni NM, Leyendecker JR, de Leon AD, Lotan Y, Roehrborn CG, et al. Diagnostic Utility of a Likert Scale Versus Qualitative Descriptors and Length of Capsular Contact for Determining Extraprostatic Tumor Extension at Multiparametric Prostate MRI. Am J Roentgenol (2018) 210:1066–72. doi: 10.2214/AJR.17.18849
30. Bakir B, Onay A, Vural M, Armutlu A, Yıldız SÖ, Esen T. Can Extraprostatic Extension Be Predicted by Tumor-Capsule Contact Length in Prostate Cancer? Relationship With International Society of Urological Pathology Grade Groups. AJR Am J Roentgenol (2020) 214:588–96. doi: 10.2214/AJR.19.21828
31. Onay A, Vural M, Armutlu A, Ozel Yıldız S, Kiremit MC, Esen T, et al. Evaluation of the Most Optimal Multiparametric Magnetic Resonance Imaging Sequence for Determining Pathological Length of Capsular Contact. Eur J Radiol (2019) 112:192–9. doi: 10.1016/j.ejrad.2019.01.020
32. Dominguez C, Plata M, Cataño J, Palau M, Aguirre D, Narvaez J, et al. Diagnostic Accuracy of Multiparametric Magnetic Resonance Imaging in Detecting Extracapsular Extension in Intermediate and High - Risk Prostate Cancer. Int Braz J Urol (2018) 44:688–96. doi: 10.1590/S1677-5538.IBJU.2016.0485
33. Giganti F, Coppola A, Ambrosi A, Ravelli S, Esposito A, Freschi M, et al. Apparent Diffusion Coefficient in the Evaluation of Side-Specific Extracapsular Extension in Prostate Cancer: Development and External Validation of a Nomogram of Clinical Use. Urol Oncol (2016) 34:291.e9–291.e17. doi: 10.1016/j.urolonc.2016.02.015
34. Kongnyuy M, Sidana A, George AK, Muthigi A, Iyer A, Ho R, et al. Tumor Contact With Prostate Capsule on Magnetic Resonance Imaging: A Potential Biomarker for Staging and Prognosis. Urol Oncol Semin Orig Investig (2016) 35:30.e1–30.e8. doi: 10.1016/j.urolonc.2016.07.013
35. Krishna S, Lim CS, Mcinnes MDF, Flood TA, Shabana WM, Lim RS, et al. Evaluation of MRI for Diagnosis of Extraprostatic Extension in Prostate Cancer. J Magn Reson Imaging (2017) 47:176–85. doi: 10.1002/jmri.25729/pdf
36. Matsuoka Y, Ishioka J, Tanaka H, Kimura T, Yoshida S, Saito K, et al. Impact of the Prostate Imaging Reporting and Data System, Version 2, on MRI Diagnosis for Extracapsular Extension of Prostate Cancer. Am J Roentgenol (2017) 209:W76–84. doi: 10.2214/AJR.16.17163
37. Schieda N, Lim CS, Idris M, Lim RS, Morash C, Breau RH, et al. MRI Assessment of Pathological Stage and Surgical Margins in Anterior Prostate Cancer (APC) Using Subjective and Quantitative Analysis. J Magn Reson Imaging (2017) 45:1296–303. doi: 10.1002/jmri.25510
38. Mehralivand S, Shih JH, Harmon S, Smith C, Bloom J, Czarniecki M, et al. A Grading System for the Assessment of Risk of Extraprostatic Extension of Prostate Cancer at Multiparametric MRI. Radiology (2019) 290:709–19. doi: 10.1148/radiol.2018181278
39. Rud E, Diep L, Baco E. A Prospective Study Evaluating Indirect MRI-Signs for the Prediction of Extraprostatic Disease in Patients With Prostate Cancer: Tumor Volume, Tumor Contact Length and Tumor Apparent Diffusion Coefficient. World J Urol (2018) 36:629–37. doi: 10.1007/s00345-018-2171-4
40. Kim CK, Park SY, Park JJ, Park BK. Diffusion-Weighted MRI as a Predictor of Extracapsular Extension in Prostate Cancer. AJR Am J Roentgenol (2014) 202:W270. doi: 10.2214/AJR.13.11333
41. Kim W, Kim CK, Park JJ, Kim M, Kim J-H. Evaluation of Extracapsular Extension in Prostate Cancer Using Qualitative and Quantitative Multiparametric MRI. J Magn Reson Imaging (2017) 45:1760–70. doi: 10.1002/jmri.25515
42. Lim C, Flood TA, Hakim SW, Shabana WM, Quon JS, Elkhodary M, et al. Evaluation of Apparent Diffusion Coefficient and MR Volumetry as Independent Associative Factors for Extra-Prostatic Extension (EPE) in Prostatic Carcinoma. J Magn Reson Imaging (2016) 43:726–36. doi: 10.1002/jmri.25033
43. Lim CS, McInnes MDF, Lim RS, Breau RH, Flood TA, Krishna S, et al. Prognostic Value of Prostate Imaging and Data Reporting System (PI-RADS) V. 2 Assessment Categories 4 and 5 Compared to Histopathological Outcomes After Radical Prostatectomy. J Magn Reson Imaging (2016) 46:257–66. doi: 10.1002/jmri.25539
44. Woo S, Kim SY, Cho JY, Kim SH. Length of Capsular Contact on Prostate MRI as a Predictor of Extracapsular Extension: Which Is the Most Optimal Sequence? Acta Radiol (2017) 58:489–97. doi: 10.1177/0284185116658684
45. Woo S, Cho JY, Kim SY, Kim SH. Extracapsular Extension in Prostate Cancer: Added Value of Diffusion-Weighted MRI in Patients With Equivocal Findings on T2-Weighted Imaging. AJR Am J Roentgenol (2015) 204:W168–175. doi: 10.2214/AJR.14.12939
46. Park KJ, Kim M, Kim JK. Extraprostatic Tumor Extension: Comparison of Preoperative Multiparametric MRI Criteria and Histopathologic Correlation After Radical Prostatectomy. Radiology (2020) 296:192133. doi: 10.1148/radiol.2020192133
47. Rosenkrantz AB, Shanbhogue AK, Wang A, Kong MX, Babb JS, Taneja SS. Length of Capsular Contact for Diagnosing Extraprostatic Extension on Prostate MRI: Assessment at an Optimal Threshold. J Magn Reson Imaging (2016) 43:990–7. doi: 10.1002/jmri.25040
48. Caglic I, Povalej Brzan P, Warren AY, Bratt O, Shah N, Barrett T. Defining the Incremental Value of 3D T2-Weighted Imaging in the Assessment of Prostate Cancer Extracapsular Extension. Eur Radiol (2019) 29:5488–97. doi: 10.1007/s00330-019-06070-6
49. Ukimura O, Troncoso P, Ramirez EI, Babaian RJ. Prostate Cancer Staging: Correlation Between Ultrasound Determined Tumor Contact Length and Pathologically Confirmed Extraprostatic Extension. J Urol (1998) 159:1251–9. doi: 10.1016/S0022-5347(01)63575-4
50. Kim T-H, Woo S, Han S, Suh CH, Ghafoor S, Hricak H, et al. The Diagnostic Performance of the Length of Tumor Capsular Contact on MRI for Detecting Prostate Cancer Extraprostatic Extension: A Systematic Review and Meta-Analysis. Korean J Radiol (2020) 21:684–94. doi: 10.3348/kjr.2019.0842
51. Surov A, Meyer HJ, Wienke A. Correlations Between Apparent Diffusion Coefficient and Gleason Score in Prostate Cancer: A Systematic Review. Eur Urol Oncol (2020) 3:489–97. doi: 10.1016/j.euo.2018.12.006
52. Langer DL, van der Kwast TH, Evans AJ, Plotkin A, Trachtenberg J, Wilson BC, et al. Prostate Tissue Composition and MR Measurements: Investigating the Relationships Between ADC, T2, K(trans), V(E), and Corresponding Histologic Features. Radiology (2010) 255:485–94. doi: 10.1148/radiol.10091343
53. Lawrence EM, Gallagher FA, Barrett T, Warren AY, Priest AN, Goldman DA, et al. Preoperative 3-T Diffusion-Weighted MRI for the Qualitative and Quantitative Assessment of Extracapsular Extension in Patients With Intermediate- or High-Risk Prostate Cancer. Am J Roentgenol (2014) 203:W280–6. doi: 10.2214/AJR.13.11754
54. Bai K, Sun Y, Li W, Zhang L. Apparent Diffusion Coefficient in Extraprostatic Extension of Prostate Cancer: A Systematic Review and Diagnostic Meta-Analysis. Cancer Manag Res (2019) 11:3125–37. doi: 10.2147/CMAR.S191738
Keywords: magnetic resonance imaging, prostate neoplasms, quantitative, meta-analysis, tumor size
Citation: Li W, Sun Y, Wu Y, Lu F and Xu H (2021) The Quantitative Assessment of Using Multiparametric MRI for Prediction of Extraprostatic Extension in Patients Undergoing Radical Prostatectomy: A Systematic Review and Meta-Analysis. Front. Oncol. 11:771864. doi: 10.3389/fonc.2021.771864
Received: 07 September 2021; Accepted: 28 October 2021;
Published: 22 November 2021.
Edited by:
Shashwat Sharad, Center for Prostate Disease Research (CPDR), United StatesReviewed by:
Arie Carneiro, Albert Einstein Israelite Hospital, BrazilCedric Poyet, University Hospital Zürich, Switzerland
Copyright © 2021 Li, Sun, Wu, Lu and Xu. This is an open-access article distributed under the terms of the Creative Commons Attribution License (CC BY). The use, distribution or reproduction in other forums is permitted, provided the original author(s) and the copyright owner(s) are credited and that the original publication in this journal is cited, in accordance with accepted academic practice. No use, distribution or reproduction is permitted which does not comply with these terms.
*Correspondence: Hongtao Xu, hfjs2000@outlook.com