 Qian Wang
 Lingling Zhuang
 Qi Chen
- Department of Gynecology and Obstetrics, The Second Affiliated Hospital of Nanchang University, Nanchang, China
Background: Cisplatin (DDP) resistance remains a key challenge in improving the clinical outcome of patients with ovarian cancer (OC). Gli2 overexpression can lead to DDP resistance in OC cells, but the specific underlying regulatory mechanism remains unclear. The membrane transporter encoding gene MDR1 positively regulates chemotherapy resistance in various cancer types. We evaluated MDR1 as a potential Gli2 downstream target and the contribution of the Gli2/MDR1 axis in promoting DDP resistance in OC cells.
Methods: To generate drug-resistant SKOV3/DDP cells, SKOV3 cells were grown for six months under continuous induction wherein the DDP concentration was steadily increased. Gli2 expression in OC cells with varying DDP sensitivities was detected using western blot. Cell counting kit-8 assays were used to assess the DDP sensitivity of SKOV3, SKOV3/DDP, A2780, and A2780/DDP cells and reversal of DDP resistance in SKOV3/DDP and A2780/DDP cells. Cell proliferation was analyzed using 5-ethynyl-2′-deoxyuridine (EdU) incorporation assays. The transcriptional regulation of MDR1 by Gli2 was determined using luciferase reporter assays. Finally, xenograft OC tumors were generated in nude mice, which were then treated with intraperitoneal DDP or phosphate-buffered saline (PBS) injections to investigate if Gli2 affected DDP resistance in OC in vivo.
Results: DDP-resistant SKOV3/DDP and A2780/DDP cells showed higher expression of Gli2 and MDR1 as compared with that in DDP-sensitive OC cells. Gli2 knockdown in SKOV3/DDP cells significantly reduced MDR1 expression, whereas it increased DNA damage, thereby sensitizing OC cells to DDP. Similar results were obtained after targeting Gli2 expression with the Gli-antagonist 61 inhibitor (GANT61) in SKOV3/DDP and A2780/DDP cells. In cells stably overexpressing Gli2, treatment with gradient concentrations of verapamil, an MDR1 inhibitor, significantly inhibited MDR1 expression. Our findings indicate that downregulation of MDR1 expression may reverse OC cell resistance to DDP. Moreover, dual-luciferase reporter gene assays confirmed that MDR1 is a direct downstream target of Gli2, with Gli2 positively regulating MDR1 expression. Finally, subcutaneous xenotransplantation in nude mice demonstrated that Gli2 plays a key role in regulating OC drug resistance.
Conclusions: We identified a mechanism by which Hedgehog-Gli signaling regulates OC chemoresistance by modulating MDR1 expression. Hence, Gli2 and MDR1 are potential biomarkers and therapeutic targets in patients with chemoresistant OC.
Introduction
Ovarian cancer (OC) is the deadliest gynecological malignancy. For decades, cytoreductive surgery and platinum- or taxane-based combination chemotherapy have been the main treatment modalities for OC (1). Although the first response rate to first-line chemotherapy can be as high as 65–80%, drug resistance during later stages of chemotherapy leads to a high risk of recurrence, metastasis, and death (2–4). Chemoresistance is the most important clinical barrier in the treatment of OC (5). Particularly, cisplatin (DDP) resistance greatly impacts OC prognosis. Currently, platinum resistance is the primary challenge in treating OC (6, 7). Therefore, new biomarkers for early prediction of chemotherapy resistance and treatment strategies for reversing resistance are urgently needed.
In metazoans, the Hedgehog (Hh) signaling pathway is a critical regulator of embryonic development and homeostasis (8, 9). The Hh family in vertebrates consists of four main components: three secreted ligands (Sonic Hedgehog, Desert Hedgehog, and Indian Hedgehog), membrane receptor Patched (PTCH1–2), G-protein coupled transmembrane receptor Smoothened, and three glioma-associated oncogene (Gli1–3) transcription factors (10). In mammals, Gli2 is required for embryonic development (11).
Previous reports showed that the absence of Gli2 in mice can lead to embryonic death, whereas Gli1 is dispensable for the development or survival of the animals (11). Moreover, Hh signals play a critical role in chemotherapy resistance in several tumor types, including gynecologic malignancies (12–15).
Chemotherapy efficacy is frequently limited by the development of multidrug resistance (MDR) in cancer cells (16, 17). Thus, MDR is a major challenge in achieving favorable cancer treatment outcomes. Classical MDR is linked to increased expression of ATP-binding cassette transporters, which play a role in drug detoxification and protect tissues from exogenous substances (18, 19). Expression of multidrug resistance protein 1 encoding gene (MDR1, also known as ABCB1), which encodes MDR1 (also called P-glycoprotein), is one of the most important predictors of MDR to chemotherapy in several malignancies (20). During chemotherapy, tumors can acquire MDR against chemotherapy drugs by inducing the expression of MDR1 (21–24), which in turn confers drug resistance and inhibits targeted chemotherapy-induced cytotoxicity. Therefore, MDR1 activity can confer MDR in cancer cells and prevent the drug from reaching therapeutic concentrations in the target cells or organs, limiting its therapeutic effects.
Our previous studies revealed that compared with the parental strain, the Hh signaling pathway is abnormally activated, transcription factor Gli2 is abnormally expressed, and resistance to DDP is enhanced in DDP-resistant OC cells. However, the detailed molecular mechanism underlying DDP resistance remained unclear. In this study, we explored the specific mechanism underlying Gli2-mediated DDP resistance in OC. This study provides a foundation for developing strategies to improve the effectiveness of DDP chemotherapy for OC.
Materials and Methods
Reagents and Antibodies
DDP was purchased from Calbiochem (San Diego, CA, USA). The MDR1 inhibitor verapamil was purchased from Merck KGaA (Darmstadt, Germany). Gli antagonist 61 (GANT61), dimethyl sulfoxide, and polyethylenimine transfection reagent (cat. no. HY 13901, P8340 and 408727) were purchased from Sigma-Aldrich (St. Louis, MO, USA). Lipofectamine 2000 transfection reagent, penicillin/streptomycin, RIPA buffer, and the bicinchoninic acid protein assay kit (cat. no. 11668019, 15140122, 89900 and 23225) were procured from Thermo Fisher Scientific (Waltham, MA, USA). The Cell Counting Kit-8 (CCK-8; cat. no. C6005) was purchased from Everbright USA, Inc (Redmond, WA, USA). Puromycin (cat. no. P823025) was purchased from Solarbio (Beijing, China), and doxycycline (DOX) was purchased from Sangon Biotech (Shanghai, China). The primary antibody against phosphohistone H2AX (Ser139) (cat. no. 2577) was supplied by Cell Signaling Technology (Danvers, MA, USA). Anti-Gli2, anti-MDR1, anti-Bcl2, and anti-PCNA antibodies (cat. no. 18989-1-AP, 22336-1-AP, 12789-1-AP, and 10205-2-AP) were obtained from Proteintech (Rosemont, IL, USA). EMD Millipore (Billerica, MA, USA) supplied the anti-GAPDH antibody (cat. No. MAB374). Cell-Light EdU Apollo 567 kits (cat. no. C10310-1) were purchased from Guangzhou RiboBio Co. (Guangzhou, China).
Cell Culture and Establishment of DDP-Resistant Cell Lines
The human OC cell lines SKOV3 and ES-2 were obtained from the Chinese Academy of Sciences Cell Bank (Beijing, China), whereas A2780, A2780/DDP, and HEK293T cells were obtained from the American Type Culture Collection (Manassas, VA, USA). All cell lines were maintained at 37°C in a humidified atmosphere containing 5% CO2 in Dulbecco’s Modified Eagle’s Medium (cat. no. C11995500BT; Thermo Fisher Scientific) supplemented with 10% fetal bovine serum and 10 U/mL penicillin/streptomycin. Experiments were conducted using exponentially expanding cells. To produce DDP-resistant cells (SKOV3/DDP), escalating dosages of DDP, beginning at 50 ng/mL, were added to the culture media. Briefly, after the cells were treated with DDP (three-day treatment cycles), the culture medium was replaced with fresh medium devoid of drug for the following three days or one week until the cells recovered. Following the third cycle, the DDP dose was increased to a maximum of 1 µg/mL.
Lentivirus Transfection
The specific method of lentivirus (LV) transfection is detailed in our previous study (25).
Cell Transfection
Prof. Shiwen Luo and Prof. Yong Li of the First Affiliated Hospital of Nanchang University (Nanchang, China) generously donated the pCMV6-Entry-Gli2-Myc vector carrying the human Gli2 sequence (GenBank accession no. NM_005270) and corresponding empty vector (26). The SKOV3/DDP cells were seeded into a 6-well plate and cultured until a confluence of 70–80% was reached. According to the manufacturer’s protocol, Lipofectamine 2000 was used to transfect SKOV3/DDP cells with 2 µg of either pCMV6-Entry-Gli2-Myc or empty plasmids. After 3–6 h, the culture medium was replaced, and the cells were cultured for additional 24–48 h.
Cell Viability and Chemosensitivity Assay
SKOV3/DDP, A2780/DDP, and ES-2 cells were seeded into 96-well plates (2,000 cells/100 µL medium/well). After 24 h culture, the medium was replaced with fresh medium containing varying concentrations of DDP (0–10 µg/M for SKOV3/DDP, 0–64 µg/M for A2780/DDP) and the procedure was repeated in triplicate. Untreated cells served as negative controls. After 48 h, viability was assessed using the CCK-8 assay according to the manufacturer’s instructions, and optical density was measured using an automated microplate reader. The 50% maximum inhibitory concentration (IC50), which is the concentration at which cell growth decreased by 50% compared with control cell growth, was calculated using the GraphPad Prism 7.0 software (GraphPad, Inc., San Diego, CA, USA).
Cell Proliferation Assays
Logarithmic growing cells were collected and seeded into 96-well plates (8,000 cells/well). After 48 h, the medium was replaced with fresh medium containing 50 μM 5-ethynyl-2′-deoxyuridine (EdU), and the cells were incubated at 37°C for 1 h. The cell-Light EdU experiment was conducted according to the manufacturer’s instructions. Three biological replicates of each treatment were performed, and three fields of cells were counted in each well. Images were obtained using an inverted fluorescent microscope (IX71; Olympus, Tokyo, Japan), and data were analyzed using the ImageJ software (https://imagej.nih.gov/ij/index.html; National Institutes of Health, Bethesda, MD, USA).
Western Blot (WB) Analysis
RIPA buffer and the bicinchoninic acid kit were used for total protein extraction and quantification, respectively. The samples denatured at 100°C for 10 min, and 20–100 µg of protein/sample was electrophoretically separated on a 8–12% polyacrylamide gel. The proteins were then transferred onto a nitrocellulose membrane (cat. no. IPVH00010; EMD Millipore). The membrane was blocked with 5% skimmed milk for 1 h at 4°C, and then incubated for 12–16 h at 4°C with the following primary antibodies: rabbit polyclonal anti-Gli2 (1:500 dilution), rabbit polyclonal anti-MDR1 (1:1,000 dilution), rabbit polyclonal anti-γH2AX (1:2,500 dilution), rabbit polyclonal anti-PCNA (1:5,000 dilution), rabbit polyclonal anti-Bcl2 (1:2,000 dilution), and mouse monoclonal anti-GAPDH (1:2,500 dilution). Then, the membrane was incubated with horseradish peroxidase-conjugated anti-rabbit and anti-mouse secondary antibodies at 37°C for 30 min. The protein bands were visualized by exposing the membrane to X-ray film, and the band density was analyzed using the ImageJ software. Each experiment was performed at least three times.
Dual-Luciferase Reporter Assay
The promoter region of MDR1 was identified based on data obtained from the National Center for Biotechnology Information (https://www.ncbi.nlm.nih.gov/). Moreover, the JASPAR tool (http://motifmap.ics.uci.edu/) was used to predict the Gli2-binding site (GBS) in the MDR1 sequence. A human genomic DNA template was used to amplify the human MDR1 promoter, which was then cloned into the pGL4.20 empty vector (Promega, Madison, WI, USA). To further evaluate the functional GBS, we used a mutagenesis kit (SMK-101, Toyobo, Osaka, Japan) to introduce a point mutation in the predicted GBS. The luciferase reporter gene plasmid was successfully constructed and co-transfected into HEK293T cells as follows: Gli2 expression plasmid (0.5 μg), pGL4.20-MDR1-luci luciferase reporter gene plasmid (0.5 μg), and pRL-TK plasmid used as internal reference (0.025 μg). Studies have shown that the activation of the Bcl2 promoter in response to Hh/Gli signal transduction is predominantly mediated by Gli2 (27). Therefore, we used Bcl2 as a positive control. After 48 h, the cells were collected and analyzed according to the manufacturer’s instructions using the dual-luciferase reporter gene detection system (Promega). The luciferase activity was standardized to the respective Renilla luciferase activity (internal control). Each transfection experiment was repeated at least three times, and each sample was examined three times in duplicate.
In Vivo Ovarian Cancer Xenotransplant
All animal-related experiments were performed in accordance with the Guidelines for the Care and Use of Experimental Animals and authorized by the Nanchang University Institutional Animal Care and Use Committee and regional authorities. Nude mice (6–8 weeks old, 16–18 g; n = 10) were purchased from SLAC Laboratory Animal Co. (Hunan, China). To investigate the effect of Gli2 signaling on DDP resistance in OC in vivo, 1 × 10⁷ SKOV3 sh- control or sh-Gli2 cells were injected into the flanks of the mice. Tumor growth began four days later. After the tumor was observed, DOX was added to the drinking water of mice at a final concentration of 2 mg/mL. The xenografted tumor size and mouse body weight were measured every two days. The tumor volume was calculated according to the following formula: 0.5 × L × W2, where L is the tumor size at the longest point and W is the tumor size at the widest point. To evaluate drug resistance in vivo, xenotransplanted mice were randomly allocated to one of two groups (n = 5 per group) to receive intraperitoneal injections of DDP (4 mg/kg) or PBS (control group) twice per week for 12 days. On day 32, the animals were euthanized with an anesthetic overdose and the tumors were resected, weighed, and stored until further analysis.
Immunohistochemical (IHC) Analysis
Tumor tissues collected from mice were fixed in 10% neutral-buffered formalin solution, dried, and embedded in paraffin blocks, which were subsequently cut into 3-μm-thick sections for IHC staining (28).
Statistical Analysis
All statistical analyses were performed using the GraphPad Prism 7.0 software. The unpaired Student’s t-test was performed for comparisons between two experimental groups, and one-way analysis of variance was used for comparisons among three or more groups. Unless otherwise specified, all data from biological triplicates were averaged, and values are presented as the means ± standard deviation. A P value of < 0.05 was considered statistically significant. The ImageJ software was used to quantify the experimental data.
Results
Gli2 Expression Is Upregulated in DDP-Resistant OC Cells
First, stepwise selection of SKOV3 cells cultured in growth media with increasing DDP concentrations was performed to establish DDP-resistant OC cells (SKOV3/DDP). The IC50 values of wild-type SKOV3 and SKOV3/DDP cells grown for approximately six months in media containing 1 µg/mL DDP were compared. Notably, a 7-fold increase in the IC50 of DDP was observed for SKOV3/DDP cells compared with that for wild-type cells (Figure 1D), confirming the successful establishment of DDP-resistant OC cells. A2780 and A2780/DDP cells are well-known paired DDP-sensitive and DDP-resistant cell lines (29). Compared with A2780 cells, A2780/DDP cells had a 5-fold increase in DDP resistance (Figure 1E). The expression of Gli2 was upregulated and the expression of MDR1 was increased in SKOV3/DDP and A2780/DDP cells, whereas the level of DNA damage-associated γH2AX was reduced (Figures 1A–C). These results suggest that dysregulated transcription factor Gli2 is involved in OC DDP resistance. Next, the cells were treated with 0.5 µg/mL DDP for 48 h and EdU proliferation experiments were performed. Compared with the parental SKOV3 and A2780 cell lines, the proliferative ability of SKOV3/DDP and A2780/DDP cells was significantly enhanced (Figures 1F–I).
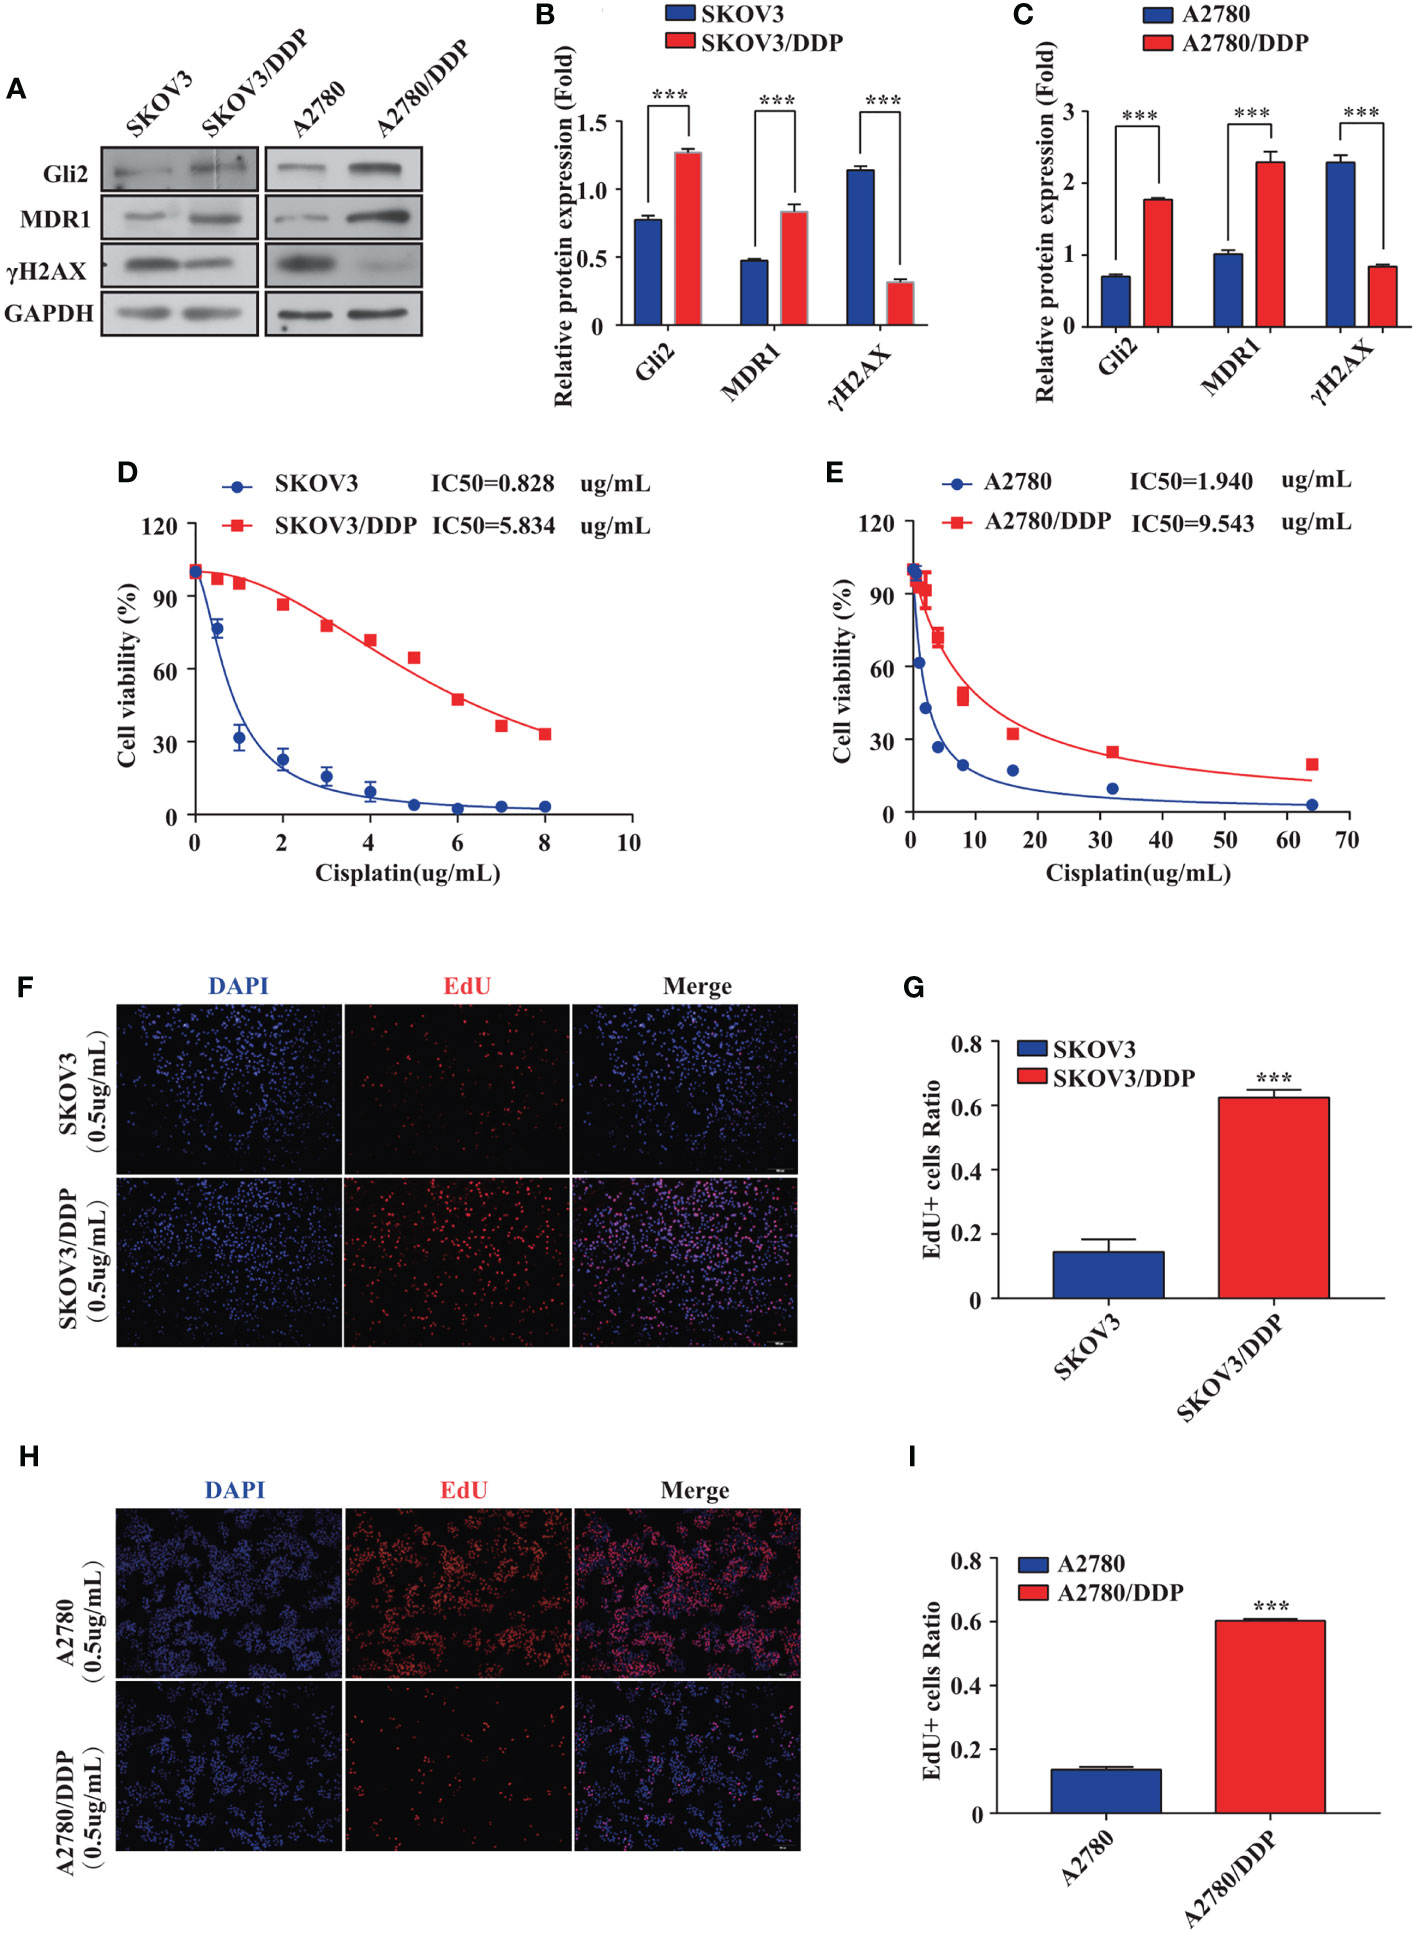
Figure 1 Gli2 is involved in ovarian cancer chemoresistance. (A–C) Western blot analysis of the expression of Gli2, MDR1 and γH2AX in SKOV3, SKOV3/DDP, A2780, and A2780/DDP cells. (D, E) Survival rates of SKOV3, SKOV3/DDP, A2780, and A2780/DDP cells after treatment with cisplatin (DDP) for 48 h detected using CCK-8 assays. (F, H) Proliferative capacity of SKOV3, SKOV3/DDP, A2780, and A2780/DDP cells after treatment with DDP for 48 h was identified using 5-ethynyl-2′-deoxyuridine (EdU) assays. (G, I) Bar chart of EdU-positive cells evaluated using the ImageJ software. ***P < 0.001.
Gli2 Knockdown Reverses DDP Resistance and Inhibits Proliferation of DDP-Resistant OC Cells
The impact of inhibiting Gli2 on OC cell DDP resistance was evaluated. SKOV3/DDP cells were transfected with Gli2 short hairpin RNAs (sh-Gli2 #1–5), which significantly downregulated Gli2 expression in SKOV3/DDP cells, particularly sh-Gli2 #3 and #5, as compared with sh-control transfected cells (Figures 2A, B). Therefore, cells transfected with sh-Gli2 #3 and #5 were selected for further analysis.
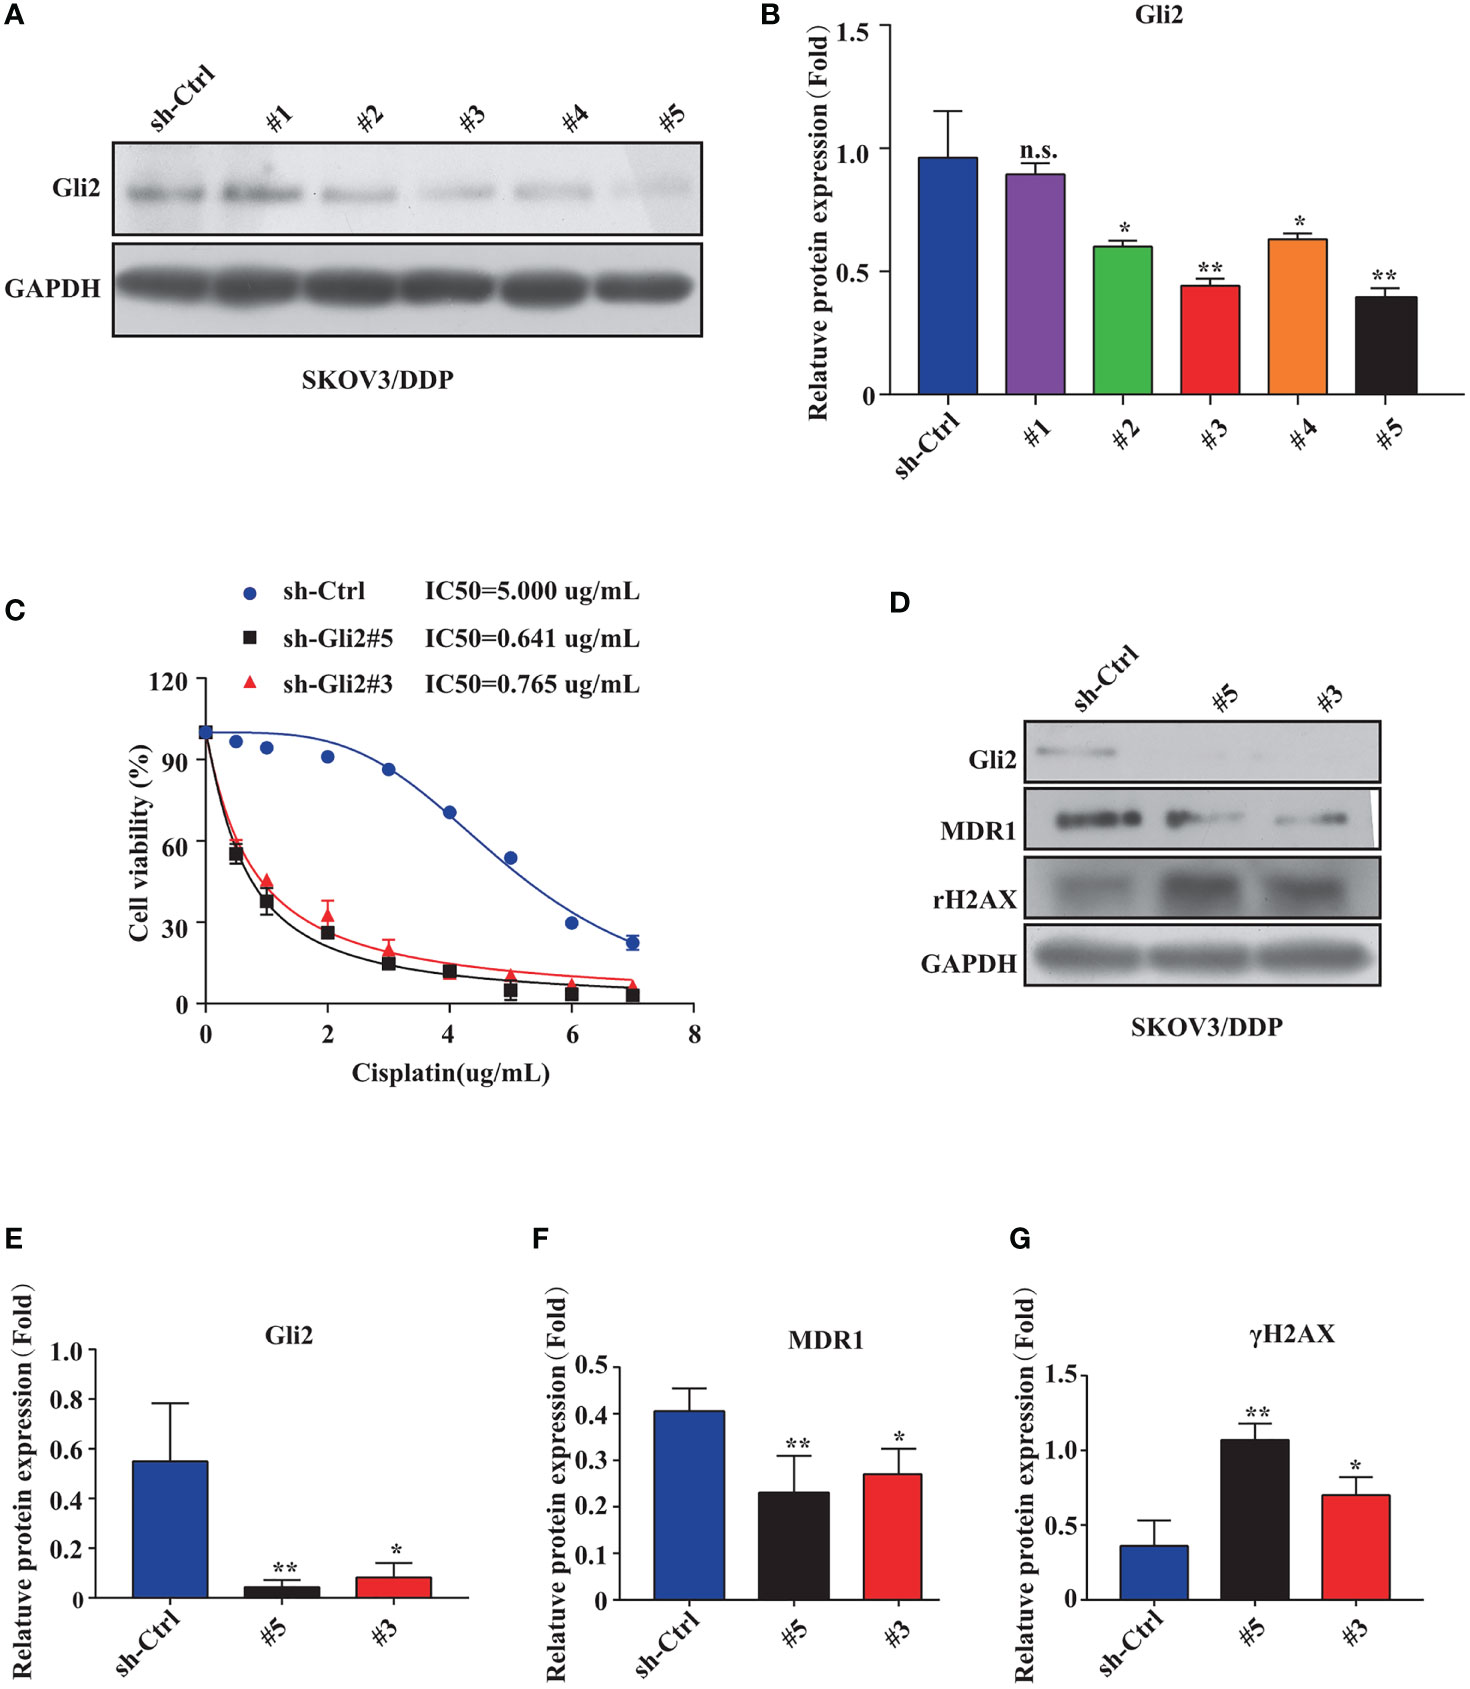
Figure 2 Gli2 knockdown reversed cisplatin (DDP) resistance and inhibited proliferation of DDP-resistant ovarian cancer cells. (A, B) Western blot analysis of the protein expression levels of Gli2 in different groups after Gli2 knockdown in SKOV3/DDP cells. (C) Survival rate and IC50 of SKOV3/DDP cells transfected with sh-control or sh-Gli2 #3 and #5 after 48 h DDP treatment determined using CCK-8 assays. (D–G) Western blot analysis of the expression levels of MDR1 and γH2AX in SKOV3/DDP cells transfected with empty plasmid or Gli2 specific short hairpin RNA following DDP treatment (0.5 µg/mL). n.s, not significant, * P < 0.05, **P < 0.01.
The mechanism of action of DDP is well-known. DDP induces DNA damage by combining with DNA molecules to form platinum-DNA adducts, leading to cytotoxicity and initiating apoptosis. DNA damage-induced apoptosis is an important anti-tumor mechanism of various drugs (30). γH2AX is a biomarker of DNA damage. When DNA is damaged, the expression of γH2AX is increased, whereas following damage repair, its expression is downregulated. Thus, the effect of sh-Gli2 on the cytotoxic effects of DDP in SKOV3/DDP cells was assessed by analyzing γH2AX expression. Furthermore, to detect the cytotoxic effects of DDP, a CCK-8 viability assay was performed. Overall, Gli2 knockdown significantly improved the efficacy of DDP treatment. The IC50 value for DDP in SKOV3/DDP cells (Figure 2C) decreased from 5.000 µg/mL for SKOV3/DDP cells to 0.641 and 0.765 µg/mL for sh-Gli2 #5 and #3 transfected cells, respectively, suggesting that Gli2 knockdown enhanced the sensitivity of SKOV3/DDP cells to DDP. Moreover, the WB results showed that Gli2 knockdown downregulated the expression of MDR1 in SKOV3/DDP cells compared with that in control cells. Because of the increased sensitivity of cells to DDP after downregulation of Gli2 expression, which resulted in increased DNA damage, the expression of γH2AX was significantly upregulated (Figures 2D–G). Consistently, similar results were obtained when Gli2 expression was inhibited with the Hh signaling pathway inhibitor GANT61, which specifically inhibits Gli, in SKOV3/DDP and A2780/DDP cells (Figures 3A–F). Moreover, EdU analysis showed that downregulation of Gli2 markedly inhibited the proliferation of SKOV3/DDP and A2780/DDP cells (Figures 3G–J). Collectively, these data indicate that inhibition of Gli2 expression reduces DDP resistance in DDP-resistant OC cells.
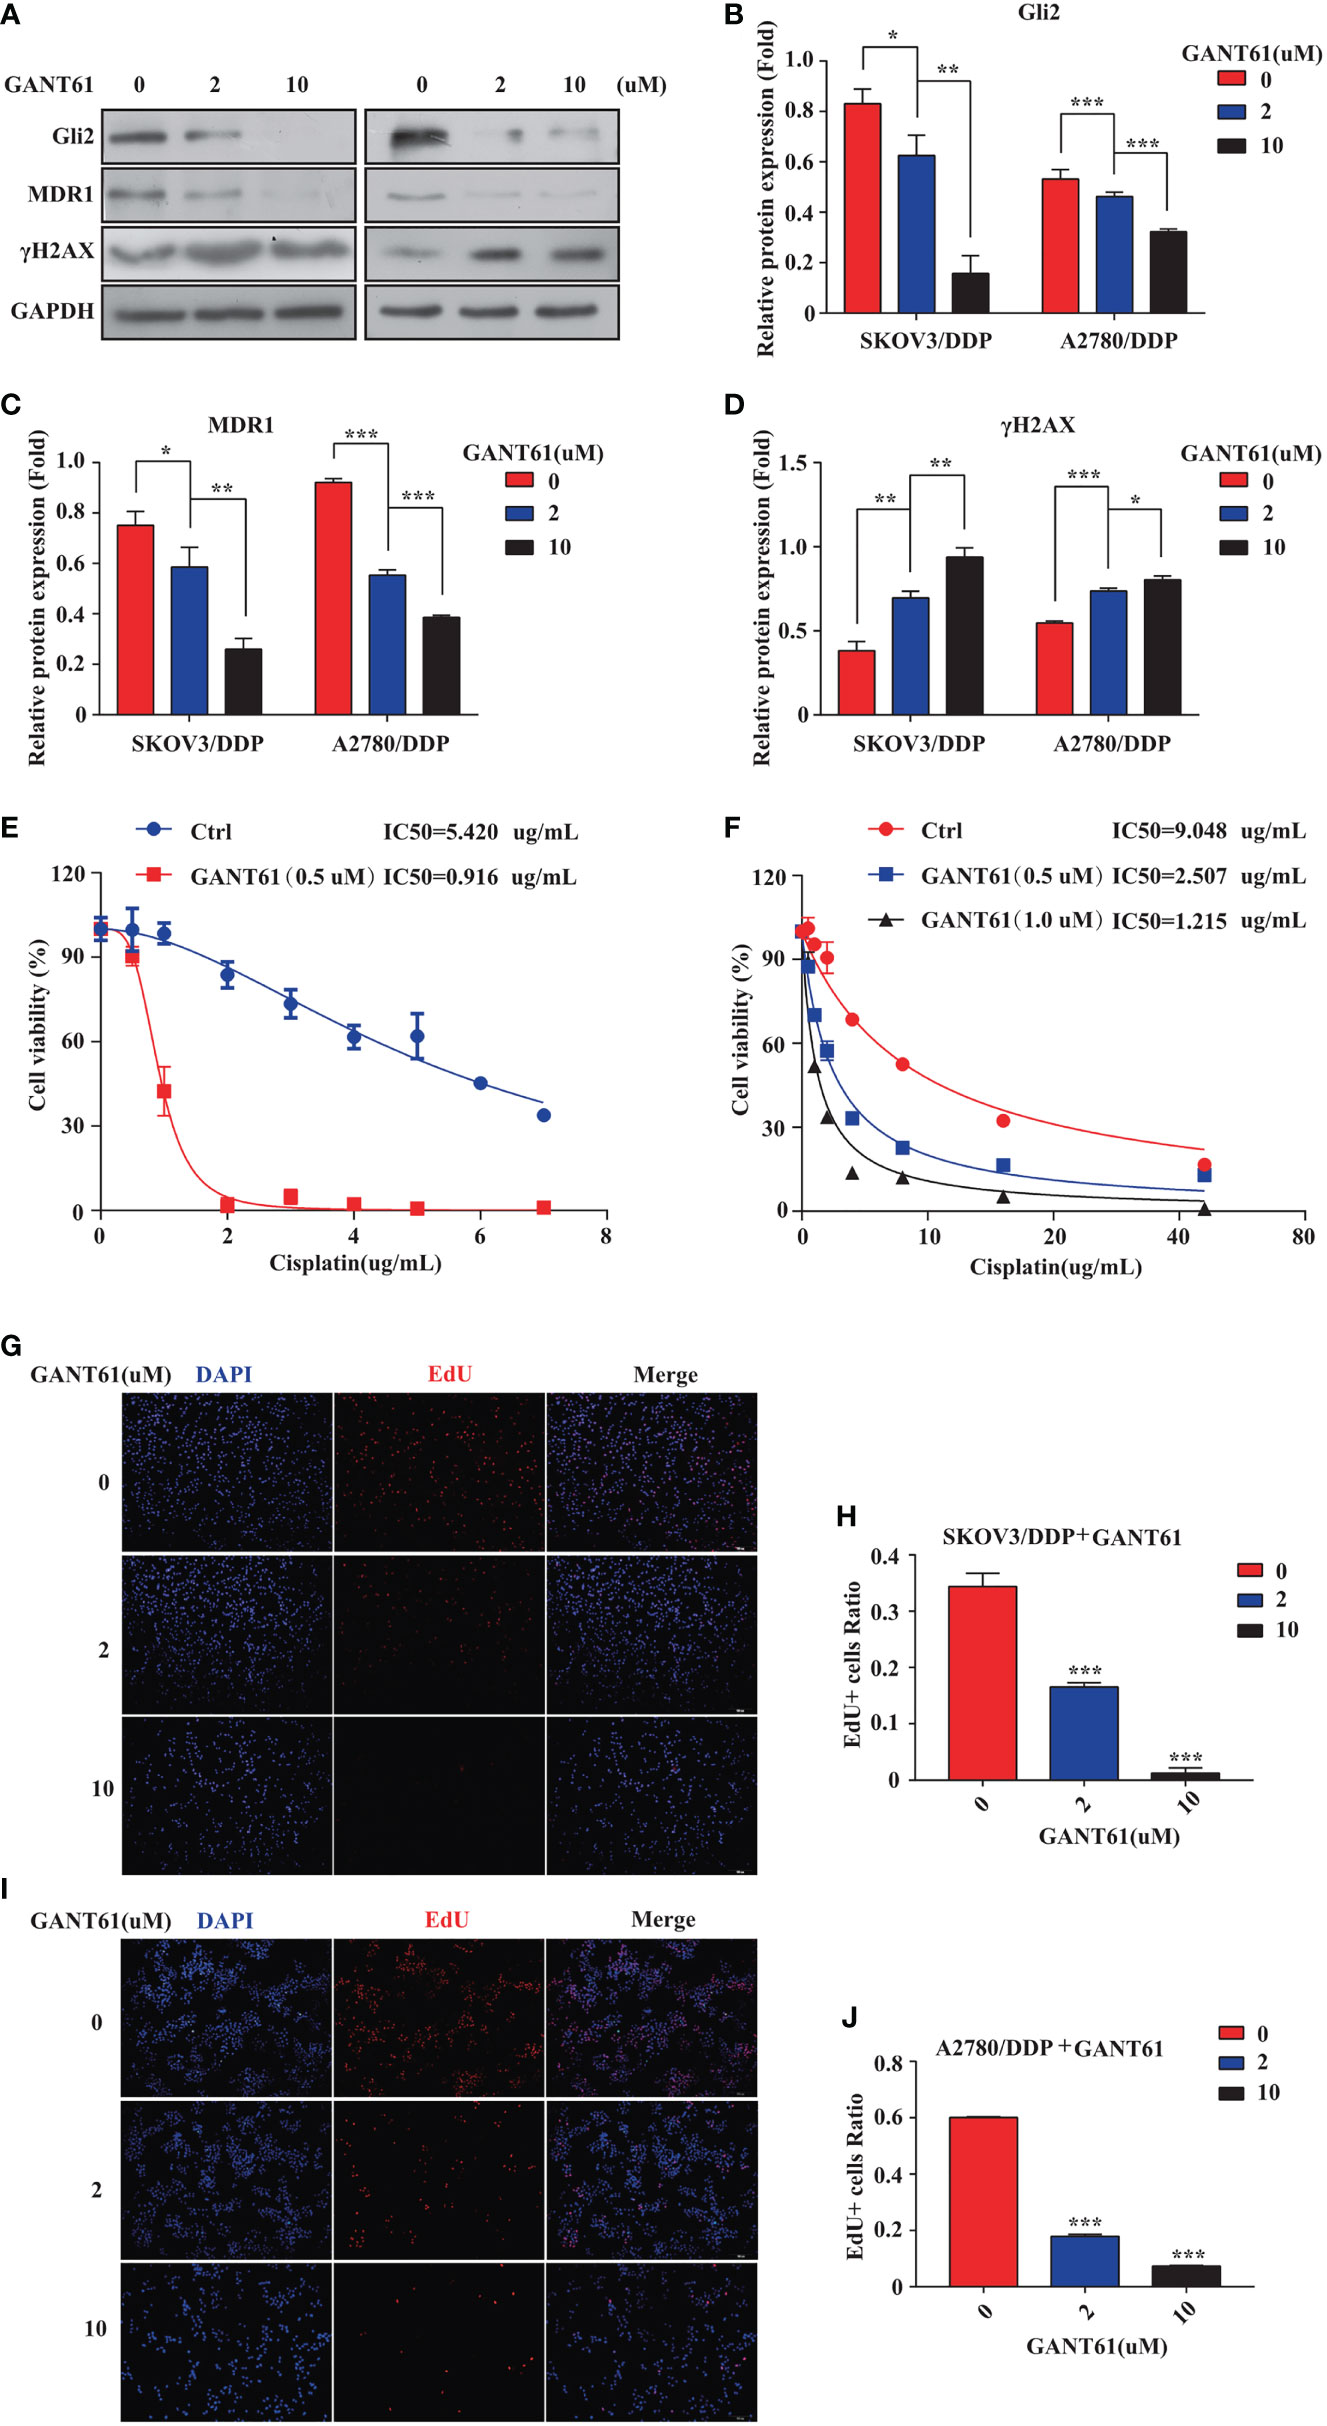
Figure 3 The Gli2 inhibitor promoted cell drug sensitivity and reduced the proliferative ability of cisplatin (DDP)-resistant ovarian cancer cells. (A–D) Western blot analysis of the protein expression levels of Gli2, MDR1, and γH2AX in SKOV3/DDP and A2780/DDP cells cultured with increasing concentrations of the Gli2 inhibitor Gli-antagonist 61 (GANT61) for 48 h. (E, F) Survival rate and IC50 of SKOV3/DDP and A2780/DDP cells after 48 h of treatment with GANT61 and DDP determined using CCK-8 assays. (G–J) Proliferation capacity was detected by EdU assay after inhibition of SKOV3/DDP and A2780/DDP cells. *P < 0.05, **P < 0.01, ***P < 0.001.
MDR1 Is Essential for DDP Resistance in OC
To further explore if MDR1 inhibition could reverse DDP resistance in OC cells, an ES-2 cell line stably overexpressing Gli2 was established (Figure 4A). Verapamil, a calcium channel-blocker and anti-arrhythmic drug, is a competitive inhibitor of MDR1 that does not directly compete for active site binding with MDR1 substrates but influences protein activity via allosteric inhibition (31–33). ES-2-LV-Gli2 cells treated with 5 μM verapamil showed a marked reversal of DDP resistance (Figure 4B), along with a 4-fold reduction in the IC50 value for DDP. Notably, after gradient addition of verapamil (0, 2, 4, 8, 16, and 20 μM) to the culture medium for combination treatment with DDP (0.5 µg/mL), the sensitivity of ES-2-LV-Gli2 cells to DDP increased with the increasing verapamil concentration compared with that in control cells. The WB results further showed that MDR1 expression was significantly downregulated and that DDP-induced DNA damage had increased (Figures 4C–E). Moreover, downregulation of MDR1 significantly inhibited ES-2-LV-Gli2 cell proliferation (Figures 4F, G). Thus, our results provided evidence that MDR1 expression is essential for DDP resistance.
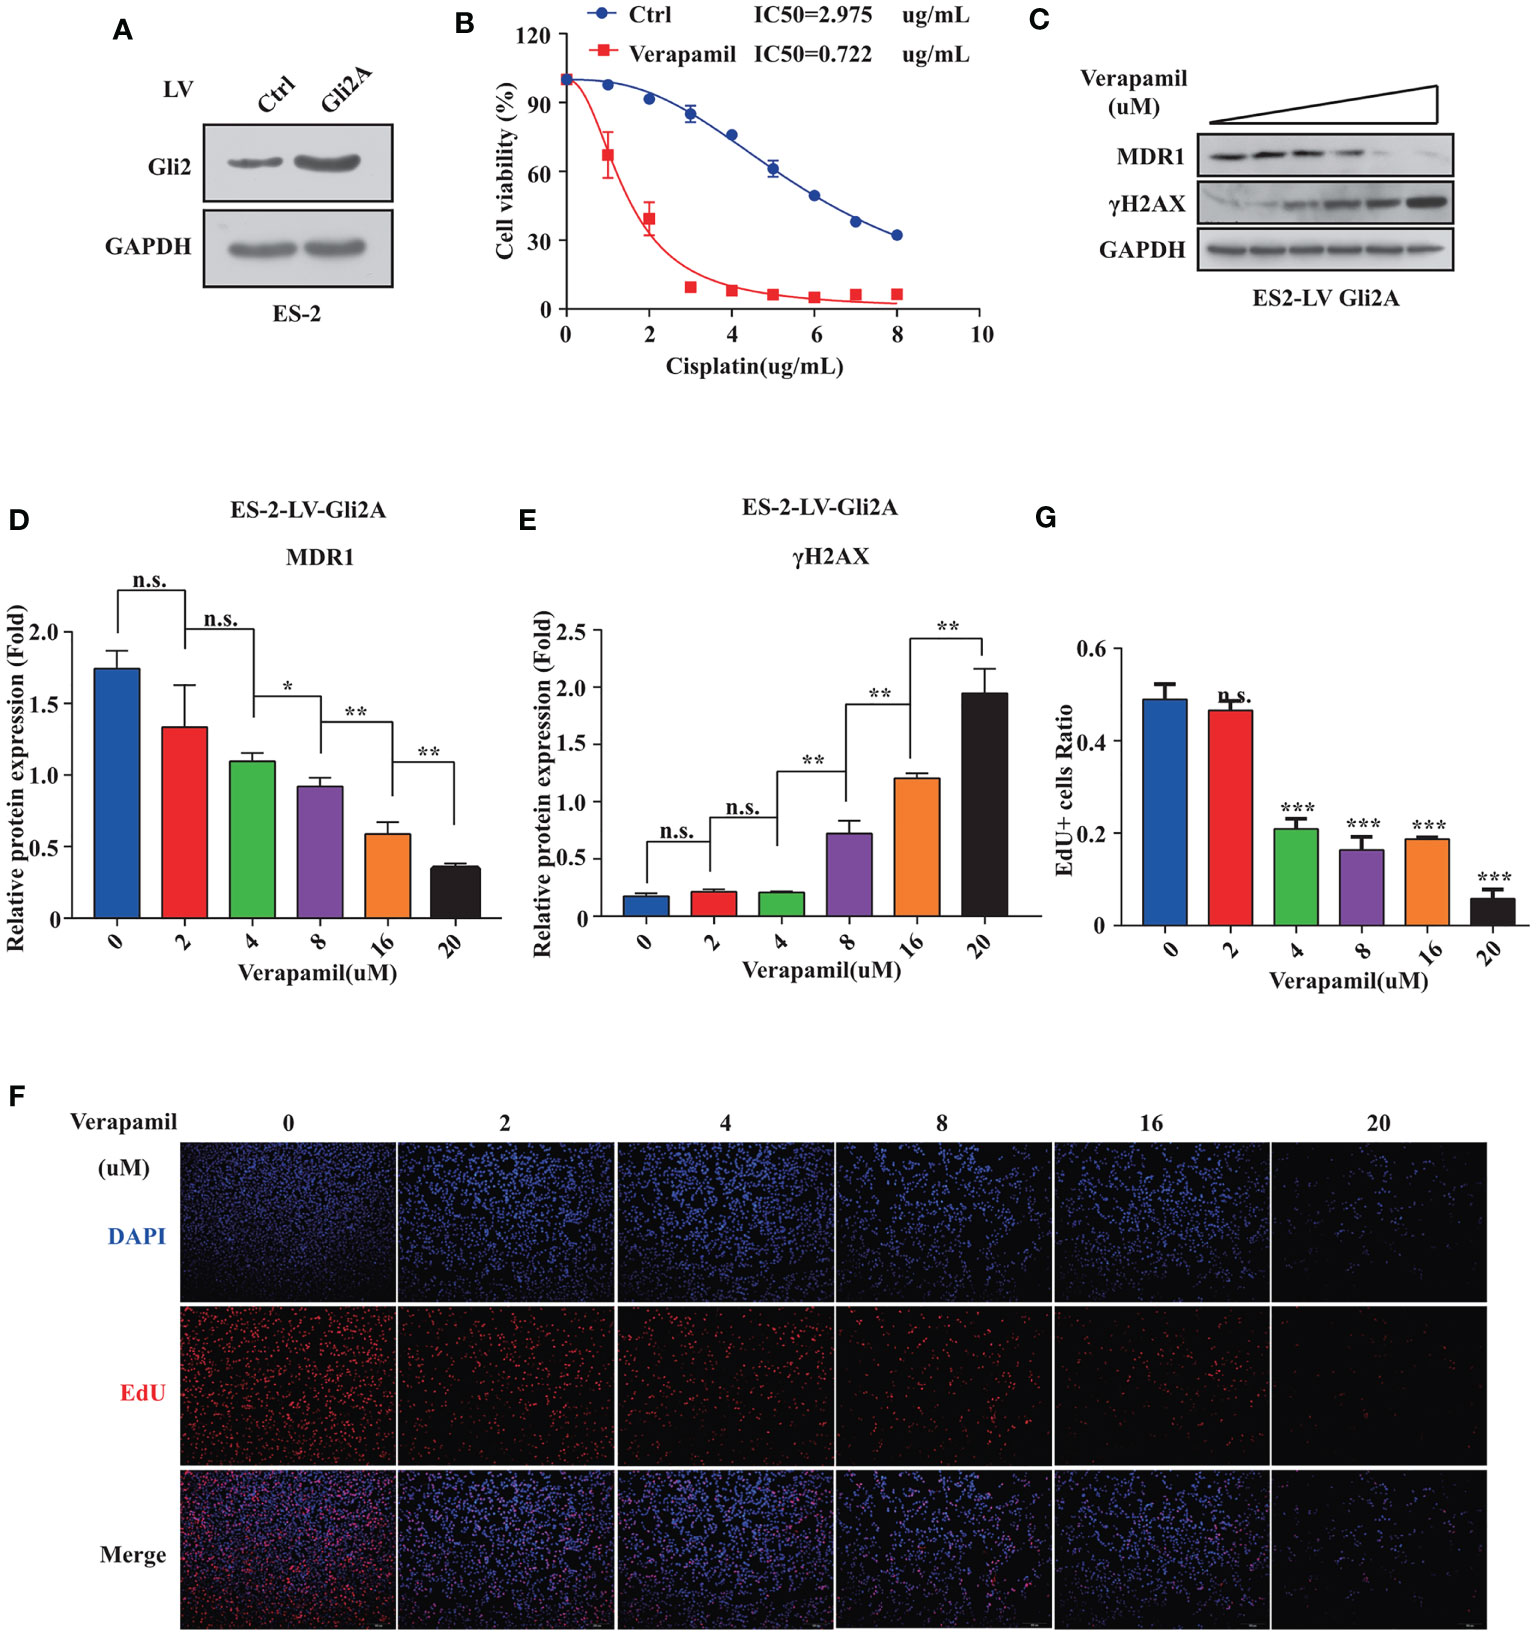
Figure 4 Reversal of cisplatin (DDP) resistance in ovarian cancer cells following treatment with MDR1 inhibitor verapamil. (A) Successful construction of stable cell line overexpressing Gli2 using lentiviral infection. (B) Survival rate and IC50 of SKOV3/DDP cells after treatment with verapamil and DDP for 48 h determined using CCK-8 assays. (C–E) Western blot analysis of the protein expression levels of MDR1 and γH2AX in cells treated with gradient concentrations of verapamil for 48h. (F–G) Downregulation of MDR1 expression significantly inhibited cell proliferation, as detected using EdU assays. n.s., not significant, *P < 0.05, **P < 0.01, ***P < 0.001.
MDR1 Is a Direct Downstream Target of Gli2
Our previous studies indicated that MDR1 is the downstream target of Gli2 (25). Moreover, the results described above also demonstrate that Gli2 positively modulates the expression of MDR1 in drug-resistant OC cells. To further explore whether Gli2 directly regulates MDR1 expression to promote DDP resistance in OC, the JASPAR tool (http://motifmap.ics.uci.edu/) was used to predict the GBS in the MDR1 sequence (Figure 5A). Seven potential Gli2-binding sites were identified within the −2,002–0 genomic region (the 5′ initiation site of MDR1 [NM_000927.5] was numbered +1) (Figure 5B). Different truncated MDR1 promoter reporter sequences were constructed for all seven putative GBS genomic sequences and cloned into the pGL4.20 plasmid to produce six luciferase reporter gene constructs, namely fragment 1 (Frag-I) and fragment 2 (Frag-II), with the latter being continuously segmented (Frag–II-1, Frag–II-2, Frag–II-1-a, and Frag–II-1-b) (Figure 5C).
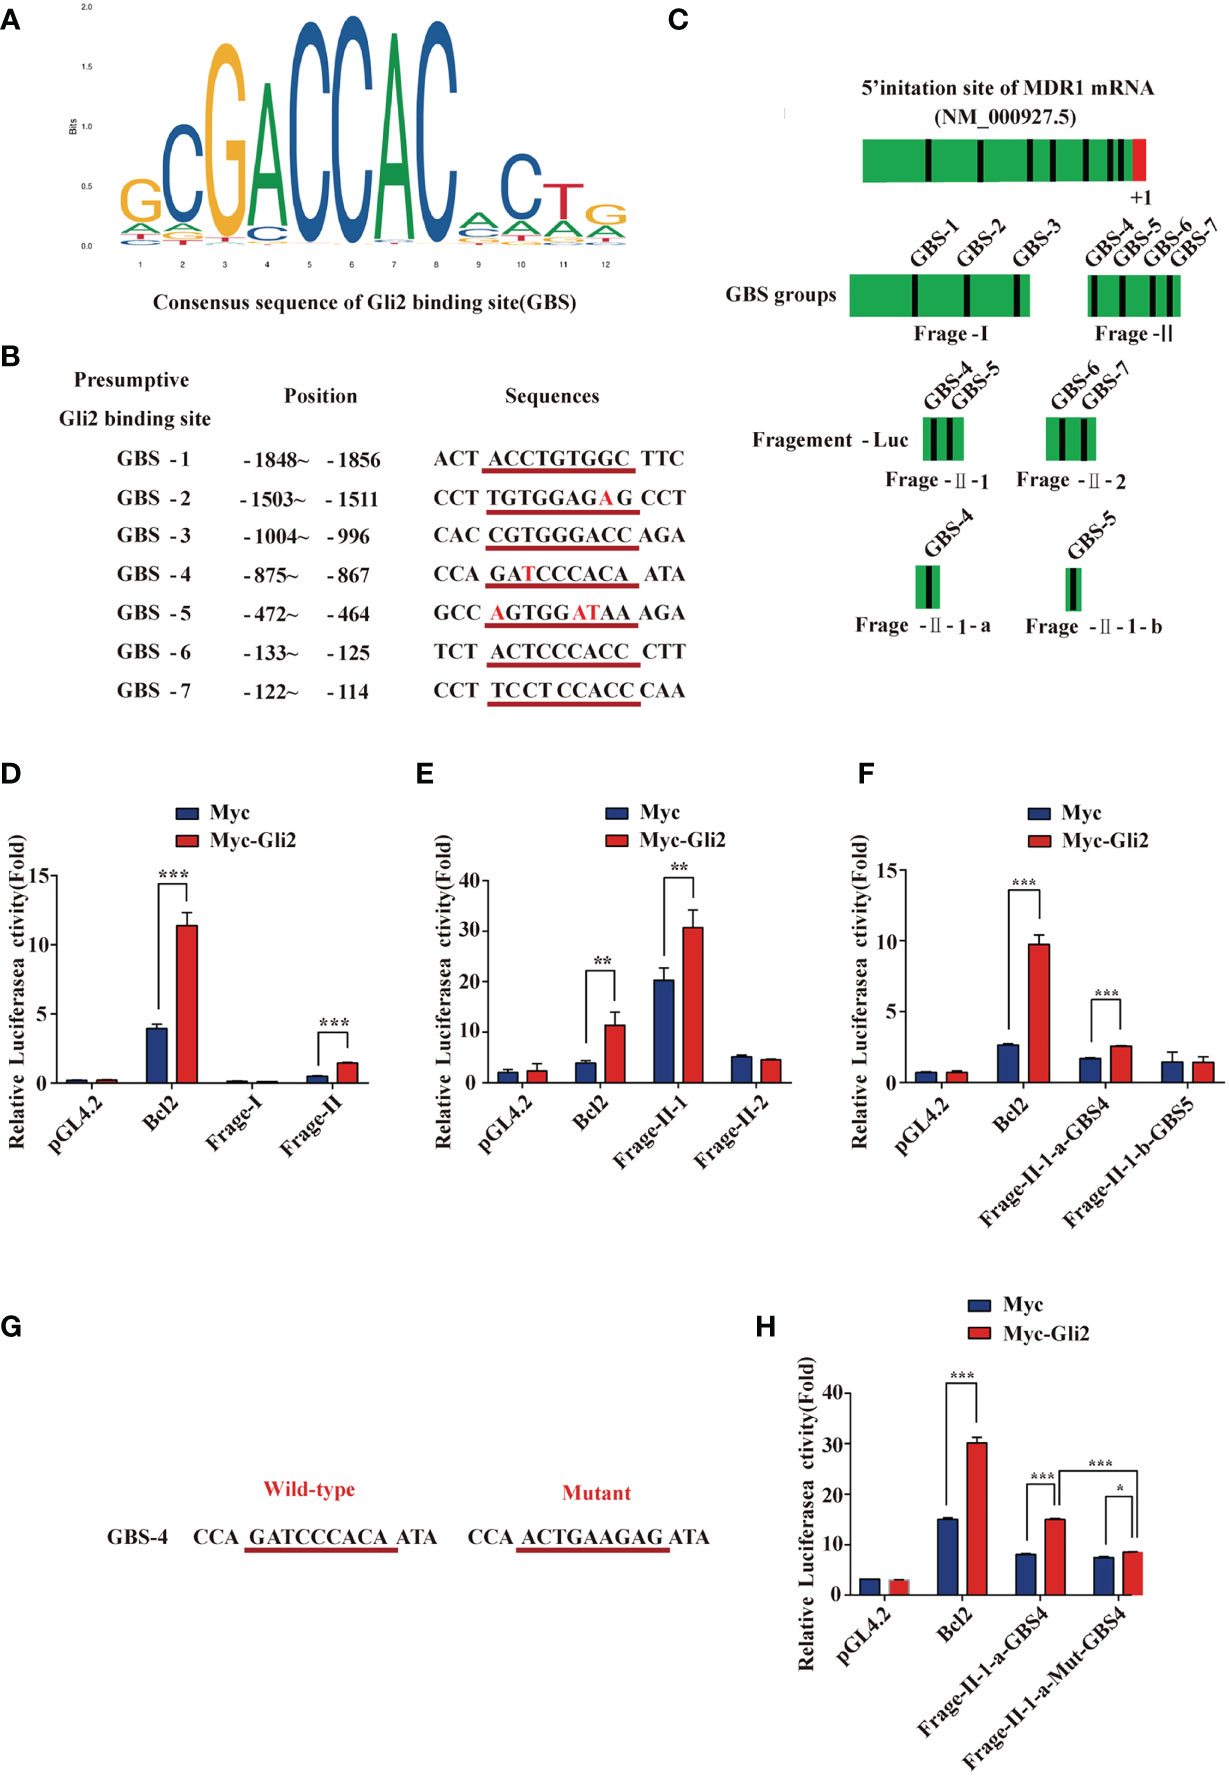
Figure 5 MDR1 is the direct downstream target of Gli2. (A) Consensus sequence of Gli2-binding sites (GBS). The size of each base in the figure indicates its conservation. The larger the base, the stronger the conservation and more important its function. (B) Within the range of -2,002 to 0 in the promoter region of MDR1 and adjacent regions (the first base at the 5′ end of the MDR1 mRNA NM_000927.5 was recorded as +1), seven candidate GBS were predicted using software analysis. They are numbered separately, and the position and sequence are indicated. The consensus sequence with GBS is underlined in red with the corresponding sequence, and the base list differing from the GBS consensus sequence is in red font. (C) Schematic illustration of the distribution of candidate GBS within the MDR1 promoter and luciferase reporter constructs Frag-I, -II, –II-1, –II-2, –II-1-a, and –II-1-b containing the indicated GBS. (D–F) Gli2 activating effects on Frag-I, -II, –II-1, –II-2, –II-1-a, and –II-1-b reporter constructs detected using a dual-luciferase assay in Gli2-transfected and control HEK293 cells. (G) Wild-type and mutant sequences of the GBS-4 locus in Frag–II-1-a. (H) Compared with the wild-type, the activation effect of Gli2 on the mutant Frag–II-1-a was significantly reduced after GBS-4 point mutation. “Mut” indicates a mutation, and the letters after it denote different GBS sites. Data are represented as the mean ± SD of three independent experiments. n = 3, *P < 0.05, **P < 0.01, ***P < 0.001.
These constructs and Gli2, as well as pRL-TK (for normalization), were co-transfected into HEK293T cells with Bcl2 or pCMV-Myc as a control. Cells were collected at 48 h after transfection, and a dual-luciferase reporter assay was performed. The relative luciferase activity was obtained by normalizing the firefly luciferase activity against the internal Renilla luciferase activity. The luciferase assay results showed that the relative luciferase activity of the MDR1 promoter increased only in specific DNA sequences (GBS-4: −875 to −867) compared with that of a promoter-less control (Figures 5D–F). We next used the point mutation method to mutate the GBS-4 sequence (Figure 5G), which significantly abolished the activation of the MDR1-Luci reporter by Gli2 (Figure 5H), revealing that MDR1 is a direct downstream target of Gli2.
Gli2 Knockdown Overcomes DDP Resistance in OC In Vivo
Next, we established a SKOV3 cell line that stably reduced Gli2 expression. Analysis of total protein lysates by WB confirmed that the Gli2 levels were reduced (Figure 6A). These cells were then transplanted into mice to test the impact of Gli2 expression on the tumorigenicity and drug resistance of SKOV3 cells in vivo. SKOV3-sh-control and SKOV3-sh-Gli2 cells were subcutaneously injected into nude mice, which were then randomly assigned for treatment with intraperitoneal injections of PBS (control group) or DDP (treated group). Tumors formed by SKOV3 cells lacking Gli2 were smaller and lighter than those formed by cells expressing normal levels of Gli2 (Figures 6B, C). Moreover, DDP treatment alone showed a limited ability to inhibit tumor growth in cells expressing normal levels of Gli2 as compared with the control group because of DDP resistance. In contrast, combining Gli2 knockdown with DDP treatment caused a marked decrease in the tumor volume and mass. Tumor xenografts developed slowly (Figure 6D) in the sh-Gli2 group compared to the sh-control group, resulting in smaller tumor xenografts (Figure 6E). Taken together, these results suggest that knocking down Gli2 can inhibit DDP resistance and enhance the therapeutic effect of DDP on OC in vivo. In accordance with the in vitro data, further detailed analysis of the tumor tissues revealed that the MDR1 and proliferating cell nuclear antigen (PCNA) protein levels were decreased, whereas the γH2AX and apoptosis protein Bcl2 levels were upregulated in the mouse tumors upon Gli2 knockdown (Figures 6F, G). These results strongly indicate that Gli2 is an important regulator of OC cell drug resistance in vivo.
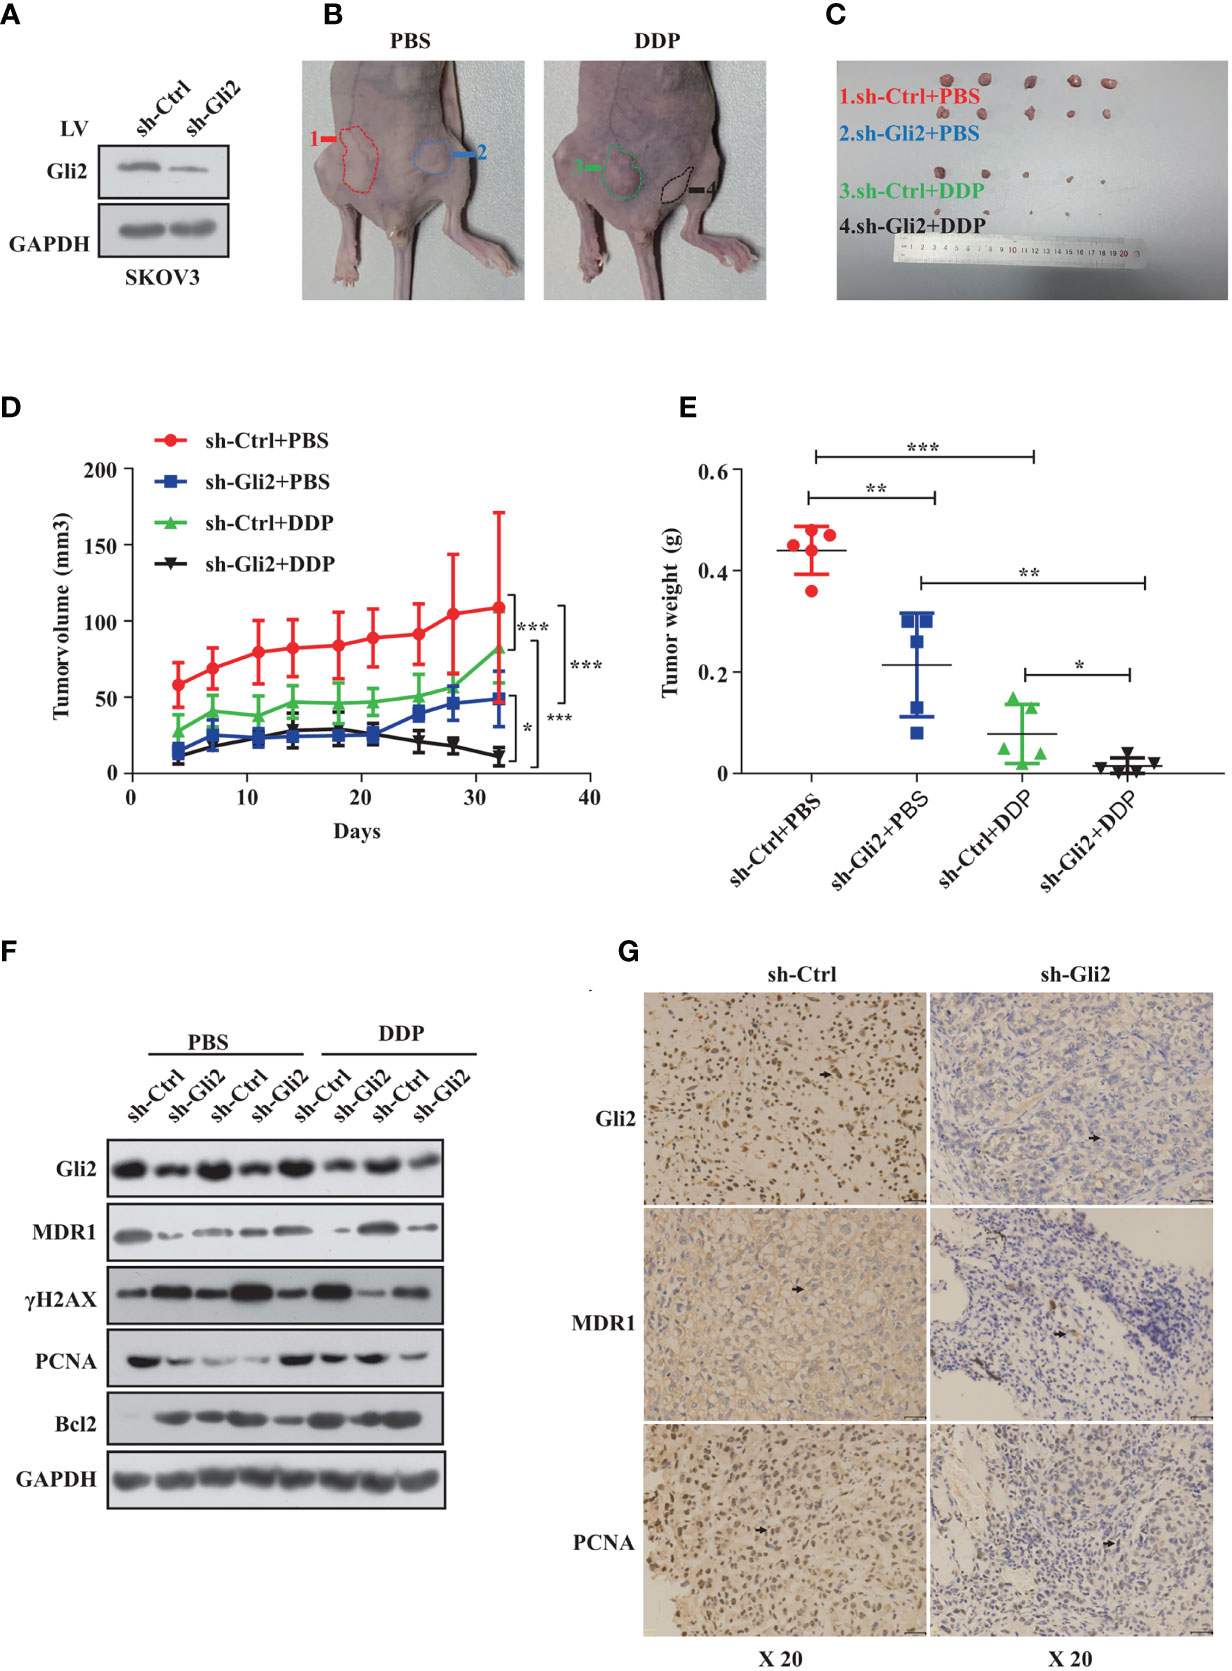
Figure 6 Gli2 knockdown trumps cisplatin (DDP) resistance in ovarian cancer in vivo. SKOV3 cells infected with sh-Control or sh-Gli2 were subcutaneously injected into nude mice. (A) Western blot analysis of the Gli2 protein expression after stable knockdown of Gli2 in SKOV3 cells. (B, C) SKOV3 cells infected with sh-Control or sh-Gli2 were subcutaneously injected into the skin of nude mice. The mice were injected intraperitoneally with 4 mg/kg DDP or phosphate-buffered saline (PBS) (control group) twice per week and photographed on day 32. Tumor volume (D) and tumor weight (E) data are shown as the mean ± SD (n = 5). (F) Following Gli2 knockdown, the expression levels of MDR1 and PCNA decreased, while those of γH2AX and Bcl2 increased in vivo. (G) Expression of Gli2, MDR1, and PCNA in SKOV3 sh-control and SKOV3 sh-Gli2 tumors determined using immunohistochemical analysis. *P < 0.05, **P < 0.01, ***P < 0.001.
Discussion
The Hh signaling system has been evolutionarily preserved (34). Several studies have shown that Hh signaling is intimately linked to the formation and progression of a variety of malignant tumors (35, 36). Despite significant advancements in the treatment of ovarian cancer, chemoresistance remains the leading cause of therapy failure and death from this disease. Some studies showed that Gli1 is linked to tumor resistance (37, 38), whereas others suggested that Gli2, rather than Gli1, may be more predictive of resistance (39). For example, Steg AD et al. found that by targeting the Hh signaling pathway, transcription factor Gli2 increased sensitivity to DDP in ovarian cancer (40). However, our findings showed that Gli2 expression is involved in DDP resistance in OC. MDR1 is a drug efflux pump that plays an important role in chemoresistance. MDR1 effluxes different chemotherapeutic drugs from tumor cells (41, 42,) and its expression is adversely linked to the prognosis of various malignancies, including OC (43). This study demonstrated that MDR1 plays a vital role in OC cell chemoresistance and that it is regulated by Gli2 (Figure 7).
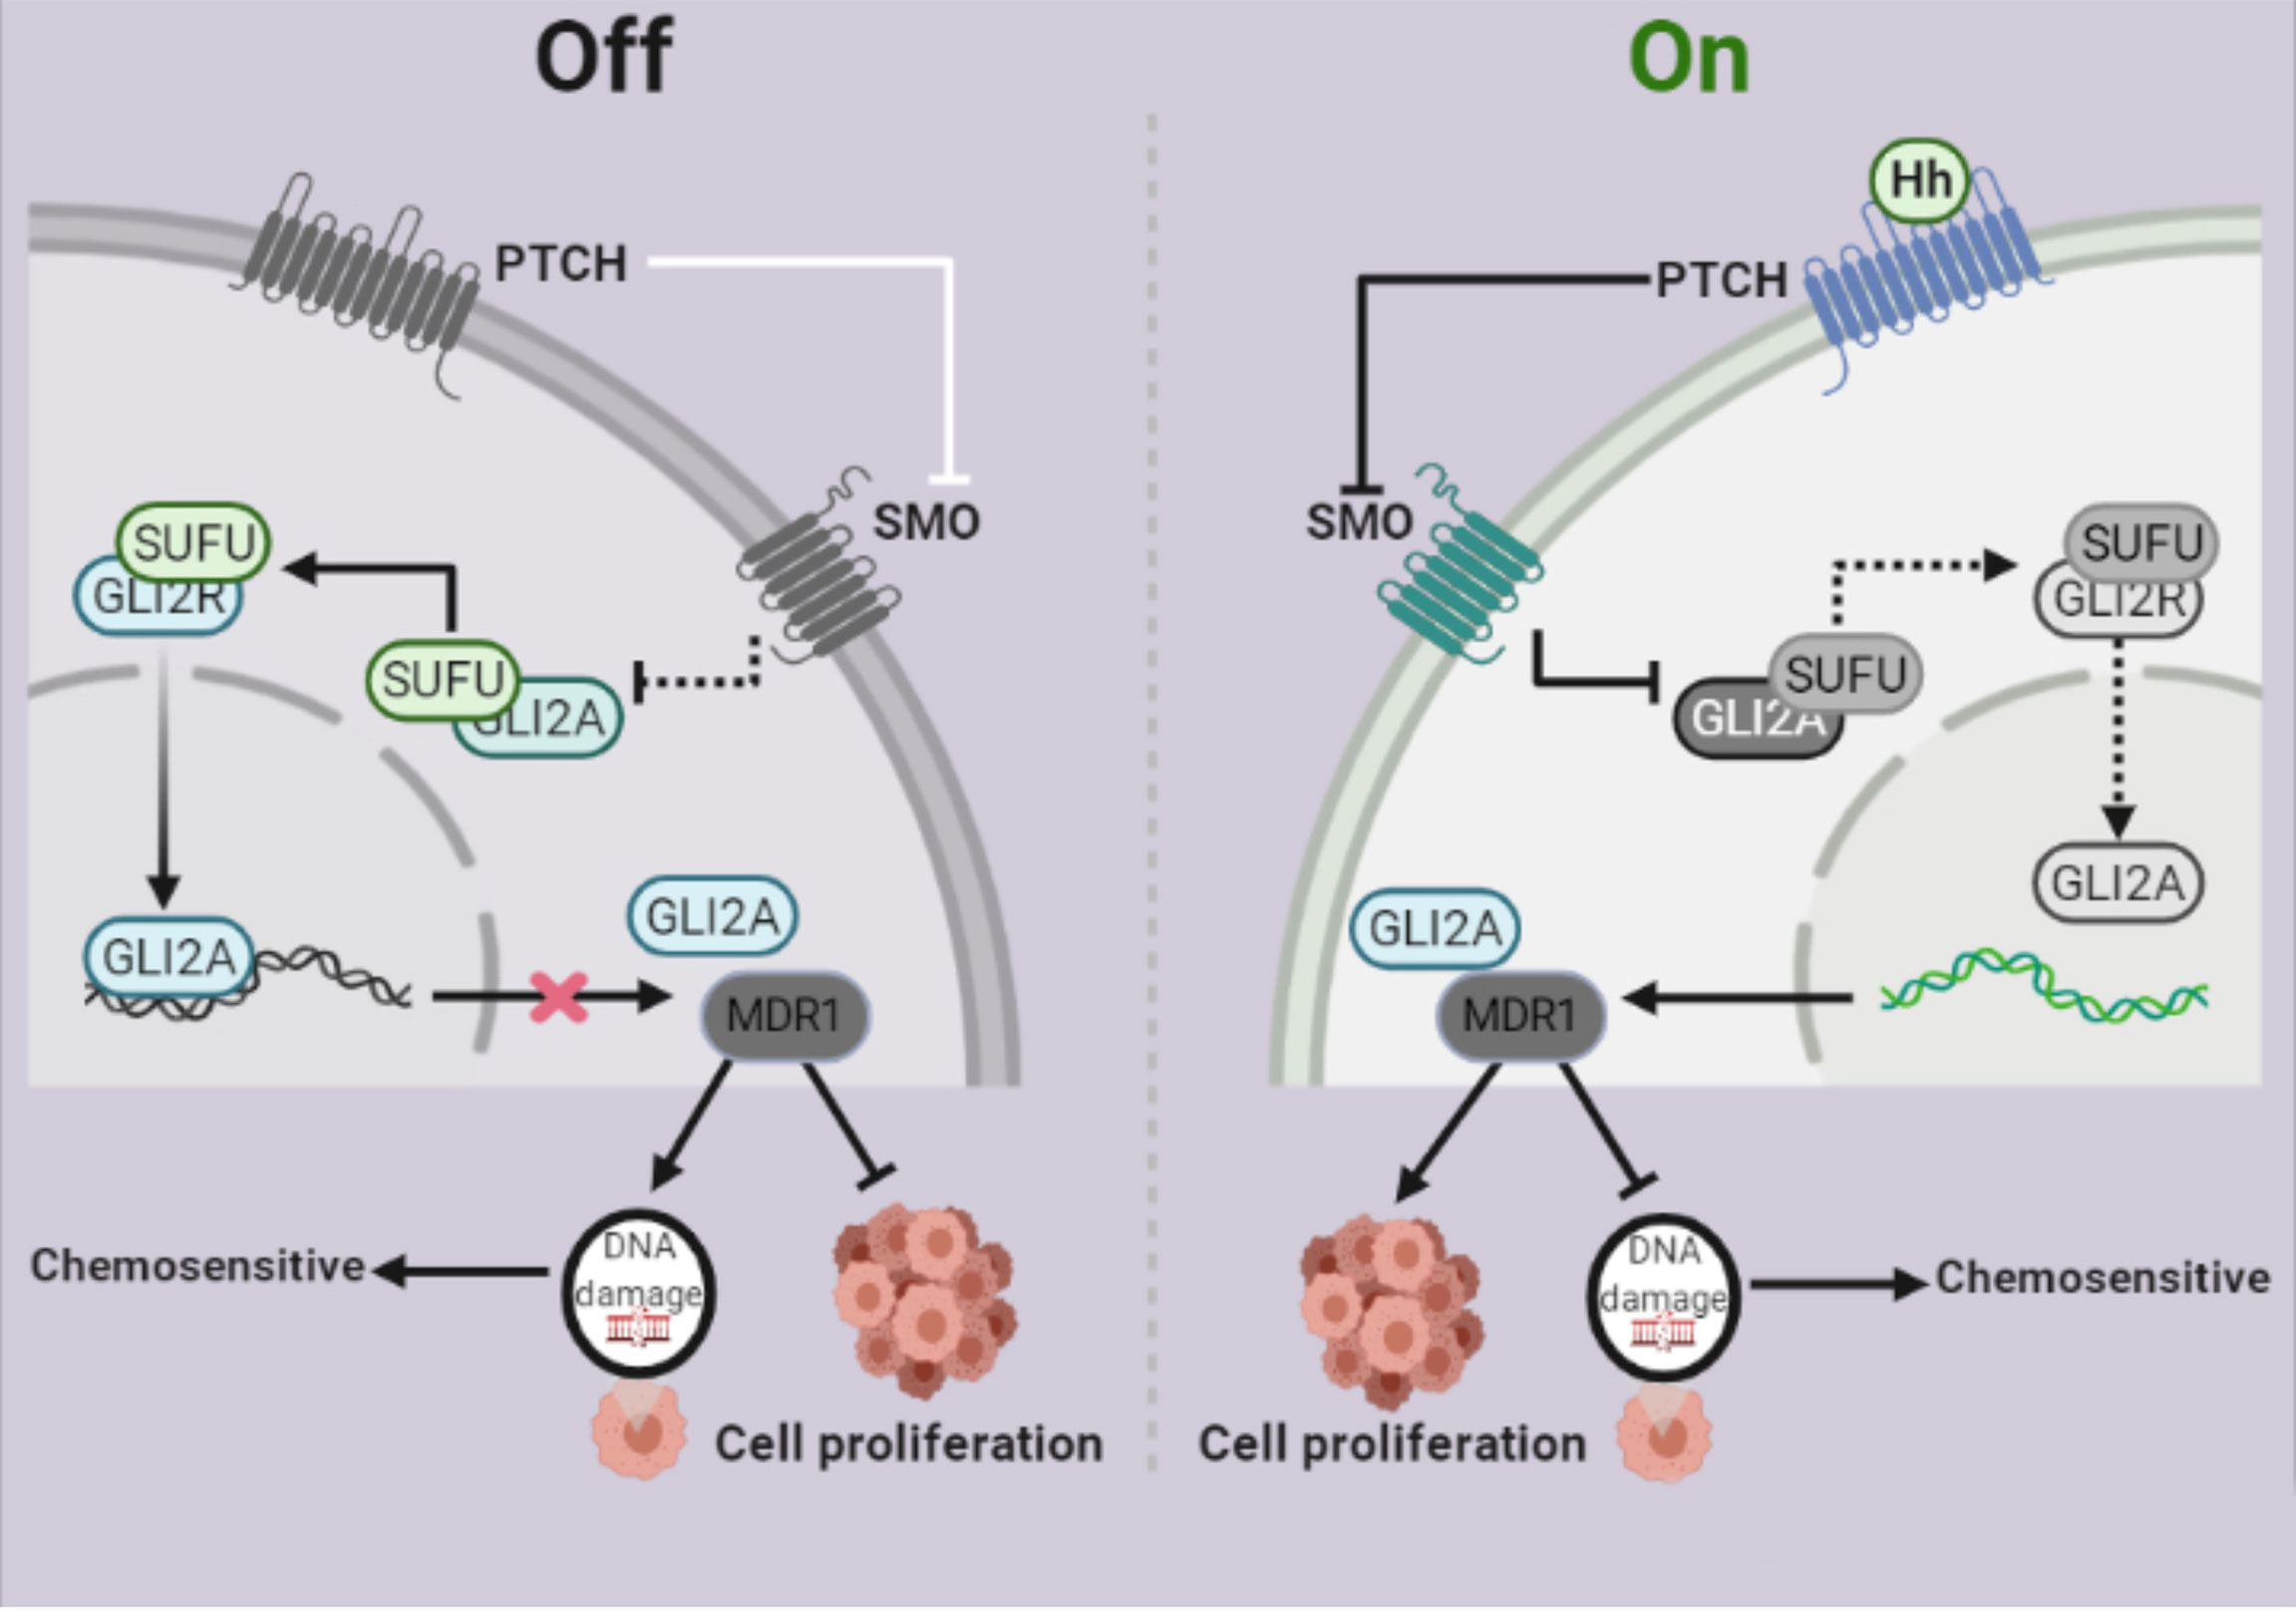
Figure 7 Schematic depiction of the role of Gli2 in cisplatin (DDP) resistance in ovarian cancer. Under normal circumstances, the Hh signaling pathway is inhibited and therefore, Gli2 cannot bind to the downstream target genes. This maintains DDP sensitivity in ovarian cancer cells and cell proliferation is inhibited. When the Hh signaling pathway is abnormally activated, Gli2 is overexpressed, enters the nucleus in the activated form of Gli2A and directly binds to the downstream target gene MDR1. This promotes DDP resistance in ovarian cancer cells, thereby significantly enhancing cell proliferation.
First, DDP resistant SKOV3/DDP cells were established by stimulation with gradient concentrations of DDP. Further analysis showed that compared with the parental strains (SKOV3 and A2780), the IC50 value of DDP-resistant SKOV3/DDP and A2780/DDP cells increased by 7- and 5-fold, respectively, and that Gli2 expression was increased. The in vitro results also showed that the sensitivity of SKOV3/DDP cells to DPP was significantly higher after transfection with Gli2-interfering plasmids or treatment with the Hh inhibitor GANT61, suggesting that Gli2 expression promotes DDP resistance in OC cells. MDR1 expression was also reduced, supporting that MDR1 expression is regulated by Gli2 in OC resistance. This is consistent with the results of Zhao et al (44). Furthermore, the findings of the current study support previously reported results (25). Studies have shown that certain chemotherapeutic drugs are more effective in tumor suppression, even in OC, when combined with verapamil (45, 46). We obtained comparable results by adding gradient concentrations of the MDR1 inhibitor verapamil to the stable Gli2-overexpressing cell line ES-2-LV-Gli2, suggesting that verapamil pretreatment effectively reversed drug resistance in a dose-dependent manner (45).
In vitro proliferation experiments by EdU showed that the proliferation ability of drug-resistant cells was significantly higher than that of the parental strains. Targeting Gli2 reduced the proliferative ability of the cells. Furthermore, the dual-luciferase assay confirmed that Gli2 regulates OC chemotherapy resistance by regulating MDR1 transcription. Moreover, we demonstrated that Gli2 knockdown can reverse the DDP resistance of OC cells in nude mice transplanted with tumor cells. Therefore, Gli2 may promote OC chemotherapy resistance by regulating MDR1 expression in vivo and in vitro.
Taken together, these results demonstrate that Gli2 promotes OC chemotherapy resistance by regulating the expression of MDR1 both in vitro and in vivo. Hence, Gli2 and MDR1 are potential novel therapeutic targets to increase the clinical efficacy of DDP in treating patients with OC. Furthermore, Gli2 and MDR1 are potential indicators for assessing DDP resistance during clinical OC treatment.
Data Availability Statement
The original contributions presented in the study are included in the article/supplementary material. Further inquiries can be directed to the corresponding author.
Ethics Statement
The animal study was reviewed and approved by the Nanchang University Institutional Animal Care.
Author Contributions
QW, XW, LH, LZ, and HZ performed the experiments. QW analyzed the data and prepared the figures. QW and XW wrote the manuscript. QC and QW contributed to the study design, data interpretation, and final editing of the manuscript. All authors read and approved the final manuscript.
Funding
This work was supported in part by grants from the National Natural Science Foundation of China (81960470 to QC) and Key R&D Project of Jiangxi Science and Technology Department (grant no. 20202ACB206008).
Conflict of Interest
The authors declare that the research was conducted in the absence of any commercial or financial relationships that could be construed as a potential conflict of interest.
Publisher’s Note
All claims expressed in this article are solely those of the authors and do not necessarily represent those of their affiliated organizations, or those of the publisher, the editors and the reviewers. Any product that may be evaluated in this article, or claim that may be made by its manufacturer, is not guaranteed or endorsed by the publisher.
References
1. Piver MS. Treatment of Ovarian Cancer at the Crossroads: 50 Years After Single-Agent Melphalan Chemotherapy. Oncol (Williston Park) (2006) 20:1156–8.
2. Norouzi-Barough L, Sarookhani MR, Sharifi M, Moghbelinejad S, Jangjoo S, Salehi R, et al. Molecular Mechanisms of Drug Resistance in Ovarian Cancer. J Cell Physiol (2018) 233:4546–62. doi: 10.1002/jcp.26289
3. Damia G, Broggini M. Platinum Resistance in Ovarian Cancer: Role of DNA Repair. Cancers (Basel) (2019) 11:119–23. doi: 10.3390/cancer/1010119
5. Ferraresi A, Esposito A, Girone C, Vallino L, Salwa A, Ghezzi I. Resveratrol Contrasts LPA-Induced Ovarian Cancer Cell Migration and Platinum Resistance by Rescuing Hedgehog-Mediated Autophagy. Cells (2021) 17:3213–26. doi: 10.3390/cells10113213
6. Rabik CA, Dolan ME. Molecular Mechanisms of Resistance and Toxicity Associated With Platinating Agents. Cancer Treat Rev (2007) 33:9–23. doi: 10.1016/j.ctrv.2006.09.006
7. Hoppe MM, Jaynes P, Wardyn JD, Upadhyayula S, Tan TZ, Lie S, et al. Quantitative Imaging of RAD51 Expression as a Marker of Platinum Resistance in Ovarian Cancer. EMBO Mol Med (2021) 13:e13366–13377. doi: 10.15252/emmm.202013366
8. Lee RT, Zhao Z, Ingham PW. Hedgehog Signalling. Development (2016) 143:367–72. doi: 10.1242/dev.120154
9. Ruiz i Altaba A, Sanchez P, Dahmane N. Gli and Hedgehog in Cancer: Tumours, Embryos and Stem Cells. Nat Rev Cancer (2002) 2:361–72. doi: 10.1038/nrc796
10. Pietrobono S, Gagliardi S, Stecca B. Non-Canonical Hedgehog Signaling Pathway in Cancer: Activation of GLI Transcription Factors Beyond Smoothened. Front Genet (2019) 10:556. doi: 10.3389/fgene.2019.00556
11. Park HL, Bai C, Platt KA, Matise MP, Beeghly A, Hui CC, et al. Mouse Gli1 Mutants Are Viable But Have Defects in SHH Signaling in Combination With a Gli2 Mutation. Development (2000) 127:1593–605. doi: 10.1242/dev.127.8.1593
12. Jiang J. Hedgehog Signaling Mechanism and Role in Cancer. Semin Cancer Biol (2021). doi: 10.1016/j.semcancer.2021.04.003
13. Song Y, Pan S, Li K, Chen X, Wang ZP, Zhu X, et al. Insight Into the Role of Multiple Signaling Pathways in Regulating Cancer Stem Cells of Gynecologic Cancers. Semin Cancer Biol (2021). doi: 10.1016/j.semcancer.2021.06.001
14. Seidl C, Panzitt K, Bertsch A, Brcic L, Schein S, Mack M, et al. MicroRNA-182-5p Regulates Hedgehog Signaling Pathway and Chemosensitivity of Cisplatin-Resistant Lung Adenocarcinoma Cells. Via Targeting GLI2 Cancer Lett (2020) 469:266–76. doi: 10.1016/j.canlet.2019.10.044
15. Wing Leung H, Lau EYT, Leung CON, Lei MML, Mok EHK, Victor MA. NRF2/SHH Signaling Cascade Promotes Tumor-Initiating Cell Lineage and Drug Resistance in Hepatocellular Carcinoma. Cancer Lett (2020) 476:48–56. doi: 10.1016/j.canlet.2020.02.008
16. Alisi A, Cho WC, Locatelli F, Fruci D. Multidrug Resistance and Cancer Stem Cells in Neuroblastoma and Hepatoblastoma. Int J Mol Sci (2013) 14:24706–25. doi: 10.3390/ijms141224706
17. Min HY, Lee HY. Mechanisms of Resistance to Chemotherapy in Non-Small Cell Lung Cancer. Arch Pharm Res (2021) 44:146–64. doi: 10.1007/s12272-021-01312-y
18. Riordan JR, Deuchars K, Kartner N, Alon N, Trent J, Ling V, et al. Amplification of P-Glycoprotein Genes in Multidrug-Resistant Mammalian Cell Lines. Nature (1985) 316:817–9. doi: 10.1038/316817a0
19. Pasello M, Giudice AM, Scotlandi K. The ABC Subfamily A Transporters: Multifaceted Players With Incipient Potentialities in Cancer. Semin Cancer Biol (2020) 60:57–71. doi: 10.1016/j.semcancer.2019.10.004
20. Ceballos MP, Rigalli JP, Cere LI, Semeniuk M, Catania VA, Ruiz ML, et al. ABC Transporters: Regulation and Association With Multidrug Resistance in Hepatocellular Carcinoma and Colorectal Carcinoma. Curr Med Chem (2019) 26:1224–50. doi: 10.2174/0929867325666180105103637
21. Zhang Y, Wu Z-X, Yang Y, Wang J-Q, Li J, Sun Z, et al. Poziotinib Inhibits the Efflux Activity of the ABCB1 and ABCG2 Transporters and the Expression of the ABCG2 Transporter Protein in Multidrug Resistant Colon Cancer Cells. Cancers (Basel) (2020) 12:3249–72. doi: 10.3390/cancers12113249
22. Wang Y, Huang Z, Chen CZ, Liu C, Evans CP, Gao AC, et al. Therapeutic Targeting of MDR1 Expression by RORgamma Antagonists Resensitizes Cross-Resistant CRPC to Taxane via Coordinated Induction of Cell Death Programs. Mol Cancer Ther (2020) 19:364–74. doi: 10.1158/1535-7163.MCT-19-0327
23. Wang F, Li D, Zheng Z, Kin KW, Chen Z, Zhong M, et al. Reversal of ABCB1-Related Multidrug Resistance by ERK5-IN-1. J Exp Clin Cancer Res (2020) 39:50. doi: 10.1186/s13046-020-1537-9
24. Goldstein LJ, Galski H, Fojo A, Willingham M, Lai SL, Gazdar A, et al. Expression of a Multidrug Resistance Gene in Human Cancers. J Natl Cancer Inst (1989) 81:116–24. doi: 10.1093/jnci/81.2.116
25. Zhang H, Hu L, Cheng M, Wang Q. The Hedgehog Signaling Pathway Promotes Chemotherapy Resistance via Multidrug Resistance Protein 1 in Ovarian Cancer. Oncol Rep (2020) 44:2610–20. doi: 10.3892/or.2020.7798
26. Wang D, Hu G, Du Y, Zhang C, Lu Q, Lv N, et al. Aberrant Activation of Hedgehog Signaling Promotes Cell Proliferation via the Transcriptional Activation of Forkhead Box M1 in Colorectal Cancer Cells. J Exp Clin Cancer Res (2017) 36:23. doi: 10.1186/s13046-017-0491-7
27. Reg G, Kasper M, Schnidar H, Eichberger T, Neill GW, Philpott MP, et al. Activation of the BCL2 Promoter in Response to Hedgehog/GLI Signal Transduction Is Predominantly Mediated by GLI2. Cancer Res (2004) 64:7724–31. doi: 10.1158/0008-5472.CAN-04-1085
28. Wang Y, Wang H, Yan Z, Li G, Hu G, Zhang H, et al. The Critical Role of Dysregulated Hh-FOXM1-TPX2 Signaling in Human Hepatocellular Carcinoma Cell Proliferation. Cell Commun Signal (2020) 18:116. doi: 10.1186/s12964-020-00628-4
29. Dong Y-J, Feng W, Li Y. HOTTIP-miR-205-ZEB2 Axis Confers Cisplatin Resistance to Ovarian Cancer Cells. Front Cell Dev Biol (2021) 12:707424. doi: 10.3389/fcell.2021.707424
30. O’Grady S, Finn SP, Cuffe S, Richard DJ, O'Byrne KJ, Barr MP, et al. The Role of DNA Repair Pathways in Cisplatin Resistant Lung Cancer. Cancer Treat Rev (2014) 40:1161–70. doi: 10.1016/j.ctrv.2014.10.003
31. Safa AR. Photoaffinity Labeling of the Multidrug-Resistance-Related P-Glycoprotein With Photoactive Analogs of Verapamil. Proc Natl Acad Sci USA (1988) 85:7187–91. doi: 10.1073/pnas.85.19.7187
32. Zhou S, Wang R, Xiao H. Adipocytes Induce the Resistance of Ovarian Cancer to Carboplatin Through ANGPTL4. Oncol Rep (2020) 44:927–38. doi: 10.3892/or.2020.7647
33. Min Q, Wang Y, Wu Q, Li X, Teng H, Fan J, et al. Genomic and Epigenomic Evolution of Acquired Resistance to Combination Therapy in Esophageal Squamous Cell Carcinoma. JCI Insight (2021) 6:e150203–150217. doi: 10.1172/jci.insight.150203
34. Richard AJ, Stephens JM. The Role of JAK-STAT Signaling in Adipose Tissue Function. Biochim Biophys Acta (2014) 1842:431–9. doi: 10.1016/j.bbadis.2013.05.030
35. Gu Y, Wang Y, He L, Zhang J, Zhu X, Liu N, et al. Circular RNA Circipo11 Drives Self-Renewal of Liver Cancer Initiating Cells. Via Hedgehog Signaling Mol Cancer (2021) 14:132–51. doi: 10.1186/s12943-021-01435-2
36. Bausch D, Fritz S, Bolm L, Wellner UF, del Castillo CF, Warshaw AL, et al. Hedgehog Signaling Promotes Angiogenesis Directly and Indirectly in Pancreatic Cancer. Angiogenesis (2020) 23:479–92. doi: 10.1007/s10456-020-09725-x
37. Dong SR, Ju XL, Yang WZ. STAT5A Reprograms Fatty Acid Metabolism and Promotes Tumorigenesis of Gastric Cancer Cells. Eur Rev Med Pharmacol Sci (2019) 23:8360–70. doi: 10.26355/eurrev_201910_19147
38. Li B, Hong P, Zheng CC, Dai W, Chen WY, Yang QS, et al. Identification of miR-29c and Its Target FBXO31 as a Key Regulatory Mechanism in Esophageal Cancer Chemoresistance: Functional Validation and Clinical Significance. Theranostics (2019) 9:1599–613. doi: 10.7150/thno.30372
39. Akada M, Crnogorac-Jurcevic T, Lattimore S, Mahon P, Lopes R, Sunamura M, et al. Intrinsic Chemoresistance to Gemcitabine Is Associated With Decreased Expression of BNIP3 in Pancreatic Cancer. Clin Cancer Res (2005) 11:3094–101. doi: 10.1158/1078-0432.CCR-04-1785
40. Steg AD, Bevis KS, Katre AA, Ziebarth A, Dobbin ZC, Alvarez RD, et al. Stem Cell Pathways Contribute to Clinical Chemoresistance in Ovarian Cancer. Clin Cancer Res (2012) 18:869–81. doi: 10.1158/1078-0432.CCR-11-2188
41. Kubo M, Nakamura M, Tasaki A, Yamanaka N, Nakashima H, Nomura M, et al. Hedgehog Signaling Pathway Is a New Therapeutic Target for Patients With Breast Cancer. Cancer Res (2004) 64:6071–4. doi: 10.1158/0008-5472.CAN-04-0416
42. Ma Y, Yu W, Shrivastava A, Alemi F, Lankachandra K, Srivastava RK, et al. Sanguinarine Inhibits Pancreatic Cancer Stem Cell Characteristics by Inducing Oxidative Stress and Suppressing Sonic Hedgehog-Gli-Nanog Pathway. Carcinogenesis (2017) 38:1047–56. doi: 10.1093/carcin/bgx070
43. Yamamoto M, Suzuki S, Togashi K, Sanomachi T, Seino S, Kitanaka C, et al. AS602801 Sensitizes Ovarian Cancer Stem Cells to Paclitaxel by Down-Regulating MDR1. Anticancer Res (2019) 39:609–17. doi: 10.21873/anticanres.13154
44. Zhao H, Li N, Pang Y, Zhao J, Wu X. Gli Affects the Stemness and Prognosis of Epithelial Ovarian Cancer via Homeobox Protein NANOG. Mol Med Rep (2021) 23:128–39. doi: 10.3892/mmr.2020.11767
45. Zheng W, Li M, Lin Y, Zhan X. Encapsulation of Verapamil and Doxorubicin by MPEG-PLA to Reverse Drug Resistance in Ovarian Cancer. BioMed Pharmacother (2018) 108:565–73. doi: 10.1016/j.biopha.2018.09.039
Keywords: cisplatin resistance, Gli2, hedgehog signaling, MDR1, ovarian cancer, proliferation
Citation: Wang Q, Wei X, Hu L, Zhuang L, Zhang H and Chen Q (2022) Hedgehog−Gli2 Signaling Promotes Chemoresistance in Ovarian Cancer Cells by Regulating MDR1. Front. Oncol. 11:794959. doi: 10.3389/fonc.2021.794959
Received: 14 October 2021; Accepted: 13 December 2021;
Published: 04 January 2022.
Edited by:
Jian-Jun Wei, Northwestern University, United StatesReviewed by:
Cheng-Yang Chou, National Cheng Kung University, TaiwanPing Yin, Northwestern University, United States
Copyright © 2022 Wang, Wei, Hu, Zhuang, Zhang and Chen. This is an open-access article distributed under the terms of the Creative Commons Attribution License (CC BY). The use, distribution or reproduction in other forums is permitted, provided the original author(s) and the copyright owner(s) are credited and that the original publication in this journal is cited, in accordance with accepted academic practice. No use, distribution or reproduction is permitted which does not comply with these terms.
*Correspondence: Qi Chen, ndefy97010@ncu.edu.cn