 Min Yang1†
 Qinghong Duan
- 1Department of Medical Imaging, the Affiliated Tumor Hospital of Guizhou Medical University, Guiyang, China
- 2Department of Advanced Application Team, GE Healthcare, Shanghai, China
- 3Department of Breast Surgery, the Affiliated Tumor Hospital of Guizhou Medical University, Guiyang, China
- 4Department of Medical Imaging, The Affiliated Hospital of Guizhou Medical University, Guiyang, China
Objective: To develop and validate a radiomics nomogram based on pre-treatment, early treatment ultrasound (US) radiomics features combined with clinical characteristics for early prediction of response to neoadjuvant chemotherapy (NAC) in breast cancer.
Method: A total of 217 patients with histological results of breast cancer receiving four to eight cycles of NAC before surgery from January 2018 to December 2020 were enrolled. Patients from the study population were randomly separated into a training set (n = 152) and a validation set (n = 65) at a ratio of 7:3. A total of 788 radiomics features were extracted from each region of interest in the US image at pre-treatment baseline (radiomic signature, RS1), early treatment (after completion of two cycles of NAC, RS2) and delta radiomics (calculated between the pre-treatment and post-treatment features, Delta RS). The Max-Relevance and Min-Redundancy (mRMR) and the least absolute shrinkage and selection operator (LASSO) regression were applied for feature selection. The predictive nomogram was built based on the radiomics signature combined with clinicopathological risk factors. Discrimination, calibration, and prediction performance were further evaluated in the validation set.
Results: Of the 217 breast masses, 127 (58.5%) were responsive to NAC and 90 (41.5%) were non-responsive. Following feature selection, nine features in RS1, 11 features in RS2, and eight features in Delta RS remained. With multivariate analysis, the RS1, RS2, Delta RS, and Ki-67 expression were independently associated with breast NAC response. However, the performance of the Delta RS (AUCDelta RS = 0.743) was not higher than RS1 (AUCRS1 = 0.722, PDelta vs RS1 = 0.086) and RS2 (AUCRS2 = 0.811, PDelta vs RS2 =0.173) with the Delong test. The nomogram incorporating RS1, RS2, and Ki-67 expression showed better predictive ability for NAC response with an area under the curve (AUC) of 0.866 in validation cohorts than either the single RS1 (AUC 0.725) or RS2 (AUC 0.793) or Ki-67 (AUC 0.643).
Conclusion: The nomogram incorporating pre-treatment and early-treatment US radiomics features and Ki-67 expression showed good performance in terms of NAC response in breast cancer, thereby providing valuable information for individual treatment and timely adjustment of chemotherapy regimens.
Introduction
Breast cancer is one of the most common cancers in women and is the leading overall cause of cancer-related death in females worldwide (1). Neoadjuvant chemotherapy (NAC), which was proposed by Frei in 1982, refers to the systemic cytotoxic drug treatment for non-metastatic tumors before radical surgery or radiotherapy (2). For breast cancer, preoperative NAC is likely to reduce the clinical stage and tumor size and alleviate lymph node metastasis. The treatment can improve the rate of breast-conserving surgery for patients with resectable surgery and create an opportunity for surgery for patients whose tumors cannot be removed surgically, hence becoming the standard treatment for selected high-risk breast cancers such as tumors ≥2 cm in size and for locally advanced disease (namely, tumors initially ineligible for resection) (3). However, not all patients benefit from NAC, and those who fail to respond to treatment face the risk of delayed surgery and aggravated disease. Early prediction of patient treatment response can timely adjust the chemotherapy regimen and avoid patients suffering from severe toxic and side effects from NAC.
In current clinical practice, the effect of NAC is commonly evaluated by medical imaging techniques and immunohistochemistry (IHC). The evaluation of pathologic complete response (pCR) of breast tumors could accurately reflect real changes in lesions, but pCR evaluation can only be performed after radical surgery, and preoperative NAC cannot be timely adjusted (4). In addition, it has been suggested that the response evaluation criteria in solid tumor (RECIST) be used to record changes in the maximum diameter of breast cancer lesions before and after NAC to evaluate its efficacy, but this strategy can only be evaluated after the chemotherapy cycle is completed and visual interpretations are generally subjective and may lead to mistakes at the cut-off values (5).
With the rapid development of fractionated biological techniques, the expression of a few biomarkers may be associated with the prediction of response to NAC at the time of initial diagnosis. A recent meta-analysis of the relationship between the expression level of Ki-67 before NAC showed that the pCR rate of patients in the Ki-67 high-expression group was 3.1-fold that of the low expression group. Ki-67 is an indicator of cell proliferation and thus may be utilized as a predictor and prognostic index of NAC efficacy in breast cancer (6, 7). However, a series of factors, namely, heterogeneous patient populations, small sample size, poor representativeness of the tumor tissues derived from core biopsies, and different NAC regimens may lead to the inability of Ki-67 to accurately predict the response to NAC (8).
In the digital era, recent studies have illustrated that tumor characteristics at the genetic and cellular levels can be captured from medical images by high-throughput feature extraction and computation. Radiomics involves the extraction and analysis of large amount of quantitative imaging features to provide a comprehensive characterization of entire tumors rather than from a relatively limited tissue sample and can reveal predictive or prognostic associations between images and medical outcomes (9, 10). Ultrasonography, based on its broad adaptability, low cost, non-radiation, and rapid and non-invasive features, is essential for the management of breast cancer from diagnosis, staging, and treatment planning to postoperative surveillance and prognosis of malignant tumor evaluation. The China Anti-Cancer Association breast cancer guidelines strongly recommend that patients be re-evaluated for therapy response regularly using ultrasound (US) after each two cycles of NAC (11). However, visual assessment and qualitative descriptions for US features mainly depend on the personal clinical experience and subjective judgment of doctors, which inevitably leads to inter-observer variability and subjective diagnostic decision-making assessment of tumor heterogeneity (12, 13). The integration of radiomics features, namely, first-order statistics, texture, and wavelet features extracted from the US images can significantly increase the objectiveness of image diagnosis. A radiomics methodology has been more recently applied to distinguish benign malignant breast lesions or predict lymph node status, prognosis, and even treatment response (14, 15). However, most of the current studies focus on the analysis of MRI or CT images, and a few studies have reported radiomic features of breast masses analyzed using breast US. More importantly, due to the high heterogeneity and complexity of the internal structure of malignant tumors, the imaging characteristics before and after chemotherapy have obvious differences in microstructure. Studies have shown that pre-treatment initial images are often related to primary tumor characteristics, while images after chemotherapy can reflect the active state of the tumor. Extracting the high-order imaging radiomic features and analyzing the differences in features before and after treatment, namely, delta radiomics, can more accurately evaluate sensitivity to chemotherapy (16).
The purpose of this study was to develop a radiomics signature based on first-order statistics, textural, and wavelet features from breast cancer US images at pre-treatment and early treatment and also the corresponding delta radiomics of NAC, and further develop a multi-parameter radiomics prediction model to evaluate the efficacy predictive value of the model for NAC of breast cancer. This strategy is expected to achieve early assessment of NAC therapy-responsive vs. -unresponsive in breast cancer from the routine US images, which can provide more accurate prediction performance and obviate the need for chemotherapy in select settings.
Materials and Methods
Patients
Ethical approval for this retrospective study was obtained from our institutional review board, and informed consent was waived. A total of 217 patients with breast cancer confirmed by pathology in the Affiliated Cancer Hospital of Guizhou Medical University from December 2018 to December 2020 were selected. Figure 1 shows the identification, eligibility, and inclusion of patients in the study. The inclusion criteria were: 1) Patients with invasive breast carcinoma confirmed by histopathology from biopsy in the hospital for the first time who had not been treated before; 2) Patients received the NAC regimen based on paclitaxel and anthracycline drugs for four to eight chemotherapy cycles; 3) US examination was performed at pre-treatment baseline (radiomics signature, RS1) and early treatment (after completion of the two cycles of chemotherapy, RS2). The exclusion criteria included the following: 1) Bilateral lesions or multiple lesions on one side; 2) The lesion was too large to be fully visible in one section or the image quality was poor with artifacts; and 3) No complete clinicopathological data or US images. The clinical and histopathological data were collected from patient medical records and included age, histological type, clinical staging, molecular subtype, and proliferation marker Ki-67 expression, which were recorded by noting the percentage of positively stained malignant cells. The Ki-67 level was classified as positive when the threshold value was ≥14%, whereas it was classified as negative when the threshold value was <14% (17, 18). Then, patients from the study population were grouped using randomly stratified sampling in a ratio of 7:3 to obtain a training set (n = 152; 89 responders, 63 non-responders) and a validation set (n = 65; 38 responders, 27 non-responders).
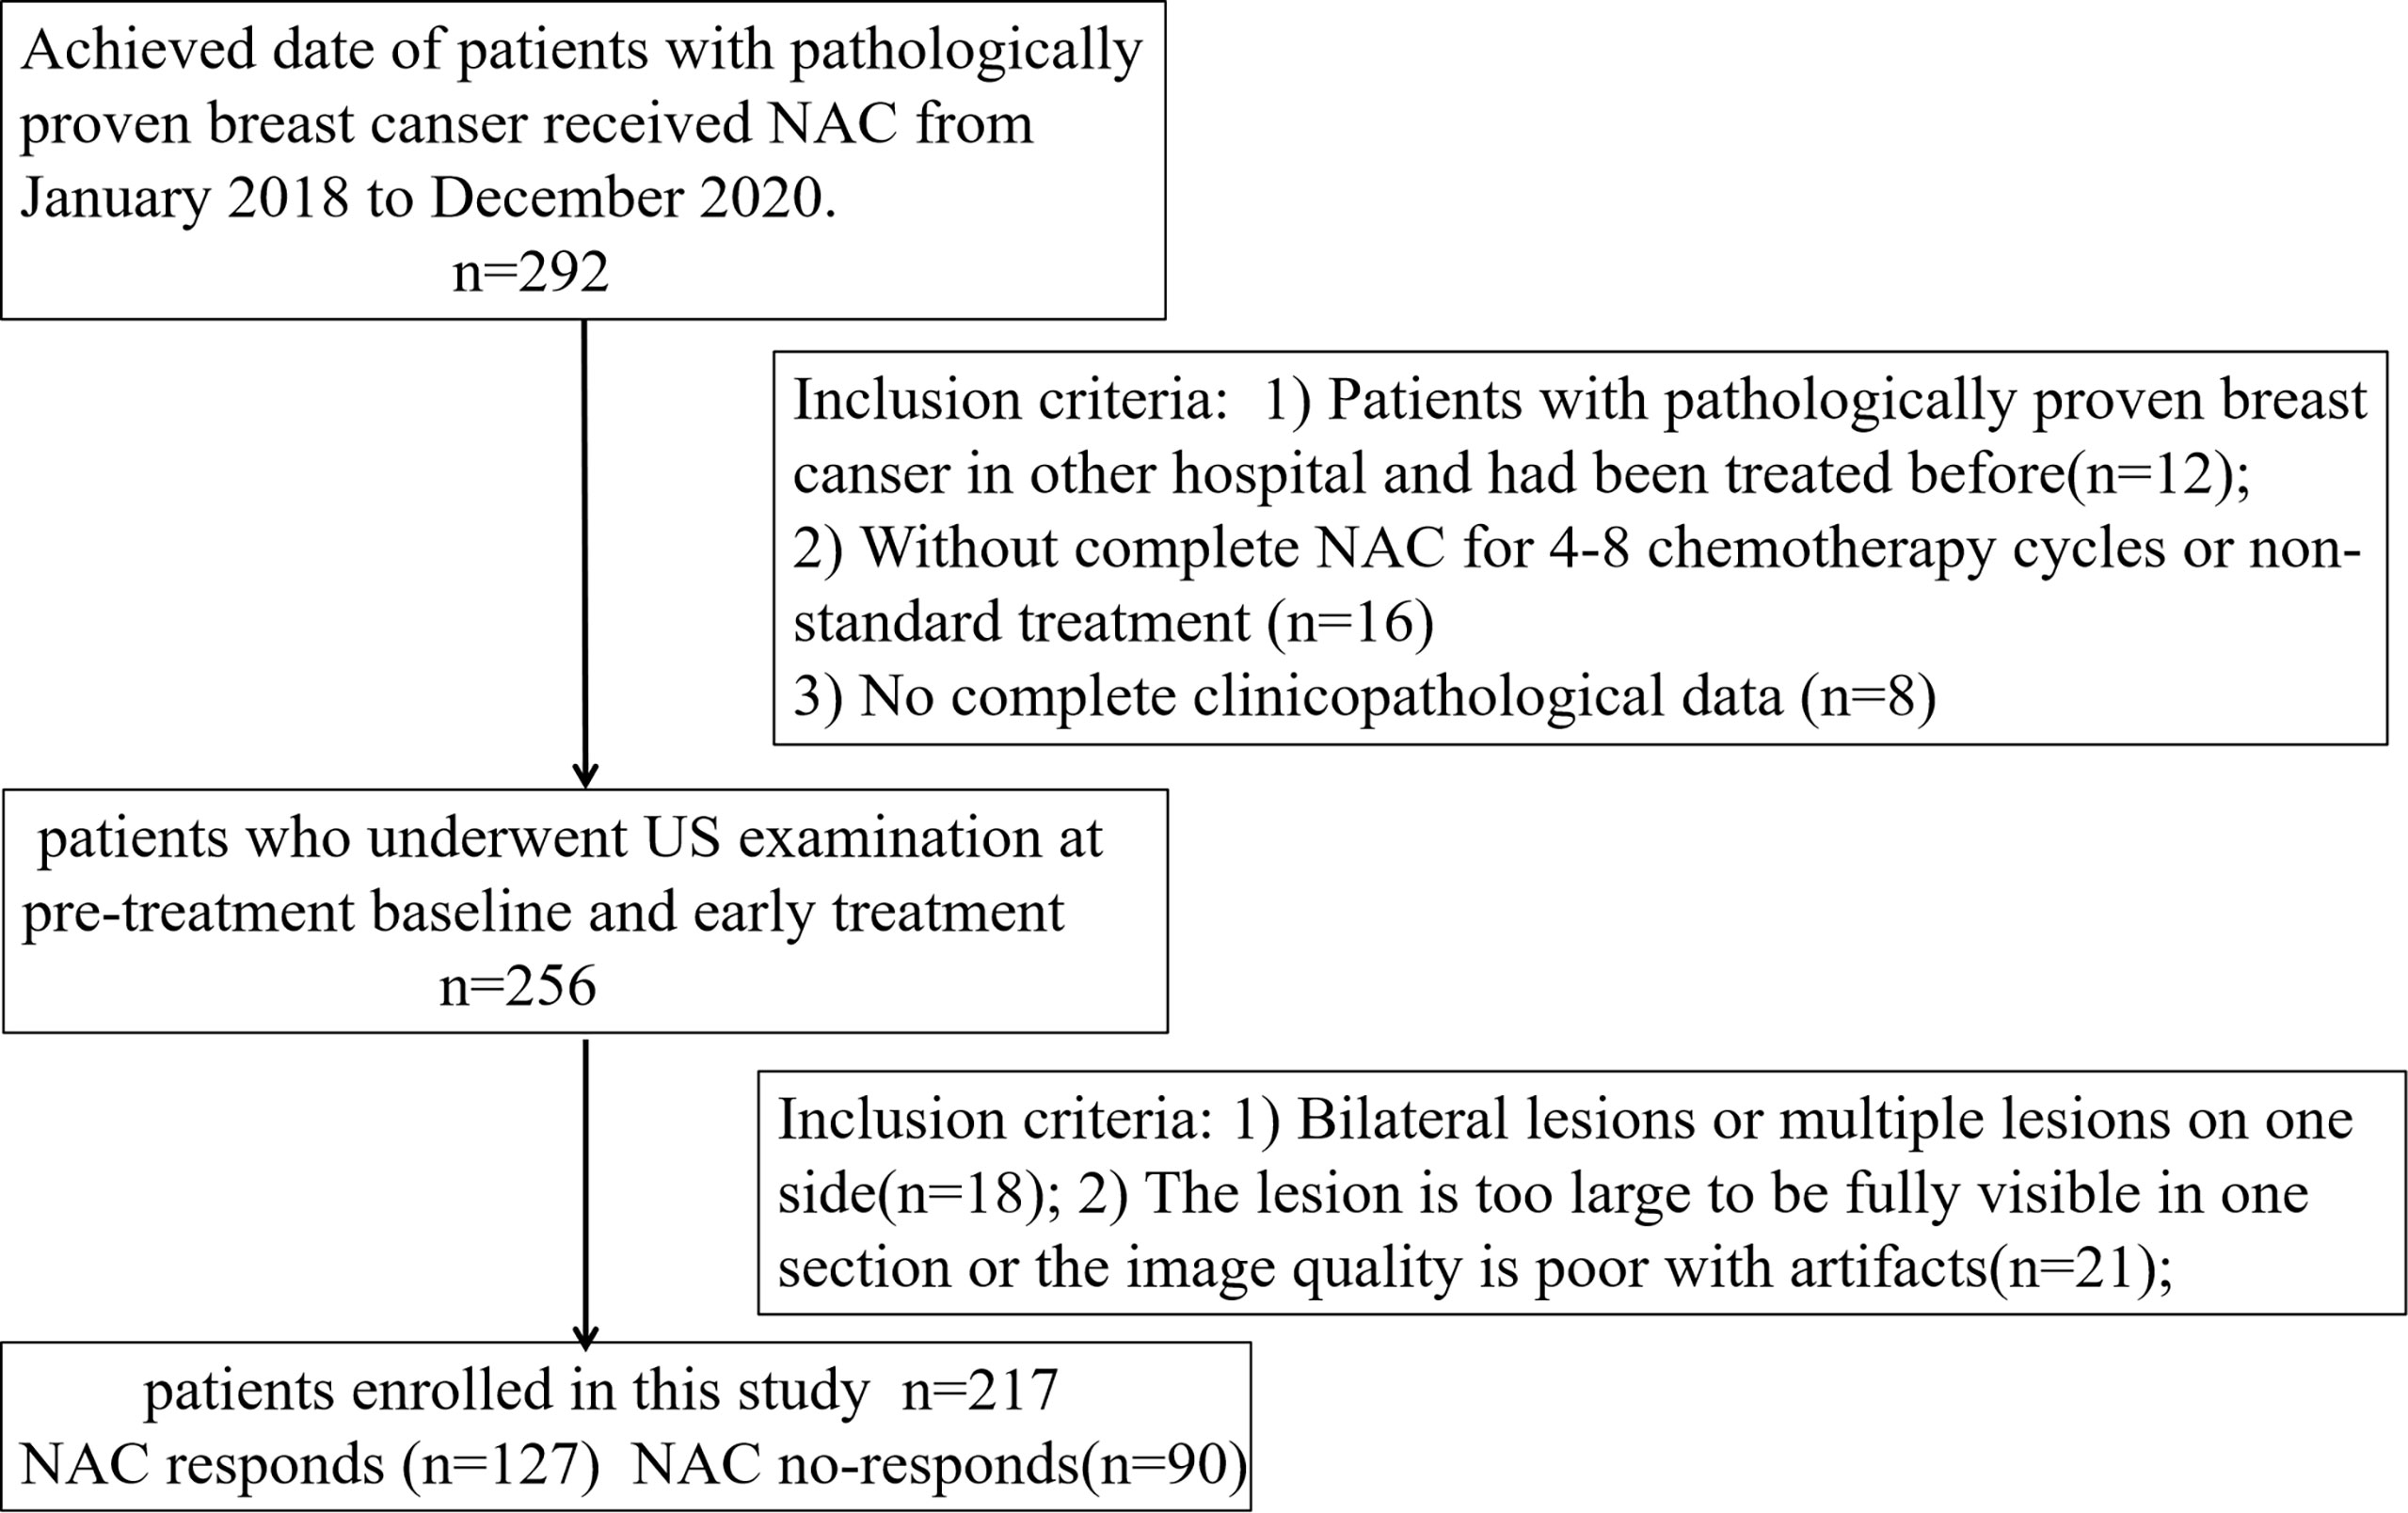
Figure 1 Flowchart shows study population and exclusion criteria.
Participants were then classified as responders (R) or non-responders (NR) based on the radiological evaluation by the RECIST-based criteria in tumor size reduction. The size of breast lesions was evaluated by two radiologists with more than five years of working experience, where each of them was performed twice for interobserver and intraobserver reproducibility and the error range of measurement of the two radiologists is within 5 mm. The response standard of RECIST is a percent reduction in tumor size (in its longest dimension) between pre-treatment and post-treatment times of at least 30% (19), and in order to avoid single examination measurement error, the tumor size was determined by ultrasound and MRI image. In this study, a patient was described as R when the tumor size of both ultrasound and MRI measurements all reduced by at least 30% compared to the pre-treatment dimensions, and other patients being considered as NR.
US Examination and Image Feature Analysis
All patients were examined using a Logiq E9® scanner (GE Healthcare, Wauwatosa, WI, USA) equipped with a linear array transducer having a central frequency of 7 MHz. Ultrasonography was performed at pre-treatment baseline and at early treatment (after completion of the two cycles of chemotherapy). According to the characteristics of breast lesions, appropriate frequency, depth, focus, gain, and time gain compensation curves were selected to achieve the best grayscale US imaging quality. According to alder grade, the blood flow signal with the highest resistance index (RI) in the lesion was collected, and the average value of three times was taken (20). The grayscale images with the largest long-axis cross-section image were saved in DICOM format.
Then, the lesion was evaluated according to the second edition of the 2013 US Breast Imaging Report and Data Analysis System (BI-RADS) by the two radiologists with more than five years of working experience without knowing any clinical data and pathological results (21). The grayscale ultrasonographic features of tumors, namely, lesion maximum diameter, internal echo, micro-calcification, morphology, blood flow grade (grades 1 and 2 were classified as hypovascular, while grades 3 and 4 were classified as hypervascular), and RI were recorded in detail.
Image Segmentation and Feature Extraction
A flowchart of the processing step using the radiomics method for predicting NAC responses is shown in Figure 2. The image of pre-NAC and early post-NAC US imaging per lesion were used for analysis. A region of interest (ROI) was manually drawn around the boundary of the index mass on the grayscale image by a >5 year-experienced radiologist using the ITK-SNAP software (http://www.itksnap.org/). A two-dimensional ROI of the tumor before NAC (ROI-1) and after NAC (ROI-2) was delineated on the US images. Fifty patients were randomly selected for the radiologist to perform the second segmentation after 1 week. Then, the ROI segmented images were imported into the USKit software (ultrasound kit, version 1.3.0, GE Healthcare) for automatic feature extraction, namely, first-order features, shape features, texture features, and transform features. First-order features mainly described the distribution of voxel intensities within the lesions in the CT image; shape features mainly described the geometric and shape characteristics of the lesions in the CT image; and texture features based on gray-level co-occurrence matrix (GLCM) and gray level run length matrix (GLRLM) mainly described the texture with the spatial relationship between the distance and angle of different pixel pairs. To enhance intricate patterns in the data invisible to the human eye, advanced filters, including wavelet decompositions with all possible combinations of high (H) or low (L) pass filters in each of the three dimensions (HHH, HHL, HLH, LHH, LLL, LLH, LHL, and HLL), were applied.
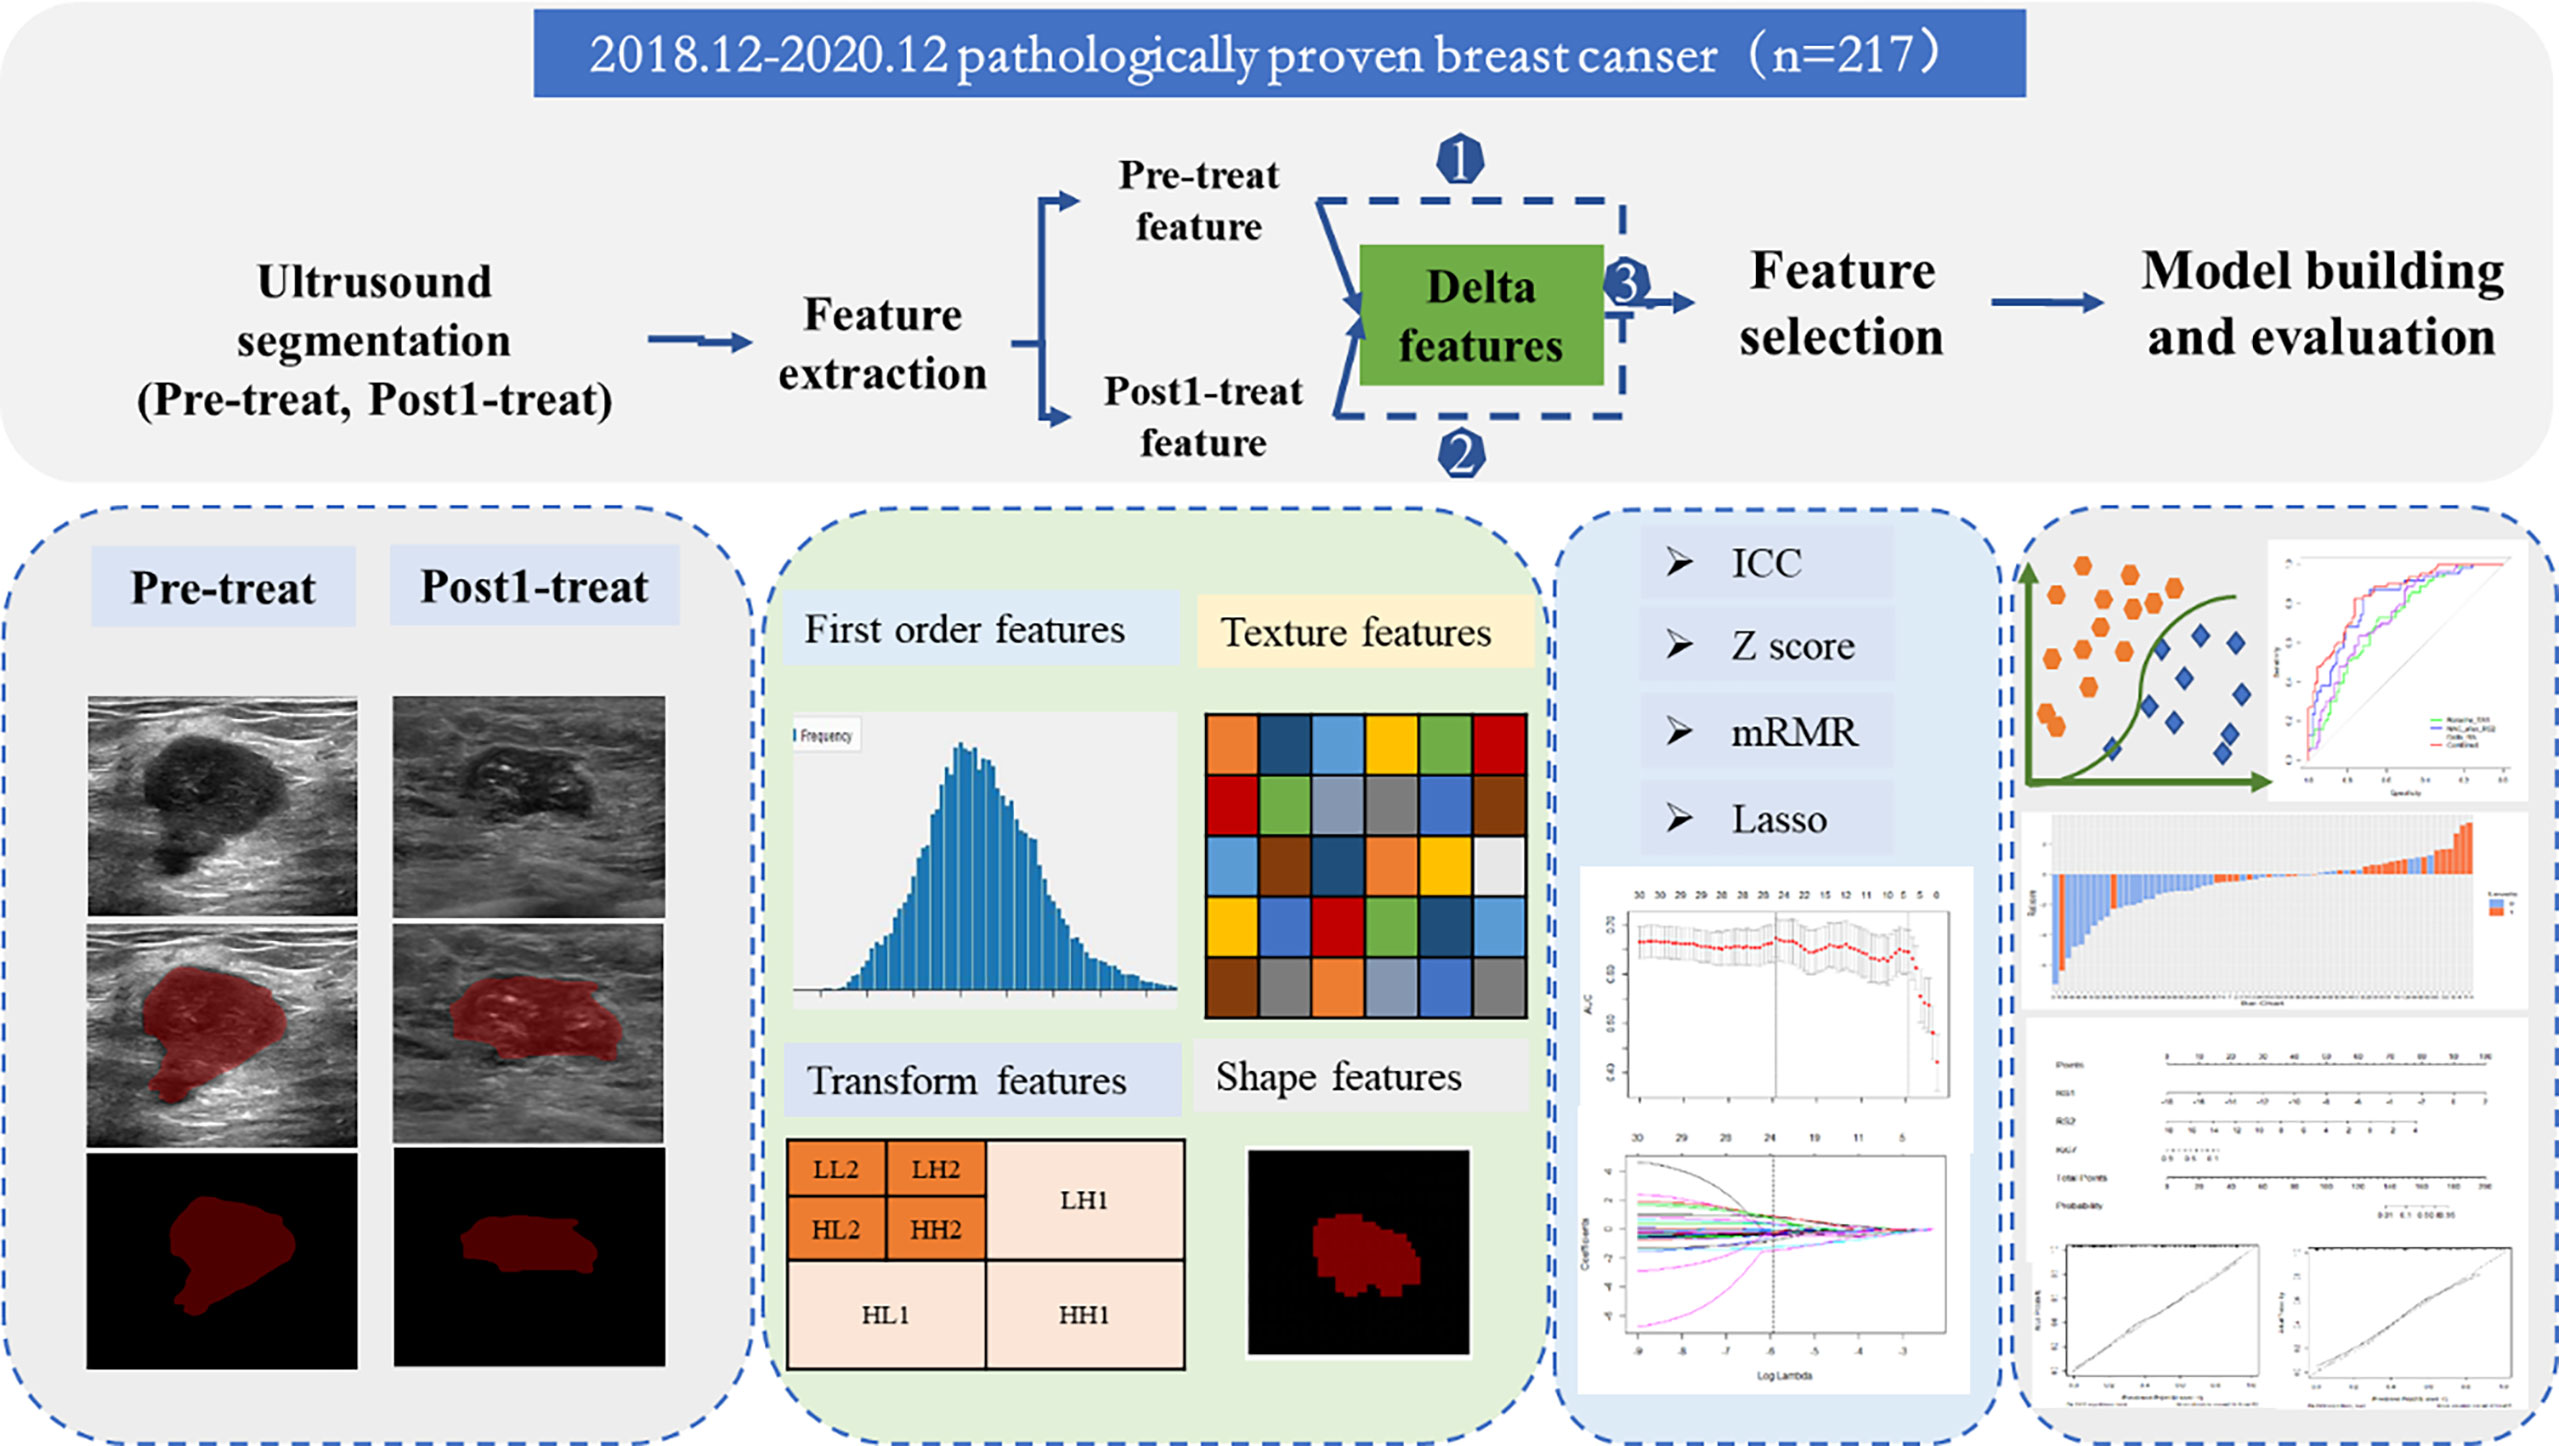
Figure 2 A flowchart of the processing step using the radiomic method for predicting NAC response.
The radiomic features of pre-NAC and early post-NAC US imaging were directly obtained from the pre-mapped ROI, and the delta radiomic features were defined as follows: Delta feature= (Early treatmentfeatures − Baselinefeature)/Baselinefeature. A total of 1,576 radiomics features of each patient (788 features at each time point) were finally extracted, and the corresponding of 788 delta radiomic features were obtained at the same time.
Intraclass correlation coefficient (ICC) was used to evaluate the consistency of evaluation results among physicians. The level of clinical significance evidence of the ICC was judged by the previous similar ultrasound radiomics study: an ICC of <0.40 was rated as ‘Poor’, ICC of 0.40–0.59 as ‘Fair’, ICC of 0.60–0.74 as ‘Good’ and ICC of 0.74–1.00 as ‘Excellent’ (22).
Feature Selection
Before the feature selected process, the abnormal and missing values were replaced by the median, the ICC was calculated to ensure repeatability and stability of features with the threshold of 0.7. Max-Relevance and Min-Redundancy (mRMR) and the least absolute shrinkage and selection operator (LASSO) regression were used to select significant features (23). Then, a radiomics score was calculated using a formula incorporating the selected features that were weighted by their respective coefficients.
Development of the Prediction Model
The prediction model for predicting tumor responses to NAC were developed using data from the training group. First, the univariate analyses were performed to select the significant factors, including clinical features and grayscale US features. Then, single-factor statistically significant indicators with P-values <0.05 were included in multivariate logistic regression analysis, and factors with P-values <0.05 were considered independent predictors after the multivariate analysis. Finally, the selected predictive features were incorporated with a radiomics signature to establish logistic regression models and verify the stability of the constructed model by 10-fold cross-validation in the training group. For comparison, a clinical model only comprising significant clinical information was constructed. In addition, Receiver operating characteristic (ROC) curves were plotted with the optimal cut-off value that was defined as maximizing the Youden index (Sensitivity + Specificity − 1). Bar diagrams were plotted to clearly display the discrimination performance of the nomogram. The area under the curve (AUC), sensitivity, specificity, and accuracy were then calculated using the training set.
Prediction Performance Evaluation of the Nomogram
The prediction performance of the generated radiomics nomogram and the radiomics and clinicopathological combined nomogram were further tested in the independent validation set using the same cut-off value determined in the training set. The accuracy, sensitivity, specificity, and AUC of the ROC curve were plotted to assess the prediction performance of the nomogram. The Delong test was used to compare the combined model with the other constructed model. The agreement between the observed outcome frequencies and predicted probabilities was assessed using a calibration curve to explore the predictive accuracy of the nomogram (24).
Statistical Analysis
Statistical analysis was performed using SPSS 22.0 (Chicago, IL, USA) and R software (version 3.6.0; https://www.Rproject.org). An independent t-test was used to compare continuous variables with a normal distribution, while the Mann–Whitney U test was used to compare continuous variables with an abnormal or unknown distribution. The χ² test was used to compare categorical variables. A P-value of <0.05 was considered statistically significant. The “mRMRe” and “glmnet” packages were applied to perform mRMR and LASSO, respectively. The ROC curve of each model was plotted using the “pROC” package. The “rms” package was used to build the nomogram.
Results
Patient Information and Clinicopathologic Characteristics
The basic information and clinicopathologic characteristics of the research population are summarized in Table 1. According to the clinical and pathological criteria assessment, 127 (62.5%) and 90 (37.5%) patients were classified as responders and non-responders, respectively. Univariate analysis revealed several clinical factors that were obviously different (P <0.1), namely, molecular typing and PR status, and Ki-67 status were significantly different (P <0.001) (Table 1). A clinical model based on the significant clinical factors for NAC response prediction was constructed using logistic regression analysis. In addition, no statistical difference patient clinical characteristics were observed between the training set and the validation set as shown in Table 1.
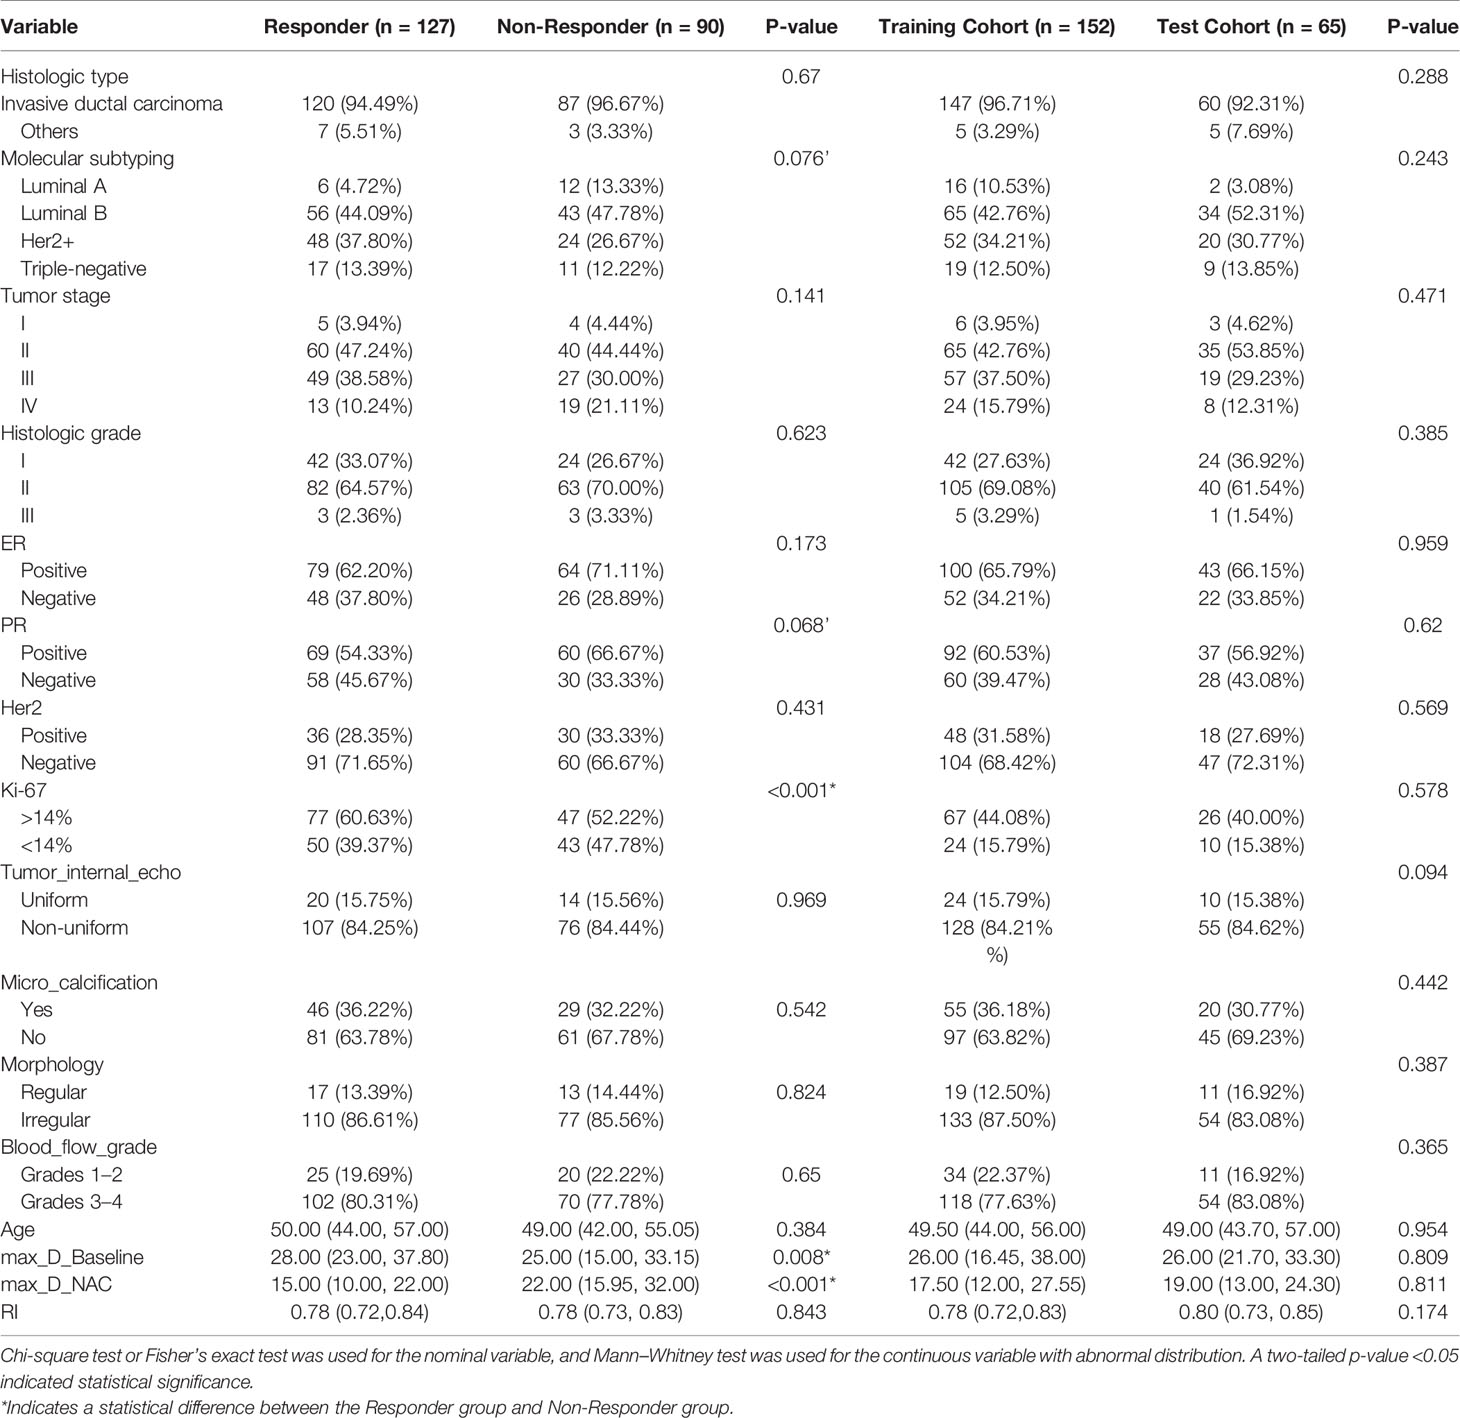
Table 1 Basic information, clinicopathologic characteristics, and two-dimensional general ultrasonic characteristics of the study cohorts.
Comparison of Grayscale Ultrasonographic Features
The results of comparison of grayscale ultrasonographic features of the clinical response group to the non-response group at pre-treatment baseline and at early treatment are shown in Table 1. The responder group demonstrated a statistically significant reduction in maximum tumor size from 28 mm prior to treatment compared to 15 mm after early treatment (P <0.05). Except for the maximum tumor size, tumor internal echo, microcalcification, morphology, blood flow grade, and RI of the grayscale US image, none of the parameters demonstrated significant differences in terms of distribution between the two groups (Table 1). In addition, no significant difference was found between the training set and the validation set. The results of the consistency test showed that the ICC of the two observers was within the range of 0.74–0.91.
Feature Selection and Radiomic Signature Construction
A total of 788 candidate radiomic features were extracted from each ROI. Before selection, the 126 features remained with the ICC (>0.7) to ensure repeatability of features. Next, 30 features were selected with the mRMR. Figure 3 shows the process of feature selection at baseline, early treatment, and Delta radiomics (baseline minus early treatment) by LASSO regression. Then, 9 features in RS1(pre-treatment baseline), 11 features in RS2 (early treatment), and 8 features in Delta RS (baseline minus early treatment) were selected and the ICC values of each feature are greater than 0.7, specific values are shown in Figure S1 in the Supplementary Material. In addition, the Akaike information criterion was used to evaluate goodness of fit. The selected NAC responder-related features shown in Table 2 were used to calculate the radiomics score of RS1, RS2, and Delta RS according to their coefficients by the corresponding formula. No statistical differences in the distribution of the radiomics score were found between the training and validation set. The selected significant features were used to establish the radiomics signature and 10-fold cross-validation has verified the stability of the constructed model in the training cohort (the results are shown in Figure S2 in the Supplementary Material).
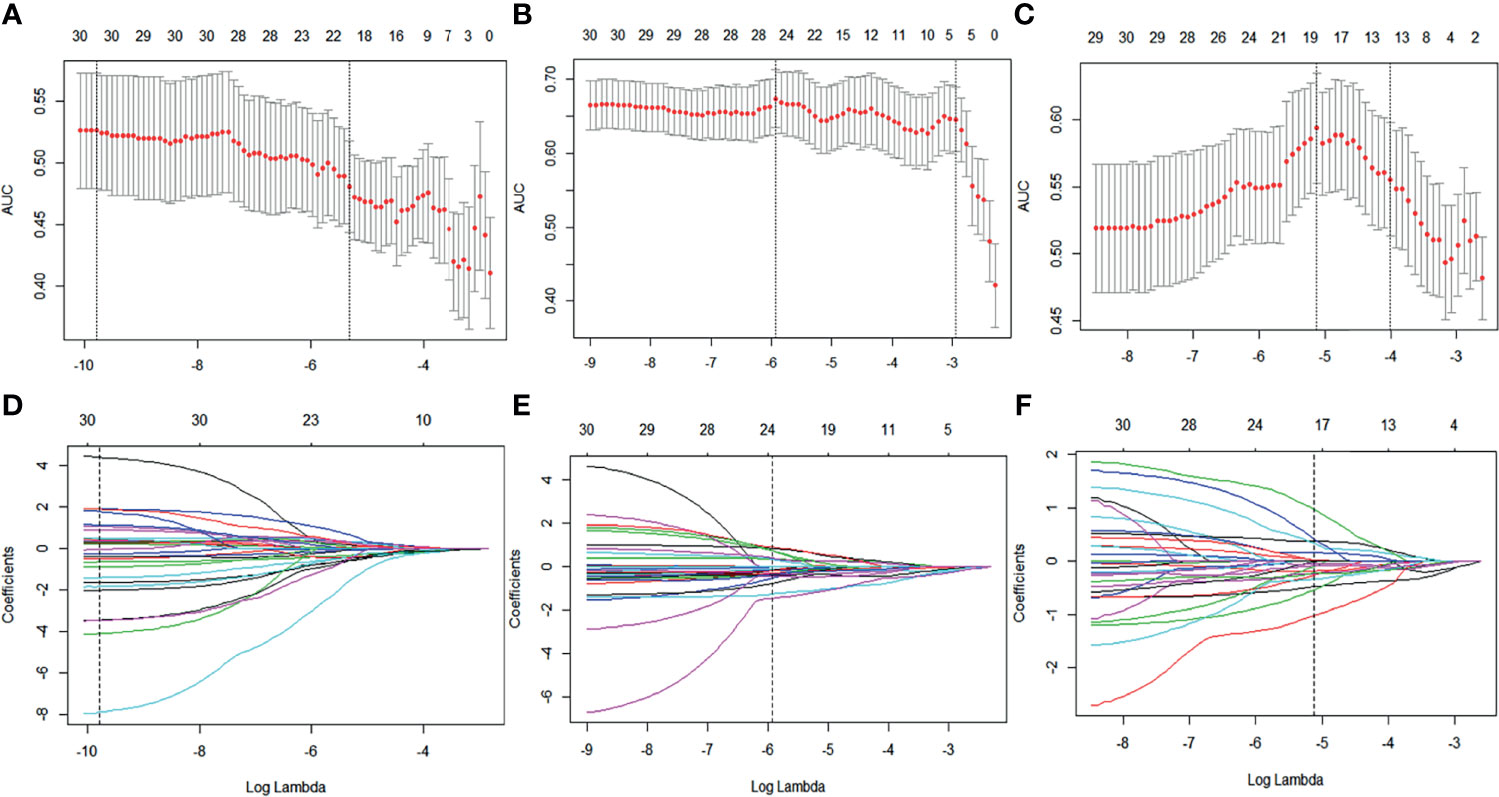
Figure 3 Baseline, early treatment, and delta radiomics feature selection by LASSO regression. (A–C) Selection of tuning parameters (lambda value) in the LASSO model using 10-fold cross-validation by the minimum criteria. (D–F) LASSO coefficient profiles of the radiomics features.

Table 2 Selected features and their coefficients in the model.
The optimal cut-off values of RS1, RS2, and Delta RS for the radiomics score for discriminating NAC responders and non-responders were −0.298, −0.4343, and −0.6979, respectively, in the training group. Radiomics score bar diagrams were plotted based on this optimal cut-of value in the training and validation set (Figure 4). The bar diagrams demonstrated good discrimination performance of the radiomics score.
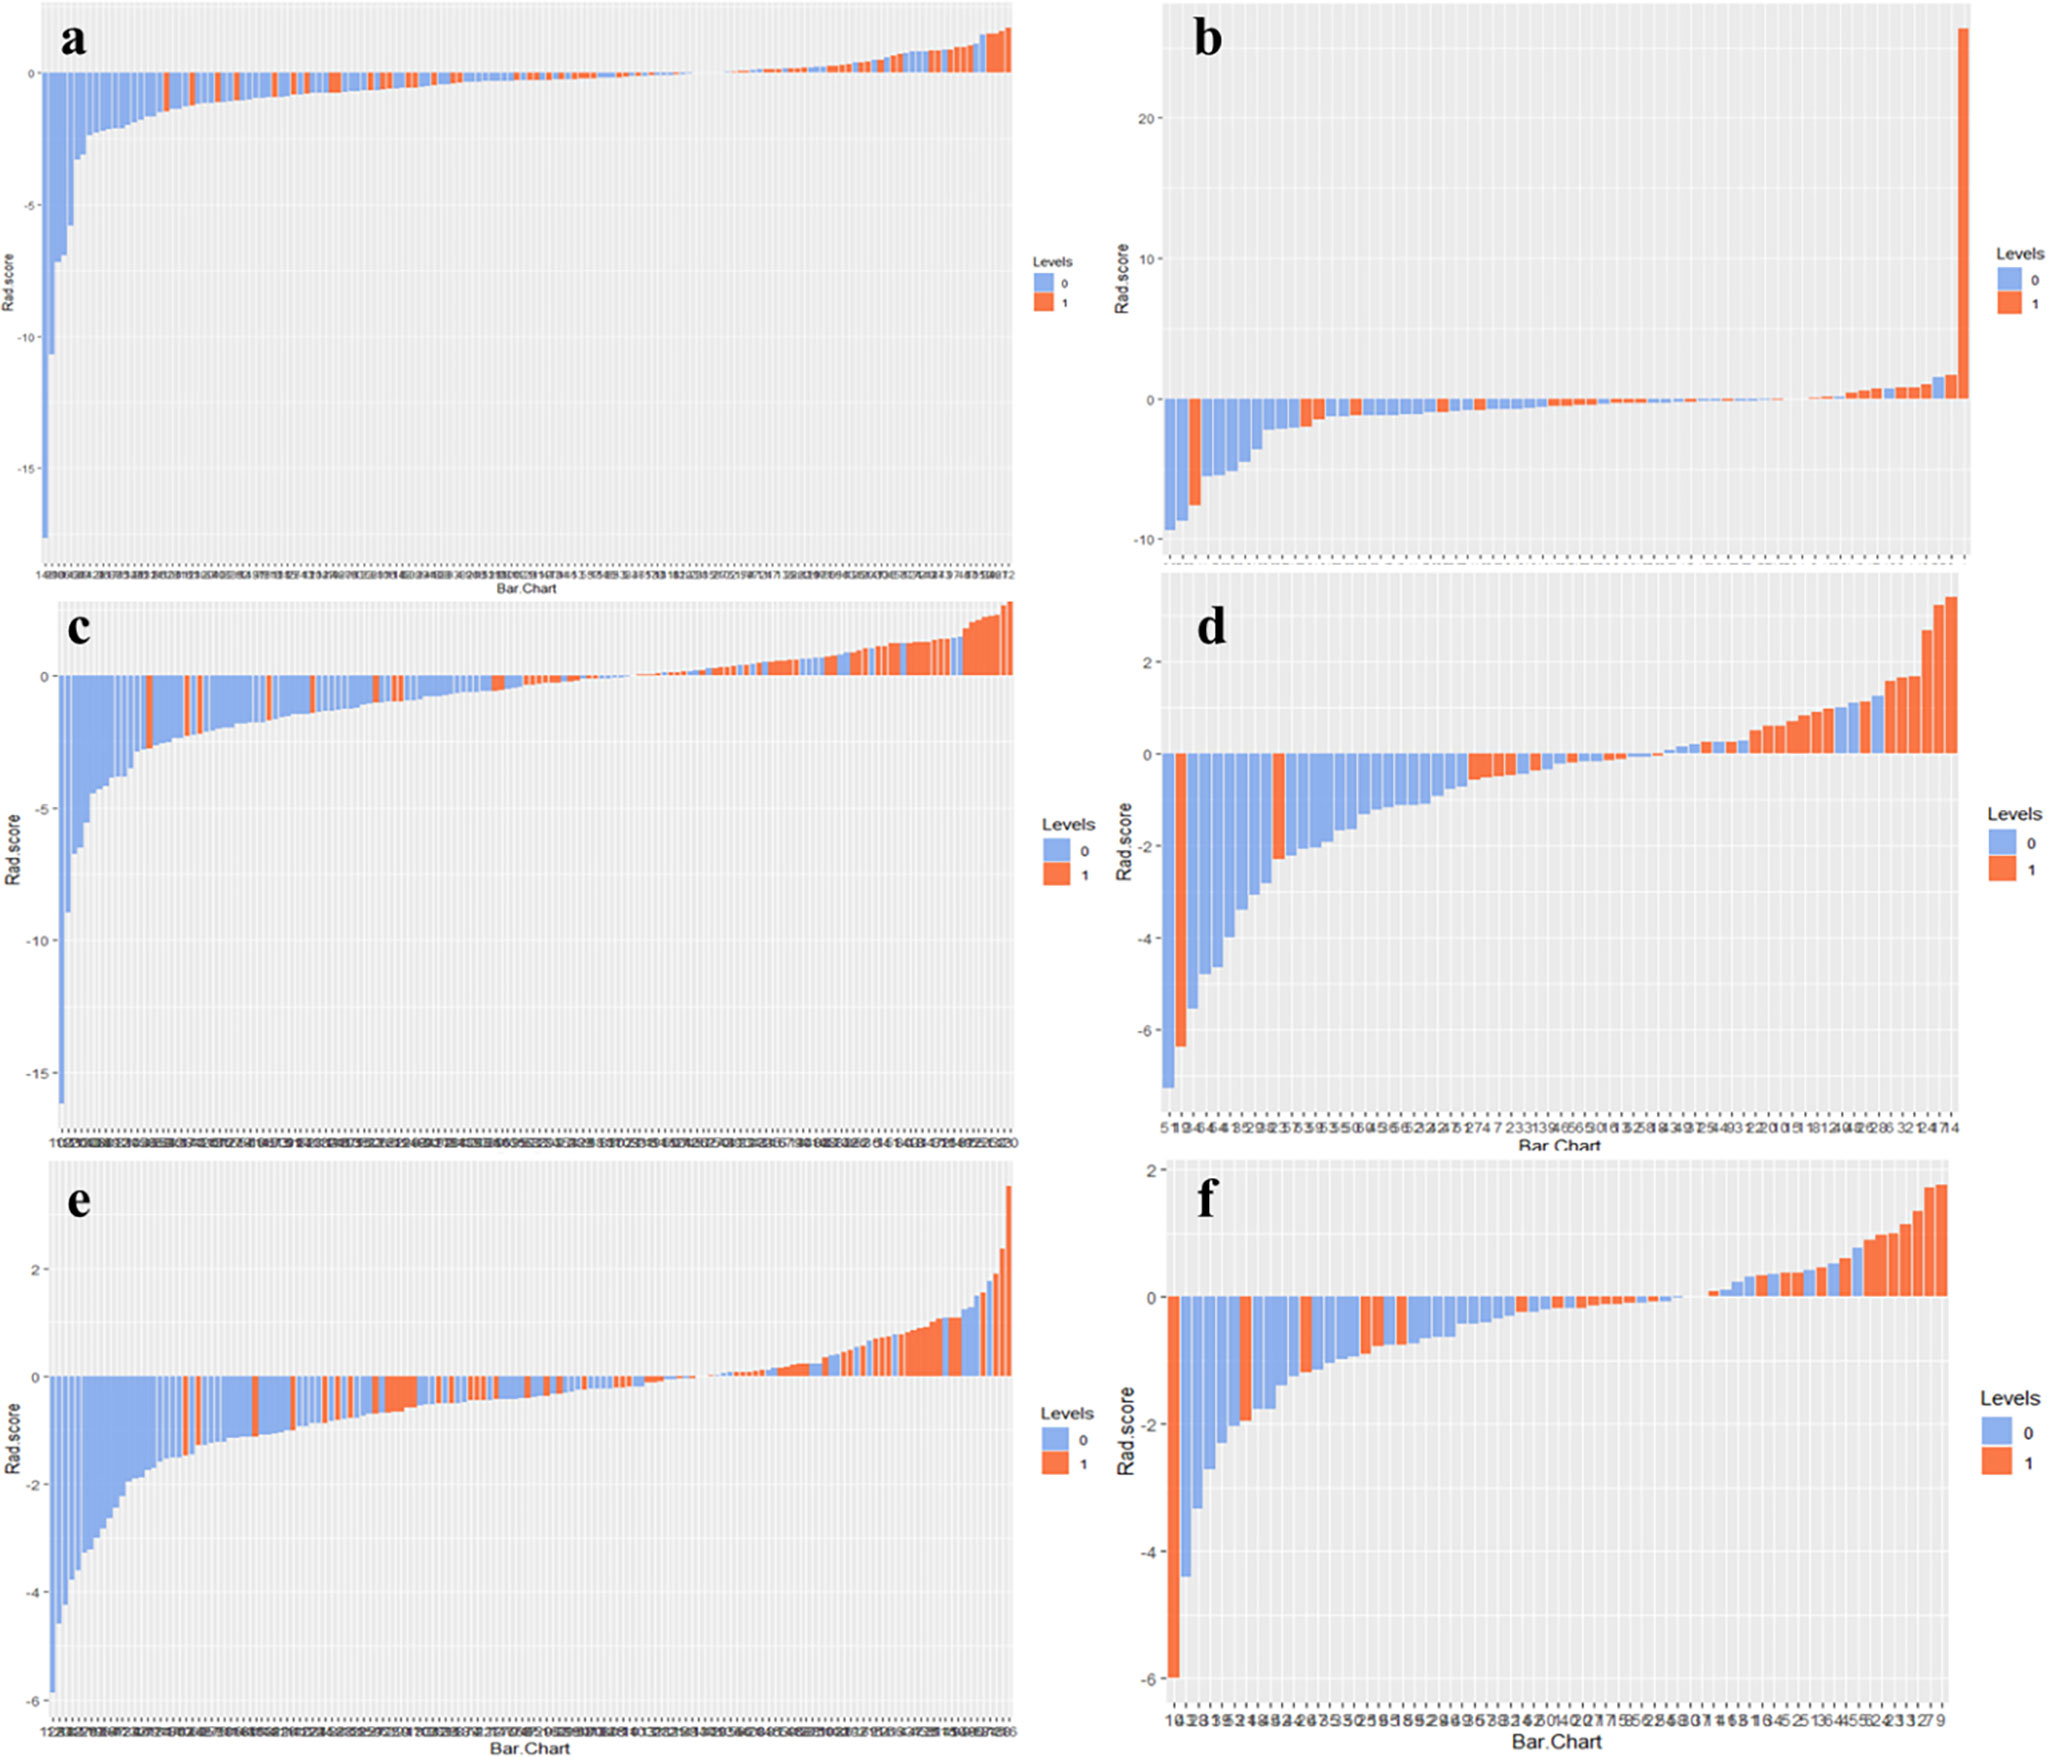
Figure 4 Radiomics score bar diagrams of RS1, RS2, and Delta RS in the training (A, C, E) and validation sets (B, D, F) were plotted. Up and down bars refer to the predicted NAC responding and NAC non-responding lesions, respectively. Blue and red bars refer to actual NAC responding and NAC non-responding lesions, respectively.
Development and Validation of the Radiomics Nomogram
The performance of the RS1, RS2, Delta RS, and nomogram for predicting NAC responders in the training and validation groups is shown in Table 3, and the ROC curves of different model in both groups are presented in Figure 5. The prediction performance of the RS1, RS2, and Delta radiomics models was moderate, with AUC values of 0.722 (95%CI [0.643, 0.802]), 0.811 [95%CI (0.742, 0.880)], and 0.743 [95%CI (0.666, 0.820)], respectively, in the training cohort and 0.725 [95%CI (0.543, 0.814)], 0.793 [95%CI (0.679, 0.908)], and 0.714 [95%CI (0.582, 0.847)] in the validation cohort, respectively, and Ki-67 with an AUC of 0.643 [95%CI (0.575, 0.706)]. However, the performance of the Delta RS (AUCDelta RS = 0.743) was not higher than the RS1 (AUCRS1 = 0.722, PDelta vs RS1 = 0.086) and RS2 (AUCRS2 = 0.811, PDelta vs RS2 =0.173) with the Delong test. The nomogram that incorporated RS1, RS2, and Ki-67 displayed AUC values of 0.849 (95%CI [0.789, 0.908]) for predicting NAC responders in the training cohort, and the accuracy, sensitivity, and specificity were 0.750, 0.825, and 0.764, respectively. In the validation cohort, it also displayed excellent prediction efficacy, with an AUC of 0.866 (95%CI [0.779, 0.954]), and the accuracy, sensitivity, and specificity were 0.785, 0.852, and 0.798, respectively.
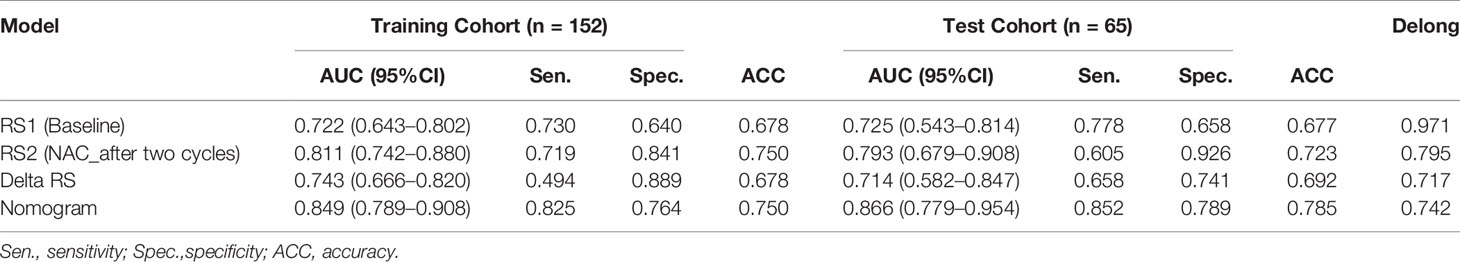
Table 3 Comparison of different models.
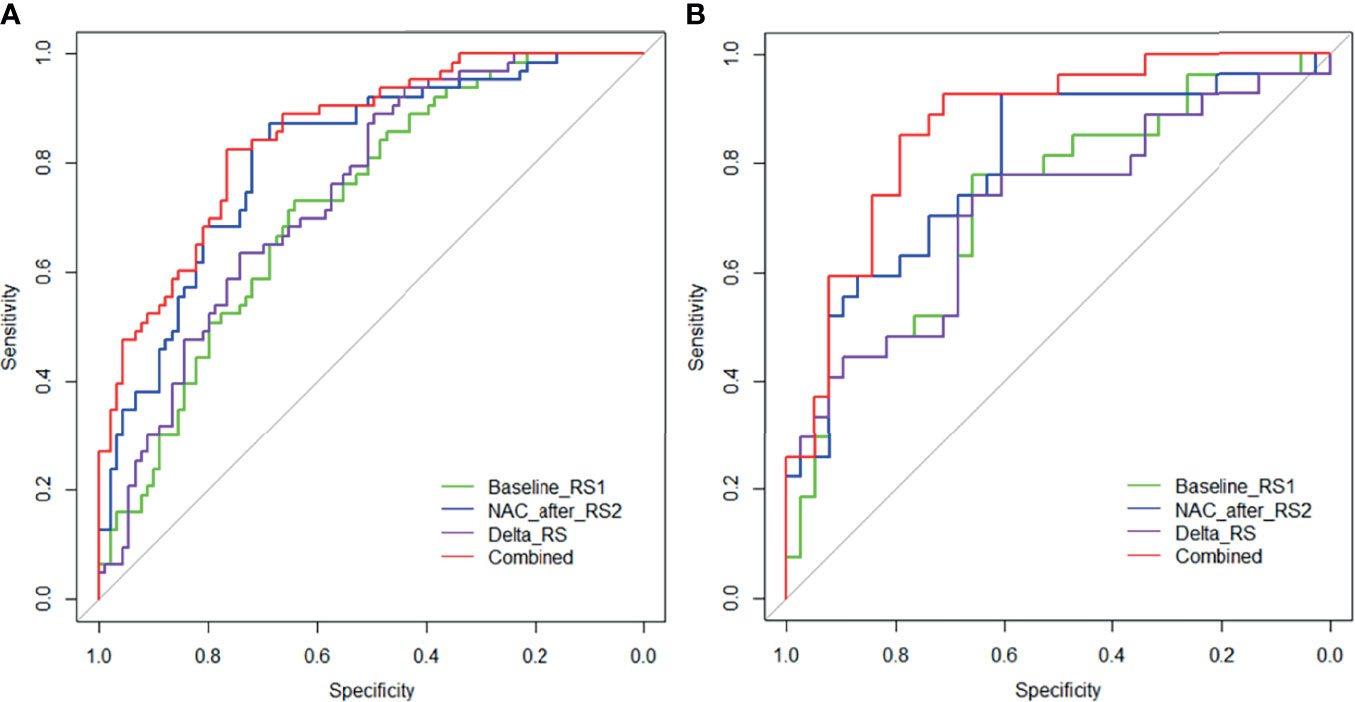
Figure 5 Receiver operating characteristic (ROC) curves of the RS1 (green lines), RS2 (blue lines), Delta RS (purple lines), and nomogram (red lines) in the training (A) and validation (B) groups.
Table 4 displays the results of multivariable logistic regression analysis of risk factors for NAC responders in the training group. RS1, RS2, and Ki-67 expression states were demonstrated to be significant for NAC responders (P <0.001), and the nomogram is shown in Figure 6A. The calibration curves (Figures 6B, C) in the training and validation groups were tested using the Hosmer–Lemeshow test and yielded a non-significant difference in training cohorts (P = 0.11) and validation cohorts (P = 0.75), respectively. The nomogram showed good agreement in predicting NAC responders in advance compared to the comprehensive evaluation of radiological and pathological conformation after completing NAC treatment. In addition, the Delong test was applied to test the significance among the models (nomogram vs. RS1 <0.001, nomogram vs. RS2 = 0.376).
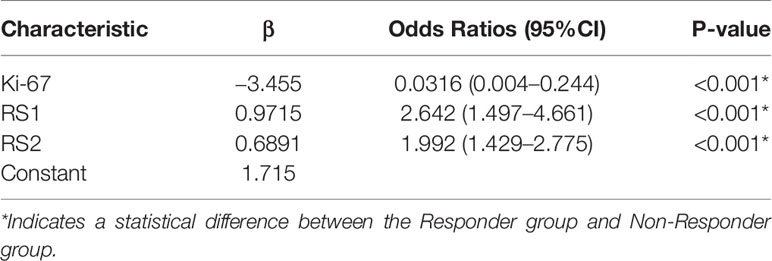
Table 4 Multivariable logistic regression analysis of risk factors of NAC responders.
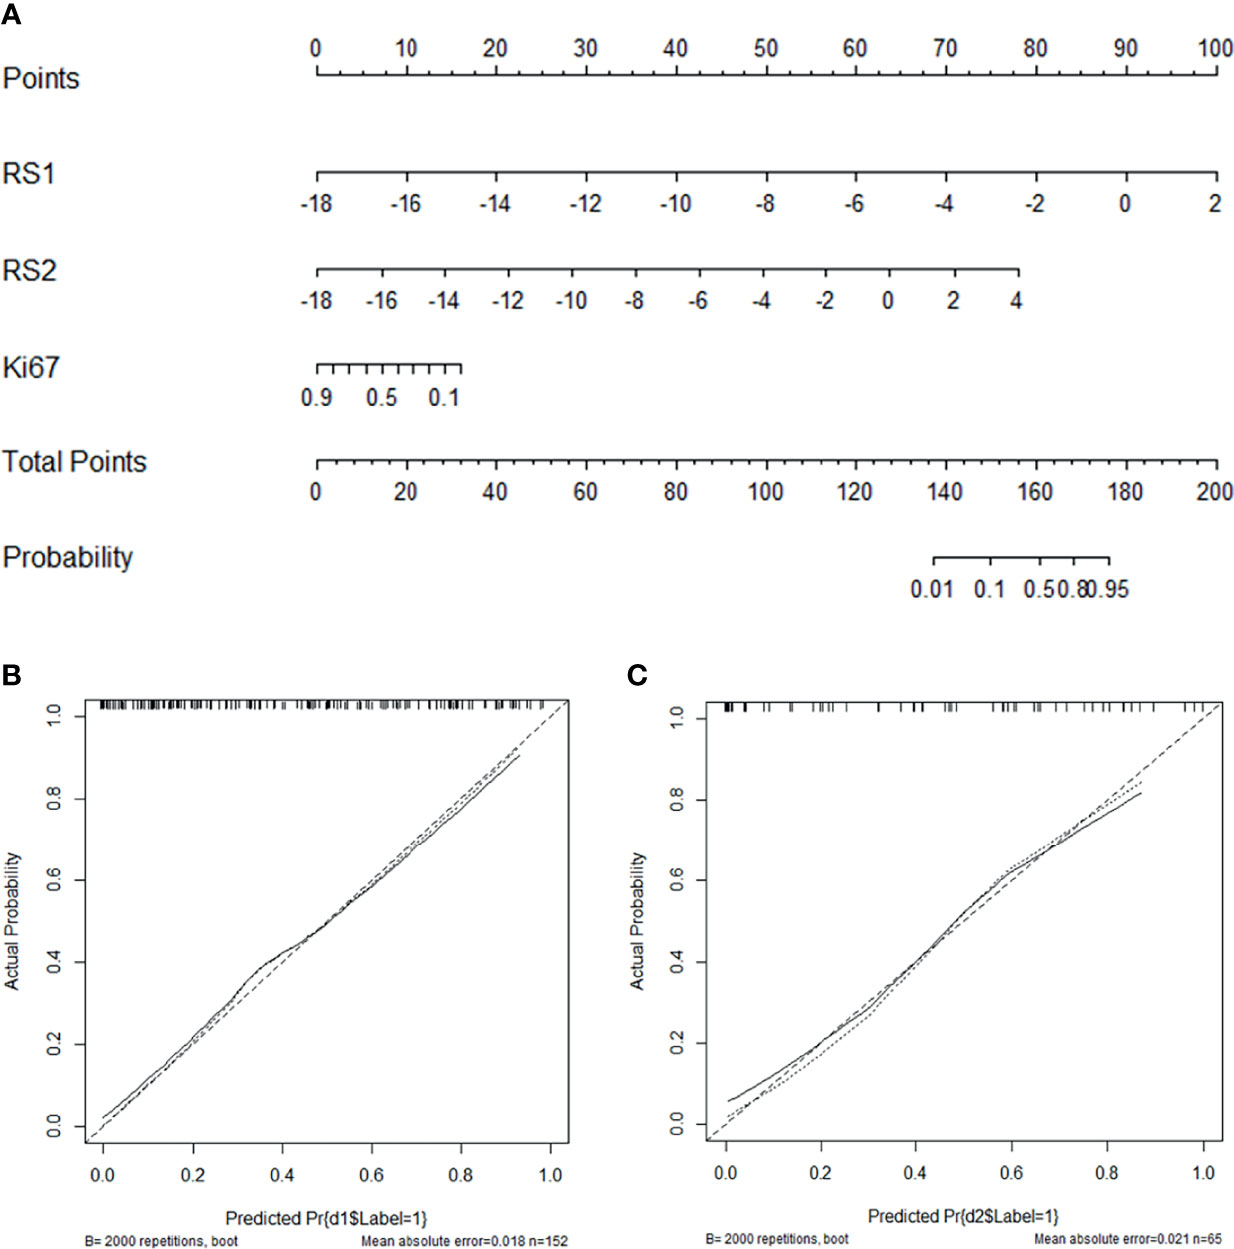
Figure 6 Nomogram with the RS1, RS2, and Ki-67 incorporated (A) and calibration curves for the nomogram in the training (B) and validation groups (C).
Discussion
In the present study, a US image-based radiomics score was built and validated as a pre-treatment independent predictor of NAC response in patients with breast cancer. Then, we developed a nomogram based on pre-treatment and early-treatment US data and significant clinical characteristics (Ki-67 expression) to predict NAC response. The nomogram displayed an excellent ability to predict NAC response, with AUC values of 0.849 and 0.866, and accuracy values of 0.750 and 0.785 in the training and validation cohorts, respectively. The calibration curve showed that the predicted and actual result of NAC were in good agreement. The outperformance of the nomogram indicated that combining high-throughput digital US features with Ki-67 expression could be helpful for the early individualized prediction of efficiency to NAC in breast cancer, which might provide useful information for clinical decision-making.
Pathological evaluation, as the gold standard for breast cancer NAC curative effect evaluation, has a lag, and the treatment plan cannot be adjusted in a timely manner according to the progress of the condition of the patient. Current methods for assessing responses to NAC mostly use conventional breast imaging, namely, X-ray, US, and MRI. However, most of these imaging examinations mainly depend on changes in mass size to make therapeutic judgments and predictions, and it is very difficult to accurately predict the efficacy of NAC before or during chemotherapy (25, 26). The results of this study also showed that the characteristics of 2-D US, including tumor internal echo, microcalcification, morphology, blood flow grade, and RI did not significantly differ between the responder or non-responder groups at pre-treatment and early-treatment phases. Although the tumor size may decrease when chemotherapy is effective, the regression pattern of tumor cells after NAC is non-concentric, but rather sporadic and multifocal. The size of the lesion may not significantly change, but the tumor cell density is significantly reduced, which results in errors in evaluating images (27, 28).
Radiomics is a relatively new technique that can excavate high-throughput digital features from digital medical images to quantify the heterogeneous characteristics of breast tumors, and analysis of this data may improve diagnosis, molecular typing, chemotherapy effect evaluation, prognosis analysis, and prediction (29, 30). Several previous studies have investigated the usefulness and reliability of MRI-radiomics models in predicting pathologic responses to NAC in breast cancer (31, 32). To the best of our knowledge, few reports have investigated the feasibility of using an US radiomics approach in breast cancer to predict the pCR of NAC, and most of these focus on pre-treatment (9). Pre-treatment baseline imaging is associated with primary tumor characteristics, while after-treatment images can directly reflect the response status, such as tumor cells becoming hypoxic and fragmenting after NAC, leaving fibrotic and collagenous tissues (33, 34). Therefore, we constructed a radiomics model by incorporating pre- and early treatment US information based on the combination of the original characteristics of the tumor and changes in the internal characteristics of the tumor after early treatment to accurately predict the response to chemotherapy, which differed from previous radiomic studies that involved only pre-treatment MRI or US data for pCR prediction. As shown in the results, RS1 (pre-treatment baseline) and RS2 (at early treatment of two cycles of chemotherapy) were independent predictors of NAC response and showed good performance, with AUCs of 0.811 and 0.722, respectively, and accuracies of 0.750 and 0.678 in the training groups, respectively. RS2 had significantly higher predictive performance than RS1, further demonstrating the important predictive value of early post-treatment US imaging. However, as US imaging is relatively dependent on the examining physician, it is difficult for the imaging parameters such as mass level, gray gain scale, and US energy before and after chemotherapy to be highly consistent. The effects of chemotherapy vary due to different molecular types and stages of tumors, resulting in different structural heterogeneity, and the residual tumor tissue and necrotic tissue after chemotherapy may affect the comparison of radiomic features. The above two factors may lead to the instability and randomness of differences in radiomic features before and after chemotherapy, which may result in the model with Delta RS with decreased prediction performance and lead to a decrease in the accuracy and repeatability of NAC prediction. In addition, the results of this study showed that the predictive performance AUC and accuracy of the delta radiomics were 0.714 and 0.692, respectively, in the validation sets, which did not achieve an ideal predictive value and had limited clinical predictive value. The above reasons are related to our decision to exclude Delta RS from multivariable modeling in this study.
Radiomic models are commonly established by a black-box approach, which is usually uninterpretable or difficult to interpret in the inner mechanisms of the model in the prediction process. We selected the parameters to be included in the radiomics model and the corresponding tumor characteristics. Radiomics features are usually difficult to intuitively interpret by the naked eye, but these can capture the heterogeneity and complexity of the tumor microenvironment. In this study, nine features in RS1 (pre-treatment baseline), 11 features in RS2 (early treatment), and eight features in Delta RS (baseline-early treatment) were finally selected as the most predictive factors by LASSO regression with 10-fold cross validation (Table 2). Most of the selected features are first-order features and texture features after wavelet transform. The median represents the median gray level intensity within the ROI. Kurtosis is a measure of the ‘peakedness’ of the distribution of values in the image ROI. A higher kurtosis implies that the mass of the distribution is concentrated towards the tail(s) rather than towards the mean. A lower kurtosis implies the reverse: that the mass of the distribution is concentrated towards a spike near the mean value. Skewness measures the asymmetry of the distribution of values about the mean value (35, 36). Texture parameters reflect specific positions relative to each other and capture subtle changes occurring within images to quantify intra-tumor heterogeneity by the gray-level co-occurrence matrix (GLCM) and gray-level run-length matrix (GLRLM) methods. Cluster prominence is a measure of the skewness and asymmetry of the GLCM. A higher value implies more asymmetry about the mean, while a lower value indicates a peak near the mean value and less variation about the mean. IMC2 assesses the correlation between the probability distributions of i and j (quantifying the complexity of the texture) (37, 38). Wavelet transform, which calculates the resolution of image signals in different time, space, and frequency scale planes, is useful for replaying even subtle but important texture information that is neglected by observers in low-contrast US images, so the texture features after wavelet transform are used to construct prediction models in many radiomic studies (39, 40). Besides, radiomics features ‘wavelet.LH_firstorder_Mean’, ‘wavelet.LHH_glcm_ ClusterProminence’,’wavelet.LHH_glcm_Imc2’, and ‘wavelet.HHH_firstorder_Kurtosis’ were significantly associated with response status in both pre- and early-treatment US images, implying that these features robustly reflect NAC response.
Next, we found that several clinical characteristics are correlated to NAC response, namely, molecular typing, PR, and Ki-67 expression. However, only Ki-67 expression similar to the RS1 and RS2 was a significant predictive indicator, with a moderate AUC of 0.643 after multivariate logistic regression analysis, and as expected, Ki-67 expression as a dependent predictor of NAC response in breast cancer has been proven in other studies (41, 42). Taking into account that clinical factors and radiomic features influence NAC responses, a nomogram that incorporated RS1, RS2, and Ki-67 state was developed, and the nomogram showed excellent ability to predict NAC response, with an AUC of 0.866 and accuracy of 0.785 in the validation cohort, achieving greater predictive efficacy than the other constructed model (Figure 6). Nomograms are simple tools for decision-making that have been widely used to predict medical prognosis and outcomes by combining multiple risk factors. Recently, a study (16) using radiomic nomograms to predict pCR of NAC in breast cancer based on the pre- and post-treatment US information of patients reported prediction performance that was slightly higher than ours. This may be related to the fact that the mass after complete chemotherapy is more reflective of the internal state of the tumor than the mass after early chemotherapy. This study focused on making a comprehensive prediction of the efficacy of the tumor after complete NAC and before surgery. Compared to that study, our greatest advantage is that NAC responses can be evaluated pre-treatment and early-trial-treatment, and there is no need to complete a full chemotherapy regimen for several months. Patients who are predicted to be non-responders could have a modified chemotherapy regimen, proceed directly to surgery, or investigate other treatment options. Early knowledge of patient response to chemotherapy allows early intervention and potential adaptation of a more personalized therapy.
This study has some limitations that should be acknowledged. First, due to patients’ own conditions, namely, breast density, mass size and location, and fat layer thickness, to obtain clearer imaging, each instrument parameters of the patient such as imaging depth, imaging focus, 2-D and color gain size were not consistent. Thus, it is hard to evaluate whether different parameters would affect the performance of the model. Second, the present study was a single-center research study. Although the nomogram has been evaluated to have a good predictive performance in an independent validation cohort, further additional investigations at other centers is necessary to assess the reliability of this prediction model.
In conclusion, breast US imaging at pre-treatment and early treatment (after completion of two cycles of chemotherapy) provides prognostic information on tumor response for NAC. We developed a NAC response prediction model based on pre-treatment and early treatment US imaging and significant clinical characteristics (Ki-67 expression) using a radiomics approach and obtained good predictive performance. Both nomogram and radiomics signature can be used as tools to assist clinicians in assessing NAC response in breast cancer patients, which can serve as an effective diagnostic reference for determination of NAC efficacy and timely guide treatment.
Data Availability Statement
The raw data supporting the conclusions of this article will be made available by the authors, without undue reservation.
Ethics Statement
The studies involving human participants were reviewed and approved by the Affiliated Cancer Hospital of Guizhou Medical University. The patients/participants provided their written informed consent to participate in this study.
Author Contributions
MY and QDu contributed to the conception and design of the experiments. MY, HL, and QDa performed experiments, analyzed data, and wrote the manuscript. LY, SZ, ZW, and JL assisted in the writing and analyzed data. All authors listed have made a substantial, direct, and intellectual contribution to the work and approved it for publication.
Funding
This work was supported by Science and technology Fund project of Guizhou Provincial Health Commission (No. gzwjkj2020-1-042) and Guizhou Science and technology support project, social development field ([2021]451).
Conflict of Interest
Author HL was employed by GE Healthcare.
The remaining authors declare that the research was conducted in the absence of any commercial or financial relationships that could be construed as a potential conflict of interest.
Publisher’s Note
All claims expressed in this article are solely those of the authors and do not necessarily represent those of their affiliated organizations, or those of the publisher, the editors and the reviewers. Any product that may be evaluated in this article, or claim that may be made by its manufacturer, is not guaranteed or endorsed by the publisher.
Acknowledgments
We thank LetPub (www.letpub.com) for its linguistic assistance during the preparation of this manuscript.
Supplementary Material
The Supplementary Material for this article can be found online at: https://www.frontiersin.org/articles/10.3389/fonc.2022.748008/full#supplementary-material
References
1. Ferlay J, Colombet M, Soerjomataram I, Dyba T, Randi G, Bettio M, et al. Cancer Incidence and Mortality Patterns in Europe: Estimates for 40 Countries and 25 Major Cancers in 2018. Eur J Cancer (2018) 103:356e87. doi: 10.1016/j.ejca.2018.07.005
2. Frei E. Clinical Cancer Research: An Embattled Species. Cancer (1982) 50:1979–92. doi: 10.1002/1097-0142(19821115)50:103.0.CO;2-D
3. Spring LM, Gupta A, Reynolds KL, Gadd MA, Bardia A. Neoadjuvant Endocrine Therapy for Estrogen Receptor–Positive Breast Cancer: A Systematic Review and Meta-Analysis. JAMA Oncol (2016) 2(11) 29(7):1477–86. doi: 10.1001/jamaoncol.2016.1897
4. Rebollo-Aguirre AC, Gallego-Peinado M, Sánchez-Sánchez R, Pastor-Pons E, García-García J, Chamorro-Santos CE, et al. Sentinel Lymph Node Biopsy After Neoadjuvant Chemotherapy in Patients With Operable Breast Cancer and Positive Axillary Nodes at Initial Diagnosis. Rev espanola medicina Nucl e imagen Mol (2013) 32(4):240–5. doi: 10.1016/j.remn.2013.03.006
5. Santos J, Bernreuter W, Keene K, Krontiras H, Carpenter J, Bland K, et al. Accuracy of Breast Magnetic Resonance Imaging in Predicting Pathologic Response in Patients Treated With Neoadjuvant Chemotherapy. Clin Breast Cancer (2011) 11(5):312–9. doi: 10.1016/j.clbc.2011.06.007
6. Chen X, He C, Han D, Zhou M, Wang Q, Tian J, et al. The Predictive Value of Ki-67 Before Neoadjuvant Chemotherapy for Breast Cancer: A Systematic Review and Meta-Analysis. Future Oncol (2017) 13(9):843. doi: 10.2217/fon-2016-0420
7. Brown JR, Digiovanna MP, Killelea B, Lannin DR, Rimm DL. Quantitative Assessment Ki-67 Score for Prediction of Response to Neoadjuvant Chemotherapy in Breast Cancer. Lab Invest (2014) 94(1):98–106. doi: 10.1038/labinvest.2013.128
8. Keam B, Im SA, Lee KH, Han SW, Oh DY, Kim JH, et al. Ki-67 Can be Used for Further Classifcation of Triple Negative Breast Cancer Into Two Subtypes With Different Response and Prognosis. Breast Cancer Res (2011) 13(2):R22. doi: 10.1186/bcr2834
9. Valdora F, Houssami N, Rossi F, Calabrese M, Tagliafico AS. Rapid Review: Radiomics and Breast Cancer. Breast Cancer Res Treat (2018) 169:217–29. doi: 10.1007/s10549-018-4675-4
10. Cho GY, Moy L, Kim SG, Baete SH, Moccaldi M, Babb JS, et al. Evaluation of Breast Cancer Using Intravoxel Incoherent Motion (IVIM) Histogram Analysis: Comparison With Malignant Status, Histological Subtype, and Molecular Prognostic Factors. Eur Radiol (2016) 26:2547–58. doi: 10.1007/s00330-015-4087-3
11. Shao Z, Jiang Z, Li J, Cheng S, Wang H. Chinese Anti-Cancer Association. Experts Consensus of Breast Cancer Neoadjuvant Therapy in China (Version 2019). China Oncol (2019) 29:390e400. doi: 10.19401/j.cnki.1007-3639.2019.05.009
12. Xiao Y, Zeng J, Niu L, Zeng Q, Zheng H. Computer-Aided Diagnosis Based on Quantitative Elastographic Features With Supersonic Shear Wave Imaging. Ultrasound Med Biol (2014) 40:275–86. doi: 10.1016/j.ultrasmedbio.2013.09.032
13. Zhang L, Liu YJ, Jiang SQ, Cui H, Tian JW. Ultrasound Utility for Predicting Biological Behavior of Invasive Ductal Breast Cancers. Asian Pac J Cancer Prev (2014) 15:8057–62. doi: 10.7314/APJCP.2014.15.19.8057
14. Liu C, Ding J, Spuhler K, et al. Preoperative Prediction of Sentinel Lymph Node Metastasis in Breast Cancer by Radiomic Signatures From Dynamic Contrast-Enhanced MRI. J Magnetic Resonance Imaging (2018) 49(1):131–40. doi: 10.1002/jmri.26224
15. Braman NM, Etesami M, Prasanna P, Dubchuk C, Gilmore H, Tiwari P, et al. Intratumoral and Peritumoral Radiomics for the Pretreatment Prediction of Pathological Complete Response to Neoadjuvant Chemotherapy Based on Breast DCE-MRI. Breast Cancer Res (2017) 18(19):57. doi: 10.1186/s13058-017-0846-1
16. Jiang M, Li C-L, Luo X-M, Chuan Z-R, Lv W-Z, Li X, et al. Ultrasound-Based Deep Learning Radiomics in the Assessment of Pathological Complete Response to Neoadjuvant Chemotherapy in Locally Advanced Breast Cancer-ScienceDirect. Eur J Cancer (2021) 147:95–105. doi: 10.1016/j.ejca.2021.01.028
17. Cuzick J, Dowsett M, Pineda S, Wale C, Salter J, Quinn E, et al. Prognostic Value of a Combined Estrogen Receptor, Progesterone Receptor, Ki-67, and Human Epidermal Growth Factor Receptor 2 Immunohistochemical Score and Comparison With the Genomic Health Recurrence Score in Early Breast Cancer. J Clin Oncol (2011) 29:4273–78. doi: 10.1111/j.1360-0443.2010.03125.x
18. Goldhirsch A, Wood WC, Coates AS, Gelber DR, Thürlimann B. Strategies for Subtypes— International Expert Consensus on the Primary Therapy of Early Breast Cancer 2011. Ann Oncol (2011) 22:1736–47. doi: 10.1093/annonc/mdr304
19. Eisenhauer EA, Therasse P, Bogaerts J, Schwartz LH, Sargent D, Ford R, et al. New Response Evaluation Criteria in Solid Tumours Revised RECIST Guide Line (Version 1.1). Eur J Cancer (2009) 45(2):228–47. doi: 10.1016/S1359-6349(09)70018-7
20. Jiang YX, Liu H, Liu JB, Zhu QL, Sun Q, Chang XY. Breast Tumor Size Assessment:Comparison of Conventional Ultrasound and Contrast-Enhanced Ultrasound. Ultrasound Med Biol (2007) 33(12):1873–81. doi: 10.1016/j.ultrasmedbio.2007.06.002
21. Mendelson EB, Morris E, Mendelson E. ACR BIRADS® Ultrasound. In: ACR BI-RADS® Atlas, Breast Imaging Reporting and Data System. Reston: American College of Radiology (2013).
22. van Egdom LSE, Lagendijk M, Heijkoop EHM, Koning AHJ, van Deurzen CHM, Jager A, et al. Three-Dimensional Ultrasonography of the Breast; An Adequate Replacement for MRI in Neoadjuvant Chemotherapy Tumour Response Evaluation? - RESPONDER Trial. Eur J Radiol (2018) 104:94–100. doi: 10.1016/j.ejrad.2018.05.005
23. Sauerbrei W, Royston P, Binder H. Selection of Important Variables and Determination of Functional Form for Continuous Predictors in Multivariable Model Building. Stat Med (2007) 26:5512–28. doi: 10.1002/sim.3148
24. Han L, Zhu Y, Liu Z, Yu T, He C, Jiang W, et al. Radiomic Nomogram for Prediction of Axillary Lymph Node Metastasis in Breast Cancer. Eur Radiol (2019) 29(7):3820–9. doi: 10.1007/s00330-018-5981-2
25. Fowler AM, Mankoff DA, Joe BN. Imaging Neoadjuvant Therapy Response in Breast Cancer. Radiology (2017) 285:358e75. doi: 10.1148/radiol.2017170180
26. Cortazar P, Zhang L, Untch M, Mehta K, Costantino JP, Wolmark N, et al. Pathological Complete Response and Long-Term Clinical Benefifit in Breast Cancer: The CTNeoBC Pooled Analysis. Lancet (2014) 384:164–72. doi: 10.1016/S0140-6736(13)62422-8
27. Derks MGM, van de Velde CJH. Neoadjuvant Chemotherapy in Breast Cancer: More Than Just Downsizing. Lancet Oncol (2018) 19:2e3. doi: 10.1016/S1470-2045(17)30914-2
28. Shao N, Xie C, Shi Y, Ye R, Long J, Shi H, et al. Comparison of the 7th and 8th Edition of American Joint Committee on Cancer (AJCC) Staging Systems for Breast Cancer Patients: A Surveillance, Epidemiology and End Results (SEER) Analysis. Cancer Manage Res (2019) 11:1433. doi: 10.2147/CMAR.S185212
29. Tagliafico AS, Piana M, Schenone D, Schenone D, Lai R, Houssami N, et al. Overview of Radiomics in Breast Cancer Diagnosis and Prognostication. Breast (2019) 49:74–80. doi: 10.1016/j.breast.2019.10.018
30. Lambin P, Leijenaar, Deist TM, Peerlings J, Jong ED, Timmeren JV, et al. Radiomics: The Bridge Between Medical Imaging and Personalized Medicine. Nat Rev Clin Oncol (2027) 14(12):749–62. doi: 10.1038/nrclinonc.2017.141
31. Liu Z, Li Z, Qu J, Zhang R, Zhou X, Li L, et al. Radiomics of Multiparametric MRI for Pretreatment Prediction of Pathologic Complete Response to Neoadjuvant Chemotherapy in Breast Cancer: A Multicenter Study. Clin Canc Res (2019) 25:3538–47. doi: 10.1158/1078-0432.CCR-18-3190
32. Xiong Q, Zhou X, Liu Z, Lei C, Yang C, Yang M, et al. Multiparametric MRI-Based Radiomics Analysis for Prediction of Breast Cancers Insensitive to Neoadjuvant Chemotherapy. Clin Transl Oncol (2020) 22:50–9. doi: 10.1007/s12094-019-02109-8
33. Junttila MR, De Sauvage FJ. Influence of Tumour Micro-Environment Heterogeneity on Therapeutic Response. Nature (2013) 501(7467):346–54. doi: 10.1038/nature12626
34. Pietras K, Östman A. Hallmarks of Cancer: Interactions With the Tumor Stroma. Exp Cell Res (2010) 316(8):1324–31. doi: 10.1016/j.yexcr.2010.02.045
35. van Griethuysen JJM, Fedorov A, Parmar C, Hosny A, Aucoin N, Narayan V, et al. Computational Radiomics System to Decode the Radiographic Phenotype. Cancer Res (2017) 77:e104–7. doi: 10.1158/0008-5472.CAN-17-0339
36. Traverso A, Wee L, Dekker A, Gillies R. Repeatability and Reproducibility of Radiomic Features: A Systematic Review. Int J Radiat Oncol (2018) 102:1143–58. doi: 10.1016/j.ijrobp.2018.05.053
37. Acharya UR, Ng WL, Rahmat K, Sudarshan VK, Ng KH. Data Mining Framework for Breast Lesion Classification in Shear Wave Ultrasound: A Hybrid Feature Paradigm. BioMed Signal Process Control (2017) 33:400. doi: 10.10.1016/j.bspc.2016.11.004
38. Srinivasan GN, Shobha G. Statistical Texture Analysis Proceedings of World Academy of Science. Eng Technol (2008) 36:2070–3740. doi: 10.5281/zenodo.3607779
39. Guo Y, Hu Y, Qiao M, Wang Y, Yu J, Li J, et al. Radiomics Analysis on Ultrasound for Prediction of Biologic Behavior in Breast Invasive Ductal Carcinoma. Clin Breast Cancer (2018) 18:e335–44. doi: 10.1016/j.clbc.2017.08.002
40. Hu S, Xu C, Guan W, Tang Y, Liu Y. Texture Feature Extraction Based on Wavelet Transform and Gray-Level Co-Occurrence Matrices Applied to Osteosarcoma Diagnosis. BioMed Mater Eng (2014) 24(1):129–43. doi: 10.3233/BME-130793
41. Yoshioka T, Hosoda M, Yamamoto M, Taguchi K, Hatanaka KC, Takakuwa E, et al. Prognostic Significance of Pathologic Complete Response and Ki67 Expression After Neoadjuvant Chemotherapy in Breast Cancer. Breast Cancer (2015) 22(2):185–91. doi: 10.1007/s12282-013-0474-2
Keywords: nomogram radiomics, ultrasound, neoadjuvant chemotherapy, breast cancer, Ki-67
Citation: Yang M, Liu H, Dai Q, Yao L, Zhang S, Wang Z, Li J and Duan Q (2022) Treatment Response Prediction Using Ultrasound-Based Pre-, Post-Early, and Delta Radiomics in Neoadjuvant Chemotherapy in Breast Cancer. Front. Oncol. 12:748008. doi: 10.3389/fonc.2022.748008
Received: 27 July 2021; Accepted: 10 January 2022;
Published: 07 February 2022.
Edited by:
Chintan Parmar, Dana–Farber Cancer Institute, United StatesCopyright © 2022 Yang, Liu, Dai, Yao, Zhang, Wang, Li and Duan. This is an open-access article distributed under the terms of the Creative Commons Attribution License (CC BY). The use, distribution or reproduction in other forums is permitted, provided the original author(s) and the copyright owner(s) are credited and that the original publication in this journal is cited, in accordance with accepted academic practice. No use, distribution or reproduction is permitted which does not comply with these terms.
*Correspondence: Qinghong Duan, duanqinghong@gmc.edu.cn
†These authors have contributed equally to this work and share first authorship