Evolution of Global Cooperation in Multi-Level Threshold Public Goods Games With Income Redistribution
 Jinming Du1,2*
  Baokui Wang3
- 1Liaoning Engineering Laboratory of Operations Analytics and Optimization for Smart Industry, Northeastern University, Shenyang, China
- 2Institute of Industrial and Systems Engineering, Northeastern University, Shenyang, China
- 3Joint Exercises and Training Center, Joint Operations College, National Defense University, Beijing, China
Income redistribution is a feasible means to adjust the income among individuals, which could reduce the gap between the rich and the poor and realize the social equity. By means of taxation and public services, the income could be transferred from some individuals to others directly or indirectly. We study how income redistribution affects the evolution of global cooperation through proposing a multi-level threshold public goods game model and introducing two kinds of income redistribution mechanisms. We find that both of the income redistribution mechanisms promote global cooperation. Furthermore, the global income redistribution is more in favor of the emergence of global cooperative behaviors than the local income redistribution mechanism. On the other hand, the fixation time of global cooperation is sharply shortened after introducing income redistribution mechanisms. In threshold public goods games, only when the amount of collected public goods reaches a certain threshold, the income of individuals can be guaranteed. Hence, the influences of thresholds of different levels on strategies are investigated in the paper.
1. Introduction
Collective actions, such as a group of neighborhood residents donating money to construct a public project, require voluntary contributions to collect public goods [1]. Voluntary contributing activity is widespread and substantial [2–5]. It is beneficial for the group, however, costly for individuals. Performing an altruistic act can weigh heavily on individual wellbeing and prosperity. Selfish individuals always have an advantage over cooperators. Such social dilemma can be represented as the public goods game (PGG) [6–8]. In human societies, people are often required to sacrifice personal benefits for the common goods and work together to achieve what they are unable to achieve alone [9, 10]. Especially when it comes to the situation that people are faced with the option of voluntary contribution to achieve a collective goal, where public goods cannot be provided in part, but only in whole after a certain cost (threshold) is covered. Threshold public goods game (TPGG) models nicely capture the main features of the above described social phenomena [11–18]. In the typical TPGG, the size of a proposed project and the associated total cost (threshold) are predetermined. The public goods are provided if the total contributions meet or exceed the threshold; otherwise, no goods are provided and all individuals suffer with nothing irrespective of whether they contributed or not. Since cooperation forms the bedrock of our efforts for a sustainable and better future, understanding cooperative behaviors in complex interactive systems has been one of the grand scientific challenges of the global society [19–24]. The problem is in many ways unnatural. Now that free riders can enjoy the same benefits for free, what kind of mechanism can motivate individuals to care for and contribute to the public goods, if only the fittest survive?
Most governments devote considerable resources to the provision of public goods available for all citizens to consume, such as national defense, environmental protection, health insurance and highways. Such universal provision schemes can redistribute income from the rich to the poor [25], and further realizing the fairness of the society [26–28]. Redistribution of income may provide a nonexcludable benefit to those who give, and many such schemes are universal in the sense that everyone is eligible and the provision is free [29]. One of the classic forms of income redistribution is the tax system, in which people are taxed at fixed rates. People who make more money pay higher taxes, thereby forfeiting more of their income to the government. Tax funds are used to benefit the society as a whole by providing a variety of public and social services by the government, and the direct transfer of income may occur in the case of welfare payments and other forms of cash assistance made to low-income members of society [30]. Previous works on physical models of collective dilemmas, however, seldom theoretically analyze how income redistribution influences the evolution of cooperation in the complex social-economic system.
Motivated by this, we propose a multi-level threshold public goods game model, where global and local public goods are clearly distinguished. Although pure public goods are defined as being non-rival in consumption and non-excludable [31], however, there exist impure public goods in reality. Owing to geographic space, some classes of goods are globally public, and others are only locally public. Global public goods are available to the entire population while local public goods may be available only to the residents of a very small neighborhood [32, 33]. Thus, players in the model can choose among selfishness, contributing to global public goods, or local public goods. In particular, the global public goods and local public goods both involve the threshold. If the collected public goods are not enough, dangers would happen. For example, coastal inhabitants may be inundated owing to failure of fundraising for a dam [34], disease may spread caused by inadequate voluntary vaccination [35–39] and regional defense system may collapse due to insufficient finance [40].
We then respectively consider two kinds of income redistribution mechanisms in the multi-level TPGG. In the model with local income redistribution, players have to pay part of their idealized income to the focal group according to a given income expenditure proportion after each round. Distinguished from the contribution action during the PGG process, such compulsory payment is named as the second-order payment. Subsequently, the accumulated income are redistributed to all the members of this group regardless of their strategies and the quantity of their second-order payments. On the other hand, for the global income redistribution, players pay part of their idealized income to the whole population. Similarly, the accumulated income is then redistributed to all the players in the whole population. In reality, the local income redistribution seems like a special transaction tax in economic system, which is collected according to the definite quantity of the volume of trade. And then, the revenue is redistributed to the group members uniformly, which amounts to the fiscal subsidy for a particular industry. While for the global income redistribution, the processes of second-order payment and income redistribution can be classified as the process of collecting and redistributing the gross income of personal income tax for the whole country. Based on this model, we theoretically investigate the evolution of cooperations of different levels and free-riders under collective risks, and focus on the influence of diverse income redistribution mechanisms on the global cooperation.
2. Model
In this paper, we study a finite population of N players. The whole population is divided into M groups, then there are m = N/M players in each of the group [41, 42]. Player x can choose a strategy Sx ∈ {G, L, S}, where G, L and S represent global cooperation, local cooperation and selfishness, respectively. Each player has one unit of money at the beginning of the game. They should decide whether put their money into Global account, Local account or Personal account. If the money is put into the Personal account, it is saved without multiplication. The player will finally own the single unit of money. The money put into the Local account are added and multiplied by a local gain-factor r1 (1 < r1 < m). Then it will be equally distributed to the players in the focal group. The money put into the Global account are summed and multiplied by a global gain-factor r2 (1 < r2 < N). Then it is distributed to all the players in the whole population irrespective of whether they are global cooperators or not.
After game interaction, players are asked to take part in the process of income redistribution. We respectively consider two cases: one is local redistribution, the other one is global redistribution. For local redistribution, each player has to pay part of their income to its group according to the given income expenditure proportion p1. The parameter p1 denotes the proportion of the second-order income obtained in the PGG of the focal group. Subsequently, the accumulated income expenditure of players in this group is redistributed to the m group members irrespective of their strategies and the amount of their second-order payments. Thus, the actual income of player x in this group after local redistribution of income can be calculated as
where πx denotes the income of a player after one PGG, is the sum of the accumulated second-order payments of the group members. Denote , and as the final payoff of each G, L and S player, respectively, when there are i G players, l L players in the local group and the other N − i − l players all hold S strategy in the whole population [43]:
where πx = ir2/N+lr1/m+1 for S player and πx = ir2/N+lr1/m for G and L players.
On the other hand, for global redistribution, players are mandatory to pay the part of their income to the whole population according to a fixed proportion p2, which is the second-order payment in global redistribution. We emphasize that p2 denotes the income expenditure proportion of all the second-order income player obtained in the PGG of the whole population. Subsequently, the accumulated income is redistributed to all the players irrespective of their strategies or the quantity of their second-order payments. Thus, the payoff of each player after the global income redistribution can be calculated as
where πx is the income of a player after PGG, is the sum of the accumulated second-order payments of all the players.
We consider the two-level TPGG, thus the payoffs of players are threatened by two-level risks. Here, we denote s1 as the local threshold and s2 as the global threshold. Then we introduce the threshold functions:
where i is the number of global cooperators and l is the number of local cooperators in the focal group. If the amount of collected global public goods is less than s2, a world-wide danger is on the way with a probability q2. Once such danger happens, the payoffs of all the individuals are zero. If the amount of public goods in the Global account is more than s2, the collective target achieves and disasters are not going to happen. In this case, all the players will get their payoffs in the public goods game. However, if the amount of local public goods in a group is less than s1, a potential risk could happen with a probability q1. Once suffered such risk, the payoffs of players in the focal group would be lost.
We use imitation process to describe the evolution of strategies. Players are likely to learn the strategies of their successful counterparts'. Firstly, we randomly select a player A from the N population. Then, another player B should be chosen. With a probability φ, B will be selected from the N population. Otherwise, with probability 1 − φ, B is chosen only from A's local group. In other words, the larger φ is, the more likely players interact with each other globally. In our daily life, the interaction within a group is much more frequent than that between groups. A would learn B's strategy with a probability [44–48], where πx is the payoff of individual x. ω denotes the imitation intensity [49–52], measuring the dependence of decision making on the payoff comparison. Here, we define two different imitation intensities. We denote ω1 as the imitation intensity within a group and ω2 as the imitation intensity between groups. During the evolutionary process of strategies, each player has the chance of switching its strategy to a different one with a probability μ. In this paper, we assume the exploration rate μ → 0. The parameters in the model are listed in Table 1.
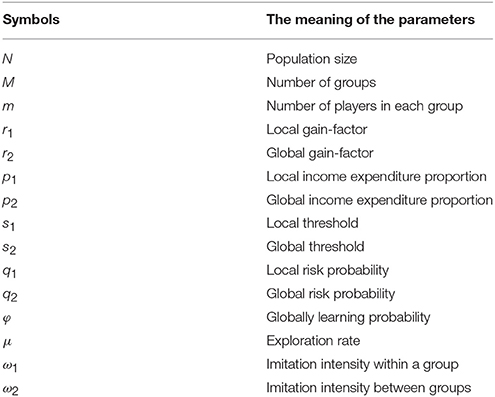
Table 1. Parameters in the model.
3. Methods
We are interested in how global cooperation evolves. To this end, we study the stationary distribution and the fixation time. It is common that the interaction within a group is much more frequent than that between groups [53, 54], thus the fixation process of a single mutant in the population goes through two steps: the fixation of this mutant in its local group and the fixation of such group in the whole population. We theoretically analyze the two kinds of income redistributions respectively.
3.1. Local Income Redistribution
We consider a single local group composed of m − i S players and i G players. All the other groups in the whole population are full of S players. Based on Equations (2, 3), the payoffs of each G player and each S player in the focal group are:
The number of G players changes from i to i ± 1 in one time step with a probability:
where ω1 is the imitation intensity within a group. The fixation probability of a single G mutant invading a group of S players is denoted by , which is given by Traulsen et al. [45] and Wu et al. [54]:
We define the fixation probability of a local group full of G players invading the whole population full of S players as . The payoff of each G player is denoted by and that of S player is when there are i local groups full of G players and the other M − i groups full of S players.
A new group full of G players arises when two players with different strategies from different local groups are chosen, and the S player alters its strategy through imitation, then it takes over its local group. Thus, the probability to increase the number of local groups full of G players by one is given by:
where ω2 is the imitation intensity between groups. represents the fixation probability of a single G mutant invading a group of S players when there already exist k groups full of G. Similarly, the probability to decrease the number of G groups by one is:
Hence, the fixation probability of a G group in the whole population is obtained as follows:
We aim to analyze the multi-level TPGG. Thus, the payoffs above are conditional. Once global danger happens, all the individuals will lose their wealth. On the other hand, if local danger strikes, the players in the focal group lose their wealth. By utilizing the threshold functions, Equations (6, 7), the revised payoffs are as follows:
Inserting Equations (17, 18) into Equation (11) and Equations (19, 20) into Equation (16), we can get the following equations when there are k groups full of G players:
The fixation probability of a single G mutant invading the whole global population full of S players is defined as ρSG. Hence, we have:
Accordingly, we can get the fixation probability ρSG, and also ρGS, ρSL, ρLS, ρLG, ρGL, which are given as follows:
During the evolutionary process, players have the chance of exploring strategies with a probability μ. Since we assume the exploration rate μ → 0, it assures that a single mutant vanishes or fixates in the population before the next one appears [55, 56]. Thus, the evolutionary process can be approximated by a Markov chain where the state space is composed of homogeneous states full of each type of players (G, L or S). The corresponding transition probability matrix T is:
Here, , where i, k ∈ {G, L, S}. Stationary distribution describes the percentage of time spent by the population in each homogeneous state in the long run, which is determined by the normalized left eigenvector corresponding to the eigenvalue 1 of the transition matrix. The stationary distribution for Equation (30) can be calculated as follows:
where XS, XL, and XG represent the probability to find the population in the homogeneous state consisting entirely of selfish ones, local cooperators, and global cooperators, respectively. The normalization factor Δ assures XS + XL + XG = 1.
On the other hand, the average time to reach a certain state for the first time can be derived analytically in the limit of rare explorations. For example, we denote fixation time τGS as the average time starting in pure state of G to reach S. This fixation time satisfies:
where . It represents the transition probability from the homogeneous state i to the homogeneous state j. ρij expresses the fixation probability. δij denotes the Kronecker delta. means the rate at which mutants of type j are born (as only two types of mutants can be produced with equal probability), since on average it takes the time of for per mutation. Then, we can get the average time of reaching the homogeneous state S from the initial pure states G and L:
Solving Equations (35)-(36), we have:
Similarly, expressions for other fixation time can be shown as follows:
Based on the solved fixation probabilities, Equations (24–29), we can deduce the stationary distribution and the fixation time with a complete form.
3.2. Global Income Redistribution
Similarly with the former analysis for local income redistribution, we consider a single local group in which there are i G players and m − i S players, and assume that all the other groups are full of S players. Compared with Equations (17–20) for local income redistribution, the payoffs of each G and S player for global income redistribution are:
Based on the payoffs, we can get the fixation probability , , , , , and for global income redistribution, which are given as follows:
Based on these fixation probabilities, it is easy to deduce the corresponding stationary distribution and the fixation time with a complete form for the case of global income redistribution.
4. Results and Discussion
Sustainable development calls for more and more global cooperation. Former collective risk dilemma models, however, seldom distinguish global cooperators from local ones. In this paper, we explicitly consider different cooperators arising from the group structured population to address how global cooperative behavior is affected by collective risk and income redistribution mechanisms. Income redistribution is a means of adjusting the income among individuals, which could make full use of social capital. We explore how income redistribution of different levels influence the evolution of global contribution in multi-level threshold public goods games.
We first study the local income redistribution mechanism. The stationary distribution of three strategies are compared in Figure 1A. With the increment of the local income expenditure proportion p1, XG (the stationary distribution of G) and XL show an ascending trend while XS descends. It is found that the global cooperation is promoted by local income redistribution compared with typical TPGG, which is shown as p1 = 0. In PGG model, the Nash equilibrium predicts zero provision. Thus, the selfishness is the dominate strategy, while global cooperation is inferior. When public goods can only be provided if global contributions reach a minimum threshold, this creates an advantage in that Pareto efficient outcomes can be Nash equilibria. In TPGG, however, we still see significant under-provision of the global public goods. After introducing the local income redistribution, players share part of their payoffs. The mechanism changes the comparison between different strategies in the local group, which reduces the inferiority of global cooperators. Especially under the high risk circumstance, the global cooperation becomes a Nash equilibrium (if the collective target is so large which requires almost all the players to contribute). For different gain-factors, it is shown in Figure 1B that the global cooperative behavior is promoted with the rise of p1. It is well-known that, in the context of PGG, small values of gain-factor favor defectors and large values benefit cooperators. In our work, larger r1/r2 indicates much worse condition for global contributors. Even though in such situations, compared with the frequencies of global cooperation at p1 = 0, global cooperators still have a much better chance for survival when p1 > 0. That is because the wealth gap between global cooperators and others is narrowed with increasing p1, which makes the cooperative behaviors have more chance to prevail in the multi-level TPGG rather than without such mechanism. Local income redistribution balances the income difference among individuals in the same group. Suffered as a consequence, the final payoff of each player is strongly dependent on the quality of its group. Obviously, more local cooperators make larger contributions in the group with a fixed number of participants. Thereinto, a player in the group with more local cooperators has a competitive advantage over the other players. Thus, local income redistribution, which acts as a driving force for promoting cooperation in the local group, especially local cooperation, gives prominence to the role of groups on the evolution of cooperation.
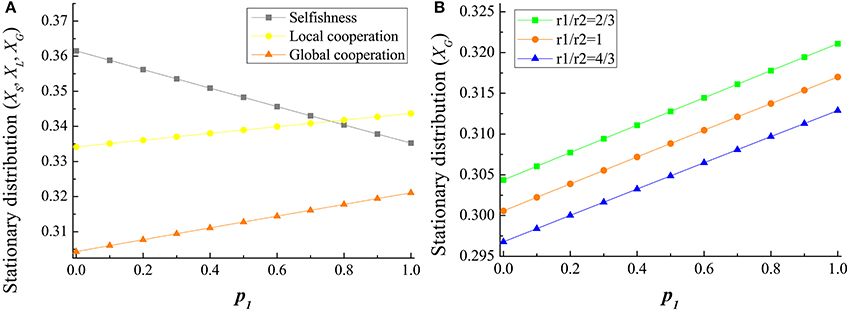
Figure 1. The influence of the local income expenditure proportion on the stationary distribution of strategies. In (A), the tendency of stationary distribution of selfishness, local contribution and global cooperation (XS, XL, and XG) with respect to the increase of local income expenditure proportion p1 are shown. XG and XL are promoted with the increasing p1, while XS decreases. It means that the effect of local income redistribution on promoting global cooperation becomes remarkably obvious with the increase of the proportion of redistribution in groups. Parameters are m = 5, M = 20, N = 100, q1 = q2 = 0.8, r1 = 2, r2 = 3, s1 = 2, s2 = 160, and ω1 = ω2 = 0.005. In (B), the tendency of the stationary distribution of global cooperation with the increase of p1 under different gain-factors are shown. We respectively study three r1/r2 ratios.
We then probe how global income redistribution mechanism influences the evolution of different strategies in the multi-level TPGG model. As is illustrated in Figure 2, the stationary distribution of G (XG) shows an ascending trend while XS and XL descend with the increment of p2. Different from results in local income redistribution mechanism, only global cooperation is obviously improved. Under the mechanism of global income redistribution, the accumulated second-order payments are redistributed to the whole population irrespective of their strategies and contributions. Thus, on the one hand, the payoff differences among strategies are reduced. On the other hand, the evolutionary advantage of compact cooperative clusters cannot spread to the whole population. Thus, the global income redistribution actually inhibit the heterogeneity of groups. When p2 → 1, almost all the players share all of their fortunes. Under such circumstance, the whole population is in a state of random drift. Each strategy holds a stationary distribution of 1/3.
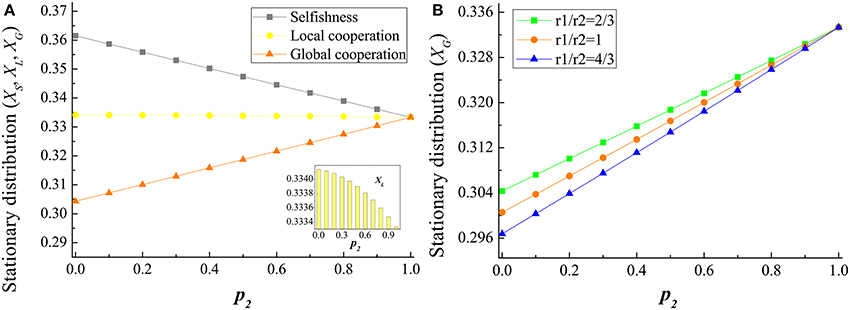
Figure 2. The influence of the global income expenditure proportion on the stationary distribution of strategies. In (A), the tendency of stationary distribution of S, L, and G (XS, XL, and XG) with respect to the increase of global income expenditure proportion p2 are shown. XG is promoted with the increasing p2, while XS and XL decrease. It means that the effect of global income redistribution on promoting global cooperation becomes remarkably obvious with the increase of the proportion of redistribution in the whole population. Parameters are m = 5, M = 20, N = 100, q1 = q2 = 0.8, r1 = 2, r2 = 3, s1 = 2, s2 = 160, and ω1 = ω2 = 0.005. In (B), the tendency of the stationary distribution of global cooperation with the increase of p2 under different gain-factors are shown. We respectively explore three r1/r2 ratios.
In the following, we study how long the population fixates at each state in both income redistribution mechanisms. We focus on the fixation time of each strategy, especially that of G strategy. With the increase of income expenditure proportion, both p1 and p2, the changes of average time that a mutant of each strategy invades population full of the other two respectively are shown in Figure 3. After introducing an income redistribution (both global and local) into the multi-level TPGG model, the time for G invading the other two strategies are obviously shortened. The larger the p1 (or p2), the more likely global cooperation to be learned and adopted by other strategies' holders. Then G strategy could occupy the entire population more quickly. By comparison, the G strategy under global income redistribution mechanism fixates faster than local income redistribution. The change of the fixation time of S is on the contrary. The time for S invading the other two strategies remarkably prolong. It is known that the fixation time of L is shortened in TPGG compared with PGG. For the local income redistribution, the fixation time of L declines. The difficulty for other strategies to invade L increases. For the global income redistribution, however, although the time for L invading S is shortened, the time for L invading G becomes longer with the rise of p2. Compared with the promotion of global cooperation and the inhibition of selfishness owing to the global income redistribution, to a certain extent, it only has little impact on local cooperation. For a limit case, when p2 = 1, the fixation difficulty of all the strategies are the same.
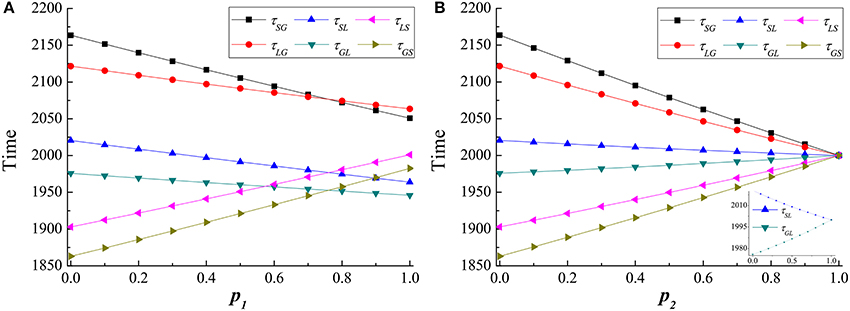
Figure 3. The fixation time changes with the income expenditure proportions. (A) reflects the local income redistribution; (B) reflects the global income redistribution. In each panel, average fixation time of each strategy invading the others are respectively shown. When a mutant G invades S population, denoting τSG as the average time starting in pure state of S to reach G. When a mutant G invades L population, denoting τLG as the average time starting in pure state of L to reach G. Both τSG and τLG decline with the increase of p2 and p1. Likely, a mutant L invades S population, a mutant L invades G population, a mutant S invades L population, and a mutant S invades G population are respectively shown as τSL, τGL, τLS and τGS. It shows that the larger p2 and p1 benefit the fixation of global cooperation. Parameters are: m = 5, M = 20, N = 100, r1 = 2, r2 = 3, s1 = 2, s2 = 160, q1 = q2 = 0.8, and ω1 = ω2 = 0.005.
We further investigate how decision-makings are affected by the change of the thresholds. As shown in Figure 4, the global cooperative behavior is promoted with the increasing global threshold. By adding a threshold in global PGG, the game is turned from a social dilemma into a sort of coordination game. In particular, with a large threshold, players are facing a sufficiently severe potential crisis. Such risk indicates that all the players probably lose their wealth. Higher global threshold means a bigger target which has to be reached to avoid the risk. Global cooperation is necessary for public safety, and becomes more and more important with the increasing risk. Once the disaster happens, all the individuals are equally wealthy. Thus, global cooperators can gain a foothold. Because income redistribution could narrow the payoff differences among strategies, global cooperation has more opportunity to be adopted in high risk cases. This paves the way for them to emerge in the population. In comparison, for the same income expenditure proportion, p1 = p2, the growth of global cooperation is more obvious in the global income redistribution mechanism than in the local one. It hints that when sharing more wealth with the whole population, the relationship among individuals becomes more close. Hence, individuals are more inclined to cooperate globally for collecting global public goods to resist the disaster. Moreover, we study the influence of local threshold on the results. As shown in Figure 5, the increase of s1 obviously promotes local cooperation, while inhibits selfishness. Meanwhile, it has only a little impact on global cooperation, which slightly drops with the rise of s1. The results are obtained under global income redistribution mechanisms, while similar results can be found under the local income redistribution too. Compared with the global threshold, local thresholds have much less effects on the global cooperation. Since we focus on the global cooperation, we mainly study the impacts of global threshold on the results in this paper.
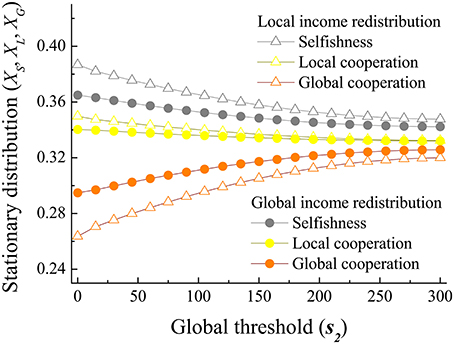
Figure 4. The stationary distribution changes with the global threshold s2. Global cooperation is promoted with the increase of the global threshold s2, while selfishness and local cooperation decrease. It hints that players are more apt to cooperate globally under high global risks. We investigate both of the two income redistribution mechanisms, and the stationary distributions of strategies are calculated respectively in each mechanism under the same parameter values. Parameters are: m = 5, M = 20, N = 100, r1 = 2, r2 = 3, s1 = 2, q1 = q2 = 0.8, p1 = 0.5, p2 = 0.5, and ω1 = ω2 = 0.005.
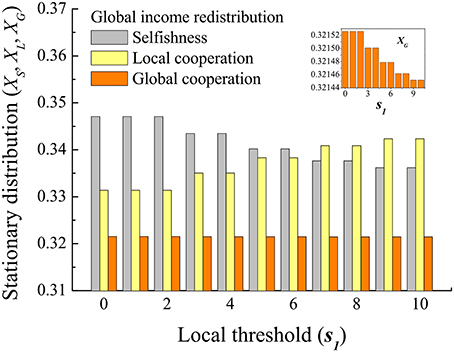
Figure 5. The stationary distribution changes with the local threshold s1. Local cooperation is promoted with the increase of s1, while selfishness decreases. It has little influence on global cooperation, which slightly drops with the increase of s1. Local risk makes the L strategy become a better behavior to be chosen. The results are obtained under global income redistribution mechanisms, while similar results can be found under the local income redistribution case. Parameters are: m = 5, M = 20, N = 100, r1 = 2, r2 = 3, s2 = 160, q1 = q2 = 0.8, p1 = 0.5, p2 = 0.5, and ω1 = ω2 = 0.005.
In the global income redistribution mechanism, we further investigate the mutual influence of global threshold s2 and p2 on the evolution of strategies. As shown in Figure 6, with the increase of s2 and p2, global cooperation shows an increasing trend, while selfishness declines correspondingly. It is worth noting that the trend for local cooperation with the change of p2 is related to the size of global threshold s2. For smaller s2, local cooperation decreases with the rise of p2; for larger s2, local cooperation increases with the rise of p2. While for intermediate s2, local cooperation rises under lower p2 and then reduces under higher p2. It is found that there exists a most adaptable value of p2 for local cooperators under global income redistribution. This phenomenon means that, on one hand, the mechanism of global income redistribution reduces income inequality within the whole population, which is generally regarded to be a positive improvement to society. But on the other hand, it may negatively affect the efficiency of social-economic system (local economic development). Thereby, the income expenditure proportion, which can be described as the social tolerance, should be limited under such case. Beyond these limits, the enthusiasm of individual investment and rapid development of social-economic system may be on the brink of collapse.
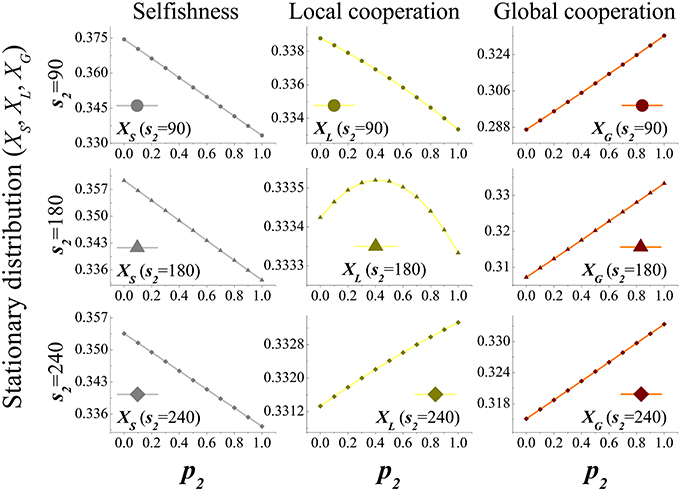
Figure 6. The stationary distribution changes with p2 under different global thresholds. Global cooperation is promoted with the increase of p2 as well as s2, while selfishness decreases. It hints that players are more apt to cooperate globally under high global risks. As to local cooperation, it depends on s2. For lower s2, local cooperation decreases with the rise of p2. For higher s2, local cooperation increases with the rise of p2. For moderate s2, local cooperation first rises and then drops with the increase of p2. Parameters are: m = 5, M = 20, N = 100, r1 = 2, r2 = 3, s1 = 2, q1 = q2 = 0.8, and ω1 = ω2 = 0.005.
5. Conclusion
In this paper, we have studied the evolution of strategies in the multi-level threshold public goods games, where global and local cooperation are clearly distinguished. By introducing two kinds of income redistribution mechanisms, we investigate how income expenditure proportions (p1 and p2) and risks (thresholds) influence the average abundance of strategies and fixation time. It is shown that with larger income redistribution proportions, players are more apt to cooperate globally, especially under high collective risks. When individuals are conscious of an even greater calamity, they are apt to form an alliance to prevent the risk through cooperation globally. The more disruptive the danger is, the more likely they succeed in collective target. Selfishness is effectively inhibited under both income redistribution mechanisms. It implies that an income redistribution mechanism may be effective for solving the social dilemma of free-riders and promoting social equity. We further compare the influences of the local and global income redistribution on the global cooperation and local cooperation. It is found that compared with local income redistribution, global income redistribution is more in favor of global cooperation. On the contrary, local income redistribution is more beneficial for local cooperation. Our model is relatively simple compared with the actual situations, but it characterizes some main features of the systems with income redistribution, and show results that the frequency of global cooperation may be promoted in some cases. This study may provide some useful implications for investors, fundraisers and also government officials. The theoretical analysis in this work is only a first step toward the models of learning process. Since learning and interaction between players should be on the same scale, we hope more accurate theoretical methods on this kind of models could be explored in the future.
Author Contributions
JD and BW designed and performed the research as well as wrote the paper.
Funding
This research was supported by the National Key Research and Development Program of China (2016YFB0901900), the National Natural Science Foundation of China (NSFC) (Grant No. 61703082), the Fundamental Research Funds for the Central Universities (Grant No. N160403001), the Fund for Innovative Research Groups of the National Natural Science Foundation of China (Grant No. 71621061), the Major Program of National Natural Science Foundation of China (Grant No. 71790614), the Major International Joint Research Project of the National Natural Science Foundation of China (Grant No. 71520107004), the 111 Project (B16009), and the Joint Funds of the National Natural Science Foundation of China (Grant No. U1435218).
Conflict of Interest Statement
The authors declare that the research was conducted in the absence of any commercial or financial relationships that could be construed as a potential conflict of interest.
References
1. Olson M. The Logic of Collective Action: Public Goods and the Theory of Groups. Cambridge, MA: Harvard University Press (1965).
2. Axelrod R, Hamilton WD. The evolution of cooperation. Science (1981) 211:1390–6. doi: 10.1126/science.7466396
5. Rand DG, Nowak MA. Human cooperation. Trends Cogn Sci. (2013) 17:413–25. doi: 10.1016/j.tics.2013.06.003
6. Hardin G. The tragedy of the commons. Science (1968) 162:1243–8. doi: 10.1126/science.162.3859.1243
7. Hardin G. Extensions of the “Tragedy of the commons.” Science (1998) 280:682–3. doi: 10.1126/science.280.5364.682
8. Kagel J, Roth A. The Handbook of Experimental Economics. Cambridge, MA: Princeton University Press (1995).
9. Perc M, Gómez-Gardees J, Szolnoki A, Floría LM, Moreno Y. Evolutionary dynamics of group interactions on structured populations: a review. J R Soc Interface. (2013) 10:20120997. doi: 10.1098/rsif.2012.0997
10. Perc M, Jordan JJ, Rand DG, Wang Z, Boccaletti S, Szolnoki A. Statistical physics of human cooperation. Phys Rep. (2017) 687:1–51. doi: 10.1016/j.physrep.2017.05.004
11. Taylor M, Ward H. Chickens, whales, and lumpy goods: Alternative models of public-goods provision. Polit Stud. (1982) 30:350–70. doi: 10.1111/j.1467-9248.1982.tb00545.x
12. Hampton J. Free-rider problems in the production of collective goods. Econ Philos. (1987) 3:245–73. doi: 10.1017/S0266267100002911
13. Bach LA, Helvik T, Christiansen FB. The evolution of n-player cooperation-Threshold games and ESS bifurcations. J Theor Biol. (2006) 238:426–34. doi: 10.1016/j.jtbi.2005.06.007
14. Pacheco JM, Santos FC, Souza MO, Skyrms B. Evolutionary dynamics of collective action in N-person stag hunt dilemmas. Proc R Soc Lond B. (2009) 276:315–21. doi: 10.1098/rspb.2008.1126
15. Campos PRA, de Oliveira VM. Small-world effects in the majority-vote model. Phys Rev E (2003) 67:026104. doi: 10.1103/PhysRevE.67.026104
16. Szolnoki A, Perc M. Impact of critical mass on the evolution of cooperation in spatial public goods games. Phys Rev E (2010) 81:057101. doi: 10.1103/PhysRevE.81.057101
17. Szolnoki A, Chen X. Benefits of tolerance in public goods games. Phys Rev E (2015) 92:042813. doi: 10.1103/PhysRevE.92.042813
18. Du J, Tang L. Evolution of global contribution in multi-level threshold public goods games with insurance compensation. J Stat Mech. (2018) 2018:013403. doi: 10.1088/1742-5468/aa9bb6
19. Nowak MA, Sasaki A, Taylor C, Fudenberg D. Emergence of cooperation and evolutionary stability in finite populations. Nature (2004) 428:646–50. doi: 10.1038/nature02414
20. Nowak MA. Five rules for the evolution of cooperation. Science (2006) 314:1560–3. doi: 10.1126/science.1133755
21. Kurokawa S, Ihara Y. Emergence of cooperation in public goods games. Proc R Soc Lond B (2009) 276:1379–84. doi: 10.1098/rspb.2008.1546
22. Hauser OP, Rand DG, Peysakhovich A, Nowak MA. Cooperating with the future. Nature (2014) 511:220–3. doi: 10.1038/nature13530
23. Wang Z, Wang L, Szolnoki A, Perc M. Evolutionary games on multilayer networks: a colloquium. Eur Phys J B (2015) 88:124. doi: 10.1140/epjb/e2015-60270-7
24. Perc M. Phase transitions in models of human cooperation. Phys Lett A (2016) 380:2803–8. doi: 10.1016/j.physleta.2016.06.017
25. Besley T, Coate S. Public provision of private goods and the redistribution of income. Am Econ Rev. (1991) 81:979–84.
26. Rand DG, Tarnita CE, Ohtsuki H, Nowak MA. Evolution of fairness in the one-shot anonymous Ultimatum Game. Proc Natl Acad Sci USA. (2013) 110:2581–6. doi: 10.1073/pnas.1214167110
27. Szolnoki A, Perc M. Competition of tolerant strategies in the spatial public goods game. New J Phys. (2016) 18:083021. doi: 10.1088/1367-2630/18/8/083021
28. Zhang Y, Chen X, Liu A, Sun C. The effect of the stake size on the evolution of fairness. Appl Math Comput. (2018) 321:641–53. doi: 10.1016/j.amc.2017.11.013
29. Blackorby C, Donaldson D. Cash versus kind, self-selection, and efficient transfers. Am Econ Rev. (1988) 78:691–700.
30. Pei Z, Wang B, Du J. Effects of income redistribution on the evolution of cooperation in spatial public goods games. New J Phys. (2017) 19:013037. doi: 10.1088/1367-2630/aa5666
31. Samuelson PA. The pure theory of public expenditure. Rev Econ Stat. (1954) 36:387–9. doi: 10.2307/1925895
32. Blackwell C, McKee M. Only for my own neighborhood? Preferences and voluntary provision of local and global public goods. J Econ Behav Organ. (2003) 52:115–31. doi: 10.1016/S0167-2681(02)00178-6
33. Zhang Y, Liu A, Sun C. Impact of migration on the multi-strategy selection in finite group-structured populations. Sci Rep. (2016) 6:35114. doi: 10.1038/srep35114
34. Muermann A, Kunreuther H. Self-protection and insurance with interdependencies. J Risk Uncertainty (2008) 36:103–23. doi: 10.1007/s11166-008-9033-1
35. Antal T, Krapivsky PL. Outbreak size distributions in epidemics with multiple stages. J Stat Mech. (2012) 2012:P07018. doi: 10.1088/1742-5468/2012/07/P07018
36. Wang Z, Andrews MA, Wu ZX, Wang L, Bauch CT. Coupled disease-behavior dynamics on complex networks: A review. Phys Life Rev. (2015) 15:1–29. doi: 10.1016/j.plrev.2015.07.006
37. Wang Z, Zhao DW, Wang L, Sun GQ, Jin Z. Immunity of multiplex networks via acquaintance vaccination. Europhys Lett. (2015) 112:48002. doi: 10.1209/0295-5075/112/48002
38. Wang Z, Bauch CT, Bhattacharyya S, d'Onofrio A, Manfredi P, Perc M, et al. Statistical physics of vaccination. Phys Rep. (2016) 664:1–113. doi: 10.1016/j.physrep.2016.10.006
39. Zhao D, Wang L, Li S, Wang Z, Wang L, Gao B. Immunization of epidemics in multiplex networks. PLoS ONE (2014) 9:e112018. doi: 10.1371/journal.pone.0112018
40. Lohse T, Robledo JR, Schmidt U. Self-insurance and self-protection as public goods. J Risk Insur. (2012) 79:57–76. doi: 10.1111/j.1539-6975.2010.01391.x
41. Taylor PD, Irwin AJ, Day T. Inclusive fitness in finite deme-structured and stepping-stone populations. Selection (2000) 1:153–64. doi: 10.1556/Select.1.2000.1-3.15
42. Du J, Wu B, Wang L. Evolution of global cooperation driven by risks. Phys Rev E (2012) 85:056117. doi: 10.1103/PhysRevE.85.056117
43. Traulsen A. Mechanisms for similarity based cooperation. Eur Phys J B (2008) 63:363–71. doi: 10.1140/epjb/e2008-00031-3
44. Szabó G, Tőke C. Evolutionary prisoner's dilemma game on a square lattice. Phys Rev E. (1998) 58:69–73. doi: 10.1103/PhysRevE.58.69
45. Traulsen A, Nowak MA, Pacheco JM. Stochastic dynamics of invasion and fixation. Phys Rev E (2006) 74:011909. doi: 10.1103/PhysRevE.74.011909
46. Wu B, Zhou D, Fu F, Luo Q, Wang L, Traulsen A. Evolution of cooperation on stochastic dynamical networks. PLoS ONE (2010) 5:e11187. doi: 10.1371/journal.pone.0011187
47. Traulsen A, Semmann D, Sommerfeld RD, Krambeck HJ, Milinski M. Human strategy updating in evolutionary games. Proc Natl Acad Sci USA. (2010) 107:2962–6. doi: 10.1073/pnas.0912515107
48. Du J. Insurance optimizes complex interactive and cooperative behaviors in public goods games. PLoS ONE (2018) 13:e0197574. doi: 10.1371/journal.pone.0197574
49. Wu B, Altrock PM, Wang L, Traulsen A. Universality of weak selection. Phys Rev E (2010) 82:046106. doi: 10.1103/PhysRevE.82.046106
50. Wu B, García J, Hauert C, Traulsen A. Extrapolating weak selection in evolutionary games. PLoS Comput Biol. (2013) 9:e1003381. doi: 10.1371/journal.pcbi.1003381
51. Du J, Wu B, Altrock PM, Wang L. Aspiration dynamics of multi-player games in finite populations. J R Soc Interface (2014) 11:20140077. doi: 10.1098/rsif.2014.0077
52. Du J, Wu B, Wang L. Aspiration dynamics in structured population acts as if in a well-mixed one. Sci Rep. (2015) 5:8014. doi: 10.1038/srep08014
53. Hauert C, Imhof LA. Evolutionary games in deme structured, finite populations. J Theor Biol. (2012) 299:106–12. doi: 10.1016/j.jtbi.2011.06.010
54. Wang J, Wu B, Ho DWC, Wang L. Evolution of cooperation in multilevel public goods games with community structures. Europhys Lett. (2011) 93:58001. doi: 10.1209/0295-5075/93/58001
55. Fudenberg D, Imhof LA. Imitation processes with small mutations. J Econ Theory (2006) 131:251–62. doi: 10.1016/j.jet.2005.04.006
Keywords: evolutionary game theory, public goods game, stochastic processes, human cooperation, income redistribution
Citation: Du J and Wang B (2018) Evolution of Global Cooperation in Multi-Level Threshold Public Goods Games With Income Redistribution. Front. Phys. 6:67. doi: 10.3389/fphy.2018.00067
Received: 01 March 2018; Accepted: 13 June 2018;
Published: 03 July 2018.
Edited by:
Tatsuya Sasaki, F-Power Inc., JapanReviewed by:
Attila Szolnoki, Research Centre for Natural Sciences (MTA), HungaryLin Wang, University of Hong Kong, Hong Kong
Copyright © 2018 Du and Wang. This is an open-access article distributed under the terms of the Creative Commons Attribution License (CC BY). The use, distribution or reproduction in other forums is permitted, provided the original author(s) and the copyright owner(s) are credited and that the original publication in this journal is cited, in accordance with accepted academic practice. No use, distribution or reproduction is permitted which does not comply with these terms.
*Correspondence: Jinming Du, dujinming@ise.neu.edu.cn