 Delin Qi
 Yan Chao
 Rongrong Wu
 Mingzhe Xia
 Qichang Chen
 Zhiqin Zheng
- 1State Key Laboratory of Plateau Ecology and Agriculture, Qinghai University, Xining, China
- 2Animal Science Department, Agriculture and Animal Husbandry College, Qinghai University, Xining, China
The schizothoracine fish endemic to the Qinghai-Tibetan Plateau are comparatively well adapted to aquatic environments with low oxygen partial pressures. However, few studies have used transcriptomic profiling to investigate the adaptive responses of schizothoracine fish tissues to hypoxic stress. This study compared the transcriptomes of Gymnocypris eckloni subjected to 72 h of hypoxia (Dissolved oxygen, DO = 3.0 ± 0.1 mg/L) to those of G. eckloni under normoxia (DO = 8.4 ± 0.1 mg/L). To identify the potential genes and pathways activated in response to hypoxic stress, we collected muscle, liver, brain, heart, and blood samples from normoxic and hypoxic fish for RNA-Seq analysis. We annotated 337,481 gene fragments. Of these, 462 were differentially expressed in the hypoxic fish as compared to the normoxic fish. Under hypoxia, the transcriptomic profiles of the tissues differed, with muscle the most strongly affected by hypoxia. Our data indicated that G. eckloni underwent adaptive changes in gene expression in response to hypoxia. Several strategies used by G. eckloni to cope with hypoxia were similar to those used by other fish, including a switch from aerobic oxidation to anaerobic glycolysis and the suppression of major energy-requiring processes. However, G. eckloni used an additional distinct strategy to survive hypoxic environments: a strengthening of the antioxidant system and minimization of ischemic injury. Here, we identified several pathways and related genes involved in the hypoxic response of the schizothoracine fish. This study provides insights into the mechanisms used by schizothoracine fish to adapt to hypoxic environments.
Introduction
Hypoxia is an important environmental factor that affects the metabolism and survival of most aerobic animals. Aqueous environments are characterized by low oxygen capacitance and poor oxygen diffusibility; these challenges may be increased by human activities (Diaz, 2001). Fish living in environments with low and/or variable oxygen supplies have evolved complex suites of biochemical, physiological, behavioral, and molecular adaptations that enable survival under such conditions (Gracey et al., 2001; Nikinmaa, 2002; Nikinmaa and Rees, 2005; Roesner et al., 2006, 2008; Wang et al., 2017; Liu et al., 2018). Changes in transcription profiles in response to hypoxia have been investigated in several fish taxa, including the hypoxia-tolerant goby fish, Gillichthys mirabilis (Gracey et al., 2001); zebrafish (Danio rerio) (Ton et al., 2003; van der Meer et al., 2005); viviparous (Xiphophorus) and oviparous (Oryzias) fish (Boswell et al., 2009); Carassius auratus (Zhong et al., 2009; Liao et al., 2013); large yellow croaker (Larimichthys crocea) (Wang et al., 2017); and Nile tilapia (Oreochromis niloticus) (Liu et al., 2018; Xia et al., 2018). Fish exhibit a variety of adaptive responses to hypoxia, including the discontinuation of processes requiring substantial energy output, such as protein synthesis (Gracey et al., 2001; Ton et al., 2003), locomotion (Gracey et al., 2001), and cell growth/proliferation (Gracey et al., 2001). Hypoxia also stimulates the antioxidant system (Zhong et al., 2009; Wang et al., 2017), and induces the expression of immune-related genes (Wang et al., 2017) and genes associated with lysosomal lipid trafficking and degradation (van der Meer et al., 2005). However, the molecular mechanisms underlying the response of schizothoracine fish to hypoxic stress remain unclear.
Schizothoracine fish (Teleostei: Cyprinidae) are the largest and most diverse taxon within the Qinghai-Tibetan Plateau (QTP) ichthyofauna (Wu and Wu, 1992; Chen and Cao, 2000). The schizothoracine fish are divided into three groups based on morphological characters: primitive, specialized, and highly specialized (Cao et al., 1981). Previous studies have demonstrated that schizothoracine fish restricted to high-altitude or high-latitude environments are well adapted to cold, hypoxic conditions (Qi et al., 2012; Li et al., 2013; Guan et al., 2014; Xia et al., 2016). Therefore, the schizothoracine fish are an excellent model for studies of the fundamental mechanisms of adaptions to hypoxia and low temperatures. Gymnocypris eckloni, is a representative species of the highly specialized schizothoracine fish, and this species is widely distributed in isolated lakes and the upper reaches of the Yellow River (Wu and Wu, 1992; Chen and Cao, 2000). This species is very well adapted to the dissolved oxygen fluctuations of its aqueous environment (Qi et al., 2012; Xia et al., 2016). During artificial breeding experiments, G. eckloni displayed a substantial tolerance for hypoxia, surviving acute hypoxia (∼0.3 mg O2/L) for 12 h and chronic hypoxia (∼3.0 mg O2/L) for much longer (Xia et al., 2016). Therefore, we hypothesized that G. eckloni would exhibit transcriptional responses to hypoxia that would differ from less hypoxia-tolerant fish species.
Understanding changes in the gene expression in fish exposed to hypoxia might reveal new mechanisms of hypoxic acclimation, and might shed light on the evolution of this adaptive response in vertebrates. In the present study, we sequenced the transcriptomes of five tissues (the liver, muscle, brain, heart, and blood) from G. eckloni under normoxic or hypoxic conditions. We used this transcriptomic data to examine the gene expression profiles of G. eckloni exposed to hypoxia. Our results increase our understanding of the adaptive mechanisms used by the schizothoracine fish in response to hypoxia.
Materials and Methods
Experimental Fish and Hypoxia Treatment
Healthy G. eckloni (average body weight: ∼170 g) were obtained from the Native Fish Artificial Proliferation and Release Station, Xunhua, Qinghai Province, China. Fish were transported to our laboratory in aerated buckets. We used six adult individuals for our experiments. All of the fish were allowed to acclimate for 3 days before experimentation, in 10–13°C freshwater almost identical in composition to the river water at the capture site. All of the research involving animals followed the guidelines of, and was conducted under the approval of, the Animal Care and Use Committee, Qinghai University, China.
Three fish were randomly assigned to the control group (normoxia); the remaining three fish were assigned to the hypoxia group. The two groups were kept in separate, identical 20 L translucent plastic tanks. The freshwater in the tanks was bubbled with nitrogen and with the ambient air in our laboratory. The dissolved oxygen (DO) level was continuously monitored using an AZ8402 dissolved oxygen meter (AZ Instrument Corp., Taiwan) (Xia et al., 2016). In the normoxia (control) tank, DO was 8.4 ± 0.1 mg/L. In the hypoxia tank, DO was reduced from 8.4 ± 0.1 to 3.0 ± 0.1 mg/L over 1 h, and then maintained at 3.0 ± 0.1 mg/L for 72 h.
After the experiment, fish were stunned with a blow to the head and blood was quickly collected from a caudal puncture in an EDTA-treated tube, then transferred to a microfuge tube. The liver, brain, and heart were removed from each fish, and a sample was taken of the muscle tissue. Blood and tissue samples were stored in liquid nitrogen until RNA isolation.
RNA Extraction, Illumina Library Preparation, and Sequencing
An Ambion MagMAX-96 total RNA isolation kit (Life Sciences, United States) was used to isolate total RNA from each sample, following the manufacturer’s instructions. RNA degradation and contamination were monitored on 1% agarose gels. RNA purity was analyzed with a NanoPhotometer Spectrophotometer (Implen, United States). The RNA concentration was quantified with a Qubit RNA Assay Kit in a Qubit 2.0 Fluorometer (Life Technologies, United States). RNA integrity was analyzed using a RNA Nano 6000 Assay Kit and an Agilent Bioanalyzer 2100 (Agilent Technologies, United States). Thirty separate Illumina sequencing libraries were prepared using 3.0 μg RNA per sample.
Sequencing libraries were created with the NEBNext Ultra RNA Library Prep Kit for Illumina (NEB, United States), following the manufacturer’s instructions. Index codes were added to assign sequences for each sample. In brief, mRNA was purified from the total RNA with poly-T oligo-attached magnetic beads. Fragmentation was done with divalent cations under an elevated temperature in NEBNext First Strand Synthesis Reaction Buffer (NEB, United States). First strand cDNA was synthesized with M-MuLV Reverse Transcriptase (RNase H-) and random hexamer primers. Second strand cDNA synthesis was subsequently carried out with RNase H and DNA Polymerase I. Exonuclease/polymerase activity converted the remaining overhangs into blunt ends. After adenylation of the 3′ ends of the DNA fragments, NEBNext Adaptors with hairpin loop structures were ligated to prepare for hybridization. Library fragments were purified with the AMPure XP system (Beckman Coulter, United States) to preferentially select 150–200 bp cDNA fragments. The adaptor-ligated, size-selected cDNA was then incubated with 3.0 μl USER Enzyme (NEB, United States) for 15 min at 37°C followed by 5 min at 95°C before PCR. PCRs were performed using universal PCR primers, Phusion High-Fidelity DNA polymerase, and the Index (X) Primer. Finally, PCR products were purified (with the AMPure XP system). Library quality was assessed with an Agilent Bioanalyzer 2100.
Clustering of the index-coded samples was carried out on a cBot Cluster Generation System using a TruSeq PE Cluster Kit v3-cBot-HS (Illumina), following the manufacturer’s instructions. Library preparations were sequenced on an Illumina HiSeq 2500 platform after cluster generation, which generated 125 bp paired-end reads. All data sets have been submitted to the National Center for Biotechnology Information (NCBI) Sequence Read Archive (SRA) database (accession number SRP150490).
Quality Control and de novo Assembly
Raw data (raw reads) in FASTQ format were sorted by individual fish and processed using self-written Perl scripts. Our scripts generated cleaned data (cleaned reads) by removing reads containing adapter sequences, reads containing poly-N, and low quality reads. We also calculated Q20, Q30, GC-content, and sequence duplication level for the cleaned data. All of the downstream analyses were based on high-quality cleaned data.
De novo transcriptome assembly was performed using the short read assembly program Trinity, with min_kmer_cov set to 2 by default and all of the other parameters set default (Grabherr et al., 2011). Briefly, reads of a certain length with overlapping areas were joined initially in order to form longer fragments (contigs) without gaps. The paired-end reads were then mapped back onto the contigs, which were subsequently connected. These steps were repeated until the sequences could no longer be extended (Stewart et al., 2015). The final sequences were considered to be unigenes, which still were, strictly speaking, gene fragments.
Transcriptome Annotation
We annotated the gene fragments against the NCBI non-redundant (Nr) protein database, the Swiss-Prot database, the Kyoto Encyclopedia of Genes and Genomes (KEGG) database (Kanehisa et al., 2004), the Clusters of Orthologous Groups of proteins (COG) database, the Pfam database, and the nucleotide (Nt) database using BLASTX, with an E-value 1.0 × 10⁻⁵. All of the annotated gene fragments were translated into amino acid sequences using ESTScan (Iseli et al., 1999), and then screened against the Gene Ontology (GO) database using Blast2GO (Conesa et al., 2005). The clusters of orthologous groups (COG) database was used to identify the putative functions of each gene fragment product based on known orthologous gene products (Tatusov et al., 2003). KEGG pathways were identified using the KEGG Automatic Annotation Sever (KAAS1) with the bi-directional best-hit method and an E-value of 1.0 × 10⁻¹⁰.
Differential Expression Analysis and Functional Enrichment
To test for differentially expressed genes (DEGs), individual sequence reads from each sample were mapped back to the assembled transcriptome using the alignment program Bowtie (Langmead et al., 2009). Differential expression analysis was performed using the DESeq R package (Anders and Huber, 2010). This package includes statistical routines that determine differential expressions in digital gene expression data based on a model of a negative binomial distribution. Mean expression levels were generated using three tissue samples per treatmen. The resulting P-values were adjusted using the Benjamini-Hochberg approach for controlling the false discovery rate. Genes identified by DEGSeq with an adjusted P-value < 0.05 were considered DEGs. GO and KEGG pathway analyses were then performed on the DEGs.
Quantitative Real-Time PCR Validation (qRT-PCR)
RNA samples from three biological replicates were used for qRT-PCR validation of the transcriptome data. RNA used for transcriptomic sequencing was converted into cDNA using the RNAprep Pure Tissue Kit (TIANGEN Biotech Co., Ltd., China), and treated with RNase-free DNase I (Takara, Japan). Gene-specific primers were designed using Primer Premier 5.0 (Supplementary Table 1). qRT-PCR was performed in an iQ5 Multicolor Real-Time PCR Detection System (Bio-Rad Laboratories, Inc., United States) using SuperReal PreMix Plus (SYBR Green) (TIANGEN Biotech Co., Ltd.). All of the samples were analyzed in triplicate (as technical replicates) and fold changes in gene expression were calculated using the 2-ΔΔCt method (Livak and Schmittgen, 2001). GAPDH served as the internal control.
Results
Raw Sequencing Data and de novo Transcriptome Assembly
Here, 30 separate Illumina sequencing libraries produced close to 1,837.7 million paired-end reads (2 × 125 bp). After trimming and quality filtering, 4.5% of all of the reads were discarded, leaving over 1,753.7 million reads (219.12 Gb) for downstream analysis. The number of qualified Illumina reads per sample ranged from 50.9 million (6.36 Gb) to 69.8 million (8.72 Gb), with a mean of 58.5 ± 4.7 million. The number of Illumina reads in each treatment group was well balanced, with 871.97 million reads (109.04 Gb) in the control group and 881.70 million reads (110.08 Gb) in the hypoxia group (Table 1).
TABLE 1. Sequencing statistics for individual paired end reads from the RNA-Seq library from G. eckloni.
As the genome of G. eckloni is not available, we assembled the transcripts de novo. De novo assembly analysis across all Illumina reads identified 551,430 transcript fragments, ranging in length from 201 to 34,873 bp, with an average length of 865 bp. The N50 and N90 values of the obtained transcripts were 1486 and 329 bp, respectively. Further assembly analysis identified 337,481 gene fragments across all transcripts, with an average length of 656 bp. The N50 and N90 values of the obtained gene fragments were 972 and 266 bp, respectively.
Functional Annotation
To annotate the G. eckloni transcriptome, all 337,481 gene fragments were annotated against six public databases (Nr protein, Nt, Swiss-Prot, KEGG, GO, and COG) using BLASTX and BLASTN, both with an E-value cut-off of <10-5. We annotated 46,418 gene fragments against the Nr protein database (13.75%; Table 2). The E-value distribution of the top hits in the Nr database ranged from 0 to 1.0E-15 (Supplementary Figure 1A). The similarity distribution of the top BLAST hits for each sequence ranged from 18 to 100% (Supplementary Figure 1B). The most common species with similar sequences in the Nr database, were Danio rerio (62.1%), followed by Astyanax mexicanus (4.7%), Oncorhynchus mykiss (3.9%), Oreochromis niloticus (1.8%), and Oryzias latipes (1.5%) (Supplementary Figure 1C). The previously published genome annotations for these species are comprehensive and largely accepted, suggesting that the G. eckloni gene fragments were correctly assembled and annotated.
TABLE 2. Annotation of assembled G. eckloni gene fragments.
Gene Ontology (GO) assignments were used to classify the functions of the predicted G. eckloni gene fragments. Based on sequence homology, 50,492 sequences were categorized into 51 functional groups in three functional divisions (Figure 1). Many of the gene fragments were classified as cellular processes, metabolic processes, cell, cell part, single-organism processes, binding, and catalytic activity.
FIGURE 1. Gene ontology classification of putative gene functions in Gymnocypris eckloni. The transcripts are categorized into three main categories: biological process, cellular component, and molecular function.
To test the effectiveness of the annotation process and evaluate the integrity of the transcriptome libraries, gene fragments were classified based on KOG categories. Of the 46,418 Nr hits, 21,106 sequences were assigned to 26 KOG categories (Figure 2). Of these, “General function prediction only” was assigned the most sequences (4,956), followed by “Signal transduction mechanisms” (4,412 sequences), “Posttranslational modification, protein turnover, chaperones” (1,917 sequences), “Transcription” (1,303 sequences), “Intracellular trafficking, secretion, and vesicular transport” (1,211 sequences), and “Translation, ribosomal structure and biogenesis” (929 sequences). The KOG categories “Cell motility” and “Unnamed protein” had the fewest sequences (64 and 3 sequences, respectively).
FIGURE 2. KOG classification of putative Gymnocypris eckloni proteins. The y-axis indicates the number of gene fragments in each functional cluster.
The 46,418 annotated sequences were mapped to the canonical reference pathways in the KEGG database. Of these, 26,660 gene fragments were successfully assigned to 278 KEGG pathways in five categories (Figure 3). Most gene fragments fell into the KEGG pathway category organismal systems (8,025 sequences), followed by metabolic pathways (5,216 sequences), environmental information processing (4,868 sequences), cellular processes (3,548 sequences), and genetic information processing (2,555 sequences).
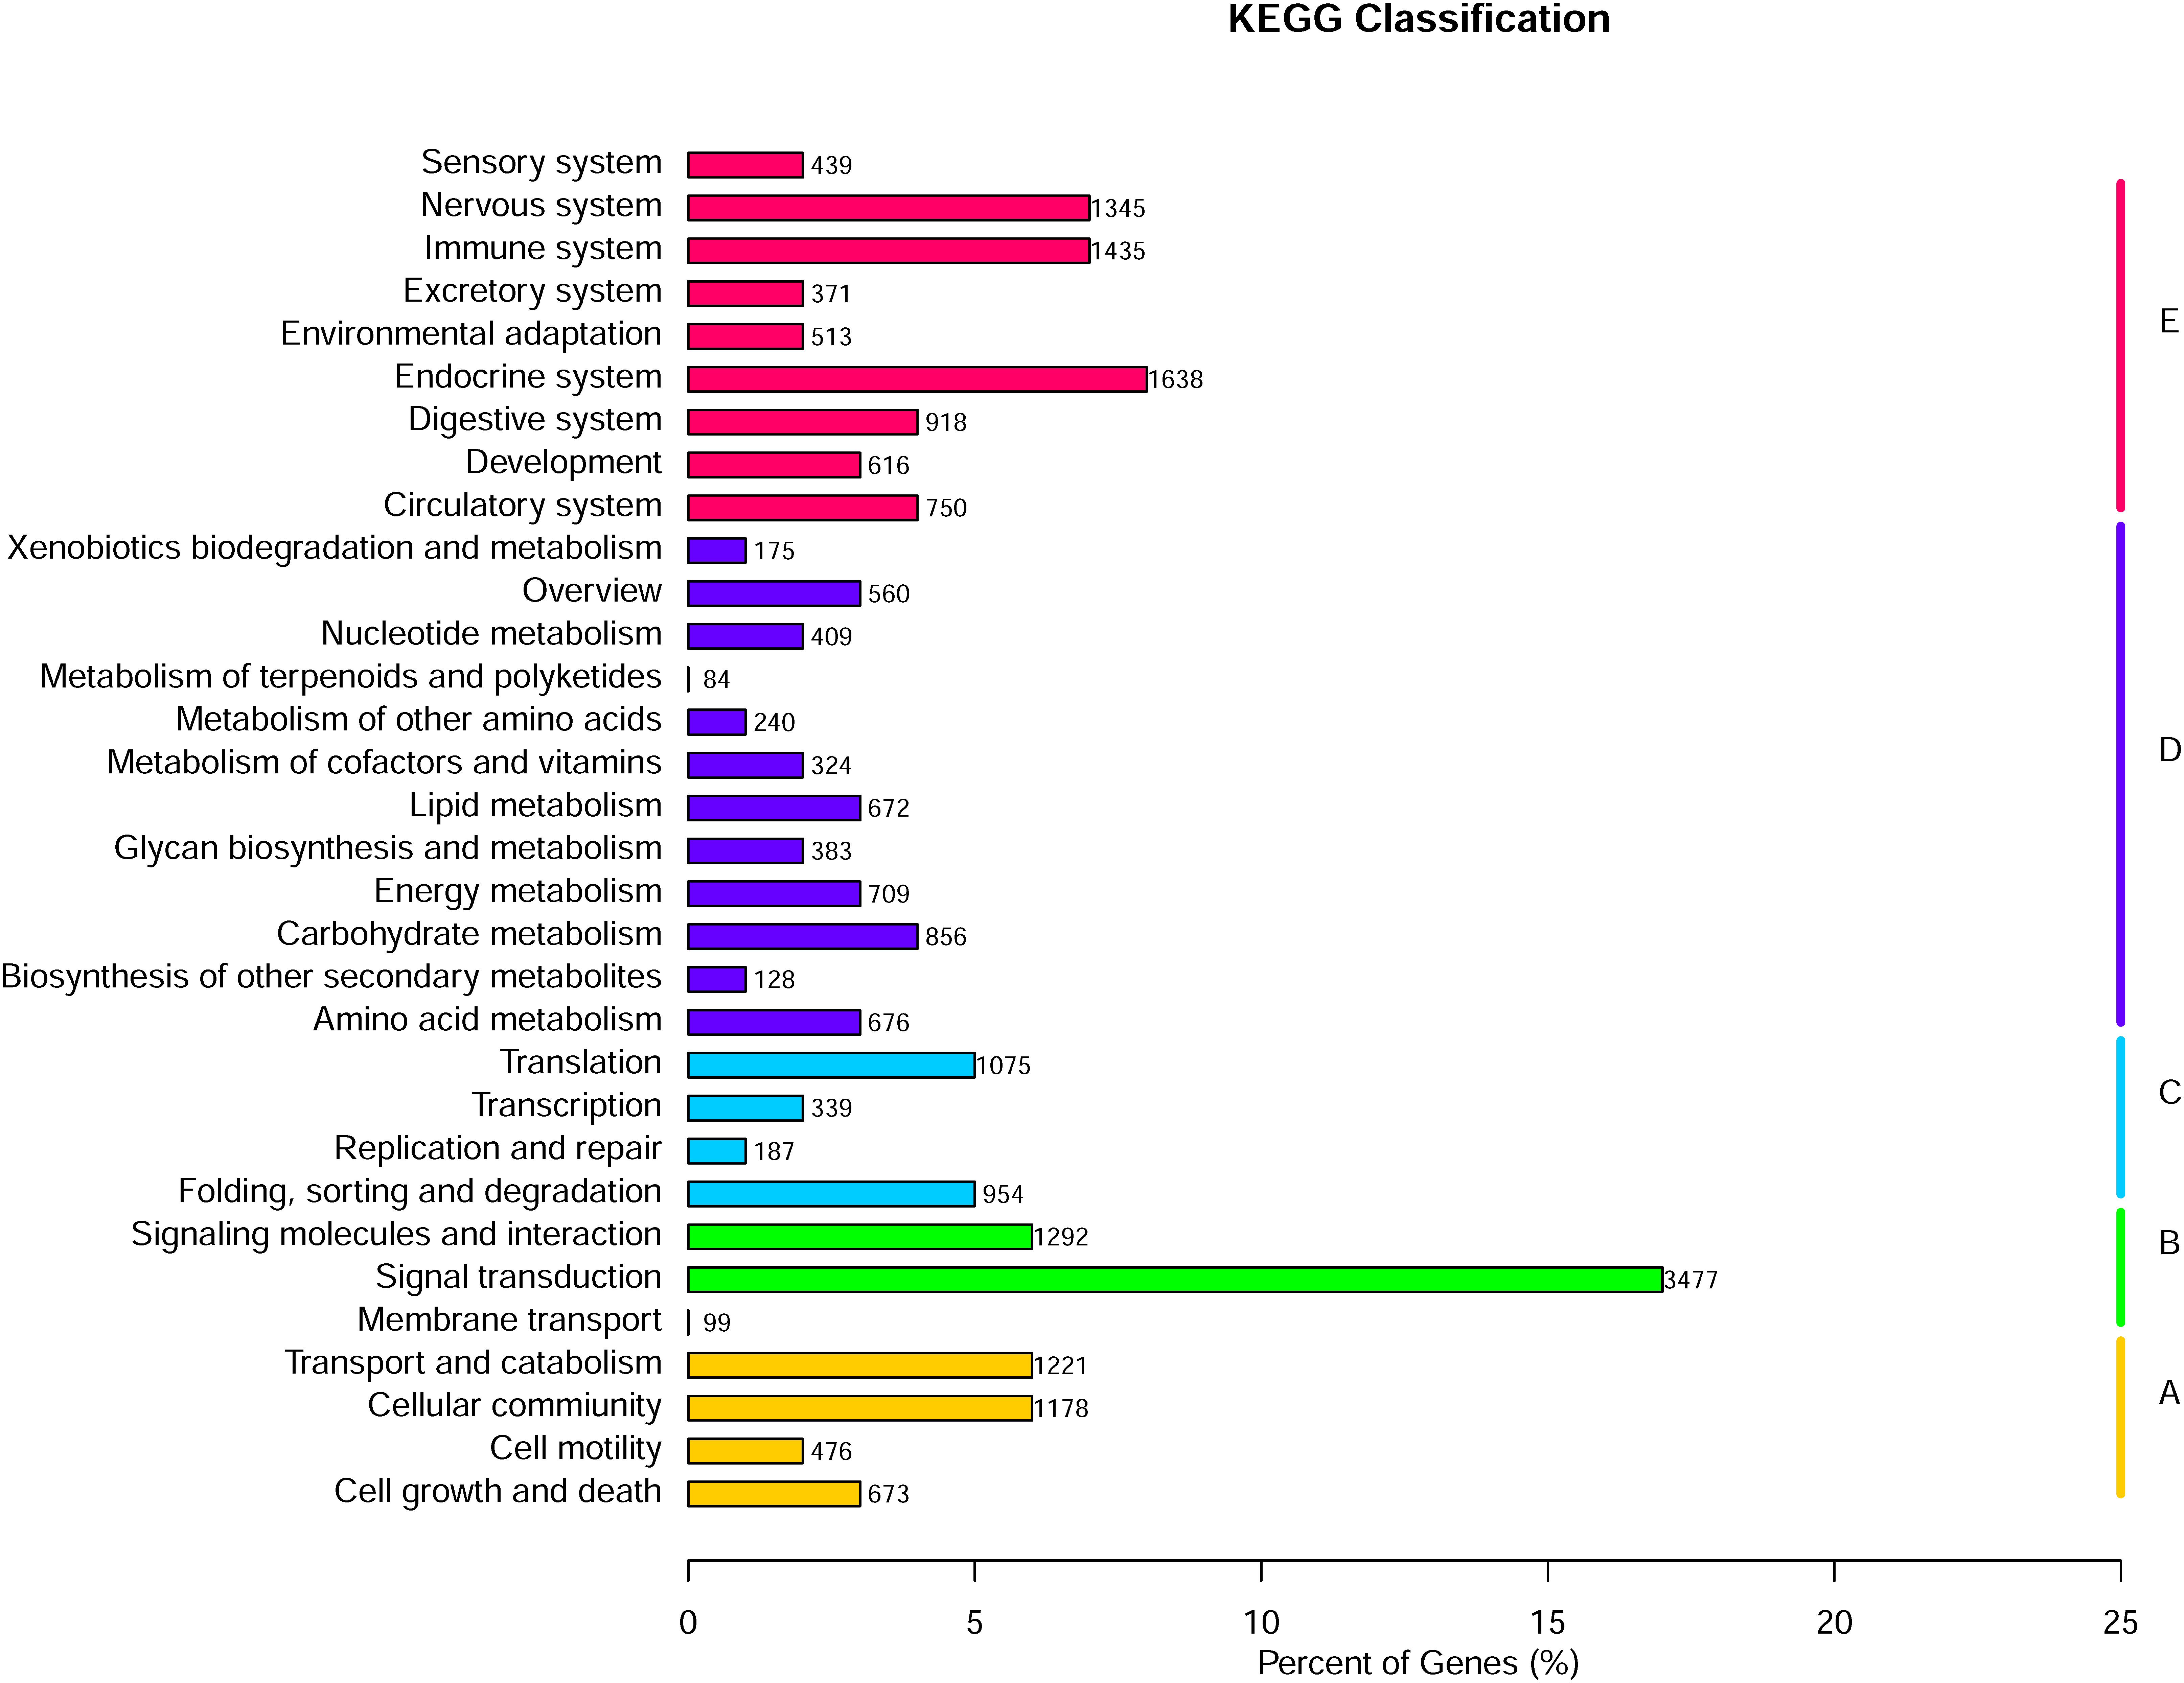
FIGURE 3. KEGG classification of Gymnocypris eckloni genes. A, cellular processes; B, environmental information processing; C, genetic information processing; D, metabolism; E, organismal systems.
DEGs
Differential expression analysis of gene fragments indicated that 462 sequences were differentially expressed in fish exposed to hypoxia. Of these, 28 were differentially expressed in liver (20 upregulated and 8 downregulated), 30 were differentially expressed in the heart (18 upregulated and 12 downregulated), 74 were differentially expressed in the blood (59 upregulated and 15 downregulated), 60 were differentially expressed in the brain (48 upregulated and 12 downregulated), and 282 were differentially expressed in the muscle (247 upregulated and 35 downregulated). To validate our Illumina sequencing results, 21 DEGs from liver, heart, brain, and muscle were selected for qRT-PCR analysis. The expression patterns of 20 of these genes were consistent with those indicated by our RNA-Seq analysis. The remaining DEG, polyprotein (Gene ID: c227508_g1), was upregulated according to the RNA-Seq analysis, but downregulated according to the qRT-PCR analysis (Supplementary Figure 2).
GO functional enrichment analysis using GO slim terms showed that only the DEGs in the muscle, liver, and brain were significantly enriched in GO terms (Supplementary Table 2). In the muscle, 231 of the 247 upregulated DEGs were significantly enriched in 22 biological process categories, one cellular component category, and six molecular function categories (Figure 4A), while 20 of the 35 downregulated DEGs were significantly enriched in five biological process categories, two cellular component categories, and three molecular function categories (Figure 4B). In the liver, the 20 upregulated DEGs were significantly enriched in five molecular function categories (Figure 4C). In the brain, 18 of the 48 upregulated DEGs were significantly enriched in four molecular function categories (Figure 4D).
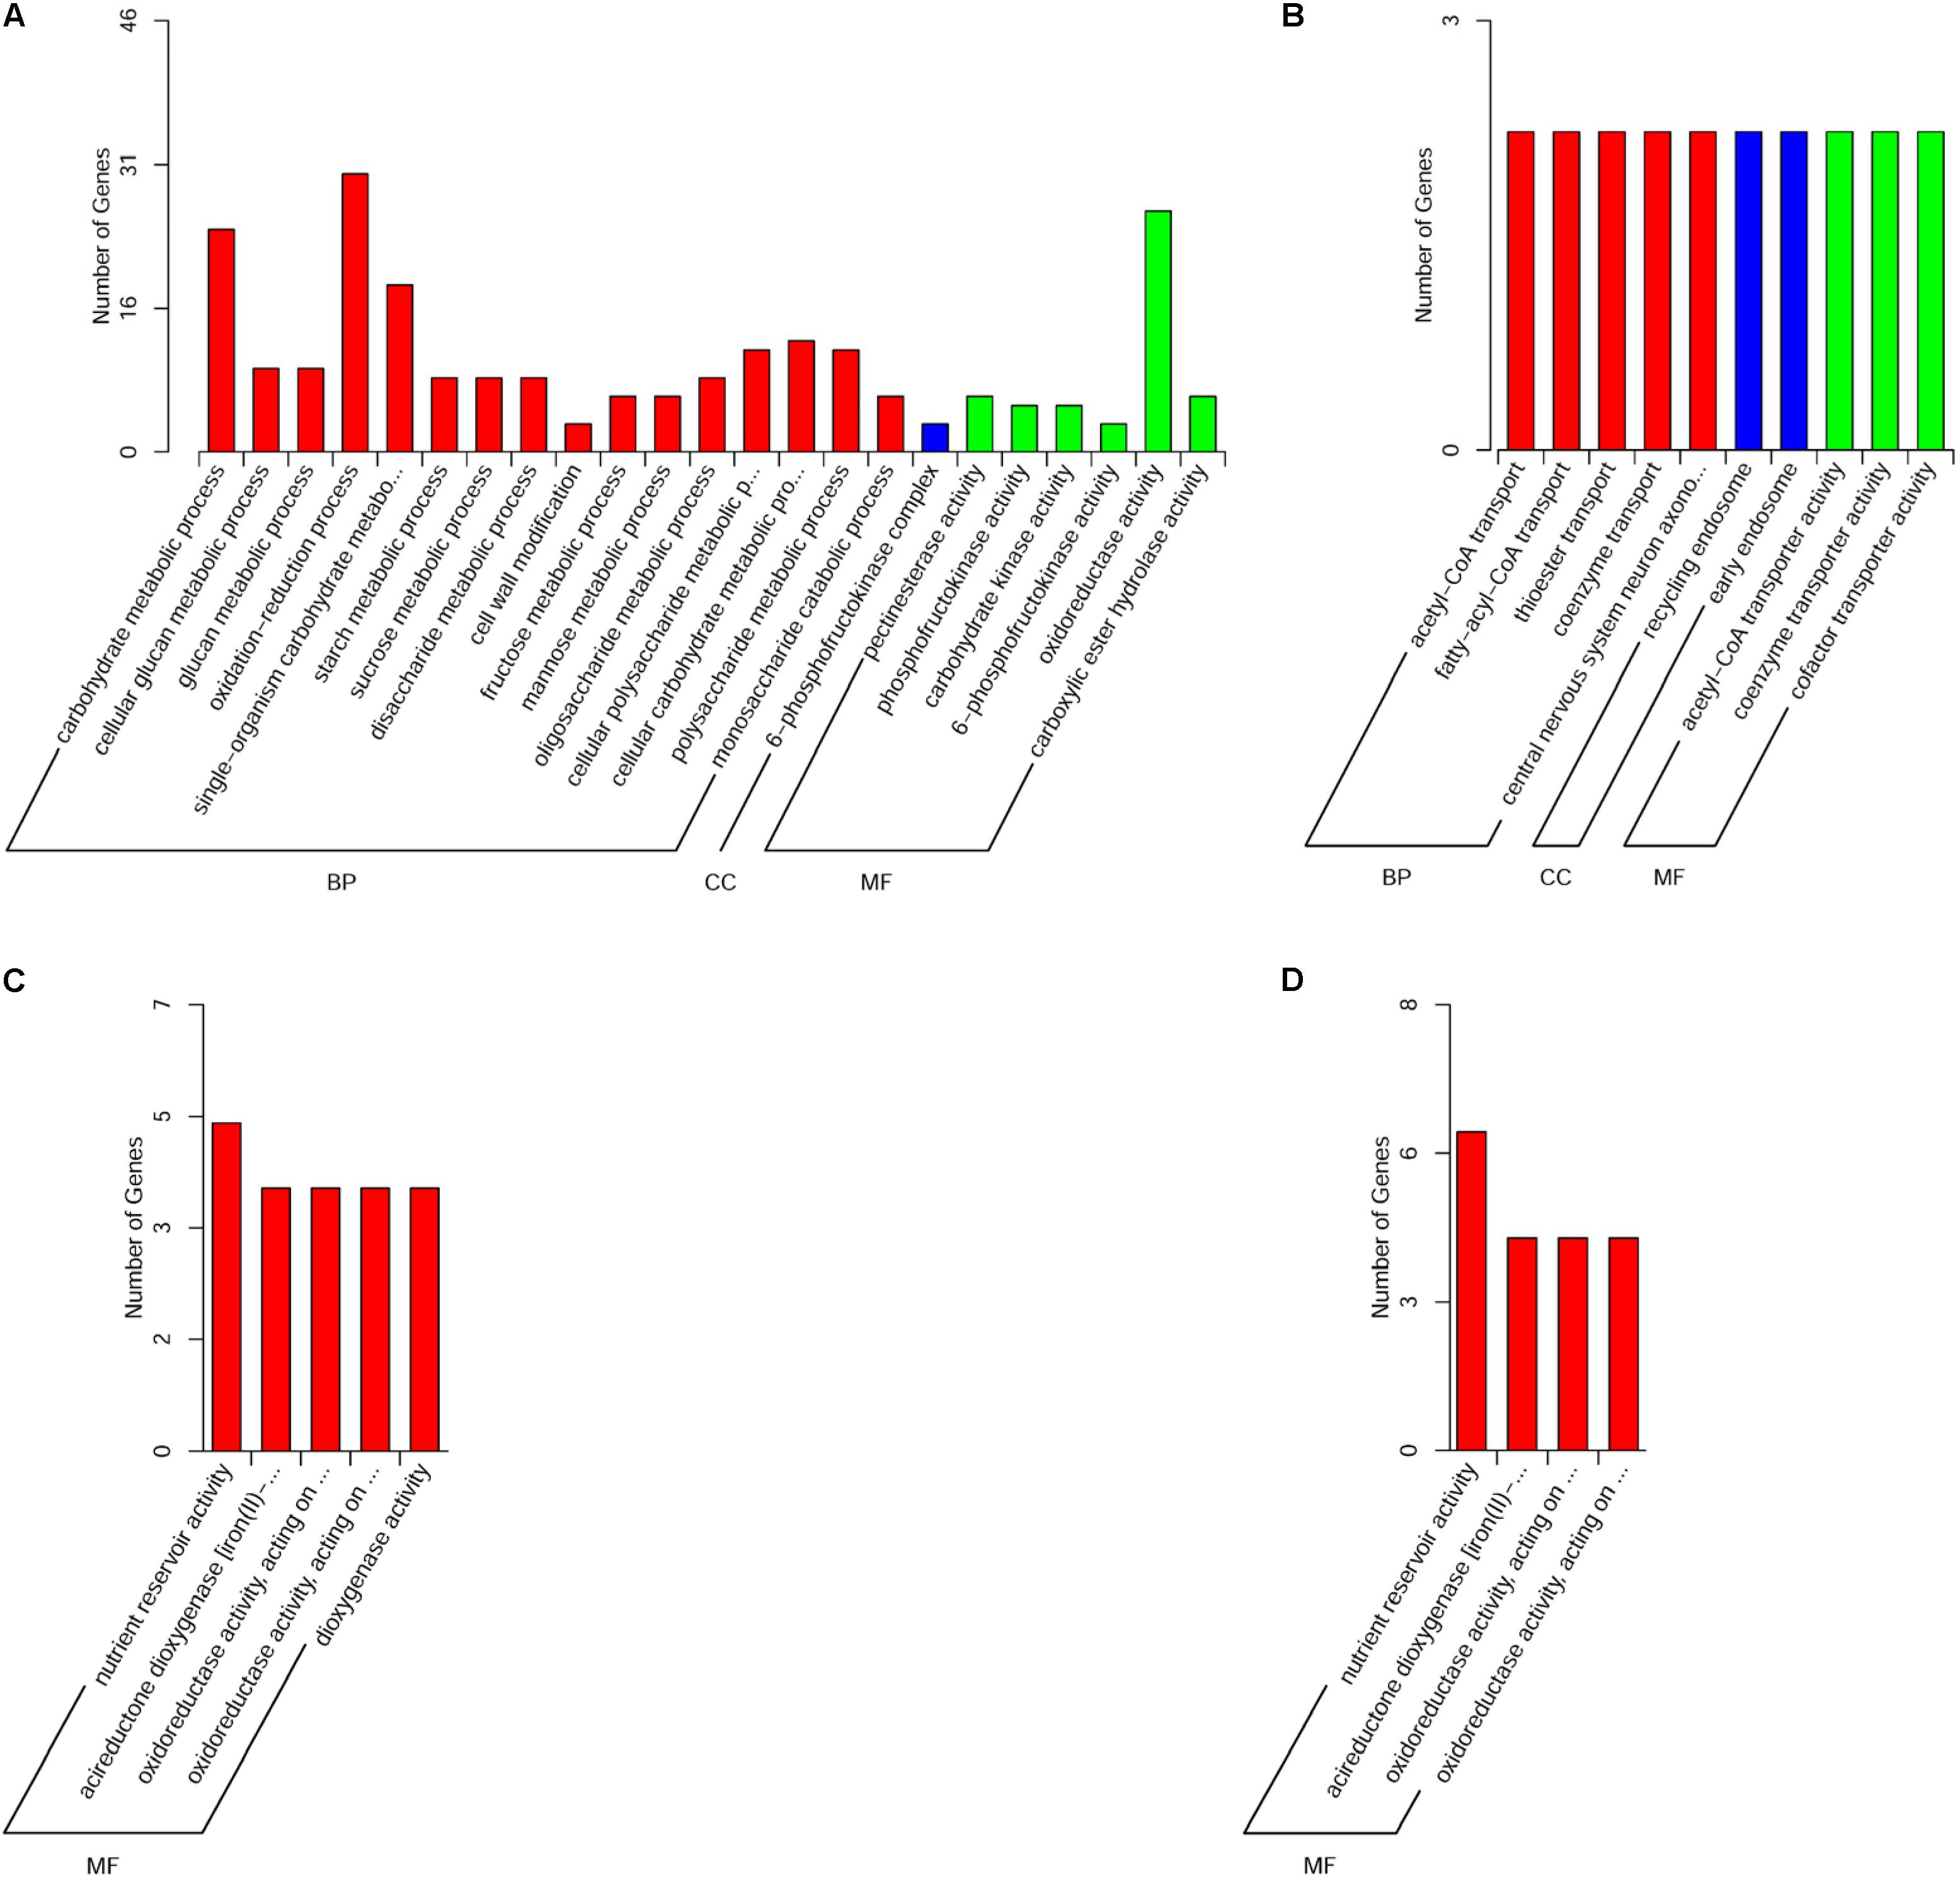
FIGURE 4. Gene ontology functional classification of (A) significantly upregulated genes in the muscle, (B) significantly downregulated genes in the muscle, (C) significantly upregulated genes in the liver, and (D) significantly upregulated genes in the brain. BP, biological process; CC, cellular component; MF, molecular function.
Only DEGs in the muscle, liver, brain, and blood were enriched in KEGG pathways. For example, 60 significantly enriched KEGG pathways, including 119 DEGs, were identified in the muscle (see Figure 5A for the top 20 most enriched pathways; other enriched pathways are shown in Supplementary Table 3). The ascorbate and aldarate metabolism pathway, which is associated with antioxidant defense, was the most enriched pathway, followed by pentose and glucuronate interconversion, the pentose phosphate pathway, and galactose metabolism. In the blood, 11 DEGs were enriched in nine KEGG pathways (Figure 5B). In the brain, four DEGs were enriched in four KEGG pathways (Figure 5C). In the liver, seven DEGs were enriched in seven KEGG pathways (Figure 5D).
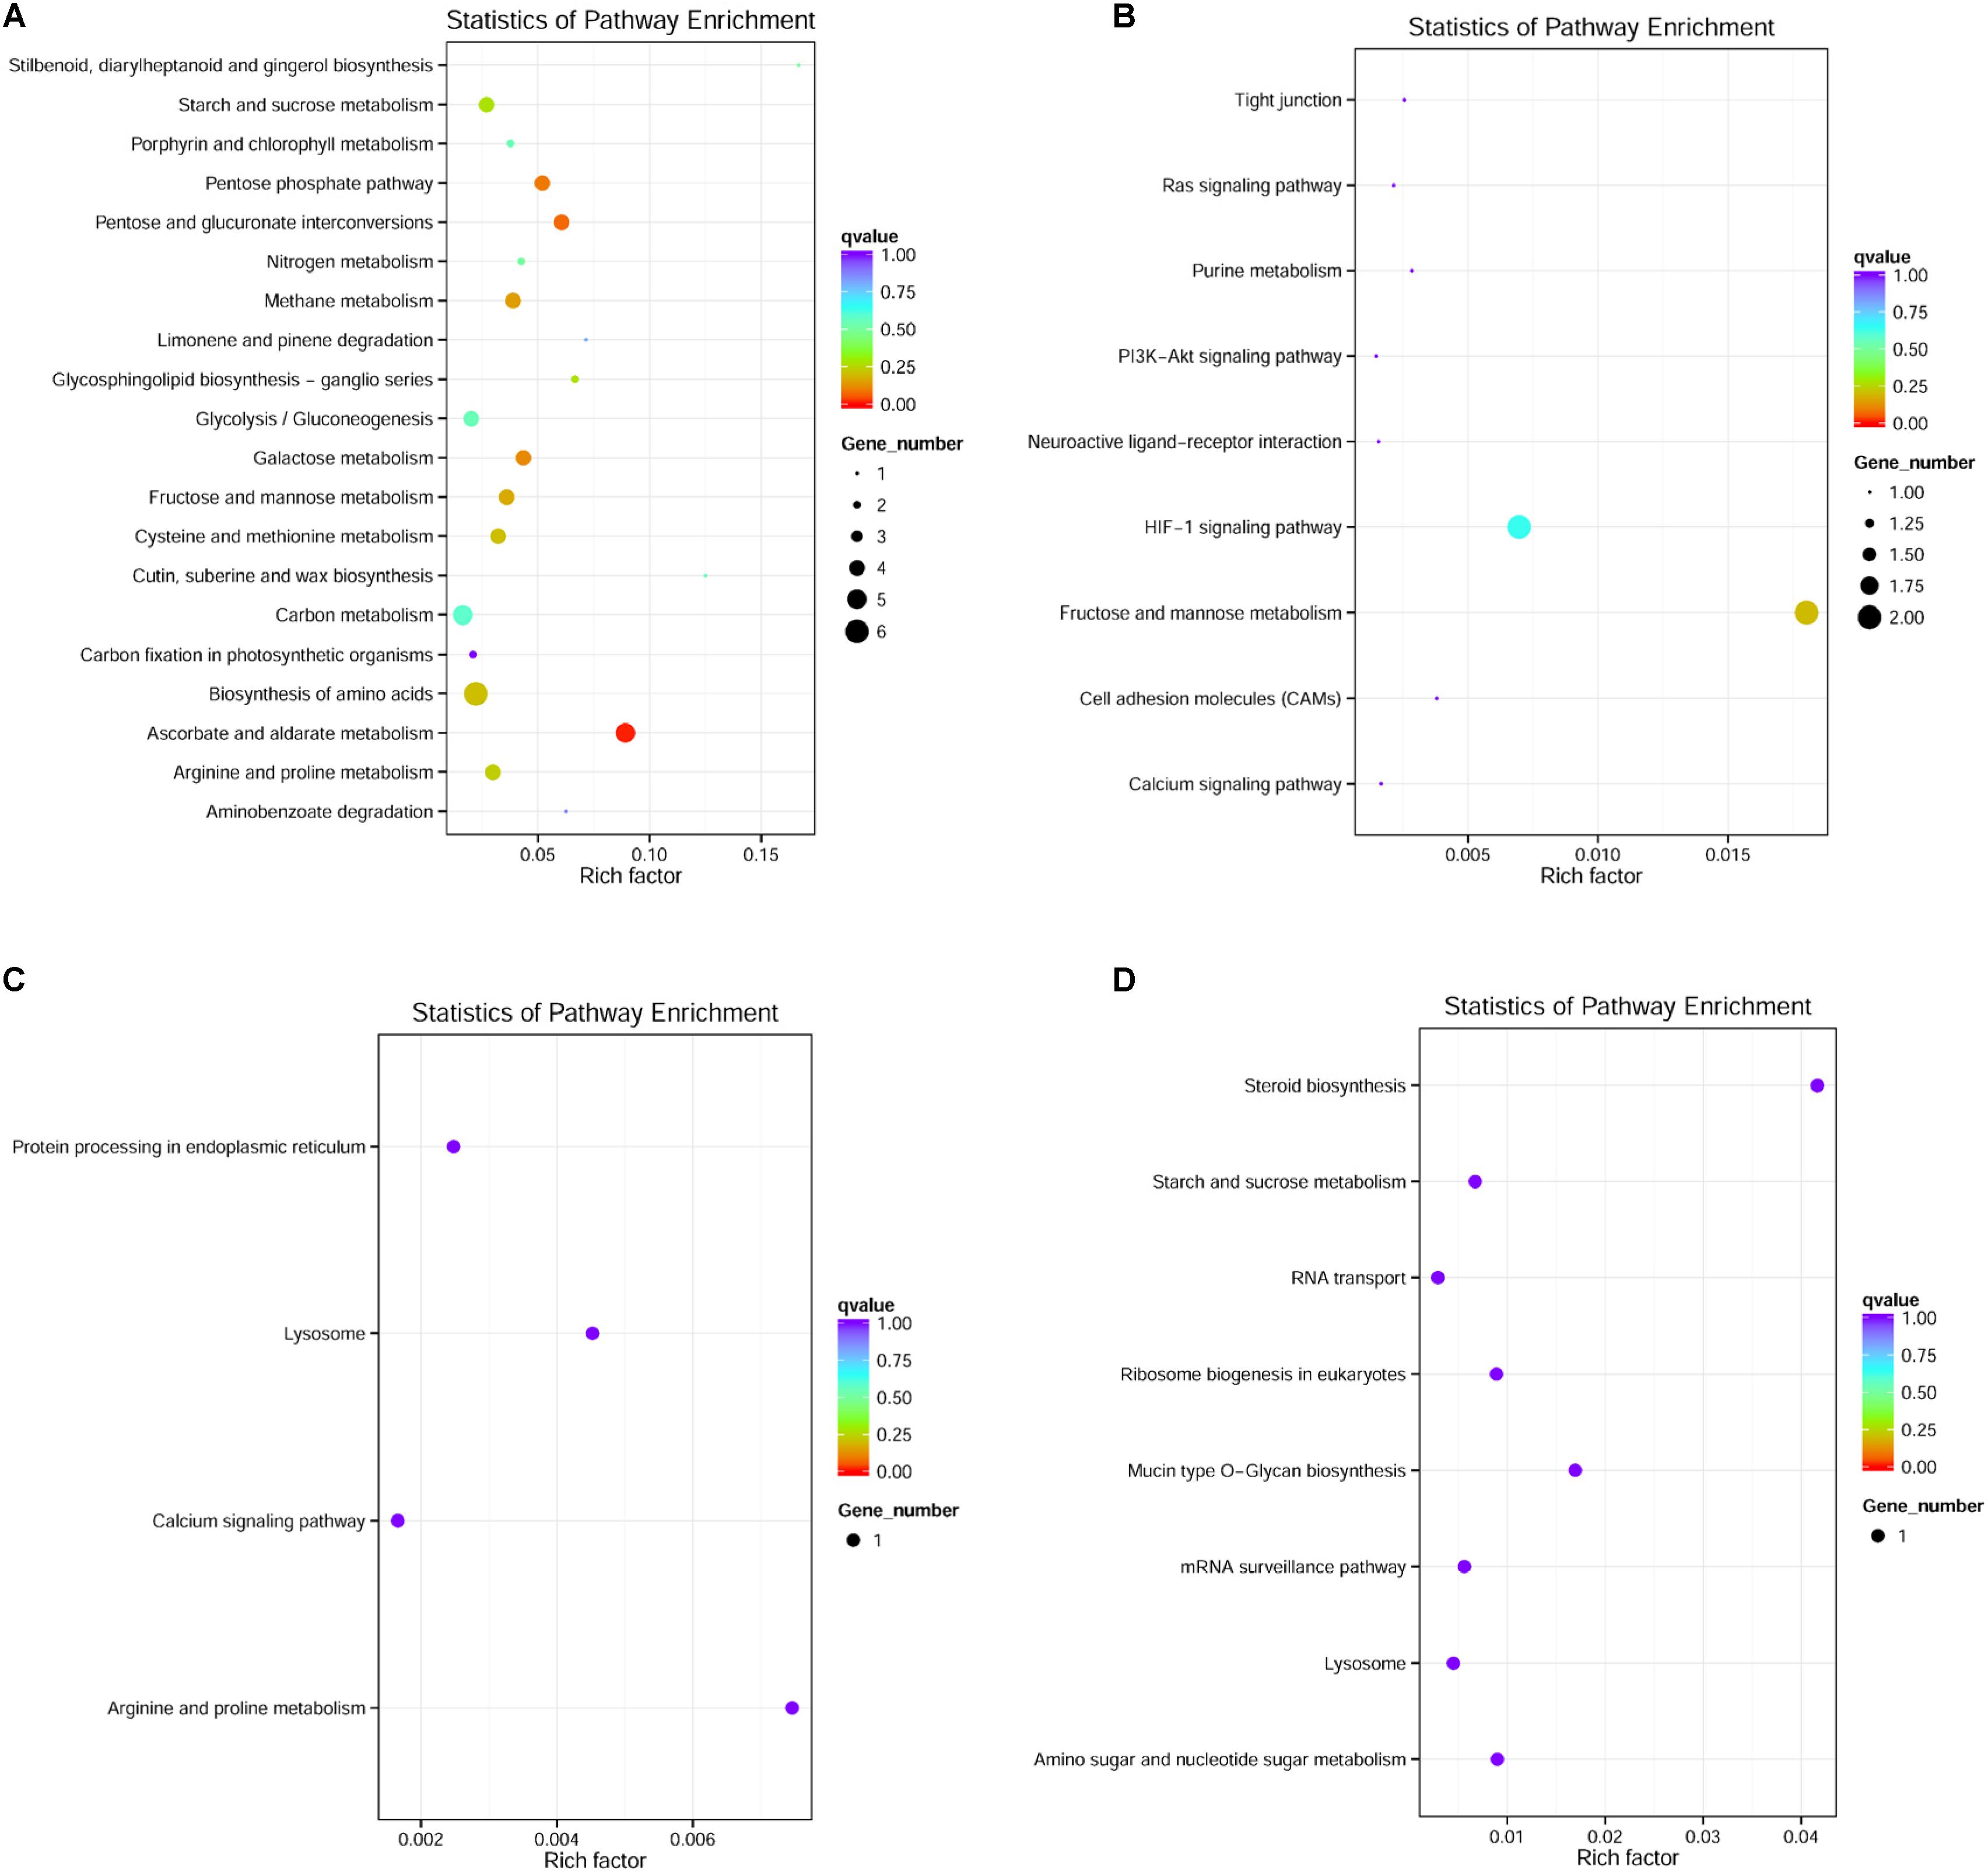
FIGURE 5. An overview of the KEGG pathways significantly enriched in differentially expressed genes in the (A) muscle, (B) blood, (C) brain, and (D) liver. The specific pathways are plotted along the y-axis, and the x-axis indicates the enrichment factor. The size of the colored dots indicates the number of significantly differentially expressed genes associated with each corresponding pathway: pathways with larger-sized dots contain a higher numbers of genes. The color of the each dot indicates the corrected P-value for the corresponding pathway.
Discussion
Limited oxygen availability (hypoxia) is an important environmental stressor that has a profound impact on the survival, reproduction, growth, and development of aquatic life, and thus the aquatic ecosystem as a whole (Shang and Wu, 2004; Storz et al., 2010). Many fish species are able to cope with or adapt to hypoxia via a complex suite of molecular strategies that operate at the transcriptional level (Gracey et al., 2001; van der Meer et al., 2005; Zhong et al., 2009; Kang et al., 2017; Liu et al., 2018). Here, we describe the transcriptomic response of five G. eckloni tissues to hypoxia, affording new insights into the adaptive mechanisms employed by fish subjected to hypoxic conditions.
Under hypoxia, fish may either reduce their metabolic rate to match reduced energy supply, or may maintain their metabolic rate, compensating for the ATP deficit with anaerobic metabolism (glycolysis) (Val et al., 1995; Gracey et al., 2001; Nikinmaa, 2002; Ton et al., 2003; Zhong et al., 2009). Here, several GO slim terms related to the aerobic metabolism of sugar, fat, and protein (including acetyl-CoA transport, fatty-acyl-CoA, coenzyme transport, acetyl-CoA transporter activity, and coenzyme transporter activity) were downregulated in the muscle of the hypoxic fish, as compared to the muscle of the normoxic fish. In addition, several GO slim terms related to the glycolysis pathway were upregulated in the muscle of the hypoxic fish as compared to the muscle of the normoxic fish, including the 6-phosphofructokinase complex, phosphofructokinase activity, and 6-phosphofructokinase activity. These enriched GO terms were supported by our KEGG pathway analysis. These results were consistent with the expression patterns of these genes in several other fish species (Gracey et al., 2001; Nikinmaa and Rees, 2005; Zhong et al., 2009).
The downregulation of genes associated with the tricarboxylic acid cycle (TCA) concurrent with the upregulation of genes associated with the glycolysis pathway in the muscle of hypoxic fish indicated a shift from aerobic oxidation to anaerobic glycolysis. However, glycolysis pathway genes were not upregulated in other tissues, possibly because muscle tissue has a higher glycolytic capacity than other tissues, and is thus better suited to supply the reduced metabolic needs of hypoxic G. eckloni. In addition, three genes involved in the pentose phosphate pathway were induced in the muscle of hypoxic fish, suggesting that muscle tissue may use pyrophosphate (PPi) as an energy source for hypoxic metabolism in G. eckloni.
Catabolism of gluconeogenic amino acids produces either pyruvate or an intermediate of the TCA cycle to generate carbon skeletons for gluconeogenesis (Gracey et al., 2001). Here, two amino acid pathways (“cysteine and methionine metabolism” and “arginine and proline metabolism”) were enriched in the muscle. Several genes involved these two pathways were upregulated under hypoxia, including S-adenosylmethionine synthase, S-adenosylmethionine decarboxylase, brachypodium distachyon adenosylhomocysteinase, homocysteine methyltransferase, and prolyl 4-hydroxylase.
Glucose-6-phosphatase (G-6-Pase) was strongly expressed in the liver, and it was accompanied by hypoxia-induced gluconeogenesis. G-6-Pase catalyzes the dephosphorylation of glucose-6-phosphate to glucose, which is then circulated to other tissues to fuel glycolysis (Gracey et al., 2001; Zhong et al., 2009).
It is notable that the expression of 6-phosphofructo-2-kinase/fructose-2, 6-biphosphatase (PFK-2) was downregulated in the blood under hypoxia, which is not consistent with observations in the muscles and livers of other fish (Gracey et al., 2001; Zhong et al., 2009). PFK-2 may contribute to the regulation of glycolytic flux under hypoxia (Yalcin et al., 2009; Zhong et al., 2009). Thus, in G. eckloni, amino acid catabolism coupled with gluconeogenesis in the liver, concurrent with a decrease in the transcriptional activity of PFK-2, may represent an alternative mechanism for the maintenance of blood glucose levels during hypoxia.
In the muscle, several genes involved in amino acid catabolism (e.g., S-adenosylmethionine synthase and S-adenosylmethionine decarboxylase) were upregulated under hypoxia. S-adenosylmethionine synthase and S-adenosylmethionine decarboxylase catalyze stages of methionine degradation. Consistent with the upregulation of these two genes, glutathione metabolism, which plays an important role in ammonia detoxification in the muscle (Gracey et al., 2001), increased significantly under hypoxia.
Studies have shown that toxic reactive oxygen species (ROS) are overproduced in fish muscle under hypoxic conditions (Lushchak et al., 2001; Bagnyukova et al., 2007; Clanton, 2007). Indeed, the activity levels of antioxidant enzymes, such as catalase, glutathione peroxidase, and superoxide dismutase, increase significantly to protect fish exposed to hypoxic stress (Lushchak et al., 2001; Zhong et al., 2009; Huang et al., 2015; Zhang et al., 2016; Wang et al., 2017). It is interesting that the key pathway related to the antioxidant defense system, ascorbate and aldarate metabolism, was significantly enriched in the muscle of G. eckloni, and that muscle was most affected by hypoxic stress. Three genes involved this pathway were upregulated under hypoxia: L-ascorbate oxidase, L-ascorbate peroxidase, and GDP-L-galactose phosphorylase. Both L-ascorbate oxidase and L-ascorbate peroxidase are oxidoreductases. The former acts on diphenols and related substances as the donor, with oxygen as the acceptor, while the latter acts on peroxides as the acceptor (peroxidases). They are the most important enzymes in ascorbic acid-glutathione detoxification, playing an important role in scavenging ROS and protecting cells from the destructive effects of ROS.
Consistent with this increase in ascorbate and aldarate metabolism, GDP-L-galactose phosphorylase, the key enzyme for ascorbic acid synthesis, was upregulated in the hypoxic G. eckloni. In addition, DyP-type peroxidase, a member of the haem peroxidase family, was upregulated in muscle, indicating the detoxification of the muscle exposed to hypoxic stress. DyP-type peroxidase degrades typical peroxidase substrates, as well as hydroxyl-free anthraquinone. Hypoxic conditions induce the expression of genes involved in the cellular stress response, such as heat shock proteins (HSPs). Ischemia-induced HSP70 expression has been demonstrated in the tissues of intact animals (Dillmann et al., 1986), and in cultured mammalian cells (Benjamin et al., 1990). HSP70 functions as a chaperone, protects cells from apoptosis, and plays important roles in reducing intracellular oxygen free radicals and maintaining the intracellular redox state (Fang et al., 2012). During hypoxia, regulation of the antioxidant system may be a biochemical mechanism that minimizes the destructive effects of free radicals (Zhong et al., 2009). While the enzymes involved in the antioxidant system differ somewhat among fish species, the activation of these enzymes also varies dependent on hypoxia regime.
There was significantly more insulin-like growth factor binding protein 1 (IGFBP-1) mRNA in the blood of G. eckloni under hypoxia as compared to the blood under normoxia. IGFBP-1 is a negative regulator of insulin and insulin-like growth factor in circulating blood (Gracey et al., 2001). Studies have shown that IGFBP-1 upregulation is correlated with intrauterine growth restriction in fetuses subjected to long-term chronic hypoxia (Chard, 1994); IGFBP-1 is also involved in the suppression of cell growth and proliferation in the euryoxic fish Gillichthys mirabilis after exposure to hypoxia (Gracey et al., 2001).
The ras-related and estrogen-regulated growth inhibitor-like protein (RERG), which negatively regulates the growth of cells involved in cardiac muscle development, was strongly upregulated in the heart of G. eckloni under hypoxia. In contrast, eukaryotic elongation factor 2 kinase (eEF-2K) was downregulated in G. eckloni muscle under hypoxia. eEF-2K is a dedicated kinase that regulates the activity of eukaryote extension factor 2 (eEF-2), its only known substrate, via phosphorylation at Thr-56 (Ryazanov et al., 1988; Dumont-Miscopein et al., 1994; Tavares et al., 2014). This decreases the affinity of phospho-eEF-2 for the ribosome, which impedes the elongation phase of protein translation, inhibiting the activity of eEF-2 (Carlberg et al., 1990; Dumont-Miscopein et al., 1994).
Interestingly, translationally-controlled tumor protein (TCTP) was also upregulated in the muscle. TCTP has similar properties to tubulin binding proteins, and associates with microtubules in a cell cycle-dependent manner (Bommer and Thiele, 2004). The overexpression of TCTP results in cell growth retardation (Gachet et al., 1999). Therefore, under hypoxia, the expression patterns of genes involved in the suppression of cell growth and proliferation changed, and protein synthesis rates decreased. These mechanisms may represent an especially important energy-saving strategy for the survival of G. eckloni in hypoxic environments.
Hypoxia-inducible factors (HIFs) have been recognized as the master regulators of the hypoxia signaling pathway; HIFs play important roles in maintaining dynamic oxygen balance and regulating changes in oxygen concentration under hypoxia (Xiao, 2015). An increase in Hif-1α/2α mRNA expression in response to hypoxia has been observed in mouse skeletal muscle (Stroka et al., 2001), in various tissues of Bos grunniens (Wang et al., 2006), and the liver and gill of Megalobrama amblycephala (Li et al., 2015). However, we detected no changes in the expression of Hif-1α/2α in G. eckloni subjected to hypoxia. Instead, egl nine homolog 1 (EGLN1) was significantly upregulated in the brain of G. eckloni. EGLN1 is considered homologous to prolyl-hydroxylase domain-containing protein 2 (PHD2), which plays an important role in the stabilization of Hif-1α. It is thus clear that the response of the HIF signaling pathway to hypoxia differs between mammals and fish. The HIF response also appears to vary among teleosts depending on species, hypoxia regime, and tissue. Further investigation is required to fully understand these variations.
Conclusion
We sequenced, assembled, and characterized the transcriptome of the Tibetan schizothoracine fish G. eckloni. Hypoxia had a greater effect on muscle than on any other tissue. Under hypoxia, G. eckloni underwent changes in gene expression, suggesting several key adaptive strategies. First, a reorganization of metabolic pathways and a transition from aerobic oxidation to anaerobic glycolysis. Second, a suppression of major energy-requiring processes, such as cell growth/proliferation and protein synthesis. In addition to these two strategies, which have also been observed in other teleosts, G. eckloni strengthens its antioxidant system and minimizes ischemic injury in response to hypoxia. This study is the first to analyze gene expression patterns in the Tibetan schizothoracine fish G. eckloni in response to hypoxic stress. Nevertheless, further studies using additional physiological and molecular approaches are necessary to verify the transcriptomic response of schizothoracine fish to hypoxia.
Author Contributions
DQ designed the study and wrote the manuscript. YC and ZZ conducted the hypoxia treatment and collected the materials. RW, MX, and QC performed the experiments and analyzed the data. All authors have read and approved the final manuscript.
Funding
This work was supported by grants from the Natural Science Foundation of Qinghai Science and Technology Department in China (2015-ZJ-901) and the National Natural Science Foundation of China (31460094).
Conflict of Interest Statement
The authors declare that the research was conducted in the absence of any commercial or financial relationships that could be construed as a potential conflict of interest.
Acknowledgments
We thank LetPub for its linguistic assistance during the preparation of this manuscript.
Supplementary Material
The Supplementary Material for this article can be found online at: https://www.frontiersin.org/articles/10.3389/fphys.2018.01326/full#supplementary-material
Footnotes
References
Anders, S., and Huber, W. (2010). Differential expression analysis for sequence count data. Genome Biol. 11:R106. doi: 10.1186/gb-2010-11-10-r106
Bagnyukova, T. V., Luzhna, L. I., Pogribny, I. P., and Lushchak, V. I. (2007). Oxidative stress and antioxidant defenses in goldfish liver in response to short-term exposure to arsenite. Environ. Mol. Mutagen. 48, 658–665. doi: 10.1002/em.20328
Benjamin, I. J., Kroger, B., and Williams, R. S. (1990). Activation of the heat shock transcription factor by hypoxia in mammalian cells. Proc. Natl. Acad. Sci. U.S.A. 87, 6263–6267. doi: 10.1073/pnas.87.16.6263
Bommer, U. A., and Thiele, B. J. (2004). The translationally controlled tumour protein (TCTP). Int. J. Biochem. Cell Biol. 36, 379–385. doi: 10.1016/S1357-2725(03)00213-9
Boswell, M. G., Wells, M. C., Kirk, L. M., Ju, Z., Zhang, Z., Booth, R. E., et al. (2009). Comparison of gene expression responses to hypoxia in viviparous (Xiphophorus) and oviparous (Oryzias) fishes using a medaka microarray. Comp. Biochem. Physiol. C Toxicol. Pharmacol. 149, 258–265. doi: 10.1016/j.cbpc.2008.11.005
Cao, W. X., Chen, Y. Y., Wu, Y. F., and Zhu, S. Q. (1981). “Origin and evolution of schizothoracine fishes in relation to the upheaval of the Xizang Plateau, in collection in studies on the period, amplitude and type of the uplift of the Qinghai-Xizang plateau,” in Studies on the Period, Amplitude and Type of the Uplift of the Qinghai–Xizang Plateau, ed. C. A. O. S. The Team of the Comprehensive Scientific Expedition to the Qinghai-Xizang Plateau (Beijing: Science Press), 118–130.
Carlberg, U., Nilsson, A., and Nygard, O. (1990). Functional properties of phosphorylated elongation factor 2. Eur. J. Biochem. 191, 639–645. doi: 10.1111/j.1432-1033.1990.tb19169.x
Chard, T. (1994). Insulin-like growth factors and their binding proteins in normal and abnormal human fetal growth. Growth Regul. 4, 91–100.
Chen, Y. F., and Cao, W. Y. (2000). “Schizothoracinae,” in Fauna Sinica, Osteichthyes, Cypriniformes III, ed. P. Q. Yue (Beijing: Science Press), 273–390.
Clanton, T. L. (2007). Hypoxia-induced reactive oxygen species formation in skeletal muscle. J. Appl. Physiol. 102, 2379–2388. doi: 10.1152/japplphysiol.01298.2006
Conesa, A., Gotz, S., Garcia-Gomez, J. M., Terol, J., Talon, M., and Robles, M. (2005). Blast2GO: a universal tool for annotation, visualization and analysis in functional genomics research. Bioinformatics 21, 3674–3676. doi: 10.1093/bioinformatics/bti610
Diaz, R. J. (2001). Overview of hypoxia around the world. J. Environ. Qual. 30, 275–281. doi: 10.2134/jeq2001.302275x
Dillmann, W. H., Mehta, H. B., Barrieux, A., Guth, B. D., Neeley, W. E., and Ross, J. Jr. (1986). Ischemia of the dog heart induces the appearance of a cardiac mRNA coding for a protein with migration characteristics similar to heat-shock/stress protein 71. Circ. Res. 59, 110–114. doi: 10.1161/01.RES.59.1.110
Dumont-Miscopein, A., Lavergne, J. P., Guillot, D., Sontag, B., and Reboud, J. P. (1994). Interaction of phosphorylated elongation factor EF-2 with nucleotides and ribosomes. FEBS Lett. 356, 283–286. doi: 10.1016/0014-5793(94)01272-5
Fang, D. A., Wang, Q., He, L., Wang, J., and Wang, Y. (2012). Characterization of heat shock protein 70 in the red claw crayfish (Cherax quadricarinatus): evidence for its role in regulating spermatogenesis. Gene 492, 138–147. doi: 10.1016/j.gene.2011.10.036
Gachet, Y., Tournier, S., Lee, M., Lazaris-Karatzas, A., Poulton, T., and Bommer, U. A. (1999). The growth-related, translationally controlled protein P23 has properties of a tubulin binding protein and associates transiently with microtubules during the cell cycle. J. Cell Sci. 112(Pt 8),1257–1271.
Grabherr, M. G., Haas, B. J., Yassour, M., Levin, J. Z., Thompson, D. A., Amit, I., et al. (2011). Full-length transcriptome assembly from RNA-Seq data without a reference genome. Nat. Biotechnol. 29, 644–652. doi: 10.1038/nbt.1883
Gracey, A. Y., Troll, J. V., and Somero, G. N. (2001). Hypoxia-induced gene expression profiling in the euryoxic fish Gillichthys mirabilis. Proc. Natl. Acad. Sci. U.S.A. 98, 1993–1998. doi: 10.1073/pnas.98.4.1993
Guan, L., Chi, W., Xiao, W., Chen, L., and He, S. (2014). Analysis of hypoxia-inducible factor alpha polyploidization reveals adaptation to tibetan plateau in the evolution of schizothoracine fish. BMC Evol. Biol. 14:192. doi: 10.1186/s12862-014-0192-1
Huang, C. Y., Lin, H. C., and Lin, C. H. (2015). Effects of hypoxia on ionic regulation, glycogen utilization and antioxidative ability in the gills and liver of the aquatic air-breathing fish Trichogaster microlepis. Comp. Biochem. Physiol. A Mol. Integr. Physiol. 179, 25–34. doi: 10.1016/j.cbpa.2014.09.001
Iseli, C., Jongeneel, C. V., and Bucher, P. (1999). ESTScan: a program for detecting, evaluating, and reconstructing potential coding regions in EST sequences. Proc. Int. Conf. Intell. Syst. Mol. Biol. 1999, 138–148.
Kanehisa, M., Goto, S., Kawashima, S., Okuno, Y., and Hattori, M. (2004). The KEGG resource for deciphering the genome. Nucleic Acids Res. 32, D277–D280. doi: 10.1093/nar/gkh063
Kang, J., Ma, X., and He, S. (2017). Evidence of high-altitude adaptation in the glyptosternoid fish, Creteuchiloglanis macropterus from the Nujiang River obtained through transcriptome analysis. BMC Evol. Biol. 17:229. doi: 10.1186/s12862-017-1074-0
Langmead, B., Trapnell, C., Pop, M., and Salzberg, S. L. (2009). Ultrafast and memory-efficient alignment of short DNA sequences to the human genome. Genome Biol. 10:R25. doi: 10.1186/gb-2009-10-3-r25
Li, F. G., Chen, J., Jiang, X. Y., and Zou, S. M. (2015). Transcriptome analysis of blunt snout bream (Megalobrama amblycephala) reveals putative differential expression genes related to growth and hypoxia. PLoS One 10:e0142801. doi: 10.1371/journal.pone.0142801
Li, Y., Ren, Z., Shedlock, A. M., Wu, J., Sang, L., Tersing, T., et al. (2013). High altitude adaptation of the schizothoracine fishes (Cyprinidae) revealed by the mitochondrial genome analyses. Gene 517, 169–178. doi: 10.1016/j.gene.2012.12.096
Liao, X., Cheng, L., Xu, P., Lu, G., Wachholtz, M., Sun, X., et al. (2013). Transcriptome analysis of crucian carp (Carassius auratus), an important aquaculture and hypoxia-tolerant species. PLoS One 8:e62308. doi: 10.1371/journal.pone.0062308
Liu, Y., Li, E., Xu, C., Su, Y., Qin, J. G., Chen, L., et al. (2018). Brain transcriptome profiling analysis of nile tilapia (oreochromis niloticus) under long-term hypersaline stress. Front. Physiol. 9:219. doi: 10.3389/fphys.2018.00219
Livak, K. J., and Schmittgen, T. D. (2001). Analysis of relative gene expression data using real-time quantitative PCR and the 2-Δ Δ CT method. Methods 25, 402–408. doi: 10.1006/meth.2001.1262
Lushchak, V. I., Lushchak, L. P., Mota, A. A., and Hermes-Lima, M. (2001). Oxidative stress and antioxidant defenses in goldfish Carassius auratus during anoxia and reoxygenation. Am. J. Physiol. Regul. Integr. Comp. Physiol. 280, R100–R107. doi: 10.1152/ajpregu.2001.280.1.R100
Nikinmaa, M. (2002). Oxygen-dependent cellular functions–why fishes and their aquatic environment are a prime choice of study. Comp. Biochem. Physiol. A Mol. Integr. Physiol. 133, 1–16. doi: 10.1016/S1095-6433(02)00132-0
Nikinmaa, M., and Rees, B. B. (2005). Oxygen-dependent gene expression in fishes. Am. J. Physiol. Regul. Integr. Comp. Physiol. 288, R1079–R1090. doi: 10.1152/ajpregu.00626.2004
Qi, D., Chao, Y., Guo, S., Zhao, L., Li, T., Wei, F., et al. (2012). Convergent, parallel and correlated evolution of trophic morphologies in the subfamily schizothoracinae from the Qinghai-Tibetan plateau. PLoS One 7:e34070. doi: 10.1371/journal.pone.0034070
Roesner, A., Hankeln, T., and Burmester, T. (2006). Hypoxia induces a complex response of globin expression in zebrafish (Danio rerio). J. Exp. Biol. 209(Pt 11), 2129–2137. doi: 10.1242/jeb.02243
Roesner, A., Mitz, S. A., Hankeln, T., and Burmester, T. (2008). Globins and hypoxia adaptation in the goldfish. Carassius auratus. FEBS J. 275, 3633–3643. doi: 10.1111/j.1742-4658.2008.06508.x
Ryazanov, A. G., Natapov, P. G., Shestakova, E. A., Severin, F. F., and Spirin, A. S. (1988). Phosphorylation of the elongation factor 2: the fifth Ca2 + /calmodulin-dependent system of protein phosphorylation. Biochimie 70, 619–626. doi: 10.1016/0300-9084(88)90245-3
Shang, E. H., and Wu, R. S. (2004). Aquatic hypoxia is a teratogen and affects fish embryonic development. Environ. Sci. Technol. 38, 4763–4767. doi: 10.1021/es0496423
Stewart, M. J., Stewart, P., and Rivera-Posada, J. (2015). De novo assembly of the transcriptome of Acanthaster planci testes. Mol. Ecol. Resour. 15, 953–966. doi: 10.1111/1755-0998.12360
Storz, J. F., Scott, G. R., and Cheviron, Z. A. (2010). Phenotypic plasticity and genetic adaptation to high-altitude hypoxia in vertebrates. J. Exp. Biol. 213(Pt 24), 4125–4136. doi: 10.1242/jeb.048181
Stroka, D. M., Burkhardt, T., Desbaillets, I., Wenger, R. H., Neil, D. A., Bauer, C., et al. (2001). HIF-1 is expressed in normoxic tissue and displays an organ-specific regulation under systemic hypoxia. FASEB J. 15, 2445–2453. doi: 10.1096/fj.01-0125com
Tatusov, R. L., Fedorova, N. D., Jackson, J. D., Jacobs, A. R., Kiryutin, B., Koonin, E. V., et al. (2003). The COG database: an updated version includes eukaryotes. BMC Bioinformatics 4:41. doi: 10.1186/1471-2105-4-41
Tavares, C. D., Ferguson, S. B., Giles, D. H., Wang, Q., Wellmann, R. M., O’Brien, J. P., et al. (2014). The molecular mechanism of eukaryotic elongation factor 2 kinase activation. J. Biol. Chem. 289, 23901–23916. doi: 10.1074/jbc.M114.577148
Ton, C., Stamatiou, D., and Liew, C. C. (2003). Gene expression profile of zebrafish exposed to hypoxia during development. Physiol. Genomics 13, 97–106. doi: 10.1152/physiolgenomics.00128.2002
Val, A., Lessard, J., and Randall, D. (1995). Effects of hypoxia on rainbow trout (Oncorhynchus mykiss): intraerythrocytic phosphates. J. Exp. Biol. 198(Pt 2), 305–310.
van der Meer, D. L., van den Thillart, G. E., Witte, F., de Bakker, M. A., Besser, J., Richardson, M. K., et al. (2005). Gene expression profiling of the long-term adaptive response to hypoxia in the gills of adult zebrafish. Am. J. Physiol. Regul. Integr. Comp. Physiol. 289, R1512–R1519. doi: 10.1152/ajpregu.00089.2005
Wang, D. P., Li, H. G., Li, Y. J., Guo, S. C., Yang, J., Qi, D. L., et al. (2006). Hypoxia-inducible factor 1alpha cDNA cloning and its mRNA and protein tissue specific expression in domestic yak (Bos grunniens) from qinghai-tibetan plateau. Biochem. Biophys. Res. Commun. 348, 310–319. doi: 10.1016/j.bbrc.2006.07.064
Wang, Q. F., Shen, W. L., Hou, C. C., Liu, C., Wu, X. F., and Zhu, J. Q. (2017). Physiological responses and changes in gene expression in the large yellow croaker Larimichthys crocea following exposure to hypoxia. Chemosphere 169, 418–427. doi: 10.1016/j.chemosphere.2016.11.099
Wu, Y. F., and Wu, C. Z. (1992). The Fishes of the Qinghai – Xizang Plateau. Chengdu: Science and Technology Press.
Xia, J. H., Li, H. L., Li, B. J., Gu, X. H., and Lin, H. R. (2018). Acute hypoxia stress induced abundant differential expression genes and alternative splicing events in heart of tilapia. Gene 639, 52–61. doi: 10.1016/j.gene.2017.10.002
Xia, M., Chao, Y., Jia, J., Li, C., Kong, Q., Zhao, Y., et al. (2016). Changes of hemoglobin expression in response to hypoxia in a Tibetan schizothoracine fish, Schizopygopsis pylzovi. J. Comp. Physiol. B 186, 1033–1043. doi: 10.1007/s00360-016-1013-1
Xiao, W. (2015). The hypoxia signaling pathway and hypoxic adaptation in fishes. Sci. China Life Sci. 58, 148–155. doi: 10.1007/s11427-015-4801-z
Yalcin, A., Telang, S., Clem, B., and Chesney, J. (2009). Regulation of glucose metabolism by 6-phosphofructo-2-kinase/fructose-2,6-bisphosphatases in cancer. Exp. Mol. Pathol. 86, 174–179. doi: 10.1016/j.yexmp.2009.01.003
Zhang, G., Mao, J., Liang, F., Chen, J., Zhao, C., Yin, S., et al. (2016). Modulated expression and enzymatic activities of Darkbarbel catfish, Pelteobagrus vachelli for oxidative stress induced by acute hypoxia and reoxygenation. Chemosphere 151, 271–279. doi: 10.1016/j.chemosphere.2016.02.072
Zhong, X. P., Wang, D., Zhang, Y. B., and Gui, J. F. (2009). Identification and characterization of hypoxia-induced genes in Carassius auratus blastulae embryonic cells using suppression subtractive hybridization. Comp. Biochem. Physiol. B Biochem. Mol. Biol. 152, 161–170. doi: 10.1016/j.cbpb.2008.10.013
Keywords: Gymnocypris eckloni, RNA-Seq, hypoxia, transcriptome, gene, pathway
Citation: Qi D, Chao Y, Wu R, Xia M, Chen Q and Zheng Z (2018) Transcriptome Analysis Provides Insights Into the Adaptive Responses to Hypoxia of a Schizothoracine Fish (Gymnocypris eckloni). Front. Physiol. 9:1326. doi: 10.3389/fphys.2018.01326
Received: 15 June 2018; Accepted: 03 September 2018;
Published: 21 September 2018.
Edited by:
Brian James Morris, University of Sydney, AustraliaReviewed by:
Rushita Bagchi, University of Colorado Denver, United StatesAndrew J. Mungall, Canada’s Michael Smith Genome Sciences Centre, Canada
Copyright © 2018 Qi, Chao, Wu, Xia, Chen and Zheng. This is an open-access article distributed under the terms of the Creative Commons Attribution License (CC BY). The use, distribution or reproduction in other forums is permitted, provided the original author(s) and the copyright owner(s) are credited and that the original publication in this journal is cited, in accordance with accepted academic practice. No use, distribution or reproduction is permitted which does not comply with these terms.
*Correspondence: Delin Qi, delinqi@126.com