
- Departamento de Biología Molecular y Bioquímica, Instituto Andaluz de Biotecnología, Universidad de Málaga, Málaga, Spain
Asparagine, a key amino acid for nitrogen storage and transport in plants, is synthesized via the ATP-dependent reaction catalyzed by the enzyme asparagine synthetase (AS; EC 6.3.5.4). In this work, we present the molecular analysis of two full-length cDNAs that encode asparagine synthetase in maritime pine (Pinus pinaster Ait.), PpAS1, and PpAS2. Phylogenetic analyses of the deduced amino acid sequences revealed that both genes are class II AS, suggesting an ancient origin of these genes in plants. A comparative study of PpAS1 and PpAS2 gene expression profiles showed that PpAS1 gene is highly regulated by developmental and environmental factors, while PpAS2 is expressed constitutively. To determine the molecular mechanisms underpinning the differential expression of PpAS1, the promoter region of the gene was isolated and putative binding sites for MYB transcription factors were identified. Gel mobility shift assays showed that a MYB protein from Pinus taeda (PtMYB1) was able to interact with the promoter region of PpAS1. Furthermore, transient expression analyses in pine cells revealed a negative effect of PtMYB1 on PpAS1 expression. The potential role of MYB factors in the transcriptional regulation of PpAS1 in vascular cells is discussed.
Introduction
Asparagine is an important amino acid in plants because it has a high ratio of N/C compared to other amino acids, making it an ideal nitrogen storage and transport compound (Lea et al., 2007). In relation to this feature, many important biological functions in plants have been described for asparagine such as nitrogen recycling during abiotic and biotic stresses or nitrogen mobilization and transport from source to sink tissues (Lea et al., 2007; Gaufichon et al., 2010). Asparagine is synthesized from aspartate and glutamine in the ATP-dependent reaction that is catalyzed by the enzyme asparagine synthetase (AS; EC 6.3.5.4). Given the substrates of this reaction, asparagine synthesis could divert the aspartate flux for aspartate kinase (AK; EC 2.7.2.4) and the glutamine flux generated by glutamine synthetase (GS; EC 6.3.1.2). Therefore, it is likely that the AS, AK, and GS genes are coordinately regulated. In fact, it was recently reported that the AK and AS genes are inversely regulated by bZIP transcription factors in Arabidopsis (Ufaz et al., 2011).
In angiosperms, AS is encoded by a small family of genes which that are phylogenetically separated into two different classes, class I and class II (Gaufichon et al., 2010). The best characterized AS genes in plants belong to class I both in monocots such as rice (Nakano et al., 2000) and dicots such as tomato (Olea et al., 2004). Generally, AS genes appear to be regulated in a reciprocal manner: class I genes are negatively regulated by light or sugars, while class II genes are positively regulated by light (Chevalier et al., 1996; Lam et al., 1998; Gaufichon et al., 2010). However, one class II gene that is expressed ubiquitously, and is not regulated by these factors has been recently reported in Parra-Peralbo et al. (2009), Cañas et al. (2009).
Unlike many other plants, conifer trees have a very long life cycle in which the management of nitrogen compounds plays a crucial role in their survival (Cánovas et al., 1998, 2007). Conifers also have a particularly active phenylpropanoid metabolism because large amounts of lignin are synthesized during wood formation, which also requires the efficient recycling of nitrogen (Cantón et al., 2005). Given these particularities, conifers are a good model for studying nitrogen metabolism and nitrogen recycling. Thus far, only one AS gene has been identified and characterized in pine (Cañas et al., 2006). This gene, PsAS1, is responsible for the high synthesis of asparagine at early stages of seedling development. Cañas et al. (2006) also showed that there is a strong correlation between the levels of PsAS1 mRNA and asparagine during seedling development, suggesting that transcriptional control should be an important component of the overall regulation of asparagine biosynthesis at early stages of pine growth. Similar evidence has been found in other plants: for example in Arabidopsis, an “in silico” network analysis of genes that are differentially expressed during seed germination (Katari et al., 2010) predicted that ASN1 and ASN2 should be subject to strong transcriptional regulation. Currently, little is known about the molecular mechanisms responsible for this transcriptional control in conifers. However, the results of various investigations carried out in our laboratory (Cánovas et al., 2007) suggested that the GS1b/AS pathway is involved in the remobilization of stored nitrogen and its channeling for the biosynthesis of nitrogen compounds during seedling development. It is also known that the transcription factors PtMYB1 and PtMYB4 regulate GS1b expression (Gómez-Maldonado et al., 2004b). Given this background, we decided to characterize the AS gene family in maritime pine and to study whether MYB transcription factors are able to regulate AS.
Materials and Methods
Plant Growth
Maritime pine seeds (Pinus pinaster Ait.) were provided by Centro de Recursos Genéticos Forestales “El Serranillo” (Ministerio de Medio Ambiente y Medio Rural y Marino, Spain). Seeds were imbibed in distilled water for 24 h under continuous aeration and germinated in a plastic tray with vermiculite as a substrate. Seedlings were cultivated in a growth room at 20/24°C and 50/70% relative humidity with a 16/8-h photoperiod and watered twice a week with distilled water. Thirty days after imbibition, seedlings were individually transferred to a 0.2-l pot with vermiculite as a support, and distilled water was replaced by a mineral nutrient solution containing 3 mM ammonium as described by Canales et al. (2010), unless otherwise specified.
Seedlings from 14 to 60 days after imbibition were grown under the same conditions described above and used for analyses of gene expression during the early development of maritime pine. For each assay, at least 20 individual plants were pooled and separate root, hypocotyl, and cotyledon samples were collected. All samples were immediately frozen in liquid nitrogen and stored at −80°C until processing. Samples from adult trees were collected as described in Canales et al. (2011a).
RNA Isolation, RACE, and CDNA Cloning
Total RNA was isolated following the protocol described by Liao et al. (2004) with minor modifications. The same protocol was used to isolate RNA from seedlings and adult trees. Briefly, 100 mg of each sample was extracted with a 650-μL of a preheated (65°C) CTAB extraction buffer [3% (w/v) CTAB, 100 mM Tris pH 8, 2 M NaCl, 2% (w/v) PVP40, 30 mM EDTA] in a 1.5-mL tube. The samples were then mixed by inversion four to six times and incubated for 2 min at 65°C in a water bath. A volume of 650 μL of chloroform/isoamyl alcohol (24:1) was immediately added to each microcentrifuge tube, and the samples were centrifuged for 10 min at 15,000 × g at 4°C. The supernatant was recovered, and a second chloroform extraction was performed. Then, a 3/7 volume of 10 M LiCl was added, and the mixture was incubated on ice for 30 min. RNA was pelleted after centrifugation at 25,000 × g for 25 min at 4°C. The pellet was washed with 70% ethanol and finally resuspended in 25 μl of sterilized distilled water. RNA concentration and purity were determined spectrophotometrically, and only samples with an A260/A280 nm ratio of 1.9–2.1 and an A260/A230 nm ratio of more than 1.7 were used for subsequent experiments. RNA quality was further confirmed by agarose gel electrophoresis.
To clone the full-length cDNAs (FLcDNAs) of PpAS1 and PpAS2, a 5′ RACE PCR was performed using the FirstChoice RLM-RACE Kit (Ambion). The PpAS1 5′ RACE oligonucleotides were designed based on a Pinus sylvestris FLcDNA sequence (accession number AJ496567), and the PpAS2 5′ RACE oligonucleotides were designed based on a Picea sitchensis FLcDNA (accession number ABR16560). PCR was performed with the high-fidelity Velocity DNA polymerase (Bioline, London, UK) in a MJ Mini Personal Thermal Cycler (Bio-Rad España, Madrid, Spain) with the following program: one cycle of 98°C for 2 min followed by 35 cycles of 98°C for 15 s, 60°C for 30 s, and 72°C for 15 s. The resulting blunt-end PCR products were cloned into pJET1.2 (Promega, Madison, USA) using a CloneJET PCR Cloning Kit (Fermentas, St. Leon-Rot, Germany) and sequenced with a CEQ 8000 Genetic Analysis System (Beckman Coulter, Madrid, Spain). The 5′-end sequences of these PCR products were used to design primers to amplify FLcDNAs of PpAS1 and PpAS2 by 3′ RACE using the FirstChoice RLM-RACE Kit (Ambion Inc., Austin, USA).
Sequence Analysis
Amino acid sequences deduced from the AS genes of gymnosperms and angiosperms were identified in the GenBank1 and Phytozome2 databases, respectively; these sequences were aligned using TCoffee software (Notredame et al., 2000). The resulting alignment was used to construct a maximum-likelihood phylogenetic tree with a JTT matrix model in Seaview 4.2 software (Gouy et al., 2010). The statistical support of branches was assessed by approximate likelihood-ratio test (aLRT), which is an alternative to non-parametric bootstrap estimation (Anisimova and Gascuel, 2006). Jalview 2 software (Waterhouse et al., 2009) was used to edit the alignment.
Real-Time Quantitative PCR
RNA samples were treated with RQ1 RNase-Free DNase (Promega) to eliminate any traces of genomic DNA. cDNA synthesis was performed with the PrimeScript RT Reagent Kit (Takara, Shiga, Japan) using total RNA as a template (500 ng) in the presence of oligo(dT) and random primers.
Real-time PCR was carried out on an Mx3000P thermal cycler (Stratagene, Madrid, Spain) with a SYBR Premix Ex Taq kit (Takara) under the following conditions: 95°C for 30 s (1 cycle), 95°C for 5 s, 60°C for 10 s, and 72°C for 15 s (40 cycles). After the final cycle, a melting curve analysis was performed over a temperature range of 60°C to 95°C in 0.5°C increments in order to verify the reaction specificity. Ten nanogram of reverse transcribed cDNA was used as a template for each reaction.
The raw fluorescence data from each reaction was fitted to the MAK2 model, which requires no assumptions about the amplification efficiency of a quantitative PCR (qPCR) assay (Boggy and Woolf, 2010). The initial target concentrations (D0 parameter) for each gene were deduced from the MAK2 model using the qpcR package for the R environment (Ritz and Spiess, 2008) and normalized to the geometric mean of three reference genes (encoding actin, 40S ribosomal protein, and elongation factor-1-alpha).
Protein Analysis
Protein extraction and western blot analysis were performed as described previously (Cañas et al., 2006). Tissue sectioning, fixation, and embedding were conducted as described by Canales et al. (2011b). AS and GS protein were revealed using specific antibodies (Cantón et al., 1996; Cañas et al., 2006).
Isolation of the PpAS1 Promoter Region
Pine genomic DNA was isolated using the CTAB method (Doyle and Doyle, 1987) and the Universal Genome Walker Kit (Clontech, Mountain View, CA, USA) was used according the manufacturer’s instructions to isolate the PpAS1 gene promoter region. The Advantage Genomic Polymerase mix (Clontech) was used as the DNA polymerase enzyme for the genome walking PCR reactions. A 1006-bp region of the PpAS1 promoter was isolated via two successive rounds of genome walking. The first round yielded a fragment of 600 bp and the second round yielded a fragment of 400 bp. Finally, 100 ng of undigested genomic DNA was used in a single PCR reaction to obtain 1006 bp of the PpAS1 promoter region. This PCR was carried out with the high-fidelity Velocity DNA polymerase (Bioline) in a MJ Mini Personal Thermal Cycler (Bio-Rad) with the following program: one cycle of 98°C for 2 min, 10 cycles of 98°C for 15 s, 70°C for 30 s (−1°C per cycle), and 72°C for 30 s, 25 cycles of 98°C for 15 s, 60°C for 30 s, and 72°C for 30 s, and a final extension step of 72°C for 5 min. PCR products were cloned and sequenced as described for cDNAs above.
Electrophoretic Mobility Shift Assays
The FLcDNAs encoding the Pinus taeda PtMYB1 (Patzlaff et al., 2003) and P. pinaster PpMYB8 (Cánovas and Avila, unpublished) were overexpressed in Escherichia coli and recombinant proteins were purified as described elsewhere (Gómez-Maldonado et al., 2004b). Each binding assay used 0.6 μg of the purified MYB protein. Electrophoretic mobility shift assays (EMSA) conditions were essentially the same as those described by Gómez-Maldonado et al. (2004b) to test the binding of the PtMYB1 and PpMYB8 proteins (Figure 5). To evaluate the specificity of the sequences in the AS1 promoter fragment involved in MYB1 binding, competition experiments were performed using the following AC fragments: ACbox1, ACbox2, and ACbox3 (Figure 6). For the competition experiments, increasing amounts of competitor were included in the assay. In the proteinase K assay, the proteins were treated with 3 μg of proteinase K for 10 min, at 25°C prior to the binding reaction. EMSA was carried out as previously described, except that the radiolabeled probe and the non-radiolabeled competitor were mixed and added simultaneously in the second step of the reaction. Each binding mixture (20 ml) contained 2 ml of 10× binding buffer [100 mM 2-amino-2-(hydroxymethyl)-1,3-propanediol (TRIS) pH 7.6, 500 mM NaCl, 10 mM DTT, 10 mM EDTA, 50% glycerol], 2 μg salmon sperm DNA, and the appropriate amount of competitor or proteinase K. The DNA–protein complexes were analyzed by electrophoresis on 6% (w/v) polyacrylamide, 2% glycerol gels run in 0.25× TRIS–borate–EDTA (TBE) buffer at 130 V for 2 h at 4°C. After electrophoresis, the gels were dried under vacuum on Whatman 3 mm paper and exposed to Kodak X-ray film (X-OMAT LS, Sigma Aldrich, Madrid, Spain) overnight.
Gene Constructs and Transient Expression Analysis in Pine Protoplasts
To construct reporter plasmids, PCR products derived from the PpAS1 promoter were ligated in-frame to the GUS gene in the pBI221 vector (Jefferson et al., 1987), replacing the full CaMV 35S promoter. For promoter deletions, the desired fragments were amplified from the longest PpAS1 promoter fragment (1006 bp) by PCR using sequence-specific primers. PtMYB1:pJIT60 (Gómez-Maldonado et al., 2004b) was used in effector construction.
Protoplasts were prepared from cotyledons of 14-day-old seedlings of P. pinaster as described in Gómez-Maldonado et al. (2001). Protoplast transformation and GUS analysis were performed as described previously (Gómez-Maldonado et al., 2004a).
Results
Identification and Molecular Characterization of Two Asparagine Synthetase Genes in Maritime Pine
A Southern blot analysis of the Scots pine (P. sylvestris) asparagine synthetase (AS) carried out by Cañas et al. (2006) suggested that there is more than one AS gene in the pine genome. Based on this result, we decided to conduct a thorough search for AS sequences in the GenBank nucleotide database using the P. sylvestris AS1 cDNA sequence as a reference (AJ496567). Using this approach, we identified two different genes, ABR16980 and ABR16560, in the collection of FLcDNAs from the Sitka spruce (P. sitchensis; Ralph et al., 2008). The nucleotide sequence of P. sitchensis ABR16980 has a high sequence identity (92%) to the previously reported P. sylvestris AS1 cDNA, while P. sitchensis ABR16560 has a much lower identity (80%). Based on these data, we used RLM-RACE PCR to obtain the FLcDNAs for both putative AS genes in maritime pine (P. pinaster). First, we obtained the FLcDNA sequence for P. pinaster AS1 (accession number HQ625490), which had a high identity (98%) to the P. sylvestris AS1 previously reported by Cañas et al. (2006). The PpAS1 FLcDNA sequence contained a 5′ untranslated region of 104 bp, a coding region of 1782 bp, and a 3′ untranslated region of 214 bp. The open reading frame (ORF) encodes a protein of 593 amino acids with a predicted molecular weight of 66.8 kDa. Using the strategy described above, we also obtained a 2269-bp FLcDNA encoding a putative novel conifer AS that we termed AS2 (accession number HM222940). The P. pinaster FLcDNA sequence for AS2 contained a 5′ untranslated region of 193 bp, a coding region of 1773 bp, and a 3′ untranslated region of 281 bp. The ORF encodes a protein of 590 amino acids with a predicted molecular weight of 66.5 kDa.
An alignment of the predicted amino acid sequences of the spruce and pine AS was performed (Figure 1A). The amino acid changes between the two conifer AS genes are distributed homogeneously in the well conserved glutaminase and synthetase domains; however, most of the amino acid changes are concentrated in the C-terminal region of the protein sequence. Amino acid residues essential for aspartate, AMP, and glutamine binding are conserved, except valine 268 (included in the AMP binding site), which has been replaced by an isoleucine in the AS2 sequence.
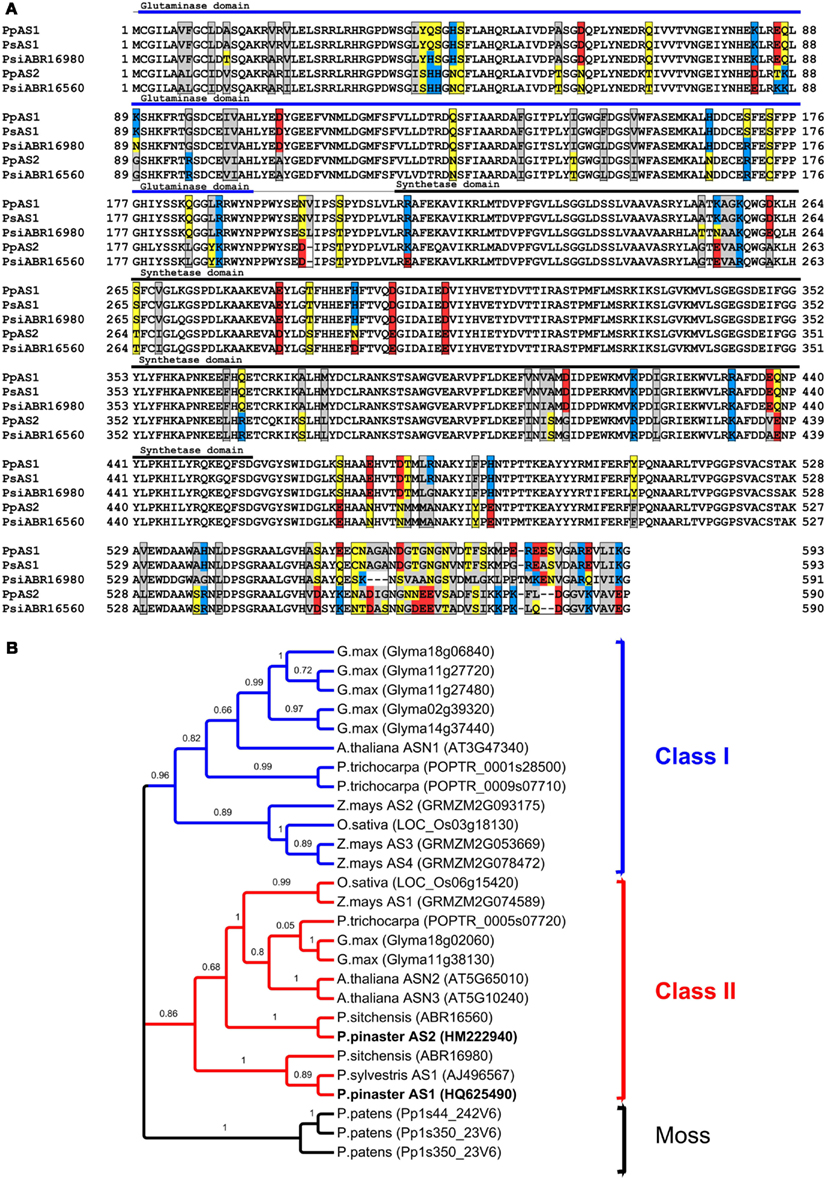
Figure 1. Sequence analysis of conifer AS genes. (A) Alignment of the deduced amino acid sequences of conifer AS genes using TCoffee. Amino acids changes between AS proteins are labeled with boxes and also are colored according to their physicochemical properties: hydrophilic in yellow, hydrophobic in gray, positively charged in red, and negatively charged in blue. The AS polypeptides used in the alignment are Pinus sylvestris AS1 (PsAS1, AJ496567), Pinus pinaster AS1 (PpAS1, HQ625490), Pinus pinaster AS2 (PpAS2, HM222940), and Picea sitchensis (PsiABR16980 and PsiABR16560). (B) Unrooted phylogenetic tree of representative plant AS proteins. Amino acid sequences of conifer AS and other AS derived from the complete genome sequences of six representative plant species were aligned with TCoffee software and the phylogenetic tree was constructed with maximum-likelihood criterion. Locus name are indicated in according with phytozome nomenclature after abbreviated specie name.
To examine the phylogenetic relationships between these conifer genes with other plant AS genes, a phylogenetic tree was constructed using the maximum-likelihood method with the full-length amino acid sequences of AS proteins from five selected angiosperm species (Arabidopsis thaliana, Populus trichocarpa, Zea mays, Oryza sativa, and Glycine max) and a moss (Physcomitrella patens), whose complete genomic sequence has been published, and conifer sequences. The phylogenetic tree displays two major classes of AS genes, class I and class II; class I is formed by two different subgroups, one consisting of dicot genes (which include the functionally characterized Arabidopsis ASN1 gene) and another subgroup of monocot genes (Figure 1B). The conifer AS genes (AS1 and AS2) were categorized as class II AS genes. Interestingly, AS2 genes from P. pinaster and P. sitchensis were grouped in the same cluster as all class II angiosperm genes, including the Arabidopsis ASN2 and ASN3 genes. In contrast, the conifer AS1 genes were grouped in a separate cluster.
Comparative Expression Analysis of PpAS1 and PpAS2 during Pine Development
To gain insight into the function of PpAS2 during maritime pine development, its transcript levels in different organs from seedlings and adult trees were analyzed by real-time qPCR and compared to PpAS1 expression. To perform this analysis, we designed primer pairs to specifically amplify portions of the 3′ UTR regions PpAS1 and PpAS2. The comparative expression analysis of PpAS1 and PpAS2 genes is shown in the Figure 2. In seedlings, PpAS1 is mostly expressed in hypocotyls at early stages of development (14 and 21 days after imbibition); however, transcripts levels dramatically decreased at 35 days after imbibition and were almost undetectable 60 days after imbibition. PpAS1 expression was much lower in roots and cotyledons than in hypocotyls and was only apparent in these tissues at early stages of development (14 and 21 days after imbibition). These results are consistent with those reported by Cañas et al. (2006) in Scots pine. In adult maritime pine trees, the transcript levels of PpAS1 were almost undetectable in all organs analyzed, except the apical buds (Figure 2, tree, sample AB). In contrast to PpAS1, PpAS2 was expressed at similar levels in all tested samples from seedlings and adult trees (Figure 2, compare seedling and tree panels). The constitutive expression of PpAS2 detected in samples from seedlings and trees were much lower (50-fold) than the peak values of PpAS1 observed in developing seedlings (Figure 2, seedlings, H). These results indicate that the predominant AS gene during early stages of maritime pine development is PpAS1.
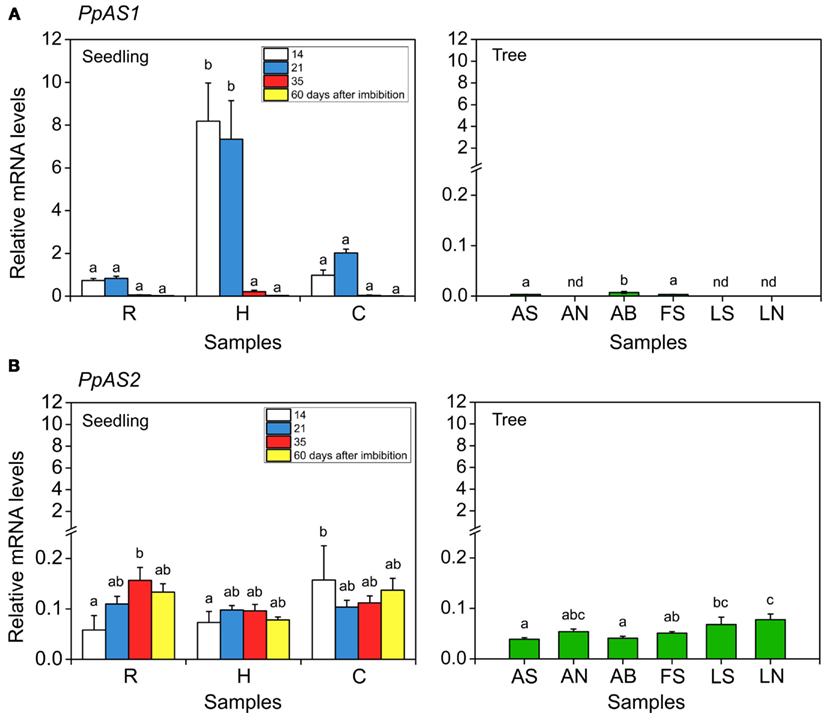
Figure 2. Expression analysis of PpAS1 and PpAS2 in maritime pine seedlings and trees. Total RNA was extracted from different samples harvested from seedlings (14–60 days after imbibition) or from 25-year-old trees. R, roots; H, hypocotyls; C, cotyledons; AS, apical shoot; AN, apical needles; AB, apical bud; FS, female strobili; LS, lateral shoot; LN, lateral needles. Total RNA was reverse transcribed and then the first-strand of the cDNA was amplified using specific primers for PpAS1 and PpAS2 genes. The levels of PpAS1(A) and PpAS2 (B) transcripts were determined by real-time qPCR. Expression data were normalized using a geometric mean of three reference genes (ACT, 40S, and EF1α). Means with different lowercase letters are significantly different, P ≤ 0.01 (one-way ANOVA and Tukey’s test).
To further study AS expression in maritime pine, the relative abundance of AS protein was examined by western blot analyses of the same samples for which PpAS1 and PpAS2 expression levels had been determined by qPCR (Figure A1A in Appendix). A protein band of approximately 67 kDa was identified in protein extracts from maritime pine seedlings using an antibody raised against recombinant AS from P. sylvestris (Cañas et al., 2006), the amino acid sequence of which was 98% identical to PpAS1. The peak level of AS protein was observed in the hypocotyls and lower amount of protein were detected in roots and cotyledons, at 21 days after imbibition. No immunoreactive signals were observed in the protein extracts from adult trees (not shown). The data for AS protein accumulation in maritime pine correspond well to the observed expression pattern of PpAS1 mRNA. The tissue-specific localization of AS was also determined in seedling tissue sections and compared to the localization of GS. As previously reported for P. sylvestris (Cañas et al., 2006), AS was restricted to vascular bundles (Figure A1B in Appendix).
PpAS1 and PpAS2 Gene Expression Profiles in Response to Diverse Environmental Factors
It is well documented that the expression of AS genes is tightly regulated by light/dark, nitrogen source, and various environmental stresses in several plants (Gaufichon et al., 2010). To study the effect of light/dark cycle on the expression of PpAS1 and PpAS2 genes, pine seedlings were grown for 2 weeks in constant darkness or constant light, and samples from the root, hypocotyl, and cotyledons were collected for gene expression analysis. The results revealed that PpAS1 was induced by dark in all organs, but the induction was particularly pronounced in the cotyledons where the transcript levels were about seven times higher in the dark than in the light (Figure 3A). In contrast, the level of PpAS2 transcripts was not altered by darkness.
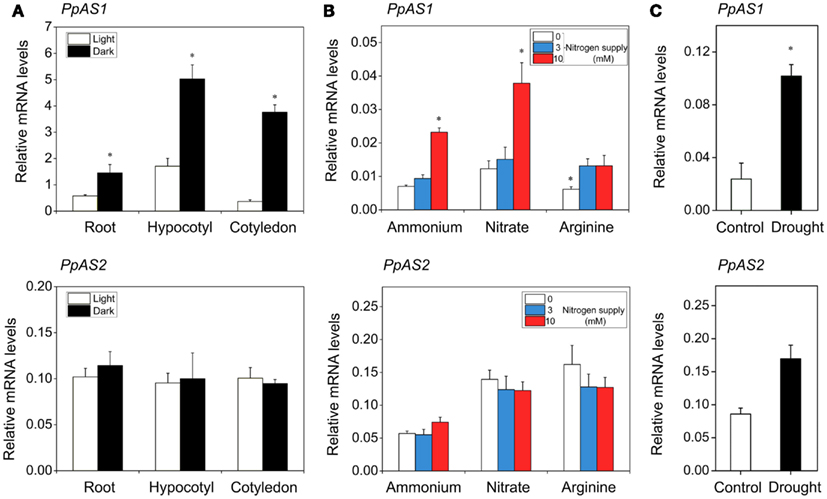
Figure 3. Effect of several environmental factors on the abundance of PpAS transcripts. (A) PpAS1 and PpAS2 expression in the roots, hypocotyls, and cotyledons of pine seedlings germinated under continuous light or dark. Total RNA extracted from these samples was analyzed by real-time qPCR. (B) Expression profiles of pine AS genes in response to nitrogen source and availability. Total RNA was extracted from roots of maritime pine seedlings treated during 30 days with 0, 3, or 10 mM of different nitrogen sources (ammonium, nitrate, and arginine) and then transcripts levels of PpAS1 and PpAS2 were quantified by real-time qPCR. (C) PpAS1 and PpAS2 expression in roots of seedlings subjected to a drought period of 21 days analyzed by real-time qPCR. Expression data were normalized using a geometric mean of three reference genes (ACT, 40S, and EF1α). A Student’s t-test was performed to test the significance (P ≤ 0.01) of the differences between treatments. Significant changes are indicated with an asterisk.
In Arabidopsis, nitrogen sources affect different AS genes in different ways. For instance, organic nitrogen up-regulates ASN1 mRNA levels (Lam et al., 1998), whereas inorganic nitrogen down-regulates ASN2 gene expression (Wong et al., 2004). To explore the effect of the nitrogen source and availability on the expression of pine AS genes, P. pinaster seedlings were grown with ammonium, nitrate, or arginine as the sole nitrogen sources at different concentrations. As shown in Figure 3B, PpAS1 transcripts accumulated with seedlings were grown under high concentrations of nitrate or ammonium (10 mM), while PpAS2 transcript abundance was not affected by any nitrogen treatments.
In addition, we examined the responsiveness of maritime pine AS genes to drought in seedlings subjected to water deficit for 21 days. Water stress also triggered the expression of PpAS1, whereas PpAS2 expression was not altered significantly (Figure 3C).
Isolation and Analysis of PpAS1 Promoter
The expression analysis above suggested that PpAS2 expression is essentially constitutive, while the expression of PpAS1 is regulated by developmental and environmental factors. As a first step to clarify the mechanism underlying the expression pattern of PpAS1, a genomic fragment of the PpAS1 5′ flanking region was isolated from maritime pine genomic DNA through a genome walking strategy. The transcriptional start site (+1) in the promoter region was determined using RLM-RACE and was found to be located 104 bp upstream of the translational initiation codon. A typical TATA box (TATAAAT) was recognized at positions −23 to −29 relative to the transcription start site (Figure 4). We conducted a search using PlantPan software (Chang et al., 2008) to identify regulatory cis-acting elements in the PpAS1 promoter that could be involved in the regulation of AS1 gene expression. The promoter sequence contained several putative regulatory motifs found in the promoters of other plant AS genes, such as a sucrose responsive elements (TATCCAT) identified in asparagus (Winichayakul et al., 2004) and G-box elements (ACGT) essential for the activation of the Arabidopsis ASN1 promoter by the sucrose regulated transcription factor bZIP11 (Hanson et al., 2008). MYB transcription factor binding sites, named AC elements, were also identified as potential regulatory sites because previous studies have shown that R2/R3 MYB transcription factors regulate the lignin biosynthesis (Patzlaff et al., 2003; Bomal et al., 2008) and nitrogen recycling (Gómez-Maldonado et al., 2004b) associated with this metabolic pathway in conifers.
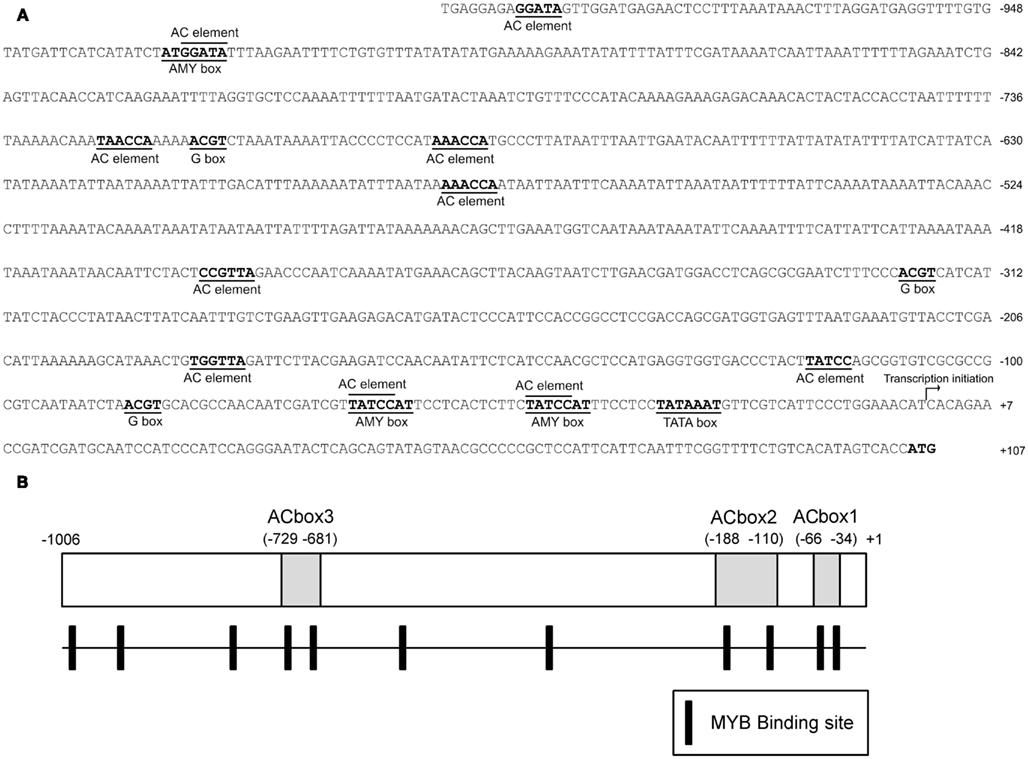
Figure 4. Structure of the 5′ upstream region of the PpAS1 gene. (A) The full-length sequence of the isolated promoter. The location of consensus sequences for putative regulatory elements is indicated over the nucleotide sequence. Numeration is referred to the transcription initiation site (+1) determined by RLM-RACE PCR. (B) A schematic representation of the distribution of AC elements in the PpAS1 gene promoter. The positions of ACBox1, ACBox2, and ACBox3 are marked.
PtMYB1 Binds to ac Elements in the PpAS1 Promoter
After conducting this in silico analysis of the PpAS1 promoter, we asked whether MYB transcription factors are able to modulate the expression of this promoter. To answer this question, we first investigated two MYB transcription factors that were previously reported to be involved in lignification in conifers, MYB1, and MYB8 (Patzlaff et al., 2003; Bomal et al., 2008). We conducted binding experiments using the expression products of PtMYB1 (Accession no. AY356372; Gómez-Maldonado et al., 2004b) and PpMYB8, the P. pinaster ortholog of PtMYB8 (Accession no. FN868598; Cánovas and Avila, unpublished) and three oligonucleotides from different regions of the PpAS1 promoter, which contained two putative AC elements (Figure 5A). The amino acid sequences of PpMYB1 and PtMYB1 were almost identical including both DNA binding and C-terminal domains. This was determined by retrieving the PpMYB1 full-length cDNA (Accession no. EU487890) from the maritime pine databases (Fernández-Pozo et al., 2011) and performing a protein alignment (Figure A2 in Appendix). In order to determine whether these transcription factors were able to bind the PpAS1 probes, EMSA assays were performed with purified recombinant PtMYB1 and PpMYB8 proteins, and radiolabeled oligonucleotides. PtMYB1 was able to induce visible mobility shifts for all tested AC box targets. However, PpMYB8 was unable to generate mobility shifts for any of the AC boxes. It was also noted that the intensity of the band shifts was greater for ACbox2 and ACbox3, than for ACbox1 (Figure 5B). Additional experiments were performed with proteinase K and increasing concentration of competitor in order to validate the specificity of the binding between the different AC boxes and PtMYB1 (Figure 6). The formation of the shifted bands was protein-dependent because treatment with proteinase K abolished the shifts and only high concentration of competitor prevented the interaction between PtMYB1 and the PpAS1 probes.
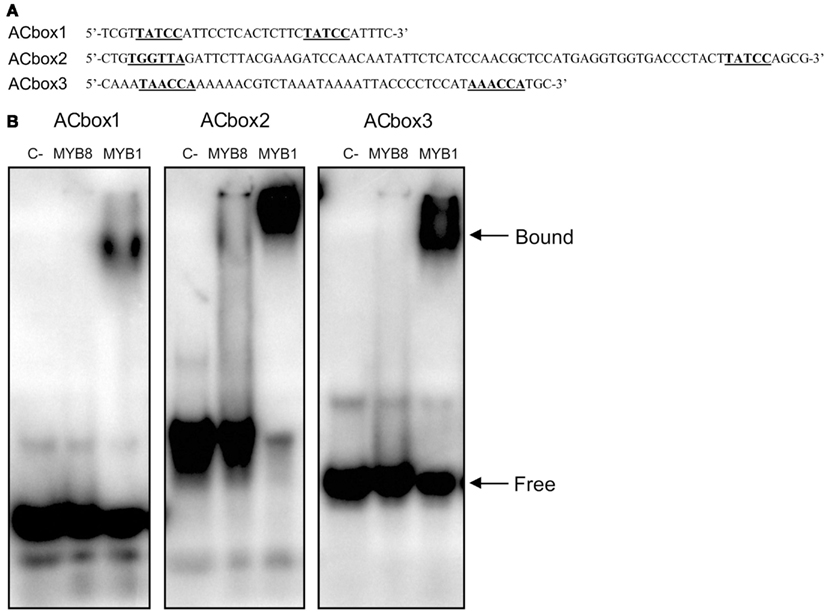
Figure 5. Interaction of MYB proteins with oligonucleotide probes derived from the PpAS1 promoter. (A) The sequence of three oligonucleotides containing the MYB binding motif predicted within the PpAS1 promoter and used as probes for the EMSA analysis. Numeration is referred to the transcription initiation site of PpAS1 gene. (B) EMSA of recombinant PtMYB1 and PpMYB8 proteins with PpAS1 probes. The assays without MYB proteins are designated as C−.
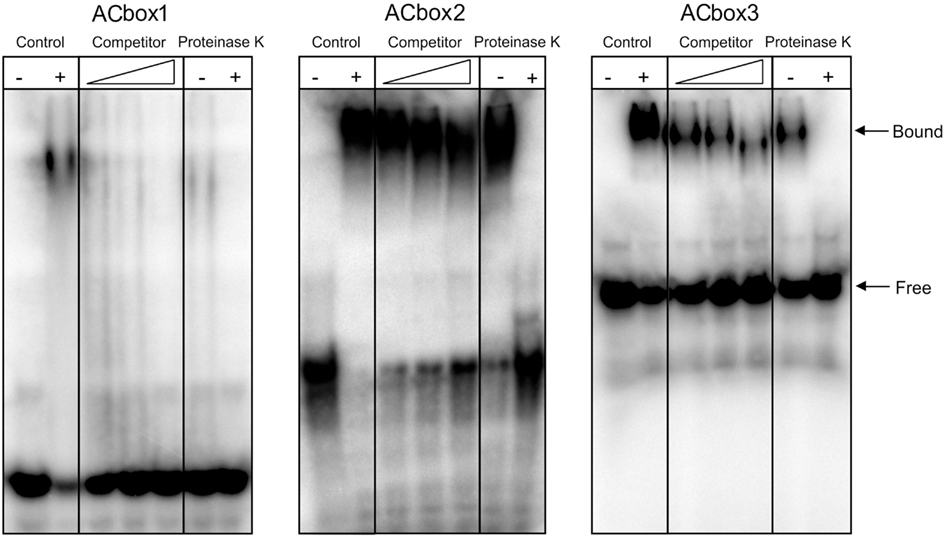
Figure 6. Analysis of the interaction between PtMYB1 and the PpAS1 promoter. Experiments of PtMYB1 binding with specificity control tests. Competition experiment was performed using increasing molar amounts of polydI-dC (20×, 50×, and 100×) indicated by the triangle. For the proteinase K experiment −/+ signs indicate with/without treatment.
PtMYB1 Negatively Regulates PpAS1 Promoter in Pine Protoplasts
The ability of PtMYB1 to activate the transcription of PpAS1 in vivo was studied using transient expression analysis in pine protoplasts (Gómez-Maldonado et al., 2001). To perform these assays, we generated a reporter construct by fusing the GUS reporter gene to a ~1,000 bp fragment containing the sequence upstream of the PpAS1 transcriptional start (PpAS1pro:GUS). We also constructed an effector plasmid consisting of the CaMV 35S promoter fused to the whole ORF of PtMYB1 (35Spro:PtMYB1). A schematic representation of the structure of these constructs is shown in Figure 7A. As shown in Figure 7B, co-transformation of the reporter construct with 35Spro:PtMYB1 resulted in an approximately 50% decrease in GUS activity compared to the GUS activity observed in the absence of the transcription factor. These results were further confirmed by determination of endogenous PpAS1 transcript levels in electroporated protoplasts (Figure A3 in Appendix).
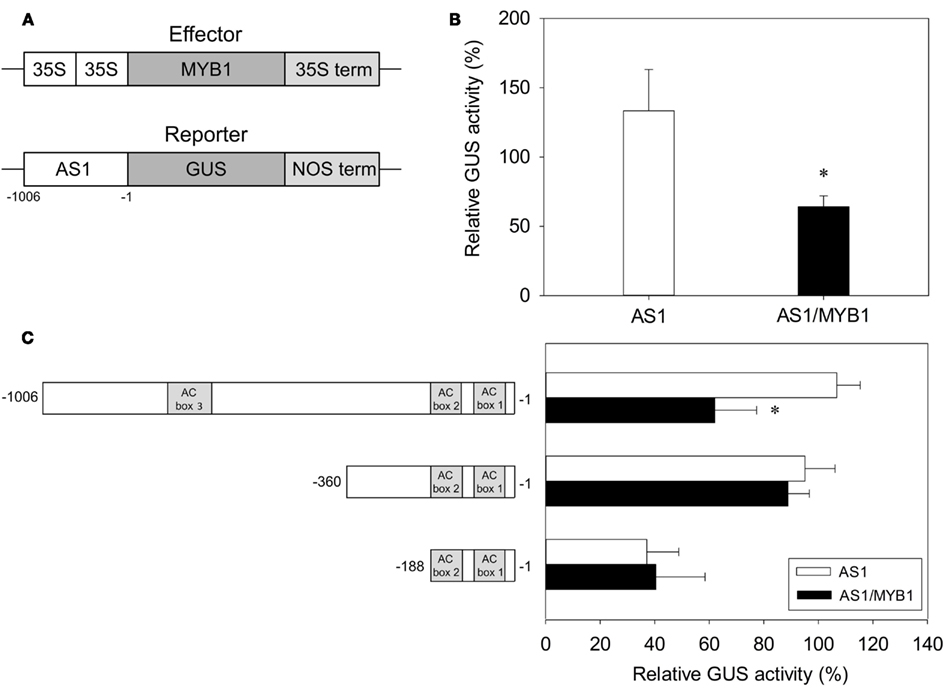
Figure 7. Transcriptional regulation of PpAS1 by the PtMYB1 transcription factor in pine cells. (A) Schematic representation of the effector and target constructs. (B) Transient expression assays were performed by co-transforming reporter (PpAS1pro:GUS) and effector (35Spro:PtMYB1) plasmids at a molar ratio of 1:1 into protoplasts from pine cotyledons. Relative GUS activity was expressed as percentage of the GUS activity compared with control construction (35Spro:GUS). Bars indicate the standard errors of six independent transfection experiments. (C) Identification of the regulatory region involved in the interaction of PpAS1 promoter/PtMYB1 by deletion analysis. The structure of PpAS1 promoter deletion constructs is shown in the schematic diagram to the left of the graph. A Student’s t-test was performed to test the significance (P ≤ 0.01) of the differences between AS1 and AS1/MYB1 samples. Significant changes are indicated with an asterisk.
The interaction between PtMYB1 and the PpAS1 promoter was further investigated using several deletions of the promoter region (Figure 7C). The negative regulation mediated by PtMYB1 was abolished when the distal portion of the PpAS1 promoter was deleted. Interestingly, this deleted region contains the ACbox3, which is a PtMYB1 target sequence in the PpAS1 promoter (Figure 6).
Discussion
In angiosperms, asparagine synthetase (AS) is encoded by a small family of genes, usually two or three members per species. Whatever their number, plant AS genes have been phylogenetically grouped into two major classes: class I and class II (Gaufichon et al., 2010). In all angiosperms whose genomes have been completely sequenced, such as A. thaliana, P. trichocarpa, and Z. mays, there is at least one representative of each class. However, the data presented here support the existence of two AS genes in conifers, both of which are regarded as class II. This classification of the conifer genes is entirely consistent with the phylogenetic analysis carried out recently by Gaufichon et al. (2010). The phylogenetic classification of the conifer AS genes suggests that class II genes are more closely related to the ancestral AS gene, while class I genes emerged later during the evolution of angiosperms, prior to the separation between monocots and dicots. Because the pine genome has not yet been fully sequenced, we cannot rule out the presence of another AS gene(s) in the conifer genomes. However, this seems unlikely given that we could not identify more than two AS genes in the extensive collections of conifers ESTs in GenBank.
The comparative study of maritime pine AS genes indicated that PpAS1 and PpAS2 have distinct patterns of gene expression, suggesting that they encode for AS isoforms with different roles in asparagine biosynthesis. PpAS1 expression is highly regulated during development and restricted mainly to the first weeks after seed germination, when pine seedlings need robust asparagine synthesis activity in the hypocotyl to reallocate the mobilized nitrogen stored in the seed megagametophytes (Cánovas et al., 2007). Environmental factors, especially those related to stress, also regulate the expression of AS in plants (Olea et al., 2004; Herrera-Rodríguez et al., 2007). Here, both drought and continuous darkness dramatically increased PpAS1 transcript levels, as did treatment with high nitrogen levels (either nitrate or ammonium). These results suggest that PpAS1 expression is critical when a high rate of nitrogen assimilation and/or remobilization is required. Furthermore, the localization of AS protein in the vascular bundles also suggest a role of the enzyme in nitrogen transport as previously reported in rice and tomato (Nakano et al., 2000; Olea et al., 2004).
While PpAS1 is mainly expressed at early stages of development, the expression of PpAS2 remains constant at very different stages of development, suggesting that this gene may be involved in the production of asparagine for basal metabolism. The expression pattern of PpAS2 was similar to the recently reported ubiquitous expression of the PvAS3 gene in common bean (Parra-Peralbo et al., 2009) and ZmAS1 in maize (Cañas et al., 2009). So far, no AS gene has been reported as ubiquitously expressed in Arabidopsis. However, available microarray data indicate that ASN3 transcript levels are stable in a variety of different developmental and environmental situations. In addition, based on the information present in the database of gene expression correlation ATTED-II (Obayashi et al., 2009), ASN3 expression correlates closely with numerous ribosomal proteins and genes related to protein synthesis. It seems likely, therefore, that plants require an AS isoform that is specific to the production of asparagine for protein synthesis, and PpAS2, PvAS3, ZmAS1, and AtASN3 appear to play this role in the maritime pine, common bean, maize, and Arabidopsis, respectively.
Here, we have shown that the PpAS1 and PpAS2 genes have very different expression profiles, and it is likely that there is a high degree of specialization within this small gene family in conifers. Functional specialization of related genes is a common feature in plants and has already been reported for other nitrogen metabolism genes, for example members of the glutamine synthetase gene family (Bernard and Habash, 2009; Castro-Rodríguez et al., 2011). This specialization is also evident in the Arabidopsis ASN1 and ASN2 genes, which are reciprocally regulated; the first is induced by darkness and during seed development, while the second is induced by light and is repressed during seed development (Wong et al., 2004; Katari et al., 2010).
The specific response of PpAS1 to several environmental factors together with the restriction of its expression pattern to specific developmental stages, suggests that this gene is under strong and complex transcriptional regulation. Recently, it has been reported that genes subjected to rapid and variable regulation contain distinct types of core promoters (López-Maury et al., 2008). Therefore, we decided to isolate and characterize the PpAS1 gene promoter to explore the mechanisms that may underpin its transcriptional regulation. The in silico analysis of this sequence revealed the presence of several cis-regulatory elements involved in the regulation by sugars, the Amy, and G boxes. Sugar repression is a common feature of AS genes in plants, and the regulatory elements that mediate this repression appear to be evolutionarily conserved (Winichayakul et al., 2004). The fact that PpAS1 mRNA levels increase in plants adapted to darkness, a situation in which sugar levels are low, together with the presence of conserved cis-elements involved in sugar repression in the promoter region, suggest that the pine PpAS1 gene may be also regulated by sugar availability.
The PpAS1 promoter region also contained another group of cis-elements, AC boxes, which are putative targets for the binding of R2–R3 MYB transcription factors. Gómez-Maldonado et al. (2004b) previously reported that PtMYB1 and PtMYB4 transcription factors are able to interact in vitro with the promoter of a GS gene that activates gene expression in vivo and they proposed that MYB proteins could act as transcriptional regulators of this key gene in nitrogen metabolism. AS catalyzes a glutamine-dependent chemical reaction, so there is a metabolic relationship between GS and AS enzymes. These observations led us to investigate whether MYB transcription factors could play a role in the transcriptional regulation of PpAS1. Our results indicate that PtMYB1 is able to bind the PpAS1 promoter in vitro and that this interaction has a repressor effect on PpAS1 transcription in pine cells. Although the functional significance of this interaction should be studied further using other approaches, such as gene silencing, the fact that PtMYB1, PpAS1, and GS1b are mainly localized to cells in the vascular bundles (Avila et al., 2001; Gómez-Maldonado et al., 2004b; Cañas et al., 2006; this work) is consistent with the proposal that these genes may be co-regulated in pine. The work of van Heerden et al. (1996) suggested plants must recycle the ammonium produced during the lignin biosynthesis through the GS/GOGAT cycle to maintain the active biosynthesis of phenylpropanoids. Down-regulation of AS expression in lignified cells may be important to prevent the collapse of lignin biosynthesis during wood formation, because active synthesis of asparagine would divert the ammonium assimilated by the GS/GOGAT pathway, which needs to be directed toward arogenate synthesis to maintain the biosynthesis of aromatic amino acids.
To our knowledge, this is the first work reporting an interaction between MYB transcription factors and the regulatory region of an AS gene. However, the regulation of AS by MYB factors may also occur in other plants. In fact, there are many putative MYB binding sites in the promoter region of the ASN1 gene3, so it is possible that the MYB family of transcription factors could contribute to the transcriptional regulation of asparagine biosynthesis in Arabidopsis. AtMYB43, 20, and 42 are the closest homologs of PtMYB1 in Arabidopsis (Patzlaff et al., 2003). However, it is not possible to establish a clear functional correspondence between transcription factors in gymnosperms and angiosperms because these groups of plants diverged more than 300 million years ago. R2–R3 MYB families include hundreds of members in angiosperms (Feller et al., 2011). In contrast, the number of MYB transcription factors in pine databases is considerably lower than the average number reported in angiosperms. Furthermore, it appears that the total number of transcription factors is lower in conifers than in angiosperms for most of the families (Cánovas et al., unpublished data).
In summary, we have characterized two AS genes in the maritime pine, PpAS1 and PpAS2, that exhibit differential expression patterns during development and in response to environmental factors. PpAS1 expression is regulated during development and by environmental factors such as light/dark transitions and changes in the nitrogen source or water availability, whereas PpAS2 is constitutively expressed at similar levels in pine seedlings and adult trees regardless of the environmental conditions. Therefore, we propose that PpAS2 may be involved in the supply of asparagine for basal metabolism under non-stress conditions. In contrast, PpAS1 expression is strongly regulated by these factors, indicating that it may be specialized for supplying asparagine in situations that produce a high metabolic demand for this amino acid. Therefore, these AS genes likely have complementary and essential roles in maritime pine nitrogen metabolism. We also provide the first evidence that PpAS1 transcription regulation may be regulated by MYB transcription factors. Future research will be needed to clarify the importance of MYB proteins and other transcription factors in the regulation of asparagine biosynthesis in conifers.
Conflict of Interest Statement
The authors declare that the research was conducted in the absence of any commercial or financial relationships that could be construed as a potential conflict of interest.
Acknowledgments
This work was supported by a grant from the Spanish Ministry of Science and Innovation (BIO2009-07490) and by research funds from the Junta de Andalucía (research group BIO-114). We thank Remedios Crespillo for excellent technical assistance. We also thank Dr. Rafael Cañas and Dr. Francisco R. Cantón for providing us a partial sequence of the Scots pine AS1 promoter and for critical reading of the manuscript.
Footnotes
References
Anisimova, M., and Gascuel, O. (2006). Approximate likelihood-ratio test for branches: a fast, accurate, and powerful alternative. Syst. Biol. 55, 539–552.
Avila, C., Suárez, M. F., Gómez-Maldonado, J., and Cánovas, F. M. (2001). Spatial and temporal expression of two cytosolic glutamine synthetase genes in Scots pine: functional implications on nitrogen metabolism during early stages of conifer development. Plant J. 25, 93–102.
Bernard, S. M., and Habash, D. Z. (2009). The importance of cytosolic glutamine synthetase in nitrogen assimilation and recycling. New Phytol. 182, 608–620.
Boggy, G. J., and Woolf, P. J. (2010). A mechanistic model of PCR for accurate quantification of quantitative PCR data. PLoS ONE 5, e12355. doi:10.1371/journal.pone.0012355
Bomal, C., Bedon, F., Caron, S., Mansfield, S. D., Levasseur, C., Cooke, J. E., Blais, S., Tremblay, L., Morency, M. J., Pavy, N., Grima-Pettenati, J., Séguin, A., and Mackay, J. (2008). Involvement of Pinus taeda MYB1 and MYB8 in phenylpropanoid metabolism and secondary cell wall biogenesis: a comparative in planta analysis. J. Exp. Bot. 59, 3925–3939.
Canales, J., Avila, C., and Cánovas, F. M. (2011a). A maritime pine antimicrobial peptide involved in ammonium nutrition. Plant Cell Environ. 34, 1443–1453.
Canales, J., Avila, C., Pacheco-Villalobos, D., Díaz-Moreno, S., Molina-Rueda, J. J., Ariza, D., Navarro-Cerrillo, R., Cantón, F. R., Claros, M. G., and Cánovas, F. M. (2011b). Gene expression profiling in the stem of young maritime pine trees: detection of ammonium stress-responsive genes in the apex. Trees Struct. Funct. 26, 609–619.
Canales, J., Flores-Monterrosso, A., Rueda-López, M., Avila, C., and Cánovas, F. M. (2010). Identification of genes regulated by ammonium availability in the roots of maritime pine trees. Amino Acids 39, 991–1001.
Cañas, R. A., de la Torre, F., Cánovas, F. M., and Cantón, F. R. (2006). High levels of asparagine synthetase in hypocotyls of pine seedlings suggest a role of the enzyme in re-allocation of seed-stored nitrogen. Planta 224, 83–95.
Cañas, R. A., Quilleré, I., Christ, A., and Hirel, B. (2009). Nitrogen metabolism in the developing ear of maize (Zea mays): analysis of two lines contrasting in their mode of nitrogen management. New Phytol. 184, 340–352.
Cánovas, F. M., Avila, C., Cantón, F. R., Cañas, R. A., and de la Torre, F. (2007). Ammonium assimilation and amino acid metabolism in conifers. J. Exp. Bot. 58, 2307–2318.
Cánovas, F. M., Cantón, F. R., García-Gutiérrez, A., Crespillo, R., and Gallardo, F. (1998). Molecular physiology of glutamine and glutamate biosynthesis in developing conifer seedlings. Physiol. Plant. 103, 287–294.
Cantón, F. R., García-Gutiérrez, A., Crespillo, R., and Cánovas, F. M. (1996). High-level expression of Pinus sylvestris glutamine synthetase in Escherichia coli. Production of polyclonal antibodies against the recombinant protein and expression studies in pine seedlings. FEBS Lett. 393, 205–210.
Cantón, F. R., Suárez, M. F., and Cánovas, F. M. (2005). Molecular aspects of nitrogen mobilisation and recycling in tres. Photosyn. Res. 83, 265–278.
Castro-Rodríguez, V., García-Gutiérrez, A., Canales, J., Avila, C., Kirby, E. G., and Cánovas, F. M. (2011). The glutamine synthetase gene family in Populus. BMC Plant Biol. 11, 119.
Chang, W. C., Lee, T. Y., Huang, H. D., Huang, H. Y., and Pan, R. L. (2008). PlantPAN: plant promoter analysis navigator, for identifying combinatorial cis-regulatory elements with distance constraint in plant gene groups. BMC Genomics 9, 561. doi:10.1186/1471-2164-9-561
Chevalier, C., Borgeois, E., Just, D., and Raymond, P. (1996). Metabolic regulation of asparagine synthetase gene expression in maize (Zea mays L.) root tips. Plant J. 9, 1–11.
Doyle, J. J., and Doyle, J. L. (1987). A rapid DNA isolation procedure for small quantities of fresh leaf tissue. Phytochem. Bull. 19, 11–15.
Feller, A., Machemer, K., Braun, E. L., and Grotewold, E. (2011). Evolutionary and comparative analysis of MYB and bHLH plant transcription factors. Plant J. 66, 94–116.
Fernández-Pozo, N., Canales, J., Guerrero-Fernández, D., Villalobos, D. P., Díaz-Moreno, S. M., Bautista, R., Flores-Monterrosso, A., Guevara, M. A., Perdiguero, P., Collada, C., Cervera, M. T., Ordás, R., Cantón, F. R., Avila, C., Cánovas, F. M., and Claros, M. G. (2011). EuroPineDB: a high-coverage web database for maritime pine transcriptome. BMC Genomics 12, 366. doi:10.1186/1471-2164-12-366
Gaufichon, L., Reisdorf-Cren, M., Rothstein, S. J., Chardon, F., and Suzuki, A. (2010). Biological functions of asparagine synthetase in plants. Plant Sci. 179, 141–153.
Gómez-Maldonado, J., Cánovas, F. M., and Avila, C. (2004a). Molecular analysis of the 5′-upstream region of a gibberellin-inducible cytosolic glutamine synthetase gene (GS1b) expressed in pine vascular tissue. Planta 218, 1036–1045.
Gómez-Maldonado, J., Avila, C., de la Torre, F., Cañas, R., Cánovas, F. M., and Campbell, M. M. (2004b). Functional interactions between a glutamine synthetase promoter and MYB proteins. Plant J. 39, 513–526.
Gómez-Maldonado, J., Crespillo, R., Avila, C., and Cánovas, F. M. (2001). Efficient preparation of maritime pine (Pinus pinaster) protoplasts suitable for transgene expression analysis. Plant Mol. Biol. Rep. 19, 361–366.
Gouy, M., Guindon, S., and Gascuel, O. (2010). SeaView version 4: a multiplatform graphical user interface for sequence alignment and phylogenetic tree building. Mol. Biol. Evol. 27, 221–224.
Hanson, J., Hanssen, M., Wiese, A., Hendriks, M. M., and Smeekens, S. (2008). The sucrose regulated transcription factor bZIP11 affects amino acid metabolism by regulating the expression of ASPARAGINE SYNTHETASE1 and PROLINE DEHYDROGENASE2. Plant J. 53, 935–949.
Herrera-Rodríguez, M. B., Pérez-Vicente, R., and Maldonado, J. M. (2007). Expression of asparagine synthetase genes in sunflower (Helianthus annuus) under various environmental stresses. Plant Physiol. Biochem. 45, 33–38.
Jefferson, R. A., Kavanagh, T. A., and Bevan, M. W. (1987). GUS fusions: beta-glucuronidase as a sensitive and versatile gene fusion marker in higher plants. EMBO J. 6, 3901–3907.
Katari, M. S., Nowicki, S. D., Aceituno, F. F., Nero, D., Kelfer, J., Thompson, L. P., Cabello, J. M., Davidson, R. S., Goldberg, A. P., Shasha, D. E., Coruzzi, G. M., and Gutiérrez, R. A. (2010). VirtualPlant: a software platform to support systems biology research. Plant Physiol. 152, 500–515.
Lam, H. M., Hsieh, M. H., and Coruzzi, G. (1998). Reciprocal regulation of distinct asparagine synthetase genes by light and metabolites in Arabidopsis thaliana. Plant J. 16, 345–353.
Lea, P. J., Sodek, L., Parry, M. A. J., Shewry, P. R., and Halford, N. G. (2007). Asparagine in plants. Ann. Appl. Biol. 150, 1–26.
Liao, Z., Chen, M., Guo, L., Gong, Y., Tang, F., Sun, X., and Tang, K. (2004). Rapid isolation of high-quality total RNA from taxus and ginkgo. Prep. Biochem. Biotechnol. 34, 209–214.
López-Maury, L., Marguerat, S., and Bähler, J. (2008). Tuning gene expression to changing environments: from rapid responses to evolutionary adaptation. Nat. Rev. Genet. 9, 583–593.
Nakano, K., Suzuki, T., Hayakawa, T., and Yamaya, T. (2000). Organ and cellular localization of asparagine synthetase in rice plants. Plant Cell Physiol. 41, 874–880.
Notredame, C., Higgins, D. G., and Heringa, J. (2000). T-Coffee: a novel method for fast and accurate multiple sequence alignment. J. Mol. Biol. 302, 205–217.
Obayashi, T., Hayashi, S., Saeki, M., Ohta, H., and Kinoshita, K. (2009). ATTED-II provides coexpressed gene networks for Arabidopsis. Nucleic Acids Res. 37, D987–D991.
Olea, F., Pérez-García, A., Canton, F. R., Rivera, M. E., Cañas, R., Avila, C., Cazorla, F. M., Cánovas, F. M., and de Vicente, A. (2004). Up-regulation and localization of asparagine synthetase in tomato leaves infected by the bacterial pathogen Pseudomonas syringae. Plant Cell Physiol. 45, 770–780.
Parra-Peralbo, E., Pineda, M., and Aguilar, M. (2009). PVAS3, a class-II ubiquitous asparagine synthetase from the common bean (Phaseolus vulgaris). Mol. Biol. Rep. 36, 2249–2258.
Patzlaff, A., Newman, L. J., Dubos, C., Whetten, R. W., Smith, C., McInnis, S., Bevan, M. W., Sederoff, R. R., and Campbell, M. M. (2003). Characterisation of PtMYB1, an R2R3-MYB from pine xylem. Plant Mol. Biol. 53, 597–608.
Ralph, S. G., Chun, H. J., Kolosova, N., Cooper, D., Oddy, C., Ritland, C. E., Kirkpatrick, R., Moore, R., Barber, S., Holt, R. A., Jones, S. J., Marra, M. A., Douglas, C. J., Ritland, K., and Bohlmann, J. (2008). A conifer genomics resource of 200,000 spruce (Picea spp.) ESTs and 6,464 high-quality, sequence-finished full-length cDNAs for Sitka spruce (Picea sitchensis). BMC Genomics 9, 484. doi:10.1186/1471-2164-9-484
Ritz, C., and Spiess, A. N. (2008). qpcR: an R package for sigmoidal model selection in quantitative real-time polymerase chain reaction analysis. Bioinformatics 24, 1549–1551.
Ufaz, S., Shukla, V., Soloveichik, Y., Golan, Y., Breuer, F., Koncz, Z., Galili, G., Koncz, C., and Zilberstein, A. (2011). Transcriptional control of aspartate kinase expression during darkness and sugar depletion in Arabidopsis: involvement of bZIP transcription factors. Planta 233, 1025–1040.
van Heerden, P. S., Towers, G. H., and Lewis, N. G. (1996). Nitrogen metabolism in lignifying Pinus taeda cell cultures. J. Biol. Chem. 271, 12350–12355.
Waterhouse, A. M., Procter, J. B., Martin, D. M., Clamp, M., and Barton, G. J. (2009). Jalview Version 2-a multiple sequence alignment editor and analysis workbench. Bioinformatics 25, 1189–1191.
Winichayakul, S., Moyle, R. L., Coupe, S. A., Davies, K. M., and Farnden, K. J. F. (2004). Analysis of the asparagus (Asparagus officinalis) asparagine synthetase gene promoter identifies evolutionarily conserved cis-regulatory elements that mediate Suc-repression. Funct. Plant Biol. 31, 63–72.
Wong, H. K., Chan, H. K., Coruzzi, G. M., and Lam, H. M. (2004). Correlation of ASN2 gene expression with ammonium metabolism in Arabidopsis. Plant Physiol. 134, 332–338.
Appendix
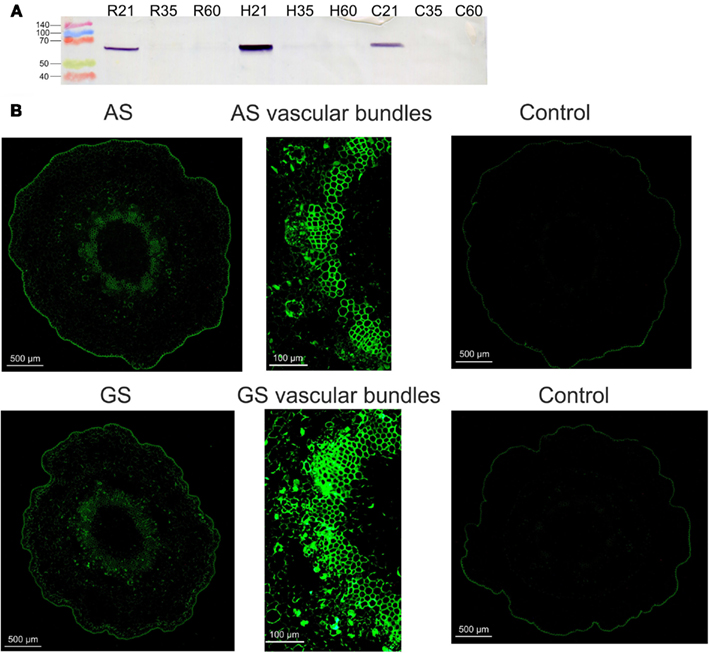
Figure A1. Immunodetection of AS protein in maritime pine seedlings. (A) Western blot analysis of protein extracts from roots (R21, R35, and R60), hypocotyls (H21, H35, and H60), and cotyledons (C21, C35, and C60). The numbers indicate days after inhibition. Protein molecular markers were loaded on the left. (B) Immunohistochemical localization. Sections of hypocotyls were probed with AS (Cañas et al., 2006) and GS (Cantón et al., 1996) antibodies. Control sections were processed in parallel in the absence of immunoprobes.
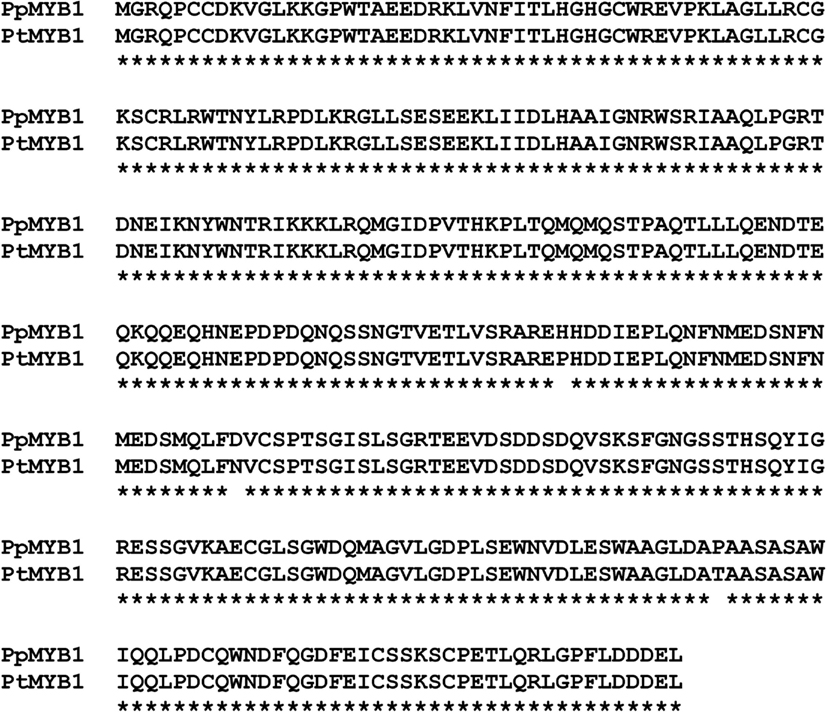
Figure A2. Alignment of the deduced amino acid sequences of PtMYB1 and PpMYB1 full-length cDNAs. PtMYB1 (AY356372); PpMYB1 (EU487890). Identical residues are marked with an asterisk.
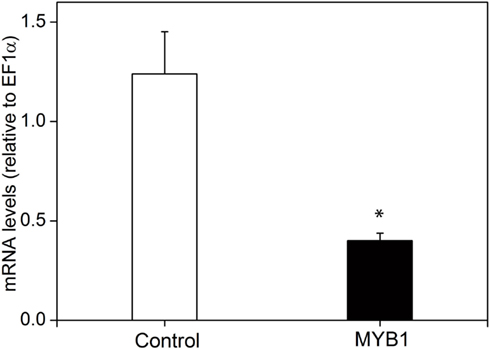
Figure A3. Expression analysis of PpAS1 in maritime pine protoplasts. Internal levels of PpAS1 were determined by real-time qPCR in electroporated protoplasts in the absence or the presence of the effector construct containing PtMYB1. See the legend of Figure 7 for further details. Bars indicate the standard errors of three independent experiments. A Student’s t-test was performed to determine the significance (P < 0.01) of the observed differences. The significant change is marked with an asterisk.
Keywords: conifers, Pinus pinaster, nitrogen metabolism, asparagine synthetase, MYB factors
Citation: Canales J, Rueda-López M, Craven-Bartle B, Avila C and Cánovas FM (2012) Novel insights into regulation of asparagine synthetase in conifers. Front. Plant Sci. 3:100. doi: 10.3389/fpls.2012.00100
Received: 14 February 2012; Accepted: 27 April 2012;
Published online: 24 May 2012.
Edited by:
Hideki Takahashi, Michigan State University, USAReviewed by:
Masami Yokota Hirai, RIKEN Plant Science Center, JapanDimah Habash, Securewheat Consultancy, UK
Copyright: © 2012 Canales, Rueda-López, Craven-Bartle, Avila and Cánovas. This is an open-access article distributed under the terms of the Creative Commons Attribution Non Commercial License, which permits noncommercial use, distribution, and reproduction in other forums, provided the original authors and source are credited.
*Correspondence: Francisco M. Cánovas, Departamento de Biología Molecular y Bioquímica, Facultad de Ciencias, Universidad de Málaga, Campus Universitario de Teatinos s/n, E-29071 Málaga, Spain. e-mail: canovas@uma.es