 Moreno Colaiacovo† Letizia Bernardo† Isabella Centomani Cristina Crosatti Lorenzo Giusti Luigi Orrù Gianni Tacconi Antonella Lamontanara Luigi Cattivelli Primetta Faccioli*
- CRA Genomics Research Centre, Fiorenzuola d’Arda, Italy,
MicroRNAs (miRNAs) are short non-coding RNA molecules produced from hairpin structures and involved in gene expression regulation with major roles in plant development and stress response. Although each annotated miRNA in miRBase (www.mirbase.org) is a single defined sequence with no further details on possible variable sequence length, isomiRs – namely the population of variants of miRNAs coming from the same precursors – have been identified in several species and could represent a way of broadening the regulatory network of the cell. Next-gen-based sequencing makes it possible to comprehensively and accurately assess the entire miRNA repertoire including isomiRs. The aim of this work was to survey the complexity of the peach miRNome by carrying out Illumina high-throughput sequencing of miRNAs in three replicates of five biological samples arising from a set of different peach organs and/or phenological stages. Three hundred-ninety-two isomiRs (miRNA and miRNA*-related) corresponding to 26 putative miRNA coding loci, have been highlighted by mirDeep-P and analyzed. The presence of the same isomiRs in different biological replicates of a sample and in different tissues demonstrates that the generation of most of the detected isomiRs is not random. The degree of mature sequence heterogeneity is very different for each individual locus. Results obtained in the present work can thus contribute to a deeper view of the miRNome complexity and to better explore the mechanism of action of these tiny regulators.
Introduction
MicroRNAs (miRNAs) are short non-coding RNA molecules produced from hairpin structures and involved in gene expression regulation with major roles in plant development and stress response. MiRNAs are transcribed into a primary transcript which folds into a bulge with stem-loop conformation that is then cleaved by a Dicer-like (DCL) RNase III enzyme named DCL1. The cleavage results in a short duplex: one of the two strands forming the duplex and designated as miRNA* is then typically degraded while the other strand is incorporated into the RNA-induced silencing (RISC) complex where it mediates mRNA recognition and cleavage or translational repression (Jones-Rhoades et al., 2006; Voinnet, 2009; Xie et al., 2010).
Although each annotated miRNA in miRBase1 is a single defined sequence with no further details on possible variable sequence length, isomiRs – namely the population of variants of miRNAs coming from the same precursors – have been identified in several species and could represent a way of broadening the cell regulatory network (Ebhardt et al., 2009; Guo and Lu, 2010).
Vaucheret (2009) demonstrated the biological significance of mature miRNA length heterogeneity in Arabidopsis where the ath-miR168 can be processed as two different miRNA isoforms of 21 nt and 22 nt in length with different activities on AGO1 homeostasis (AGO1 is the Argonaute1 protein, a component of RISC complex that catalyzes broad miRNA- and siRNA-guided mRNA cleavage and translation repression Voinnet, 2009).
Alteration in miRNA end sequences can have strong effects on miRNA function due to the fact that the identity of the first 5′ nucleotide is the major determinant for AGO protein association (Takeda et al., 2008). As an example, Mi et al. (2008) found that AGO1 (which predominates in the miRNAs-mediated pathway) harbors miRNAs that favor a 5′ terminal uridine. A change at the 5′ terminal nucleotide of a miRNA predictably redirected it into a different AGO complex and altered its biological activity. Additionally, it was reported that the thermodynamic stability at the 5′ end of the strand is likely to affect the loading in the AGO complex (Eamens et al., 2009).
An accurate profile of the entire miRNA population of a biological sample provides useful information on miRNA activity and it can be used to compare the distribution of miRNA sequence variants in different samples. In fact, although the distribution of isomiRs across samples has been previously shown to be generally similar, examples in which the dominant isomiR is different from sample to sample have been found in animals (Lee et al., 2012) and could imply a functional role for specific isomiR sequences, besides affecting the accuracy and consistency of miRNA measurement.
This work aims to survey, by carrying out Illumina high-throughput sequencing, the complexity of peach miRNome through the analysis of the miRNA population of a set of samples representative of different tissues and developmental stages.
Materials and Methods
Plant Material and RNA Extraction
A 12-year-old tree grafted on wild seedling of the yellow-fleshed cv. Maycrest (Prunus persica (L.) Batsch), grown in Palazzolo di Sona, Verona, Italy (45.457°N, 10.822°E), was used as plant source material. Each sample was collected pooling together material from three different branches of the same plant. Four phenological stages (Chapman and Catlin, 1976) were considered: swollen bud, half-inch green, pink, bloom. Leaf and flower swollen buds were collected 41 days before flowering (DBF), half-inch leaves were collected 21 DBF, pink flower buds were collected six DBF. Codes were assigned to each samples: BF, pink; F, bloom; GF, swollen flower bud; O, half-inch green; GL, swollen leaf bud. Tissues were frozen in liquid nitrogen immediately after drawing. Total RNA was extracted from three independent samples with the Plant Total RNA Purification Kit (NORGEN Biotek Corp., Thorold, ON, Canada) following manufacturer instructions. RNA quality and concentration were evaluated with the Agilent 2100 Bioanalyzer RNA 6000 Nano assay (Agilent Technologies, Santa Clara, CA, USA).
Small RNA Libraries Construction and Sequencing
Preparation of small RNA libraries was performed with the TruSeq Small RNA Sample Prep Kit (Illumina, San Diego, CA, USA) following manufacturer instructions. Briefly, 1 μg of total RNA was ligated with adapters at 3′ and 5′ ends, without any size fractionation. Adapter-ligated RNA was reverse-transcribed with SuperScript II Reverse Transcriptase (Invitrogen, Carlsbad, CA, USA), then PCR-amplified (15 cycles). Samples were barcoded using 15 variants of the reverse primer provided with the kit. Libraries were pooled together and then purified on a 6% TBE PAGE gel after electrophoresis. Libraries quality and concentration were evaluated with the Agilent 2100 Bioanalyzer DNA 1000 assay. The obtained cDNAs were sequenced using the Illumina Genome Analyzer IIx.
Data Analysis
Reads were filtered with UEA sRNA plant toolkit2 (Moxon et al., 2008) to remove adaptor sequences, reads shorter than 18 nt or longer than 24, low-complexity reads, reads matching rRNAs or tRNAs and reads that did not match the peach genomic sequence available at “The International Peach Genome Initiative – www.rosaceae.org/peach/genome” (only those sequences with a full-length perfect match to the selected genome were retained). Reads from one replicate (randomly chosen) of each biological sample were then analyzed with the software miRDeep-P (Yang and Li, 2011, default parameters) to identify miRNA loci expressed in all the five tested samples (GF, GL, B, F, O). Reads associated to these loci were then also screened in the remaining two replicates.
Read counts for each variant were divided by the total number of reads with a match in the peach genome in each sample and normalized to 1,000,000 reads. Reads that could be related to more than one locus were assigned by MiRDeep-P to all possible involved loci.
IsomiRs for each putative locus were blasted against miRBase (release 18) to search for the loci related to previously known miRNAs (Kozomara and Griffith-Jones, 2011). Blast vs. mature sequences was based on the following parameters: outfmt 6, task blastn, dust “no,” e-value 10, word_size 7, reward 2, num_alignments 10. Blast vs. precursor sequences was based on the following parameters: outfmt 6, task blastn, dust “no,” e-value 10e−3, num_alignments 10.
The correlation between biological replicates was evaluated by calculating the Pearson coefficient for all the possible pairs of replicates belonging to the same biological sample, as well as samples from different tissues for sake of comparison. We decided to remove from the set a sequence (HE860285) whose expression level was abnormally high, because its presence caused the Pearson correlation to be almost one in every comparison, irrespective of the tissue.
To identify miRNAs isomiRs that were differentially expressed among the biological samples, a t-test was performed for all the possible comparisons. An isomiR was considered as differentially expressed in a specific comparison if its p-value was less than 0.05. The whole set of reads associated with the miRNA loci was then used to perform a hierarchical clustering with R software, by applying the Canberra metric to calculate the distances between the expression vectors of the samples across the reads.
MiRNA target identification was carried out by psRNATarget3 (Dai and Zhao, 2011), with default parameters. To score the complementarity between small RNA and their target transcript, psRNATarget applies the scoring schema of miRU by Zhang (2005). The maximum expectation is the threshold of the score. A small RNA/target site pair will be discarded if its score is greater than the threshold. The default cut-off threshold is 3.0.
The accessibility of the mRNA target site to small RNA has been identified as one of the important factors involved in target recognition because the secondary structure (stem, etc.) around the target site will prevent the small RNA and mRNA target from contacting. The psRNATarget server employes RNAup to calculate target accessibility, which is represented by the energy required to open (unpair) secondary structure around the target site (usually the complementary region with small RNA and up/downstream) on target mRNA. The lower the energy the higher the possibility that small RNA is able to contact (and cleave) target mRNA. PsRNATarget uses a software, namely RNAup, described by Mückstein et al. (2006) to calculate this value, denoted as UPE.
All the miRNA-related sequences were submitted to the EMBL database, whereas the sequencing raw reads were submitted to the NCBI SRA (BioProject accession: PRJNA167962).
Results
Sequencing Peach Small RNA Libraries
Illumina deep sequencing was used to profile the whole miRNA set of five different samples corresponding to different organs and/or phenological stages. Three replicates were analyzed for each sample. A total number of 40,764,330 sequence reads were obtained and filtered as reported in Section “Materials and Methods.” Details on the results of each filtering step are reported in Table 1. On average, 2,717,622 raw reads and 664,777 clean reads perfectly matching the genome were obtained in each of the 15 samples.
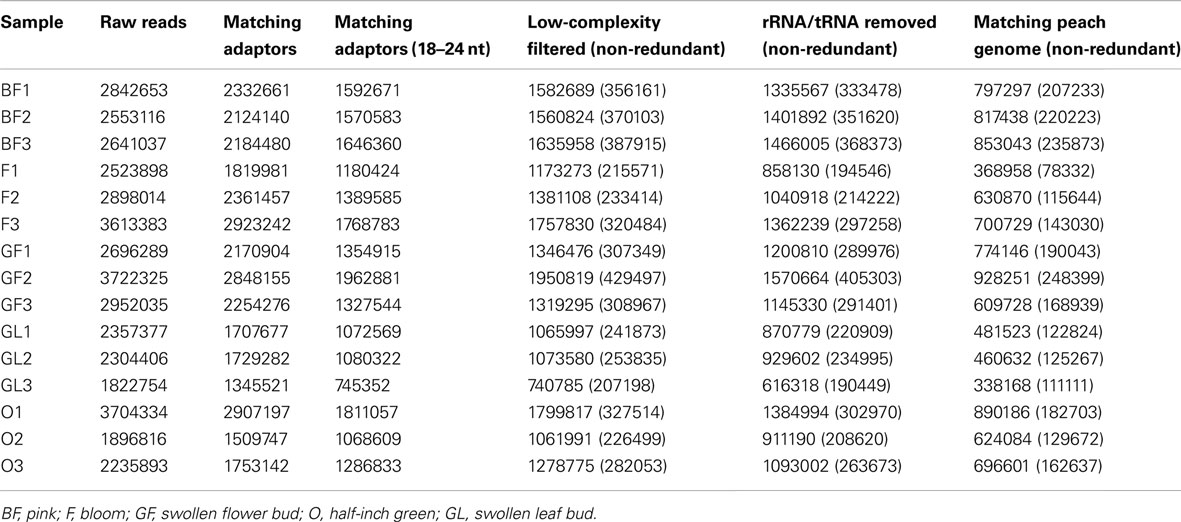
Table 1. Reports the number of filtered reads perfectly matching the peach genome in each of the tested samples.
One technical replicate (randomly chosen and numbered as “1”) of each sample was subsequently analyzed with miRDeeP-P which highlighted the putative miRNA coding loci of the peach genome expressed in the five tested samples (reported in Files S1–S5 in Supplementary Material and summarized in File S6 in Supplementary Material). Twenty-six putative miRNA coding loci were expressed in all samples according to miRDeep-P results. The length of the putative precursors was between 41 nt and 227 nt (average length of 104 nt), while average mature miRNAs size was 22 nt.
These 26 miRNAs were selected and, for each of them, the corresponding associated reads were searched in all the replicates of each sample. The results (miRNAs and miRNAs* associated reads) are reported in Table 2 for each locus, the link between locus name and locus position can be found in File S7 in Supplementary Material and retrieved at www.rosaceae.org/peach/genome.
IsomiRs Identification and Analysis
IsomiRs at each locus were blasted against miRBase. In some cases no mismatches were reported with the conserved sequences present in miRBase (e.g., miR403, miR394, miR166, miR156) while in some others mismatches were present and related to differences in the sequence and/or in its length. Detailed blast results are reported in File S8 in Supplementary Material which reports blast results based both on mature sequences (sheet “mature”) and precursor sequences (sheet “precursors”) deposited in miRBase. The file reports the matching sequence with the lowest e-value. When more than one matching sequence, belonging to different miRNA families, were found to have the same e-value all of them were reported.
Some miRNA families have more than one putative locus, therefore miRDeeP assigned common reads to all the possible loci. Both miRNA and miRNA*-related reads were identified at each locus. In some cases putative miRNAs* were identified on the basis of the alignment orientation (± with miRNA mature sequence deposited in miRBase) in some others the miRNA* sequences were already deposited in miRBase. The results of Table 2 highlight that some loci are characterized by a larger set of variants than others.
In the majority of the loci the most frequent read for a specific locus was the same in all the tested samples and across all the replicates of a sample (Table 2). Only in a few cases were some differences detected among samples or among replicates belonging to the same sample. Locus named 3_16 is particularly interesting because all the replicates of sample O have as the most frequent read the one corresponding to miRNA* (Table 2).
In some loci also the second most frequent read referred to the mature miRNA was the same in all the replicates of a sample and in all the samples. The second most frequent read was often obtained by a different cutting site at 5′ or 3′ ends. As reported above, miRNA*-related reads have also been identified by miRDeep-P for most of the 26 loci and length variability was detected for both 5′ and 3′ends.
Target analysis was carried out by psRNATarget. The whole set of targets identified is reported in File S9 in Supplementary Material.
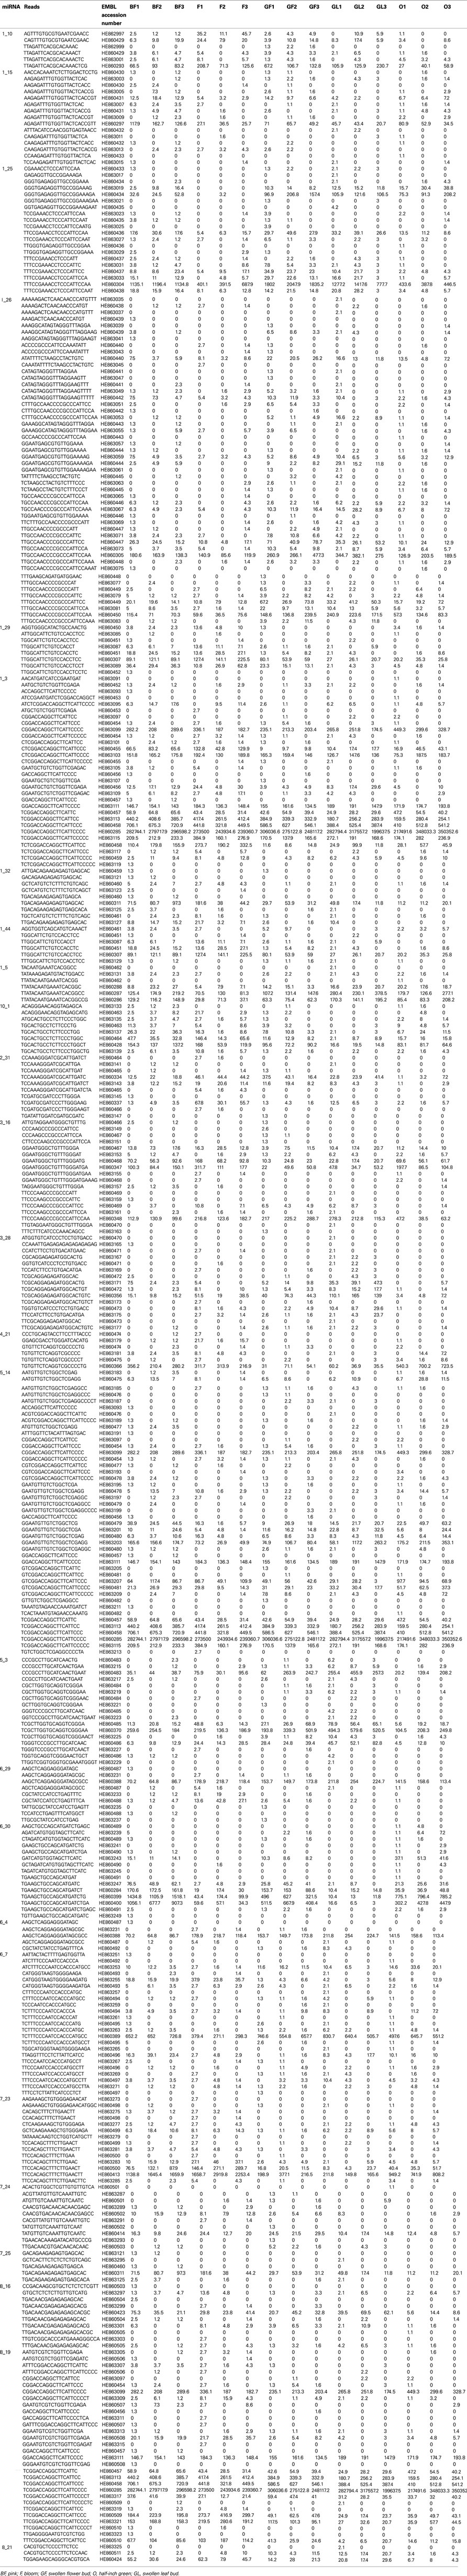
Table 2. Reports the read count (divided by the total number of reads with a perfect match to the peach genome and normalized to 1,000,000 reads) of 26 putative miRNA coding loci that were expressed in all the 15 samples according to miRDeep-P results.
Intra- and Inter-Samples Analysis
The average Pearson correlation between all the possible pairs of replicates belonging to the same biological sample was calculated, in order to evaluate whether it was in agreement with the “Standards, guidelines, and best practices for RNA-seq” adopted by ENCODE Consortium.4 Average correlation coefficients were equal to 0.98 for BF, 0.95 for F, 0.98 for GF, 0.95 for GL, and 0.97 for O. For the sake of completeness and in order to allow a comparison between related and unrelated samples, we also calculated the average Pearson correlation between samples of different tissues, which was equal to 0.66 on the basis of the reads reported in Table 2. All the Pearson coefficients are reported in File S10 in Supplementary Material. Figure 1A reports the results obtained from clustering the five samples on the basis of all the reads frequencies (average frequencies of three replicates, reads included miRNA*-related reads; reads assigned by miRDeep-P to more than one locus were counted once) at the 26 loci analyzed. Additionally, a clustering analysis was performed by considering only the count of the most frequent read in each locus. The analysis included those loci where the most frequent read was the same in all the samples (16 different reads, Figure 1B). Figure A1 in Appendix reports clustering results obtained without averaging the three replicates of each sample. As it can be seen, replicates are always grouped correctly.
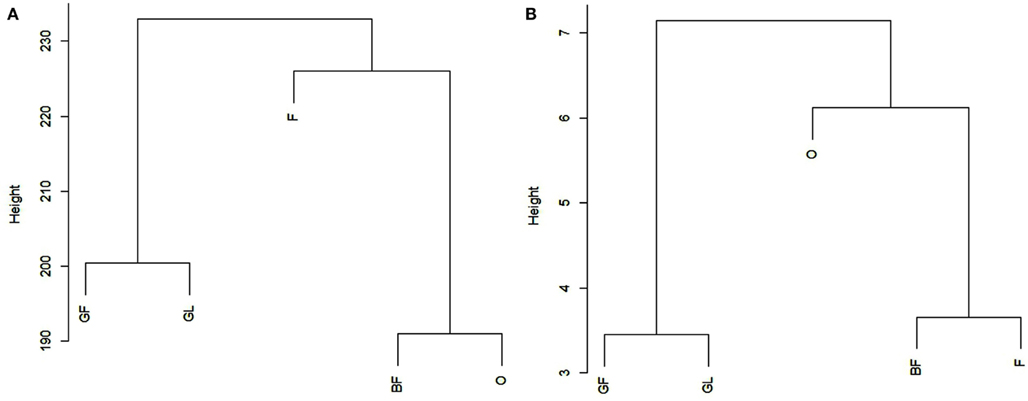
Figure 1. Reports the results obtained by cluster analysis of the five tissues on the basis of the frequencies of all the reads (A) or on the basis of the frequency of the most frequent read in each locus (B). For each tissue, the average frequency across the three replicates was considered (miRNA* -related reads are included). In (B), the analysis included only those loci where the most frequent read was the same in all the samples. BF, pink; F, bloom; GF, swollen flower bud; O, half-inch green; GL, swollen leaf bud.
A t-test was also performed for all the possible comparisons of biological samples (File S11 in Supplementary Material). The most frequent isomiR (highlighted in yellow in File S11 in Supplementary Material) is frequently the one able to distinguish the higher number of samples (e.g., locus 4_21, locus 6_4). Some miRNA-related reads are able to differentiate most of the analyzed samples: e.g., miR398 and miR167 got 8 significant comparisons out of 10.
Discussion
To assess the putative biological significance of isomiRs in peach, in the present study we carried out miRNAs profiling by sequencing three replicates of five biological samples arising from a set of different organs and/or phenological stages. Actually, variants of miRNAs are commonly found in deep sequencing experiments but their functional meaning and stability is still under investigation in plants.
Twenty-six miRNA putative loci expressed in all samples analyzed have been identified by miRdeep-P and analyzed for miRNA population heterogeneity. The average length of miRNA associated reads was included between 18 nt and 24 nt. Several previous works reported a miRNA length in plants included between 22 nt and 24 nt. The identification of miRNA* associated reads provides more evidence about reliability of the loci identified by miRDeep-P.
All the analyzed loci show miRNA length variants but tend to maintain the uridine at the 5′ end, in those cases where uridine is the first base of the most abundant isomiR. As reported above, uridine is the most frequent nucleotide in AGO1 association, perhaps explaining the drive to maintain it at the 5′ end. Ebhardt et al. (2009) reported examples of miRNA with 5′ deletions and 3′ uridine additions that create a different distribution in AGO complexes. As an example, ath-miR822 was determined to reside almost exclusively in the AGO1 complex while its modified variant with a U deletion at 5′ end and a UU addition at 3′end was found equally in AGO1 and AGO4 complexes.
The difference in read count between the first most frequent read and the second most frequent read varies among loci being in some cases minimal (e.g., locus 1_5) while in some others it is quite consistent (e.g., loci 4_21, 6_4). In some loci the second most frequent read was the same in all the replicates of a sample and in all the different samples. The presence of the same isomiRs in different biological replicates of a sample and in different tissues demonstrate that the generation of most of the detected isomiRs is not random. The importance of evaluating the correlation between biological replicates from RNA-seq experiments has been discussed previously in several papers (Oshlack et al., 2010; Hansen et al., 2011). As above reported, the correlation among biological replicates has been calculated to check the reliability of the experiment on the basis of the “Standards, guidelines, and best practices for RNA-seq” adopted by ENCODE Consortium which requires that the Pearson correlation of gene expression between two biological replicates for RNAs that are detected in both samples using RPKM or read counts should be between 0.92 and 0.98. Regarding the present work, the average Pearson correlation between all the possible pairs of replicates belonging to the same biological sample was greater than or equal to 0.95 for all the tested samples, in agreement with the required standards. Clustering results and t-test reported in Figure 1 and File S11 in Supplementary Material, respectively, show that it is possible to clearly distinguish among samples and to group them in a functional way. However, when considering Figure A1 in Appendix obtained without averaging replicates of each sample, it should be noted that clustering results seem to be more confident when only the most frequent read is taken into account: BF (pink) and F (bloom) are more strictly related being two subsequent phenological stages so it is expected to find a closer relationship between them.
The co-existence of different variants with a similar level of expression could imply a biological role for all of them. Locus 1_26 shows such an example: in this case there are two prevalent isomiRs (HE860305 and HE860450) that differ for one T at the 5′ end. For both the isomiRs there are then variants at the 3′ end with different lengths.
Target analysis carried out by psRNATarget (File S9 in Supplementary Material) revealed that in many cases isomiRs share the same target. However, because AGO invariably catalyzes the cleavage of targets opposite the bond between nucleotides 10 and 11 from the 5′ end of the miRNA, the cleavage products are different when there is a shift toward the 5′ end or nucleotide addition at the 5′ end of the miRNA mature sequence. Differences in cleavage sites among members of the same miRNA family have been recently studied in rice by Jeong et al. (2011) highlighting a different abundance of specific cleavage sites among plant organs.
A very interesting finding is related to the biological role of miRNA*. Despite the general consensus that miRNAs* have no regulatory activity, several recent publications have provided evidence about their biological function (Mah et al., 2010). In our results, isomiRs have been found also for miRNAs*. As an example, at locus 3_16 the conserved miRNA* has a high number of length variants, most due to a variable 3′end. Locus 3_16 codes for miR482: the miRNA* sequence deposited in miRBase was actually the most frequent read (HE860347) in all the three replicates of sample O (half-inch green) with an average ratio miRNA/miRNA* equal to 0.4. GF and GL showed an average ratio of miRNA/miRNA* equal to 5.7, while in BF and F the ratio was close to one in two out of three replicates. Similar results have been previously found in mammals by Kuchenbauer et al. (2012) that classified miRNA/miRNA* ratios into groups showing that about 50% of all miRNA duplexes revealed high ratios (>100) consistent with a strong preferential processing of one dominant miRNA strand. About 24% had intermediate ratios (between 100 and 10), about 13% showed low ratios (between 10 and 1), while another 13% showed inverted ratios (<1). The finding that miRNAs can display tissue-dependent miRNA arm selection opposes the general consensus that only one strand is highly dominant for any given miRNA duplex and opens insights into the possible biological function of selective accumulation of miRNA*. A recent review of Sunkar et al. (2012), discusses several studies showing that miRNA* tend to accumulate at a high level under particular conditions. As an example, miR393* accumulates at a high level during infection of P. syringae in Arabidopsis leaves and promotes plant resistance to bacterial infection. Mir399* is accumulated at high levels during phosphate deprivation in Arabidopsis and miR395* accumulates at high levels in Sorghum grown in optimal nutrient conditions.
PsRNATarget has been used to investigate possible target genes for miR482 and miR482* at locus 3_16. MiRNA482 target a peach sequence coding for a “probable receptor-like protein kinase” (expectation = 2, target accessibility = 17.288), while miRNA482* targets a NADH dehydrogenase gene (expectation = 3, target accessibility = 8.463). Examples of different targets for a pair of miRNA/miRNA* are reported in previous studies (Sunkar et al., 2012). Mir393 and miR393* target two entirely different gene families (TIR1 and SNARE) both involved in pathogen resistance of host plant. The possibility that a target-dependent strand selection based on the presence in the cell of miRNA or miRNA* targets might influence the selection of the active miRNA arm has been discussed by other authors. For instance Chatterjee and Grosshans (2009) reported that mRNAs can stabilize their cognate miRNAs thus suggesting coordinated RISC assembly which depends on a miRNA and its target levels.
Results obtained in the present work contribute to a deeper view of the miRNome complexity and to a better exploitation of the mechanism of action of these tiny regulators. The exact definition of the entire repertoire of peach miRNAs is in fact a prerequisite for a correct description of miRNAs whose expression is altered in response to specific developmental conditions or environmental stimuli. Future experiments based on small RNA-seq coupled with RNA-seq on the same samples will be carried out to highlight more clearly the possible biological role of miRNA isomiRs in plants.
Conflict of Interest Statement
The authors declare that the research was conducted in the absence of any commercial or financial relationships that could be construed as a potential conflict of interest.
Acknowledgments
We thank Keith Anthony Grimaldi for helping with the preparation of the manuscript. The present work has been supported by Drupomics Project (Italian Ministry for Agriculture). We acknowledge the International Peach Genome Initiative for pre-publication access to the peach genome sequence.
Supplementary Material
The Supplementary Material for this article can be found online at: http://www.frontiersin.org/Plant_Genetics_and_Genomics/10.3389/fpls.2012.00165/abstract
File S1 Reports the miRNA coding loci identified by miRDeep-P in pink sample.
File S2 Reports the miRNA coding loci identified by miRDeep-P in bloom sample.
File S3 Reports the miRNA coding loci identified by miRDeep-P in swollen flower bud sample.
File S4 Reports the miRNA coding loci identified by miRDeep-P in half-green sample.
File S5 Reports the miRNA coding loci identified by miRDeep-P in swollen leaf bud sample.
File S6 Reports a summary of the miRNA coding loci identified by miRDeep-P.
File S7 Reports the link between locus name and locus position.
File S8 Reports the results of the blast analysis against known plant miRNAs.
File S9 Reports target analysis for all the identified isomiRs.
File S10 Reports Pearson correlation coefficients between all the possible pairs of replicates belonging to the same biological sample, as well as samples from different tissues.
File S11 Reports the results of the t-test which was performed for all the possible comparisons of biological samples. The most frequent isomiR in each locus is highlighted in yellow.
Footnotes
References
Chapman, P. J., and Catlin, G. A. (1976). Growth stages in fruit trees from dormant to fruit set. N. Y. Food Life Sci. Bull. 58.
Chatterjee, S., and Grosshans, H. (2009). Active turnover modulates mature miRNA activity in Caenorhabditis elegans. Nature 461, 546–549.
Dai, X., and Zhao, P. X. (2011). PsRNATarget: a plant small RNA target analysis server. Nucleic Acids Res. 39, W155–W159.
Eamens, A. L., Smith, N. A., Curtin, S. J., Wang, M. B., and Waterhouse, P. M. (2009). The Arabidopsis thaliana double-stranded RNA binding protein DRB1 directs guide strand selection from microRNA duplexes. RNA 15, 2219–2235.
Ebhardt, H. A., Tsang, H. H., Dai, D. C., Liu, Y., Bostan, B., and Fahlman, P. (2009). Meta-analysis of small RNA-sequencing errors reveals ubiquitous post-transcriptional RNA modifications. Nucleic Acids Res. 37, 2461–2470.
Guo, L., and Lu, Z. (2010). Global expression analysis of miRNA gene cluster and family based on isomiRs from deep sequencing data. Comput. Biol. Chem. 34, 165–171.
Hansen, K. D., Wu, Z., Irizarry, R. A., and Leek, J. T. (2011). Sequencing technology does not eliminate biological variability. Nature Biotechnol. 29, 572–573.
Jeong, D.-H., Park, S., Zhai, J., Gurazada, S. G. R., de Paoli, E., Meyers, B. C., and Green, P. J. (2011). Massive analysis of rice small RNAs: mechanistic implications of regulated microRNAs and variants for differential target RNA cleavage. Plant Cell 23, 4185–4207.
Jones-Rhoades, M. W., Bartel, D. P., and Bartel, B. (2006). MicroRNAs and their regulatory roles in plants. Annu. Rev. Plant Biol. 57, 19–53.
Kozomara, A., and Griffith-Jones, S. (2011). miRBase: Integrating microRNA annotation and deep-sequencing data. Nucleic Acids Res. 39, D152–D157.
Kuchenbauer, F., Mah, S. M., Heuser, M., McPherson, A., Rüschmann, J., Rouhi, A., Berg, T., Bullinger, L., Argiropoulos, B., Morin, R. D., Lai, D., Starczynowski, D. T., Karsan, A., Eaves, C. J., Watahiki, A., Wang, Y., Aparicio, S. A., Ganser, A., Krauter, J., Döhner, H., Döhner, K., Marra, M. A., Camargo, F. D., Palmqvist, L., Buske, C., and Humphries, R. K. (2012). Comprehensive analysis of mammalian miRNA* species and their role in myeloid cells. Blood 118, 3350–3358.
Lee, L. W., Zhang, S., Etheridge, A., Ma, L., Martin, D., and Galas, D. (2012). Complexity of the microRNA repertoire revealed by next-generation sequencing. RNA 16, 2170–2180.
Mah, S. M., Buske, C., Humphries, R. K., and Kuchenbauer, F. (2010). miRNA*: a passenger stranded in RNA-indiced silencing complex? Crit. Rev. Eukaryot. Gene Expr. 20, 141–148.
Mi, S., Cai, T., Hu, Y., Chen, Y., Hodges, E., Ni, F., Wu, L., Li, S., Zhou, H., Long, C., Chen, S., Hannon, G. J., and Qi, Y. (2008). Sorting of small RNAs into Arabidopsis argonaute complexes is directed by the 5′ terminal nucleotide. Cell 133, 116–127.
Moxon, S., Schwach, F., Dalmay, T., MacLean, D., Studholme, D. J., and Moulton, V. (2008). A toolkit for analyzing large-scale plant small RNA datasets. Bioinformatics 24, 2252–2253.
Mückstein, U., Tafer, H., Hackermüller, J., Bernhart, S. H., Stadler, P. F., and Hofacker, I. L. (2006). Thermodynamics of RNA–RNA binding. Bioinformatics 22, 1177–1182.
Oshlack, A., Robinson, M. D., and Young, M. D. (2010). From RNA-seq reads to differential expression results. Genome Biol. 11, 220.
Sunkar, R., Li, Y.-F., and Jagadeeswaran, G. (2012). Functions of microRNAS in plant stress responses. Trends Plant Sci. 17, 196–203.
Takeda, A., Iwasaki, S., Watanabe, T., Utsumi, M., and Watanabe, Y. (2008). The mechanism selecting the guide strand from small RNA duplexes is different among argonaute proteins. Plant Cell Physiol. 49, 493–500.
Vaucheret, H. (2009). AGO1 homeostasis involves differential production of 21-nt and 22-nt miR168 species by miR168a and miR168b. PLoS ONE 4, e6442. doi:10.1371/journal.pone.0006442
Xie, Z., Khanna, K., and Ruan, S. (2010). Expression of microRNAs and its regulation in plants. Semin. Cell Dev. Biol. 21, 790–797.
Yang, X., and Li, L. (2011). miRDeep-P: A computational tool for analyzing the microRNA transcriptome in plants. Bioinformatics 27, 2614–2615.
Zhang, Y. (2005). miRU: An automated plant miRNA target prediction server. Nucleic Acids Res. 33(Suppl. 2), W701–W704.
Appendix
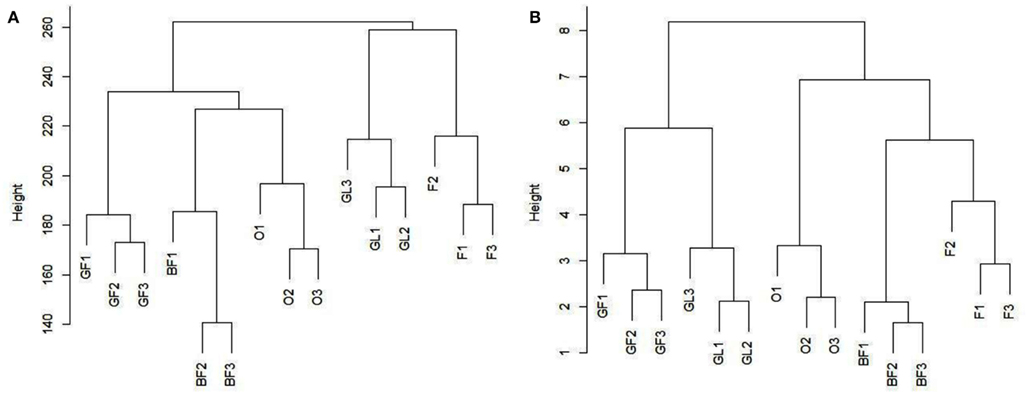
Figure A1. Reports the results obtained by cluster analysis as in Figure 1 but in this case without averaging the replicates of each sample. In details, (A) reports the results obtained by cluster analysis of the five tissues on the basis of the frequencies of all the reads, while (B) reports results obtained on the basis of the frequency of the most frequent read in each locus. Abbreviations: pink = BF, bloom = F, swollen flower bud = GF, half-inch green = O, swollen leaf bud = GL.
Keywords: microRNA, isomiRs, next generation sequencing
Citation: Colaiacovo M, Bernardo L, Centomani I, Crosatti C, Giusti L, Orrù L, Tacconi G, Lamontanara A, Cattivelli L and Faccioli P (2012) A survey of microRNA length variants contributing to miRNome complexity in peach (Prunus persica L.). Front. Plant Sci. 3:165. doi: 10.3389/fpls.2012.00165
Received: 03 April 2012; Accepted: 04 July 2012;
Published online: 26 July 2012.
Edited by:
Takuji Sasaki, National Institute of Agrobiological Sciences, JapanReviewed by:
Zhixi Tian, Chinese Academy of Sciences, ChinaTakeshi Itoh, National Institute of Agrobiological Sciences, Japan
Copyright: © 2012 Colaiacovo, Bernardo, Centomani, Crosatti, Giusti, Orrù, Tacconi, Lamontanara, Cattivelli and Faccioli. This is an open-access article distributed under the terms of the Creative Commons Attribution License, which permits use, distribution and reproduction in other forums, provided the original authors and source are credited and subject to any copyright notices concerning any third-party graphics etc.
*Correspondence: Primetta Faccioli, CRA Genomics Research Centre, via S.Protaso 302, I-29017 Fiorenzuola d’Arda (Pc), Italy. e-mail: primetta.faccioli@entecra.it
†Moreno Colaiacovo and Letizia Bernardo have contributed equally to this work.