 Yanzhao Zhang
 Yanwei Cheng
 Huiyuan Ya
 Shuzhen Xu
 Jianming Han
- Life Science Department, Luoyang Normal University, Luoyang, China
The pigmented cells in defined region of a petal constitute the petal spots. Petal spots attract pollinators and are found in many angiosperm families. Several cultivars of tree peony contain a single red or purple spot at the base of petal that makes the flower more attractive for the ornamental market. So far, the understanding of the molecular mechanism of spot formation is inadequate. In this study, we sequenced the transcriptome of the purple spot and the white non-spot of tree peony flower. We assembled and annotated 67,892 unigenes. Comparative analyses of the two transcriptomes showed 1,573 differentially expressed genes, among which 933 were up-regulated, and 640 were down-regulated in the purple spot. Subsequently, we examined four anthocyanin structural genes, including PsCHS, PsF3′H, PsDFR, and PsANS, which expressed at a significantly higher level in the purple spot than in the white non-spot. We further validated the digital expression data using quantitative real-time PCR. Our result uncovered transcriptome variance between the spot and non-spot of tree peony flower, and revealed that the co-expression of four anthocyanin structural genes was responsible for spot pigment in tree peony. The data will further help to unravel the genetic mechanism of peony flower spot formation.
Introduction
Petal spot is a group of pigment cells restricted in defined region of petal. It is widely distributed in the eudicots and the monocots, such as in Asteraceae, Brassicaceae, Geraniaceae, Ranunculaceae, Papaveraceae, Malvaceae, Scrophulariaceae, Iridaceae, Liliaceae, and Orchidaceae (Thomas et al., 2009). The spots not only attract pollinators (Eckhart et al., 2006; Goulson et al., 2009), but also impart the ornamental value to the flower. Traditional heredity experiments show that the petal spot is under genetic control (Harland, 1929; Gottlieb and Ford, 1988). However, the molecular mechanism of spot formation is not entirely understood (Davies et al., 2012; Yamagishi, 2013). Tree peony (Paeonia suffruticosa Andr.) – a woody shrub of the genus Paeonia and family Paeoniaceae – is a popular ornamental flower owing to its distinct petal colors. In some peony cultivars, the pigmented cells on the corolla form petal spots and show more intense colors as compared with the background. In China, more than 1000 tree peony cultivars are mainly divided into four geographical groups including Xibei, Zhongyuan, Jiangnan, and Xinan groups (Zhang et al., 2007). Most cultivars of the Xibei group cultivars show a red, brown, or deep purple colored spot at the base of each petal. These cultivars may be the progeny of the wild tree peony species Paeonia rockii (Wang et al., 2000). Since, the petal spot enhances the ornamental values of the tree peony flowers; it would be commercially beneficial to understand the mechanism of spot development.
Anthocyanins are the main pigments responsible for spot color, and the spatial and temporal expression of anthocyanin-related genes is related to spot formation. Anthocyanins form a major class of essential pigments in the plant and include derivatives of pelargonidin, cyanidin, and delphinidin, which are responsible for red, purple, and blue coloration, respectively. Chalcone synthase (CHS), chalcone isomerase (CHI), flavonoid 3-hydroxylase (F3H), and flavonoid 3′-hydroxylase (F3′H), dihydroflavonol 4-reductase (DFR), and anthocyanidin synthase (ANS), and UDP flavonoid glucosyl transferase (UFGT) are the well-characterized genes from the anthocyanin biosynthetic pathway (Winkel-Shirley, 2001; Koes et al., 2005). Anthocyanin synthesis is predominantly regulated by regulators from MYB, bHLH, and WD40 families (Ramsay and Glover, 2005; Gonzalez et al., 2008; Schaart et al., 2013). They form regulatory complexes to activate expression of anthocyanin structural genes (Goff et al., 1992; Grotewold et al., 2000). The anthocyanin biosynthetic genes in Arabidopsis are regulated by a WD-40 regulator (TTG1), three bHLH regulators (GL3, EGL3, and TT8), and four MYB regulators (AtPAP1, AtPAP2, AtMYB113, and AtMYB114) (Chiu et al., 2010). In some flowers, transcript variance of one or more anthocyanin structural genes was responsible for spot color (Yamagishi, 2013), like in petunia, sequence-specific degradation of CHS RNA lead to star-type red in petal (Koseki et al., 2005). Recently, MYB genes were verified to regulated anthocyanin accumulation in spot, such as NEGAN in Mimulus (Yuan et al., 2014), LhMYB12, and LhMYB12-Lat in lilies (Yamagishi et al., 2010, 2014), and PeMYB11 in Orchidaceae (Hsu et al., 2015). Tree peony has a large, singlular spot at the base of petal, which is stable and has different spot type according to previous researches. Zhang et al. (2007) showed that the abundant accumulation of cyanidin-based glycosides at the basal petal was the primary cause of spot formation in petal. However, molecular mechanism of spot formation is still not clear.
Previous studies of anthocyanin have provided unique insights into the molecular mechanisms of many non-model plant species. In the absence of complete genome sequence (as in tree peony), transcriptomic analysis is an effective method for gaining insights into differentially expressed genes (DEGs). Transcriptome sequencing of the spotted tissues and non-spotted tissues of peony will provide useful insights into the genetics of spot formation. Therefore, we sequenced the transcriptome of petal spot and background of the tree peony flower using Illumina HiSeq2000 platform. We then compared the two transcriptomes and filtered the DEGs. Our main objective was to annotate and analyze the DEGs to identify the candidate genes involved in spot development.
Materials and Methods
Tissue Collection and Quantification of Flavonoids
Paeonia suffruticosa Andr. cv. “Jinrong” plants were grown under field conditions in Luoyang Academy of Agriculture and Forestry Sciences (Luoyang, China). As is described by Guo et al. (2004), flower opening stages were divided into five stages, including soft bud stage, pre-opening stage, initial opening stage, half opening stage, and full opening stage. On April 10, 2014, the petals of flower bud (soft bud stage) were sampled, the spot and background in each petal was spliced and pooled, respectively. Each sample (approximate 1 g) was extracted with 40 ml acidic methanol (0.1% hydrochloric acid) at 4°C for 12 h. After centrifugation at 5,000 rpm for 5 min, the supernatant was filtered using a 0.22 μm membrane filter. Anthocyanins were investigated on an Agilent 1100 HPLC equipped with a diode array detector (Agilent Technology) as described by Fan et al. (2012). Total anthocyanin content was measured semi-quantitatively from a simple linear regression using cyanidin-3-O-glucoside (Cy3G) as standard at 520 nm, three biological replicates were performed for anthocyanin content detection.
cDNA Library Construction and Sequencing
Total RNA was extracted using the modified CTAB method, and was then purified with the RNeasy Plant Mini Kit according to manufacturer’s protocols. The RNA-integrity number (RIN) of each sample was determined using an Agilent 2100 Bioanalyzer. mRNA was enriched from 20 μg total RNA using magnetic beads with Oligo (dT), and was cut into random fragments using fragmentation buffer. First-strand cDNA was synthesized using short fragments as templates and random hexamer primers, followed by synthesis of the second-strand cDNA with dNTPs, RNase H and DNA polymerase I. The double-strand cDNA was purified via magnetic beads, subjected to an end repair process by adding a single nucleotide A (adenine) to the 3′ ends and ligating with sequencing adaptors. The suitable fragments were selected and enriched with PCR amplification as templates. The libraries were validated using Agilent 2100 Bioanalyzer and sequenced using an Illumina HiSeq2000 sequencing platform. The preparation of libraries and sequencing projects were performed at Encode Genomics Bio-Technology Co., LTD. (Suzhou, China). The transcriptome datasets were deposited at the NCBI database under accession numbers SRR1825648 and SRR1825653.
De Novo Assembly and Gene Annotation
Raw reads were filtered by removing adapter sequences and low-quality reads with more than 20% Q < 20 bases. The remaining high-quality reads were assembled de novo using Trinity software (Grabherr et al., 2011). The longest transcript (from alternative splicing transcripts) was selected as the unigene in this study. Functional annotations were performed by homology search against the public databases, including NR and Swiss-Prot database using BLAST with an E-value of less than 1e-5. Blast2GO (Conesa et al., 2005) was employed to obtain the relevant GO terms based on the NR BLAST results, and WEGO software was used to illustrate the distribution of gene classification. Unigenes were used for query against the COG database to predict and classify functions. Pathway assignments were also carried out based on the Kyoto encyclopedia of genes and genomes (KEGG) database.
Expression Analysis
The clean reads were aligned to assembled unigenes using Bowtie program (Langmead et al., 2009), the transcription abundance of each unigene was measured by calculating Fragments Per Kilobase of transcript per Million mapped reads (FPKM; Trapnell et al., 2010). DEGs between petal spot and background were identified with the EBSeq package (Leng et al., 2013). Here, we used a threshold for false discovery rate (FDR) significance score <0.01 and absolute value of log2ratio >2 to determine significant differences in gene expression.
Quantitative RT-PCR Analysis
RNA from the flower spot was extracted and purified as described above. Approximately, 2 μg of total RNA per sample was used to synthesize first-strand cDNA using reverse transcription system (Promega). Quantitative RT-PCR was performed using SYBR Premix Ex Taq (Takara) on ABI 7500 system. Primers used are listed in Supplementary Table S1. The amplification program was performed as 95°C for 2 min, followed by 95°C for 15 s and 60°C for 31 s (40 cycles). Three biological replicates were performed for each gene. The combination of ubiquitin and GAPDH was used to normalized the qPCR data (Yanjie et al., 2012). The relative expression levels of genes were calculated using the 2-ΔΔCT method (Livak and Schmittgen, 2001). The statistical p-value was generated by the paired t-test. The statistical significance was defined as p < 0.05.
Results
Flower Color and Anthocyanin Content
The “Jinrong” cultivar of the Xibei group – with a purple spot and white petal – shows significantly demarked spot because of its white background (Figure 1). The anthocyanin content of the spot was significantly different from that of the petal. HPLC analysis revealed that highly content of cyanidin-3-O-glucoside was accumulated in the spot (1.83 ± 0.07 mg/g), but was barely detectable in the non-spot extraction.
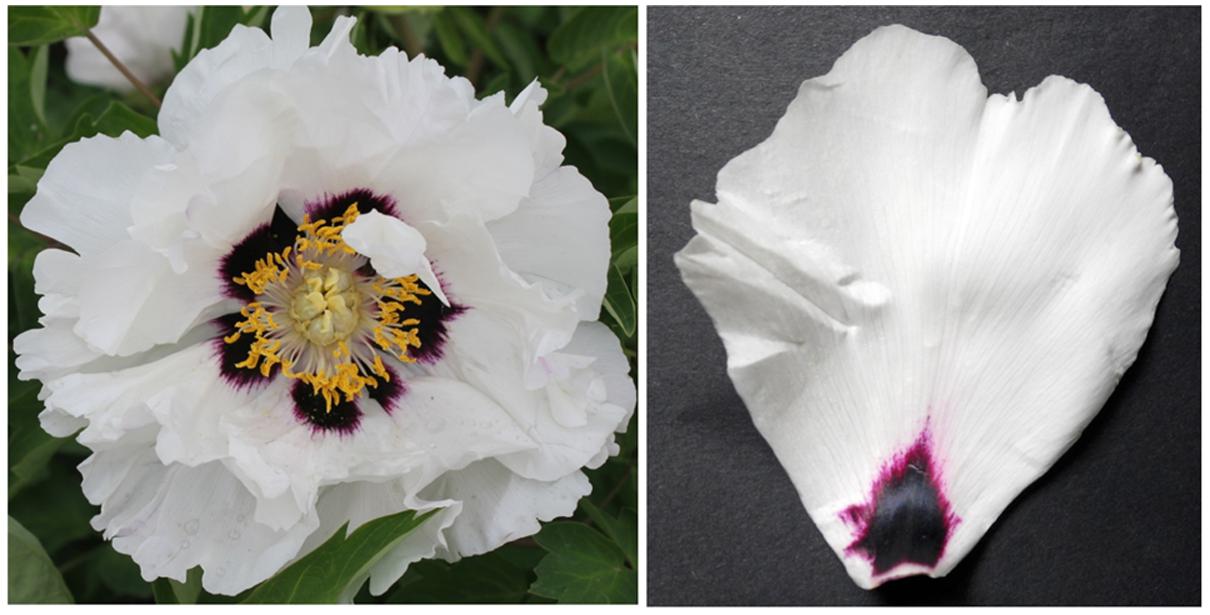
FIGURE 1. The flower of tree peony cultivar “Jinrong”.
Transcriptome Sequencing and Assembly
Sequencing projects generated 6.95 G and 7.46 G raw data from spot and non-spot libraries, respectively. De novo assembly using Trinity Software generated 133,153 transcripts with an N50 of 1,451, and 67,892 unigenes with an N50 of 1,138. A total of 42,860 unigenes (63.13%) were between 200 and 500 nt in length; 11,873 unigenes (17.49%) were between 500 and 1000 nt; and 13,159 unigenes (19.38%) were longer than 1000 nt (Figure 2).
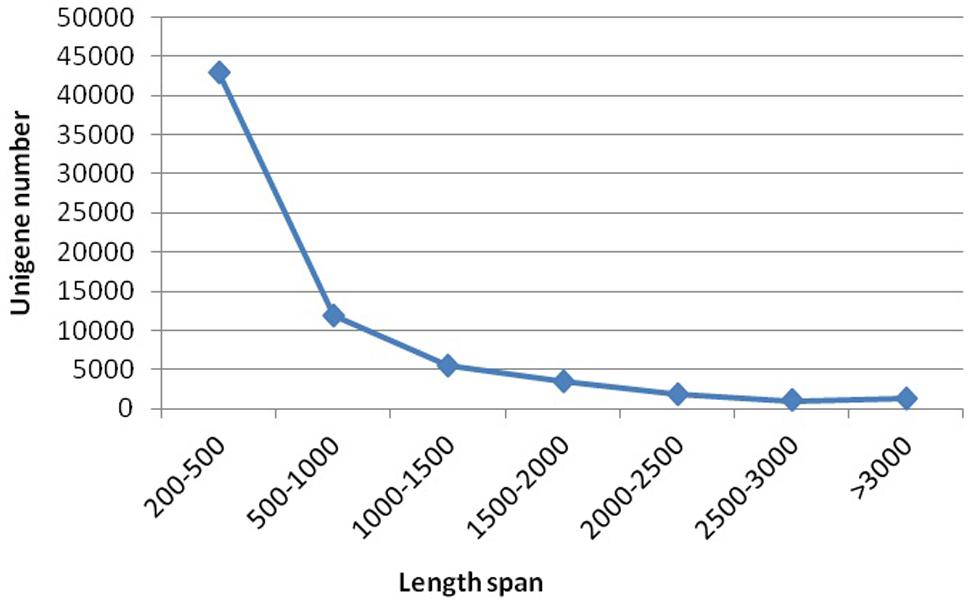
FIGURE 2. Length distribution of assembled unigenes. Please use a single paragraph for each.
Functional Annotation
All unigenes were annotated by querying against the public databases, including non-redundant protein database (nr), Swiss-Prot, Gene Ontology (GO), KEGG, and the database of Cluster of Orthologous Groups of proteins database (COG). The best hit was selected from the hits with an E-value of less than 1e-5. Our results showed that 28,039 unigenes were annotated in public databases, accounting for 41.3% of total unigenes. We annotated 27,917 (41.1%), 17,341(25.5%), and 20,800 (30.6%) unigenes to nr, Swiss-Prot, and GO databases, respectively. About 7,980 unigenes (11.8%) and 5,770 (8.5%) unigenes had hits in the COG and KEGG databases, respectively.
Identification and Annotation of DEGs between Spot and Non-spot Tissues of Tree Peony Petals
Comparative transcriptome profiling of the purple spot and non-spot tissues yielded 1,573 DEGs (Figure 3). Among these, 933 unigenes were significantly up-regulated while 640 unigenes were down-regulated. We assigned 988 of the 1,573 DEGs to three main GO categories including “molecular functions,” “biological processes,” and “cellular components” (Figure 4). Among them, 631 unigenes were grouped in the category “cellular components,” 771 unigenes in “molecular function,” and 792 unigenes in “biological processes.” In the “cellular component” category, “cell part” (505 unigenes), “cell” (498 unigenes), “organelle” (391 unigenes), and “membrane” (312 unigenes) were the most abundant groups. Under the “molecular function” category, the unigenes were most abundant in the “catalytic activity” (538 unigenes) and “binding” (434 unigenes) classes. In the “biological processes” category, the “metabolic process” (645 unigenes) and “cellular process” (526 unigenes) contained more DEGs than others.
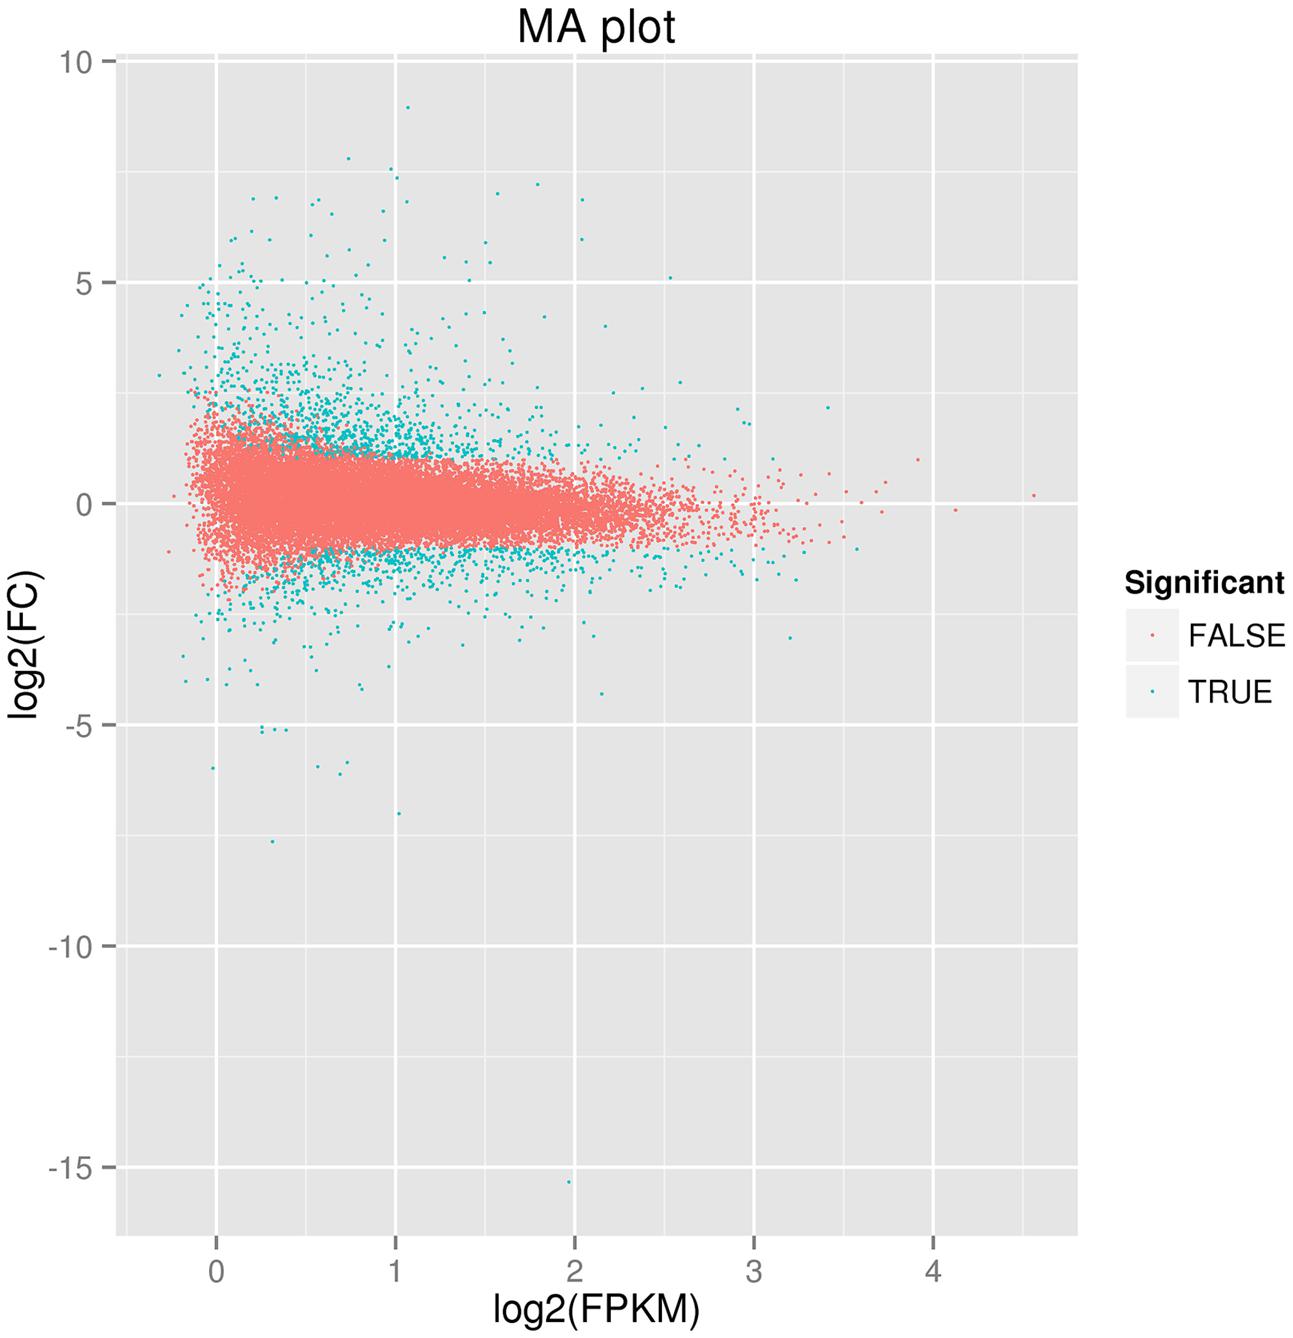
FIGURE 3. Figure of differently expressed genes between spot and non-spot. The parameters “FDR ≤ 0.01” and “log2 ratio ≥ 1” were used as thresholds to determine the different expressed gene. Green dots represent the different expressed genes, and red dots indicate genes that did not change significantly between the two transcriptomes.
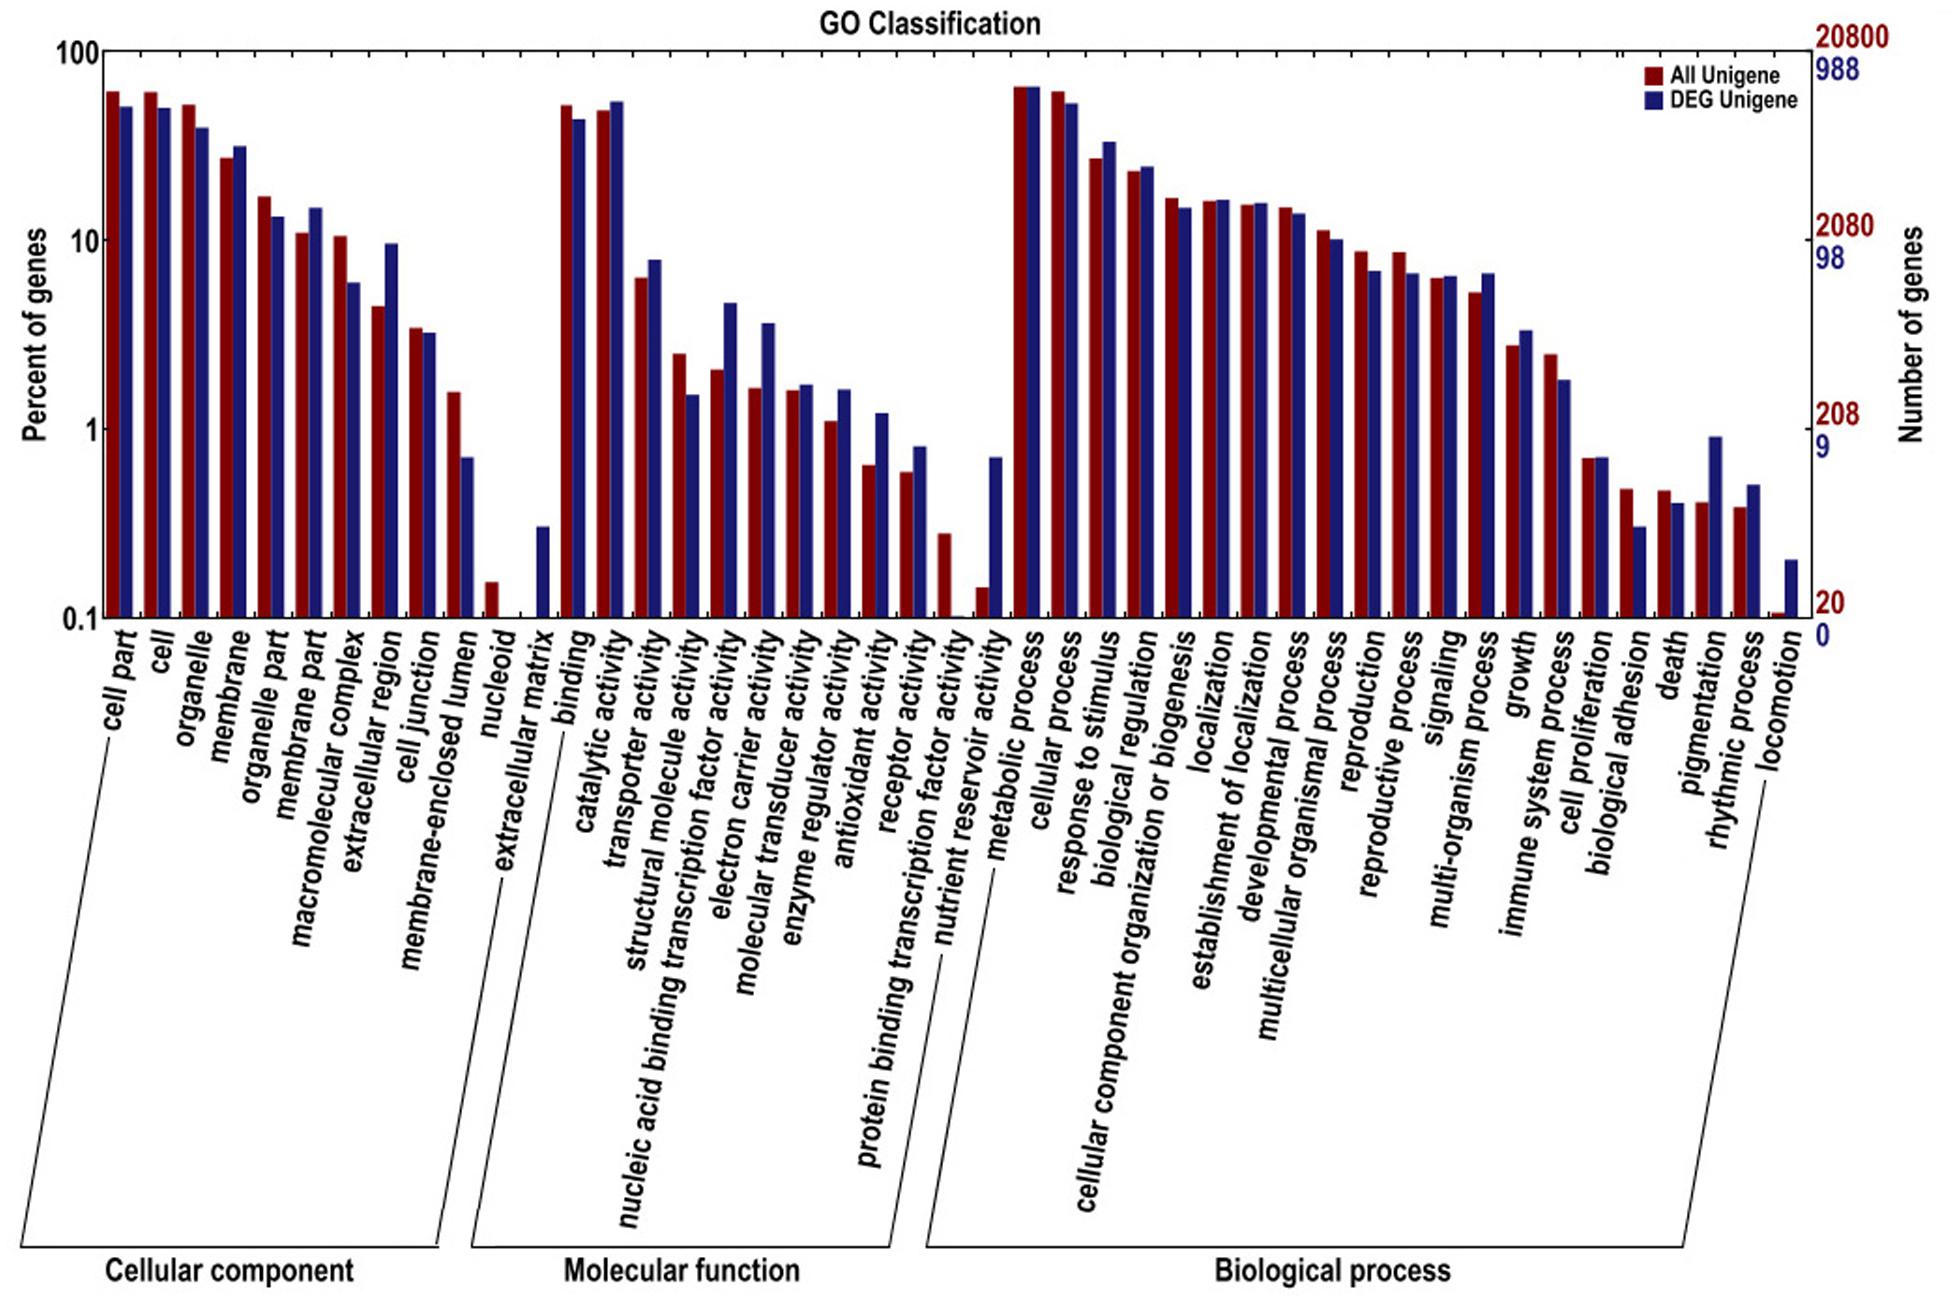
FIGURE 4. Gene ontology classifications of assembled unigenes and different expressed genes. The results are summarized in three main categories: biological process, cellular component, and molecular function.
KEGG Classification of DEGs
We further analyzed the unigenes by searching the KEGG database where out of the 1,573 DEGs, 179 unigenes were assigned to five main categories including 79 pathways (Figure 5). Among the five main categories, “metabolism” was the largest category containing 122 unigenes, followed by “genetic information processing” (29 unigenes), “environmental information processing” (23 unigenes), “organismal systems” (5 unigenes), and “cellular processes” (5 unigenes). Since, the spot pigment was correlated with anthocyanin accumulation; we were interested in the anthocyanin biosynthesis pathway. We identified three pathways including “phenylpropanoid biosynthesis” (10 DEGs, ko00940), “flavonoid biosynthesis” (4 DEGs, ko00941), and “flavone and flavonol biosynthesis” (2 DEGs, ko00942) in the metabolism category, which were related to color development. Moreover, there were seven glucide metabolic pathways, including “starch and sucrose metabolism (12 DEGs, ko00500),” “glycosaminoglycan degradation (1 DEG, ko00531),” “amino sugar and nucleotide sugar metabolism (3 DEGs, ko00520),” “pentose and glucuronate interconversions (6 DEGs, ko00040),” “glycolysis/gluconeogenesis (6 DEGs, ko00010),” “fructose and mannose metabolism (2 DEGs, ko00051),” and “galactose metabolism (4 DEGs ko00052).” All of these metabolic pathways may relate to the synthesis of substrates for anthocyanin biosynthesis.
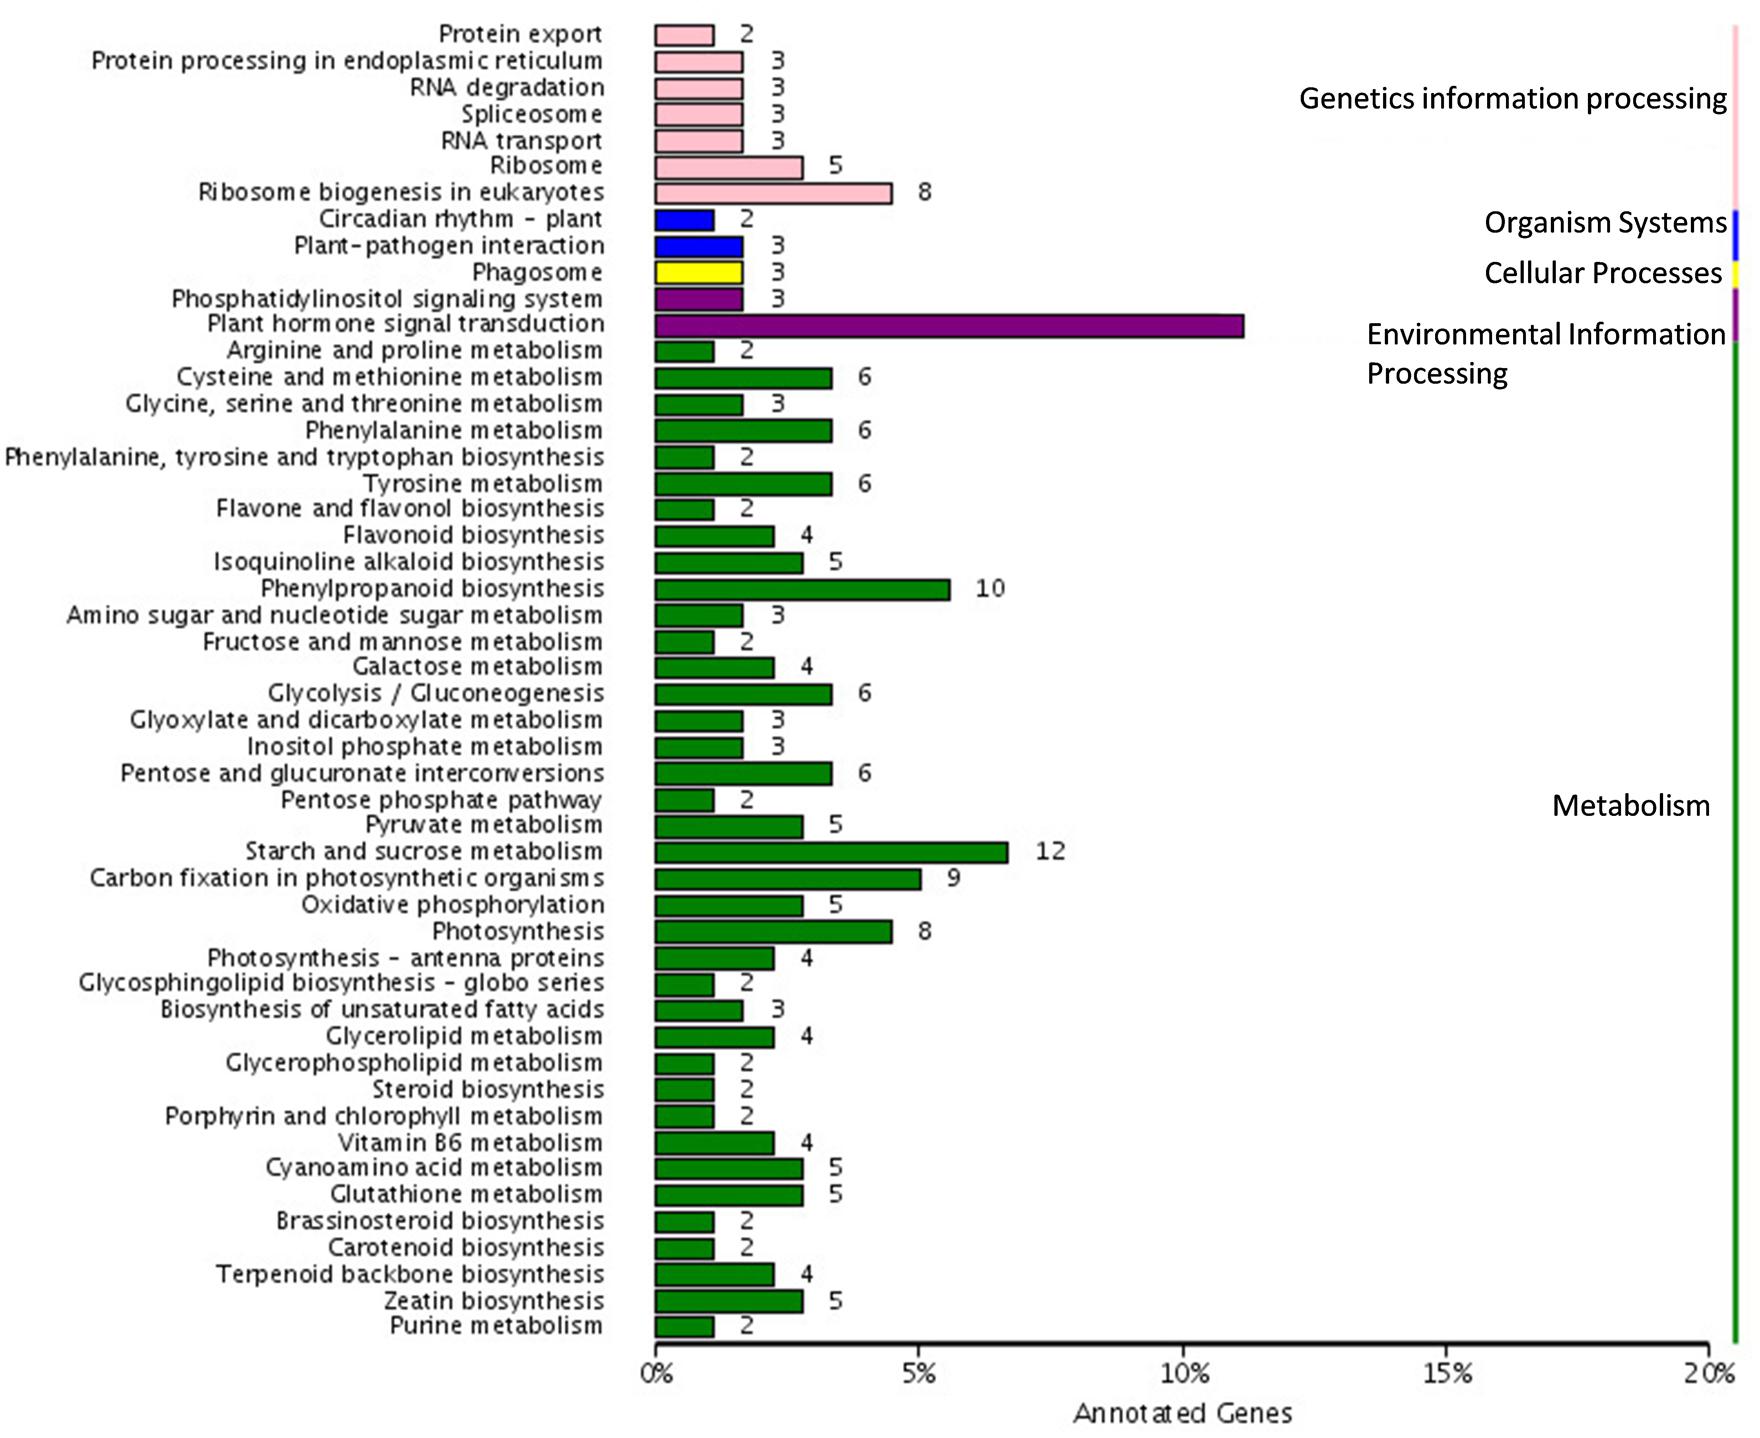
FIGURE 5. Pathway assigned of different expressed genes based on Kyoto encyclopedia of genes and genomes (KEGG).
Transcription Analysis of Anthocyanin Biosynthesis Genes
By annotation in public database, seven genes were predicted to participate in flavonoid pathway (Table 1). Among them, c38856.graph_c0 (KT758291), c50492.graph_c0 (KT758292), and c56659.graph_c0 (KT758293) encode F3′H, DFR, and ANS, respectively. They were the same genes with that reported previously in tree peony (Zhang et al., 2014; Zhao et al., 2015). c29075.graph_c0 (KT758290) has 85.3% amino acid similarity with CHS (KJ466964) in tree peony. Phylogenetic analysis revealed that c56800.graph_c0 was more closely related to FLS gene in Arabidopsis, c61446.graph_c0 and c58959.graph_c0 was not in the clad with UDP-glucose flavonoid 3-O-glucosyltransferases that were verified to catalyzes the transfer of the glucosyl moiety from UDP-glucose to the 3-hydroxyl group of anthocyanidins (Supplementary Figures S1 and S2). Therefore, four anthocyanin structural genes, PsCHS, PsF3′H, PsDFR, and PsANS were identified from DGEs.
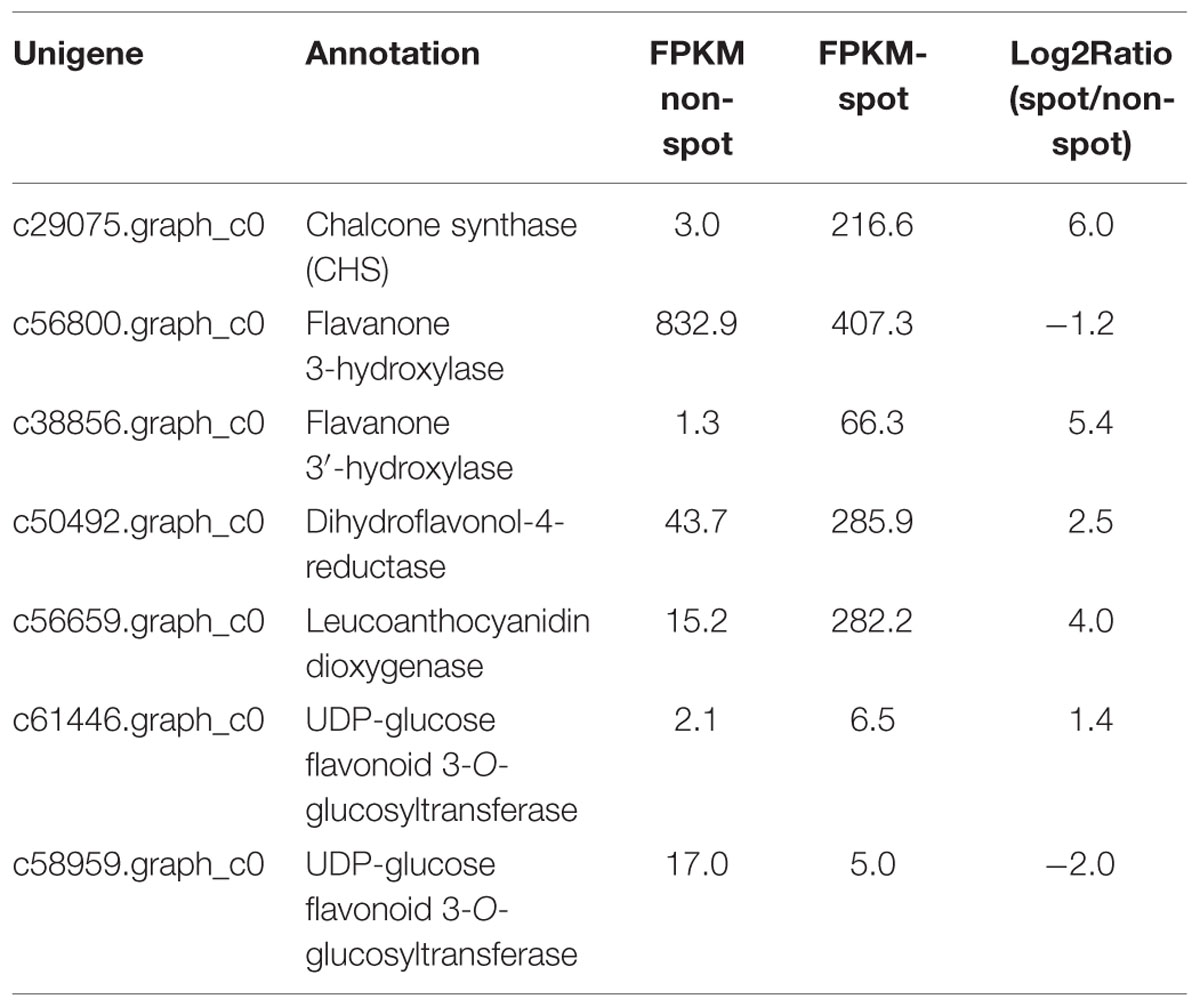
TABLE 1. Putative anthocyanin structural genes identified from differentially expressed genes (DEGs).
The normalized expression levels of PsCHS, PsF3′H, PsDFR, and PsANS in spot vs. non-spot were 73.4-, 51.8-, 6.5-, and 18.6-fold higher, respectively. In order to validate the expression profiling by Illumina sequencing, we further analyzed the anthocyanin structural genes using qRT-PCR (Figure 6; Supplementary Figure S3). Our results showed that the four genes including PsCHS, PsF3′H, PsDFR, and PsANS showed significantly higher expression in spot than in non-spot. Thus, our qRT-PCR results were consistent with those using Illumina sequencing method.
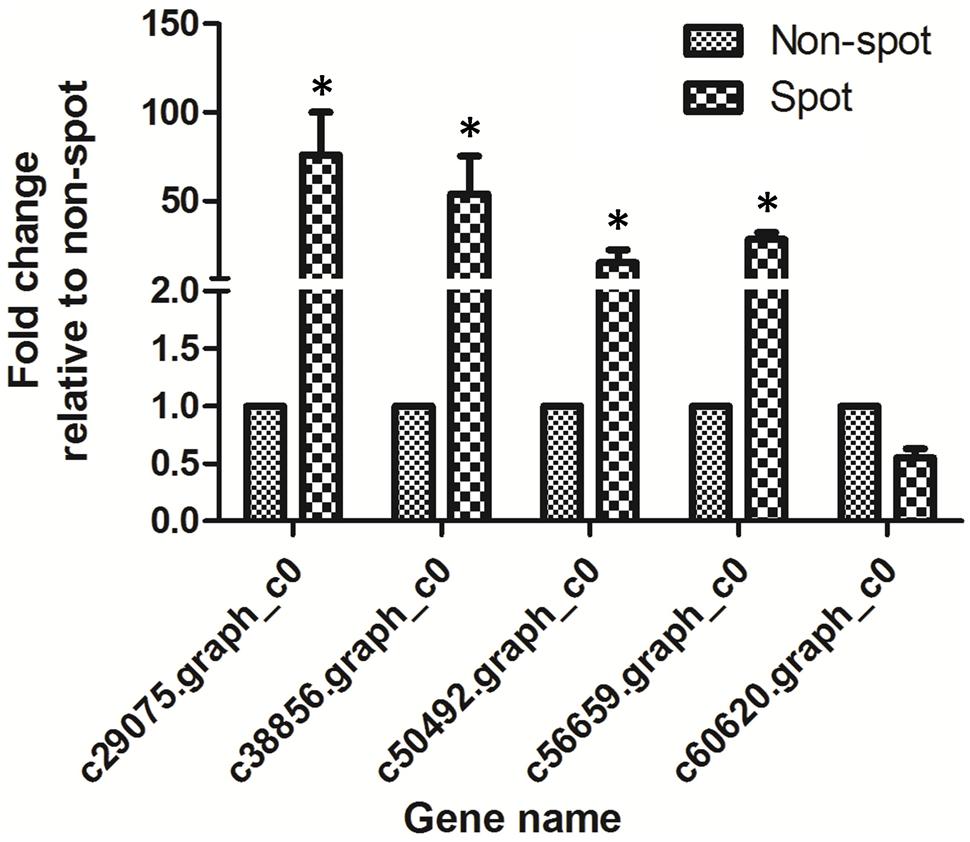
FIGURE 6. qRT-PCR analysis of anthocyanin structural genes expression in petal spot and non-spot of “Jinrong”. Ubiquitin was used as an internal control. Each gene has three biological replicates. The statistical p-value was generated by the paired t-test. Asterisk indicated statistical significance (∗p < 0.05).
In the anthocyanin biosynthesis pathway, structural genes are controlled by transcription factors from MYB, bHLH, and WD40 families (Davies et al., 2012; Robinson and Roeder, 2015). We identified 7 MYBs, 12 bHLHs, and 1 WD40 among the DEGs (Table 2). Among these four MYBs, nine bHLHs, and one WD40 were up-regulated in spot. Phylogenetic analysis revealed that c60620.graph_c0 (KT758294) was closely related to VvMYBA1 and VvMYBA2, both of which regulated anthocyanin biosynthesis in grape (Supplementary Figure S4). No bHLH and WD40 genes involved in anthocyanin regulation were found (Allan et al., 2008). However, c60620.graph_c0 was down regulated in spot both by transcriptome and qPCR analysis (Table 2, Figure 6).
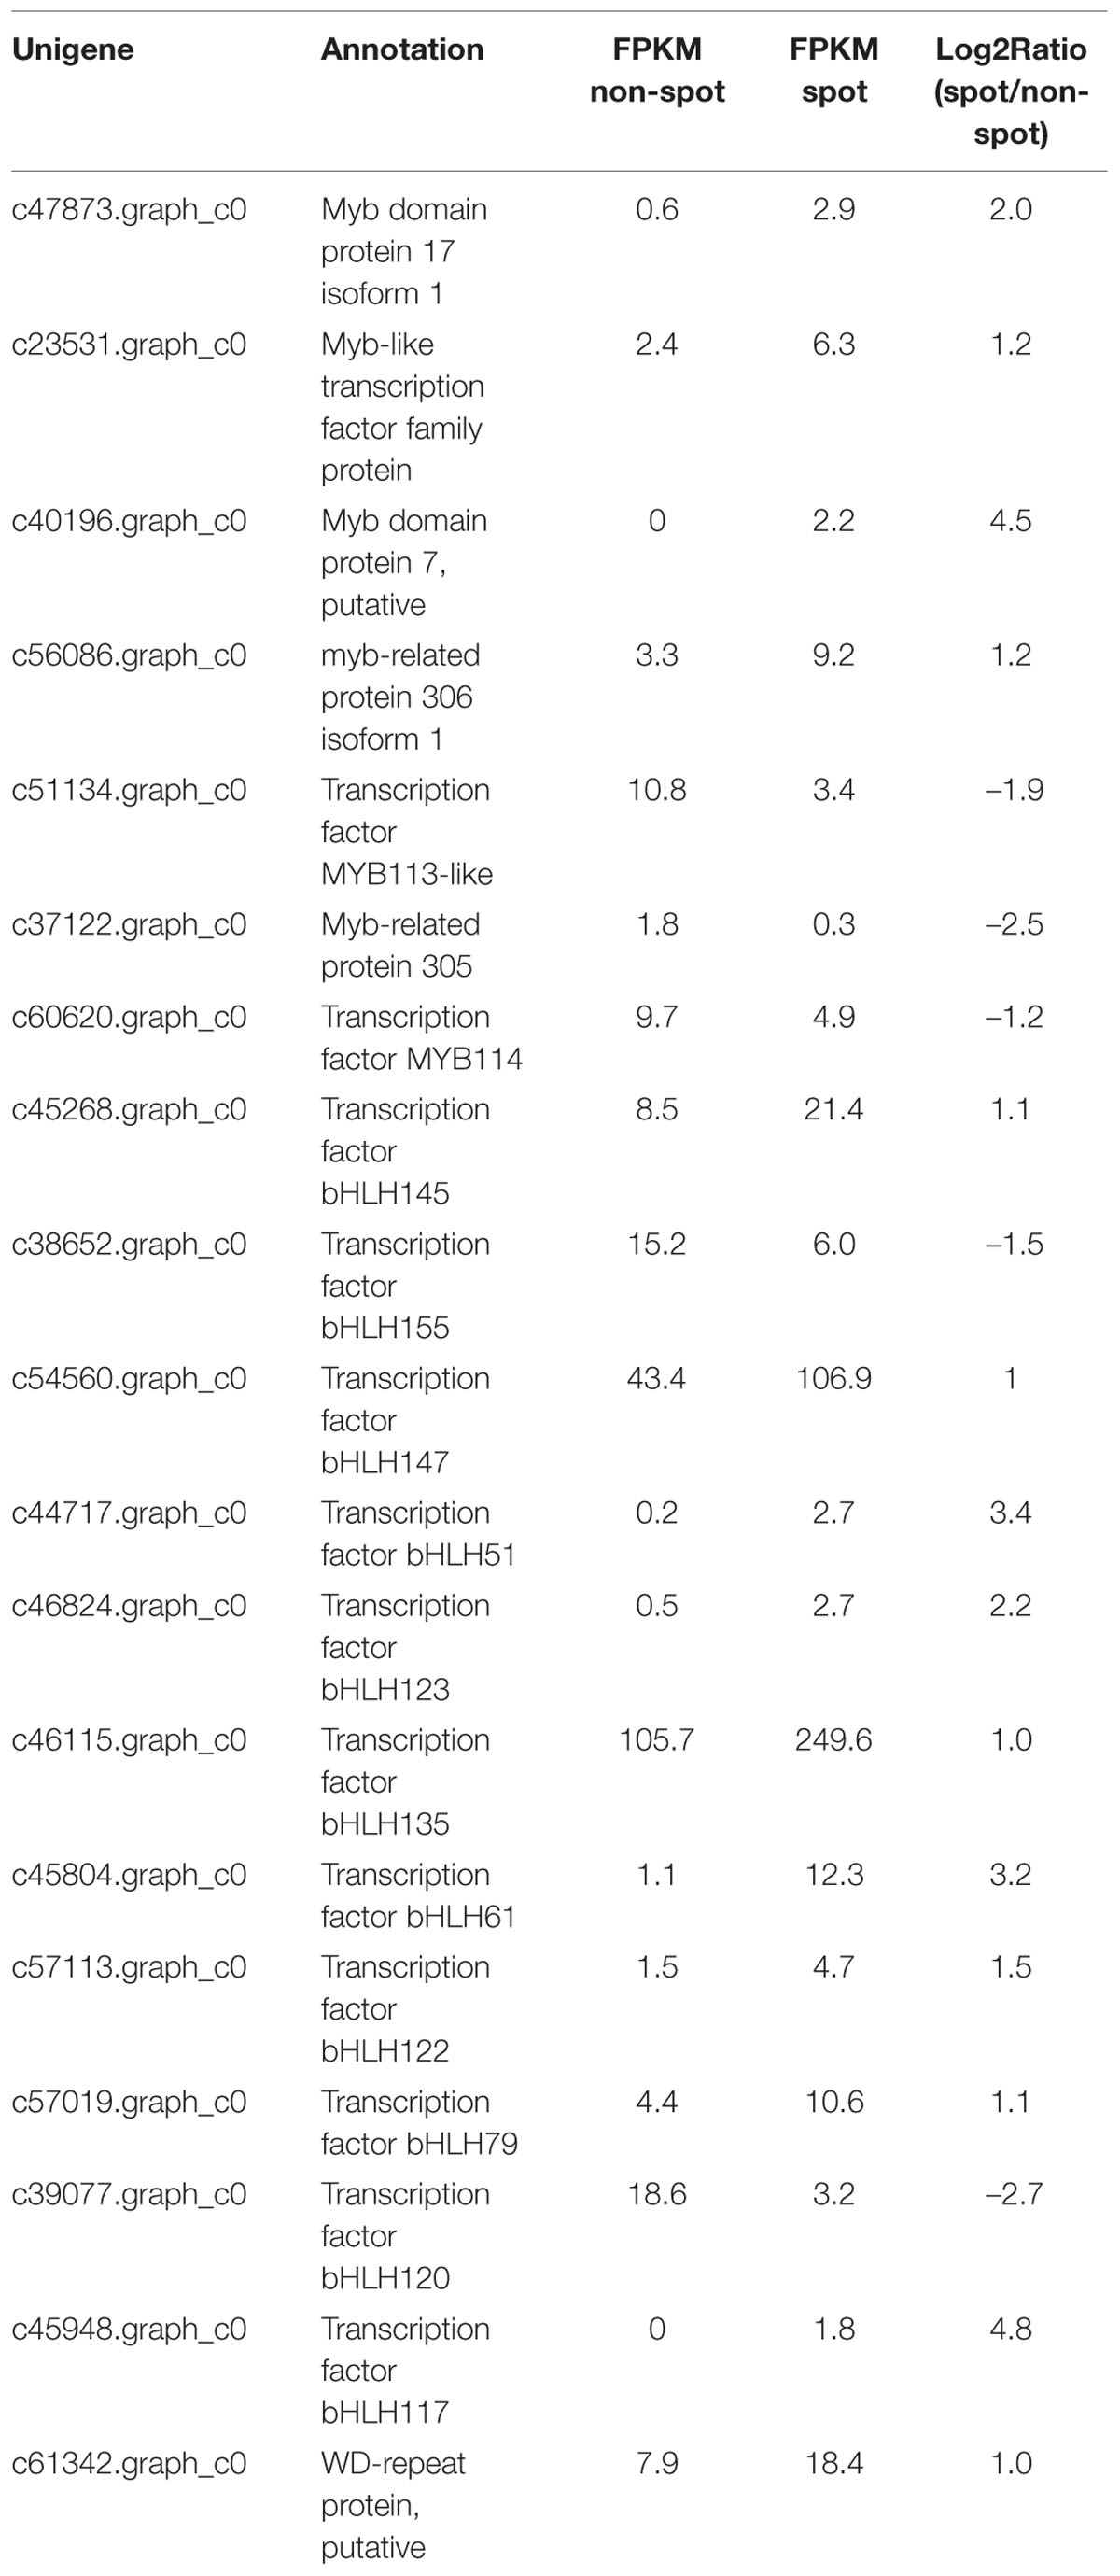
TABLE 2. Differentially expressed genes in transcription factor families of MYB, bHLH, and WD40.
Discussion
In this study, we found four key anthocyanin structural genes including PsCHS, PsF3′H, PsDFR, and PsANS were expressed at a significantly higher level in the red spot than in the white non-spot. HPLC analysis showed that the anthocyanin content was consistent with color variance between the spot and non-spot. Anthocyanins are tightly linked to color variation in the flower. In petal spot, the color cue is usually determined by anthocyanin accumulation. Cyanidin-based glycosides accumulate abundantly at the basal petal in tree peony and result in spot formation (Zhang et al., 2007). Therefore co-expression of the four structural genes identified in this study is responsible for pigmentation in petal spot of “Jinrong”.
Tree peony lacks a reference genome, and thus restricts the molecular understanding of spot formation. Next generation sequencing technologies allow a large scale retrieval of DEGs in non-model plants lacking a reference genome. In this study, we sequenced and comparatively analyzed the transcriptomes of the spot and non-spot using Illumina. We assembled 67,892 unigenes and annotated1573 DEGs. Pathway analysis studies annotated DEGs to 78 metabolic pathways. The “flavonoid biosynthesis” (ko00941) and “flavone and flavonol biosynthesis” (ko00944) pathways relevant to pigment development were annotated. Moreover, we also annotated seven glucide metabolic pathways that may synthesize substrate for anthocyanin. Anthocyanins and their co-pigments are responsible for color formation in flowers. The pathways involved in the production of both anthocyanins and their co-pigments were described in transcriptomic analysis of plants like Brassica juncea (Liu et al., 2013), peach flower (Chen et al., 2014), grape hyacinth (Lou et al., 2014), herbaceous peony (Zhao et al., 2014), and Safflower (Lulin et al., 2012). Our results indicated that flavonoid and anthocyanin biosynthetic pathways were conserved in tree peony.
In the anthocyanin biosynthetic pathway, CHS is responsible for the first committed step. It condenses one molecule of 4-coumaroyl-CoA with three molecules of malonyl-CoA to produce the tetrahydroxy-chalcone, which is the precursor for the biosynthesis of flavonoids and anthocyanins. CHI converts the tetrahydroxychalcone to naringenin. F3H, F3′H, and F3′5′H catalyzes the formation of dihydroflavonols from naringenin. Dihydroflavonols are converted by DFR, ANS, and flavonoid 3-glucosyl transferase (UF3GT) to yield pelargonidin, cyanidin, and delphinidin pigments (Winkel-Shirley, 2001; Lepiniec et al., 2006). Plant color variation is attributed to variation in transcripts of structural genes, such as in Clarkia gracilis (Martins et al., 2013), Litchi chinensis Sonn (Wei et al., 2011), Magnolia sprengeri Pamp (Shi et al., 2014), and torenia plants (Nishihara et al., 2014). Our transcriptome profiling study showed that CHS, F3′H, DFR, and ANS showed higher expression at a significantly higher level on the spot than in the non-spot. These results were further corroborated by qRT-PCR analysis. Our result suggests that the color variance mechanism is conserved in plants. High expression levels of structural genes ensure sufficient anthocyanin accumulation to make the spot purple, while the opposite effect is prevalent in the non-spot.
Flowers color is usually determined by activation of anthocyanin pathway. MYB-bHLH-WD40 were the key regulatory genes responsible for flower color patterns. Spots are common pigmentation pattern in flower, and some arbitrary and variable spots were caused by transposable elements insertion in anthocyanin structural or regulatory genes (Iida et al., 2004; Nishijima et al., 2013). Recently, MYB genes are likely involved in controlling the spot formation, such as NEGAN in monkey flowers (Yuan et al., 2014) and PeMYB11 in Orchidaceae (Hsu et al., 2015). Tree peony has another type of spot, which is a large, singular spot at the base of petal. In C. gracilis and pansy, a spot similar with tree peony was present in petal, researches revealed that the precise spatio-temporal expression of DFR2, F3′H1 in spot, and DFR1 and F3′5′H1 genes in background lead to spot formation in C. gracilis (Martins et al., 2013), while transcription of VwF3′5′H, VwDFR, and VwANS was significantly increased in cyanic blotches of pansy, but which is the critical regulatory genes was still unclear (Li et al., 2014). As is reviewed by Davies et al. (2012) and Yamagishi (2013), spots appearing at the same position, may or may not be associated with specific epidermal cell types, are shaped by the most complex regulatory mechanisms and the molecular mechanisms are not fully understood. We suggested that the co-expression of anthocyanin structural genes was responsible for anthocyanin accumulation in spot, but transcription variance of structural genes between spot and non-spot may not be directly caused by transcription variance of regulated genes from MYB, bHLH, and WD40 families. We did not found a MYB genen from DEGs responsible for the up-regulation of anthocyanin pathway genes. However, our data provide more clues to reveal the mechanism of activation of anthocyanin pathway in spot.
Conflict of Interest Statement
The authors declare that the research was conducted in the absence of any commercial or financial relationships that could be construed as a potential conflict of interest.
Acknowledgments
This work was supported by the National Natural Science Foundation (31400602), NSFC-Henan province joint foundation (U1204307), and the cultivation foundation supported by Luoyang Normal University (2013-PYJJ-001). We also thanked Biomarker Technologies Co., Ltd. for helping in the analysis of transcriptome data.
Supplementary Material
The Supplementary Material for this article can be found online at: http://journal.frontiersin.org/article/10.3389/fpls.2015.00964
References
Allan, A. C., Hellens, R. P., and Laing, W. A. (2008). MYB transcription factors that colour our fruit. Trends Plant Sci. 13, 99–102. doi: 10.1016/j.tplants.2007.11.012
Chen, Y., Mao, Y., Liu, H., Yu, F., Li, S., and Yin, T. (2014). Transcriptome analysis of differentially expressed genes relevant to variegation in peach flowers. PLoS ONE 9:e90842. doi: 10.1371/journal.pone.0090842
Chiu, L. W., Zhou, X., Burke, S., Wu, X., Prior, R. L., and Li, L. (2010). The purple cauliflower arises from activation of a MYB transcription factor. Plant Physiol. 154, 1470–1480. doi: 10.1104/pp.110.164160
Conesa, A., Götz, S., García-Gómez, J. M., Terol, J., Talón, M., and Robles, M. (2005). Blast2GO: a universal tool for annotation, visualization and analysis in functional genomics research. Bioinformatics 21, 3674–3676. doi: 10.1093/bioinformatics/bti610
Davies, K. M., Albert, N. W., and Schwinn, K. E. (2012). From landing lights to mimicry: the molecular regulation of flower colouration and mechanisms for pigmentation patterning. Funct. Plant Biol. 39, 619–638. doi: 10.1071/FP12195
Eckhart, V. M., Rushing, N. S., Hart, G. M., and Hansen, J. D. (2006). Frequency– dependent pollinator foraging in polymorphic Clarkia xantiana ssp. xantiana populations: implications for flower colour evolution and pollinator interactions. Oikos 112, 412–421. doi: 10.1111/j.0030-1299.2006.14289.x
Fan, J., Zhu, W., Kang, H., Ma, H., and Tao, G. (2012). Flavonoid constituents and antioxidant capacity in flowers of different Zhongyuan tree penoy cultivars. J. Funct. Foods 4, 147–157. doi: 10.1016/j.jff.2011.09.006
Goff, S. A., Cone, K. C., and Chandler, V. L. (1992). Functional analysis of the transcriptional activator encoded by the maize B gene: evidence for a direct functional interaction between two classes of regulatory proteins. Genes Dev. 6, 864–875. doi: 10.1101/gad.6.5.864
Gonzalez, A., Zhao, M., Leavitt, J. M., and Lloyd, A. M. (2008). Regulation of the anthocyanin biosynthetic pathway by the TTG1/bHLH/Myb transcriptional complex in Arabidopsis seedlings. Plant J. 53, 814–827. doi: 10.1111/j.1365-313X.2007.03373.x
Gottlieb, L., and Ford, V. (1988). Genetic studies of the pattern of floral pigmentation in Clarkia gracilis. Heredity 60, 237–246. doi: 10.1038/hdy.1988.37
Goulson, D., Mcguire, K., Munro, E. E., Adamson, S., Colliar, L., Park, K. J., et al. (2009). Functional significance of the dark central floret of Daucus carota (Apiaceae) L.; is it an insect mimic? Plant Species Biol. 24, 77–82. doi: 10.1111/j.1442-1984.2009.00240.x
Grabherr, M. G., Haas, B. J., Yassour, M., Levin, J. Z., Thompson, D. A., Amit, I., et al. (2011). Full-length transcriptome assembly from RNA-Seq data without a reference genome. Nat. Biotechnol. 29, 644–652. doi: 10.1038/nbt.1883
Grotewold, E., Sainz, M. B., Tagliani, L., Hernandez, J. M., Bowen, B., and Chandler, V. L. (2000). Identification of the residues in the Myb domain of maize C1 that specify the interaction with the bHLH cofactor R. Proc. Natl. Acad. Sci. U.S.A. 97, 13579–13584. doi: 10.1073/pnas.250379897
Guo, W. W., Dong, L., Wang, L. Y., Chen, R. X., and Liu, A. Q. (2004). The postharvest characteristics and water balance of some cultivars of tree-peony cut flowers. Sci. Silvae Sin. 40, 89–93.
Harland, S. C. (1929). The genetics of cotton. Part I. The inheritance of petal spot in New World cottons. J. Genet. 20, 365–385.
Hsu, C. C., Chen, Y. Y., Tsai, W. C., Chen, W. H., and Chen, H. H. (2015). Three R2R3-MYB transcription factors regulate distinct floral pigmentation patterning in Phalaenopsis spp. Plant Physiol. 168, 175–191. doi: 10.1104/pp.114.254599
Iida, S., Morita, Y., Choi, J. D., Park, K. I., and Hoshino, A. (2004). Genetics and epigenetics in flower pigmentation associated with transposable elements in morning glories. Adv. Biophys. 38, 141–159. doi: 10.1016/S0065-227X(04)80136-9
Koes, R., Verweij, W., and Quattrocchio, F. (2005). Flavonoids: a colorful model for the regulation and evolution of biochemical pathways. Trends Plant Sci. 10, 236–242. doi: 10.1016/j.tplants.2005.03.002
Koseki, M., Goto, K., Masuta, C., and Kanazawa, A. (2005). The star-type color pattern in Petunia hybrid ‘Red Star’ flowers is induced by sequence-specific degradation of chalcone synthase RNA. Plant Cell Psysiol. 46, 1879–1883.
Langmead, B., Trapnell, C., Pop, M., and Salzberg, S. L. (2009). Ultrafast and memory-efficient alignment of short DNA sequences to the human genome. Genome Biol. 10, R25. doi: 10.1186/gb-2009-10-3-r25
Leng, N., Dawson, J. A., Thomson, J. A., Ruotti, V., Rissman, A. I., Smits, B. M., et al. (2013). EBSeq: an empirical Bayes hierarchical model for inference in RNA-seq experiments. Bioinformatics 29, 1035–1043. doi: 10.1093/bioinformatics/btt087
Lepiniec, L., Debeaujon, I., Routaboul, J. M., Baudry, A., Pourcel, L., Nesi, N., et al. (2006). Genetics and biochemistry of seed flavonoids. Annu. Rev. Plant Biol. 57, 405–430. doi: 10.1146/annurev.arplant.57.032905.105252
Li, Q., Wang, J., Sun, H., and Shang, X. (2014). Flower color patterning in pansy (Viola wittrockianaGams.) is caused by the differential expression of three genes from the anthocyanin pathway in acyanic and cyanicflower areas. Plant Physiol. Biochem. 84, 134–141. doi: 10.1016/j.plaphy.2014.09.012
Liu, X., Lu, Y., Yuan, Y., Liu, S., Guan, C., Chen, S., et al. (2013). De novo transcriptome of Brassica juncea seed coat and identification of genes for the biosynthesis of flavonoids. PLoS ONE 8:e71110. doi: 10.1371/journal.pone.0071110
Livak, K., and Schmittgen, T. (2001). Analysis of relative gene expression data using real-time quantitative PCR and the 2-ΔΔCT method. Methods 25, 402–408. doi: 10.1006/meth.2001.1262
Lou, Q., Liu, Y., Qi, Y., Jiao, S., Tian, F., Jiang, L., et al. (2014). Transcriptome sequencing and metabolite analysis reveals the role of delphinidin metabolism in flower colour in grape hyacinth. J. Exp. Bot. 65, 3157–3164. doi: 10.1093/jxb/eru168
Lulin, H., Xiao, Y., Pei, S., Wen, T., and Shangqin, H. (2012). The first Illumina-based de novo transcriptome sequencing and analysis of safflower flowers. PLoS ONE 7:e38653. doi: 10.1371/journal.pone.0038653
Martins, T. R., Berg, J. J., Blinka, S., Rausher, M. D., and Baum, D. A. (2013). Precise spatio-temporal regulation of the anthocyanin biosynthetic pathway leads to petal spot formation in Clarkia gracilis (Onagraceae). New Phytol. 197, 958–969. doi: 10.1111/nph.12062
Nishihara, M., Yamada, E., Saito, M., Fujita, K., Takahashi, H., and Nakatsuka, T. (2014). Molecular characterization of mutations in white-flowered torenia plants. BMC Plant Biol. 14:86. doi: 10.1186/1471-2229-14-86
Nishijima, T., Morita, Y., and Sasaki, K. (2013). A torenia (Torenia fournieri Lind. ex Fourn.) novel mutant ‘Flecked’ produces variegated flowers by Insertion of a DNA transposon into an R2R3-MYB gene. J. Jpn. Soc. Hortic. Sci. 82, 39–50. doi: 10.2503/jjshs1.82.39
Ramsay, N. A., and Glover, B. J. (2005). MYB–bHLH–WD40 protein complex and the evolution of cellular diversity. Trends Plant Sci. 10, 63–70. doi: 10.1016/j.tplants.2004.12.011
Robinson, D. O., and Roeder, A. H. (2015). Themes and variations in cell type patterning in the plant epidermis. Curr. Opin. Genet. Dev. 32, 55–65. doi: 10.1016/j.gde.2015.01.008
Schaart, J. G., Dubos, C., Romero De La Fuente, I., Houwelingen, A. M., Vos, R. C., Jonker, H. H., et al. (2013). Identification and characterization of MYB-bHLH-WD40 regulatory complexes controlling proanthocyanidin biosynthesis in strawberry (Fragaria × ananassa) fruits. New Phytol. 197, 454–467. doi: 10.1111/nph.12017
Shi, S. G., Yang, M., Zhang, M., Wang, P., Kang, Y. X., and Liu, J. J. (2014). Genome-wide transcriptome analysis of genes involved in flavonoid biosynthesis between red and white strains of Magnolia sprengeri pamp. BMC Genomics 15:706. doi: 10.1186/1471-2164-15-706
Thomas, M. M., Rudall, P. J., Ellis, A. G., Savolainen, V., and Glover, B. J. (2009). Development of a complex floral trait: the pollinator-attracting petal spots of the beetle daisy, Gorteria diffusa (Asteraceae). Am. J. Bot. 96, 2184–2196. doi: 10.3732/ajb.0900079
Trapnell, C., Williams, B. A., Pertea, G., Mortazavi, A., Kwan, G., Van Baren, M. J., et al. (2010). Transcript assembly and quantification by RNA-Seq reveals unannotated transcripts and isoform switching during cell differentiation. Nat. Biotechnol. 28, 511–515. doi: 10.1038/nbt.1621
Wang, L., Hashimoto, F., Shiraishi, A., Shimizu, K., Aoki, N., and Sakata, Y. (2000). Petal coloration and pigmentation of tree peony cultivars of Xibei (the Northwest of China). J. Jpn. Soc. Hortic. Sci. 69, 233.
Wei, Y. Z., Hu, F. C., Hu, G. B., Li, X. J., Huang, X. M., and Wang, H. C. (2011). Differential expression of anthocyanin biosynthetic genes in relation to anthocyanin accumulation in the pericarp of Litchi chinensis Sonn. PLoS ONE 6:e19455. doi: 10.1371/journal.pone.0019455
Winkel-Shirley, B. (2001). Flavonoid biosynthesis. A colorful model for genetics, biochemistry, cell biology, and biotechnology. Plant Physiol. 126, 485–493. doi: 10.1104/pp.126.2.485
Yamagishi, M. (2013). How genes paint lily flowers: regulation of colouration and pigmentation patterning. Sci. Hortic. 163, 27–36. doi: 10.1016/j.scienta.2013.07.024
Yamagishi, M., Shimoyamada, Y., Nakatsuka, T., and Masuda, K. (2010). Two R2R3-MYB genes, homologs of Petunia AN2, regulate anthocyanin biosyntheses in flower tepals, tepal spots and leaves of Asiatic hybrid lily. Plant Cell Physiol. 51, 463–474. doi: 10.1093/pcp/pcq011
Yamagishi, M., Toda, S., and Tasaki, K. (2014). The novel allele of the LhMYB12 gene is involved in splatter-type spot formation on the flower tepals of Asiatic hybrid lilies (Lilium spp.). New Phytol. 201, 1009–1020. doi: 10.1111/nph.12572
Yanjie, W., Li, D., Chao, Z., and Xiaoqing, W. (2012). Reference gene selection for real-time quantitative PCR normalization in tree peony (Paeonia suffruticosa Andr.). J. Agr. Biotechnol. 20, 521–528.
Yuan, Y. W., Sagawa, J. M., Frost, L., Vela, J. P., and Bradshaw, H. D. (2014). Transcriptional control of floral anthocyanin pigmentation in monkeyflowers (Mimulus). New Phytol. 204, 1013–1027. doi: 10.1111/nph.12968
Zhang, C., Wang, W., Wang, Y., Gao, S., Du, D., Fu, J., et al. (2014). Anthocyanin biosynthesis and accumulation in developing flowers of tree peony (Paeonia suffruticosa) ‘Luoyang Hong’. Postharvest Biol. Technol. 97, 11–22. doi: 10.1016/j.postharvbio.2014.05.019
Zhang, J., Wang, L., Shu, Q., Liu, Z. A., Li, C., Zhang, J., et al. (2007). Comparison of anthocyanins in non-blotches and blotches of the petals of Xibei tree peony. Sci. Hortic. 114, 104–111. doi: 10.1016/j.scienta.2007.05.009
Zhao, D., Jiang, Y., Ning, C., Meng, J., Lin, S., Ding, W., et al. (2014). Transcriptome sequencing of a chimaera reveals coordinated expression of anthocyanin biosynthetic genes mediating yellow formation in herbaceous peony (Paeonia lactiflora Pall.). BMC Genomics 15:689. doi: 10.1186/1471-2164-15-689
Keywords: tree peony, spot, transcriptome, flavonoids, differentially expressed genes (DEGs)
Citation: Zhang Y, Cheng Y, Ya H, Xu S and Han J (2015) Transcriptome sequencing of purple petal spot region in tree peony reveals differentially expressed anthocyanin structural genes. Front. Plant Sci. 6:964. doi: 10.3389/fpls.2015.00964
Received: 04 March 2015; Accepted: 22 October 2015;
Published: 04 November 2015.
Edited by:
Traud Winkelmann, Leibniz Universität Hannover, GermanyReviewed by:
Kevin Davies, The New Zealand Institute for Plant & Food Research Ltd., New ZealandAnne Behrend, Leibniz Institute of Vegetable and Ornamental Crops, Germany
Copyright © 2015 Zhang, Cheng, Ya, Xu and Han. This is an open-access article distributed under the terms of the Creative Commons Attribution License (CC BY). The use, distribution or reproduction in other forums is permitted, provided the original author(s) or licensor are credited and that the original publication in this journal is cited, in accordance with accepted academic practice. No use, distribution or reproduction is permitted which does not comply with these terms.
*Correspondence: Yanwei Cheng, ywei_cheng@163.com
†These authors have contributed equally to this work.