 Ziran Wang
 Yuanyuan Cui
 Alexander Vainstein
 Shangwu Chen3
 Huiqin Ma
- 1Department of Fruit Tree Sciences, College of Horticulture, China Agricultural University, Beijing, China
- 2The Robert H. Smith Faculty of Agriculture, Food and Environment, Institute of Plant Sciences and Genetics in Agriculture, The Hebrew University of Jerusalem, Rehovot, Israel
- 3College of Food Science and Nutrition Engineering, China Agricultural University, Beijing, China
Combined metabolomic and transcriptomic analyses were carried out with fig cultivar Green Peel and its color mutant “Purple Peel.” Five and twenty-two metabolites were identified as having significantly different contents between fruit peels of the two cultivars at young and mature stages, respectively. Cyanidin O-malonylhexoside demonstrated a 3,992-fold increase in the mature purple peel, the first identification of a major cyanidin in fig fruit; cyanidin 3-O-glucoside, cyanidin O-malonylhexoside O-hexoside and cyanidin-3,5-O-diglucoside were upregulated 100-fold, revealing the anthocyanins underlying the purple mutation. Beyond the visible differences, there was very significant accumulation of the colorless flavonoids procyanidin B1, luteolin-3′,7-di-O-glucoside, epicatechin and quercetin-3-O-rhamnoside in the mature “Purple Peel” compared to “Green Peel.” At the young stage, only cyanidin O-malonylhexoside, cyanidin O-malonylhexoside O-hexoside and esculetin were upregulated a few fold in the mutant. Transcriptome analysis revealed a downregulated expression trend of genes encoding phenylpropanoid and flavonoid biosynthetic pathway enzyme in the young “Purple Peel” compared to the young “Green Peel,” whereas significant and simultaneous upregulation was revealed in almost all of the flavonoid and anthocyanin pathway components and relevant transcription factors in the mature-stage mutant. The role of R2R3-MYB transcription factors in the color morph mutation and its possible relation to the activity of retrotransposons are discussed. Moreover, large-scale upregulation of small heat-shock protein genes was found in the mature mutant. This is the first work to reveal comprehensive metabolome and transcriptome network changes underlying a fig mutation in a single horticultural attribute, and its profound effects on fruit nutrition and quality.
Introduction
The fruit peel is in essence the fruit boundary; it maintains fruit integrity and protects it from the external environment. Secondary metabolites in the peel, such as pigments, tannins and aroma compounds, affect fruit appearance, quality and storage (Li et al., 2013). Anthocyanin pigments—pelargonidin, cyanidin, delphinidin, peonidin, petudinin and malvidin, often in their glycosylated form—are commonly identified in pink, red, purple and other deep-colored fruit (Jaakola, 2013).
Anthocyanin metabolism is catalyzed by a number of enzymes from the phenylpropanoid and flavonoid biosynthetic pathways (Bilyk and Sapers, 1986; Pelletier et al., 1997; Falcone Ferreyra et al., 2012). As an initial precursor of anthocyanins and other flavonoids, phenylalanine produces colorless secondary intermediate metabolites that are sequentially catalyzed by phenylalanine ammonia-lyase (PAL), cinnamic acid 4-hydroxylase, 4-coumarate:coenzyme A ligase (4CL), chalcone synthase (CHS), chalcone isomerase (CHI), flavanone 3-hydroxylase (F3H), flavanone 3′-hydroxylase (F3′H), flavonoid 3′5′-hydroxylase, and dihydroflavonol 4-reductase (DFR); unstable colored anthocyanins are then synthesized from the colorless anthocyanins by anthocyanidin synthase (ANS) (Boss et al., 1996; Falcone Ferreyra et al., 2012) via the full metabolic pathway. Finally, the unstable colored anthocyanins are transformed into blue–violet, brick-red or magenta glycosides by UDP-glucose: flavonoid 3-O-glucosyltransferase (UFGT) (Pelletier et al., 1997; Dick et al., 2011; Saito et al., 2013), resulting in different types and numbers of substituents in the B ring of the anthocyanin, which determine the color hue and chromaticity of the anthocyanidins in specific tissues and cellular environments (Espley et al., 2007). Brightly colored fruit commonly show high gene expression of the key downstream enzymes of the anthocyanin biosynthetic pathway, such as those encoding DFR, ANS, and UFGT (Han et al., 2012). Sharply upregulated FcANS1 expression was revealed in the peel of a dark-colored fig during fruit ripening (Cao et al., 2016), whereas UFGT was identified as the critical gene for anthocyanin biosynthesis in grape and strawberry (Kobayashi et al., 2001; Griesser et al., 2008). In recent years, combined high-throughput methods have been used to study color development. Integrated metabolomic and transcriptomic network analyses in fruit and flowers have elucidated a series of secondary metabolites with changes in content, and the corresponding differentially expressed genes (Lou et al., 2014; Matus, 2016), broadening the global view of plant color regulation.
Color mutations are frequently observed in flowers and fruit. The color change is usually produced by single-gene mutations, as in grape (Kobayashi et al., 2004; Hichri et al., 2011a), apple (Xie et al., 2012), pear (Li et al., 2013), and blood orange (Rodrigo et al., 2003). Studies on color mutations have revealed that in addition to the aforementioned structural biosynthetic genes, transcription factors play important roles in modulating anthocyanin biosynthetic pathway activity and color changes (Lepiniec et al., 2006; Saito et al., 2013). The MBW complex [MYB transcription factor in a complex with basic helix-loop-helix (bHLH) and WD40 proteins] has been shown to regulate the expression of anthocyanin genes (Ramsay and Glover, 2005; Petroni and Tonelli, 2011). In the model plant Arabidopsis, MYB transcription factors TT2, PAP1/PAP2, MYB75, MYB90, MYB113, and MYB114, bHLH transcription factors TT8, GL3, and EGL3 and the WD40 repeat protein TTG1 regulate the expression of DFR, ANS, UFGT and other downstream genes, affecting anthocyanin biosynthesis (Gonzalez et al., 2008; Saito et al., 2013). Recently, NAC (NAM, ATAF1,2, CUC2) transcription factors have also been reported to affect anthocyanin biosynthesis in blood-fleshed peaches (Zhou et al., 2015).
As one of the world's earliest cultivated fruit trees, more than 600 fig (Ficus carica L.) cultivars have been described (Flaishman et al., 2008). The fruit are termed syconia and demonstrate a typical double-sigmoid growth curve, including two rapid size-increment phases (phase I and III) and a slow growth phase between them (phase II) (Crane and Baker, 1953; Kislev and Bar-Yosef, 2006). When the fruit matures (in phase III), its colors are diverse; depending on the cultivar, the peel color can be green, yellow–green, yellow, red, purple, or violet–black. Fig peel color is primarily due to the accumulation of anthocyanins, with anthocyanin type and content differing among the different cultivars (Dueñas et al., 2008). Four anthocyanins have been reported in purple fig cultivars, namely cyanidin-3-O-glucoside, cyanidin-3-rutinoside, pelargonidin-3-glucoside and cyanidin-3,5-diglucoside. Yellow fig cultivars accumulate carotenoids such as lutein, zeaxanthin, β-cryptoxanthin and β-carotene (Yemiş et al., 2012). Cyanidin-3-O-glucoside chloride has been reported as the predominant anthocyanin in the peel of cvs. Black Mission and Brown Turkey (Solomon et al., 2006; Ercisli et al., 2012). As these trees rely mainly on vegetative propagation, mutation is an important agent of change in fig cultivar development.
“Green Peel” (“Qingpi”) is a major fig cultivar in China with green-colored fruit; “Purple Peel” (“Zibao”) is a bud mutation of “Green Peel,” with fruit that turn an appealing dark purple in phase III. In this study, targeted metabolome and transcriptome comparisons were carried out using young and mature fruit of “Green Peel” and “Purple Peel” fig. Beyond identifying specific anthocyanins in the mutant, we reveal very significant accumulation of a set of flavonoids and procyanidin B1, together with systematic transcriptional changes for structural genes, transcription factors and other regulators of the phenylpropanoid and flavonoid biosynthetic pathways, providing valuable information on fruit color and its complex effect on fruit quality components.
Materials and Methods
Plant Materials and Treatments
The common fig cultivar Green Peel and its bud mutation cv. Purple Peel were cultivated in Weihai City (37°5′ N, 122°1′ W), Shandong Province in China. The soil type is sandy loam. The sampled fig orchard is 1 km from the sea and managed in the same way as the other orchards in this major fig-growing region in China. There were no significant or remarkable differences in 63 tested/observed morphological/horticultural items listed by the UPOV (International Union for the Protection of New Varieties of Plants, Geneva, Switzerland, http://upov.int) [UPOV TG/265/1 (E)] between “Green Peel” and its purple mutant, except for fruit color at ripening (Xu et al., 2016). The main crop fruit used for the metabolome study and RNA-sequencing (RNA-Seq) were collected on 18 Oct 2015, and fruit samples used for RT-qPCR validation were collected on 25 Oct 2016. The fig has a continuous fruiting characteristic, with different development stages of the main crop fruit growing along the shoots. Fruits in the late stage of phase II and in the middle of phase III were sampled from the two cultivars and termed “Green Peel” young fruit (GY), “Purple Peel” young fruit (PY), “Green Peel” mature fruit (GM) and “Purple Peel” mature fruit (PM), respectively. Three biological replicates were collected per sample, each with 20 fruits randomly collected from 15 fig trees in the same plot of the commercial orchard. We took the figs back to the laboratory, and the peel (about 2 mm thick) was carefully excised with a razor blade, collected, frozen in liquid nitrogen, roughly ground and kept at −80°C for further use.
Extraction and Separation of Polyphenol Secondary Metabolites
Fig peel samples were further ground to a fine powder in liquid nitrogen and thoroughly mixed, then a ca. 3-g sample was freeze-dried and crushed using a mixer mill (MM 400, Retsch) with zirconia beads for 1.5 min at 30 Hz. Sample (100 mg) was extracted with 1 mL 70% methanol containing 0.1 mg/L lidocaine as an internal control for 12 h on a rotating wheel at 4°C in the dark. After 10,000 g centrifugation for 10 min at 4°C, the extracts were absorbed (CNWBOND Carbon-GCB SPE Cartridge, 250 mg, 3 mL; ANPEL, Shanghai, China, www.anpel.com.cn) and filtered (SCAA-104, 0.22-μm pore size; ANPEL) before LC–MS analysis. A quality-control sample was prepared by equal blending of all samples; during the assay, the quality control sample was run every 10 injections to monitor the stability of the analytical conditions.
Samples (5 μL) were injected into a HPLC system (Shim-pack UFLC SHIMADZU CBM30A) equipped with a C18 column (Waters ACQUITY UPLC HSS T3, 1.8 μm, 2.1 mm × 100 mm). The binary solvent system was ultra-pure water containing 0.04% acetic acid as mobile phase A and acetonitrile containing 0.04% acetic acid as mobile phase B. The A:B (v/v) gradient was 95:5 at 0 min, 5:95 at 11.0 min, 5:95 at 12.0 min, 95:5 at 12.1 min, 95:5 at 15.0 min. The flow rate was kept at 0.40 mL/min, and the column temperature was maintained at 40°C.
Metabolite Identification and Quantification
The HPLC effluent was connected to an electrospray ionization (ESI)-triple quadrupole-linear ion trap–MS/MS system (Applied Biosystems 4500 Q TRAP). Metabolite identification and quantification were carried out following Chen et al. (2013). In brief, the inspected mass spectra were 50–1,000 m/z. Nitrogen was used as both the nebulizer/auxiliary and collision gas. The ESI source was set to positive ionization mode, the source temperature was held at 550°C; the capillary voltage was 5.5 kV. The monitoring mode was set to multiple-reaction monitoring (MRM).
Metabolite identification was based on the primary and secondary spectral data annotated against public databases, namely MassBank (http://www.massbank.jp/), KNAPSAcK (http://kanaya.naist.jp/KNApSAcK/), HMDB (http://www.hmdb.ca/), MoToDB (http://www.ab.wur.nl/moto/), and METLIN (http://metlin.scripps.edu/index.php), following the standard metabolic operating procedures. Metabolite quantification was carried out using MRM. Partial least squares discriminant analysis (PLS–DA) was carried out with the identified metabolites. Metabolites with significant differences in content were set with thresholds of variable importance in projection (VIP) ≥ 1 and fold change ≥ 2 or ≤ 0.5.
RNA-Seq and Annotation
RNA isolation and purification, and cDNA library construction and sequencing were as performed previously (Chai et al., 2017). In brief, fig samples' total RNA was extracted by the CTAB method (Cao et al., 2016). RNA quantity and quality were determined by NanoDrop ND1000 spectrophotometer (NanoDrop Technologies, Wilmington, DE, USA) and the Agilent Bioanalyzer 2100 system (Agilent Technologies, Palo Alto, CA, USA), respectively. RNA integrity was determined by 1% agarose gel electrophoresis, and the RNA concentration was adjusted for uniformity. mRNA was isolated from total RNA using magnetic beads with oligo (dT); cDNA was synthesized using a cDNA Synthesis Kit (TaKaRa) and linking the sequencing adapter to both ends (Chai et al., 2014). The library preparations were sequenced on an Illumina HiSeq 4000 platform and the unigene sequences obtained from our laboratory transcriptome database by RSEM software were integrated for annotation (Chai et al., 2017). The whole set of annotated genes can be found in the National Center for Biotechnology Information (NCBI) SRA database (accession number SRP114533).
Analysis of Differentially Expressed Genes (DEGs)
For gene-expression analysis, counts were mapped to the reading of each gene by HTSeq v0.5.4p3 and then normalized to FPKM (fragments per kilobase of transcript per million mapped reads) following Mao et al. (2005). DEGs were recruited by log2 (fold change) ≥ 1 and corrected P ≤ 0.005. All DEGs were analyzed by gene ontology (GO) enrichment using GOseq (1.10.0) (Götz et al., 2008) and Kyoto Encyclopedia of Genes and Genomes (KEGG) enrichment using KOBAS software (Mortazavi et al., 2008).
Real-Time Quantitative PCR (RT-qPCR) Validation
RNA extraction and quality detection were carried out by RNA-Seq. Reverse transcription was performed using HiFi-MMLV cDNA First-Strand Synthesis Kit (Invitrogen). Twenty color-related genes were selected for RT-qPCR with specific primers designed by Primer Premier 5 software (Supplementary Table 1). The RT-qPCR was performed with an ABI 7500 Fast Real-Time Detection System (Applied Biosystems) using the Ultra SYBR Mix kit (CWBIO, Beijing, China). The amplification system consisted of 10.4 μL Ultra SYBR Premix System II, 0.8 μL of 10 μmol/L upstream primer, 0.8 μL of 10 μmol/L downstream primer, 2 μL template, and sterile distilled water to a total volume of 20 μL. The amplification program was 95°C for 10 min, followed by 40 cycles of 95°C for 15 s and 55°C for 1 min. Relative quantitative analysis of data was performed by the 2−ΔΔCT method with reference genes β-actin and 18S-RNA. Three technical replicates were carried out for each sample to ensure reproducibility and reliability. Statistical analysis of variance (ANOVA) followed by Duncan's new multiple range test were performed with SPSS Version 16.0 (Chicago, IL, USA). The significance level was set to P < 0.05.
Results
Phenotype of “Green Peel” and Its Mutant “Purple Peel”
No morphological differences were detected between the fruit of “Green Peel” and its purple mutant, except for fruit color at ripening. The young fruit used in the present study were harvested in the late stage of fig development phase II, when both “Green Peel” and its purple mutant have a deep green appearance, with a very slight copper hue on the surface of the purple mutant. When the fruits were halved, the texture was hard, and the internal female flowers were a pink–garnet color (Figures 1A,B).
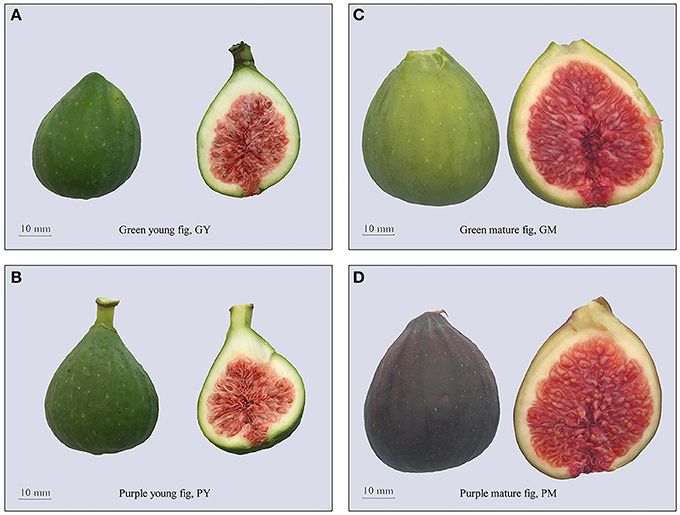
Figure 1. The phenotype of fig (Ficus carica L.) cv. Green Peel and its mutation cv. Purple Peel at young and mature stages. (A) “Green Peel” young fruit. (B) “Purple Peel” young fruit. (C) “Green Peel” mature fruit. (D) “Purple Peel” mature fruit. GY, “Green Peel” young fruit; GM, “Green Peel” mature fruit; PY, “Purple Peel” young fruit; PM, “Purple Peel” mature fruit.
Fig development is very rapid in phase III. The fruit quickly enlarge, reaching their final size and harvest quality in 5–7 days. “Green Peel” fruit turned yellow–green in appearance, whereas the mutant developed a dark purple peel. Mature fruit were soft and succulent, and female flowers of both cultivars were deep red inside the fruit (Figures 1C,D). As a measure of fruit quality, “Green Peel” and its purple mutant had an average fruit weight of 33.9 ± 2.66 g and 33.4 ± 2.4 g, 18.51 ± 1.03 and 18.34 ± 1.15 °Brix in soluble solids, and peel thickness of 2.14 ± 0.32 and 2.16 ± 0.24 mm, respectively, with no significant differences in the assayed horticultural attributes.
Targeted Secondary Metabolite Assay
The general secondary metabolite profiles of “Green Peel” and “Purple Peel” fig fruit showed marked differences (Supplementary Figures 1, 2). A total of 101 metabolites were identified from GY, PY, GM, and PM samples, each with three biological replicates: 18 phenylpropanoids, 40 flavones, 12 flavonols, 16 flavonoids, 8 anthocyanins, 5 proanthocyanidins, and 2 catechin derivatives (Table 1). Setting VIP ≥ 1.0 together with fold change ≥ 2 or ≤ 0.5 as thresholds for significant differences, the contents of 5 and 22 metabolites were significantly different between “Green Peel” and its purple mutant at the young and mature stage, respectively.
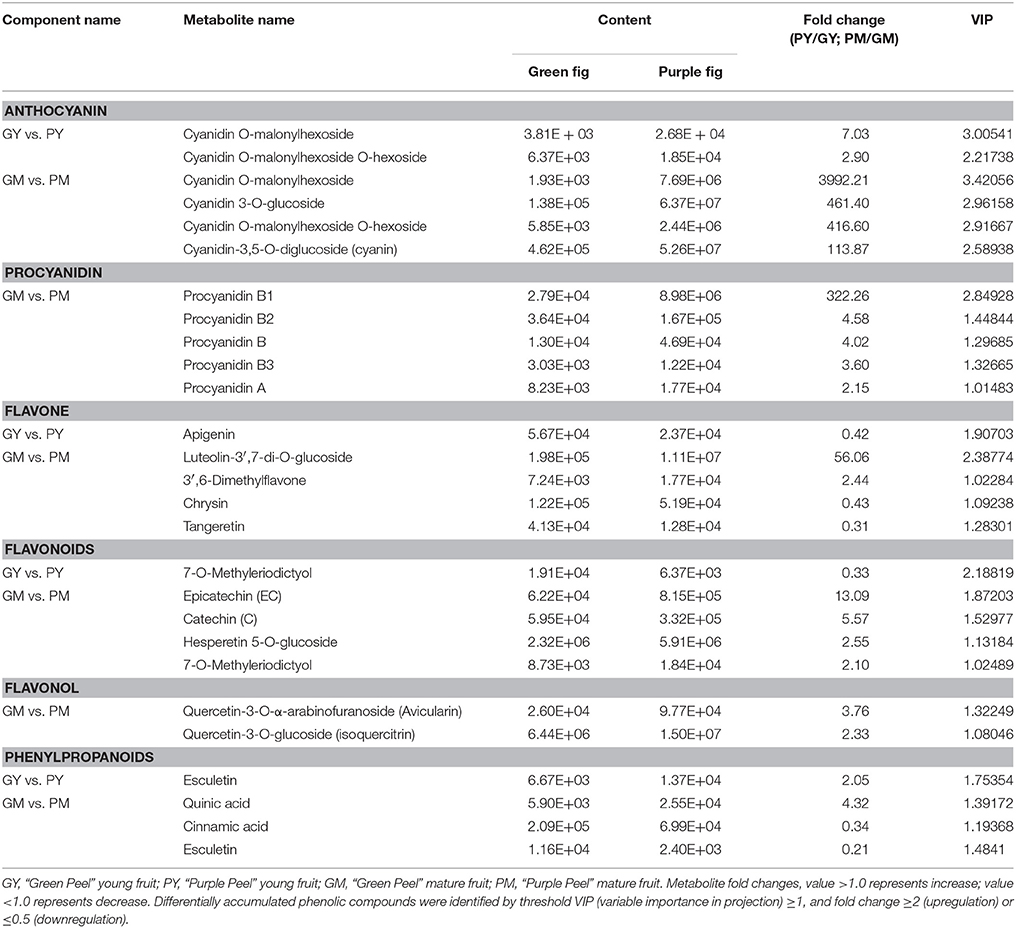
Table 1. Differentially accumulated phenolic compounds in the peel of “Green Peel” and “Purple Peel” fruit.
Anthocyanins
Four kinds of cyanidin glycosides, delphinidin O-hexoside, malvidin-3-O-galactoside and rosinidin O-hexoside were identified in all samples. In the PY peel, cyanidin O-malonylhexoside and cyanidin O-malonylhexoside O-hexoside were found with 7.03- and 2.9-fold increments compared to GY, which could explain the slight hue on the PY peel. At the mature stage, cyanidin glucoside pigments were responsible for the mutant purple color: cyanidin O-malonylhexoside was increased 3,992.21-fold in the PM vs. GM samples, whereas cyanidin 3-O-glucoside, cyanidin O-malonylhexoside O-hexoside and cyanidin-3,5-O-diglucoside increased 461.4-, 416.6-, and 113.87-fold, respectively (Table 1).
Flavonoids, Flavones, and Flavonols
Among the monomeric flavonoids, epicatechin, catechin, hesperetin 5-O-glucoside, and 7-O-methyleriodictyol demonstrated significantly higher contents in the PM; epicatechin was 13.09-fold its content in GM. In young fig fruit samples, apigenin and flavanone 7-O-methyleriodictyol showed 1.2- and 1.6-fold decreases in GY vs. PY (Table 1), but no other differences met the criteria.
The A- and B-type procyanidins are dimer flavonoids; their contents only differed in the mature fruit group. The content of procyanidin B1 [epicatechin-(4β → 8)-catechin] was 322.26-fold higher in the GM vs. PM fruit. Procyanidins B2 [(–)-Epicatechin-(4β → 8)-(–)-epicatechin], B3 [catechin-(4α → 8)-catechin], A1 [epicatechin-(2β → 7,4β → 8)-catechin] and A2 [epicatechin-(2β → 7,4β → 8)-epicatechin] were 2- to 4.5-fold higher in the GM vs. PM (Table 1), which were much less than that of procyanidin B1 in the fruit.
For the flavones, luteolin-3′,7-di-O-glucoside and 3′6-dimethylfavone contents were 56.06- and 2.44-fold higher, respectively, in the GM vs. PM. Chrysin and tangeretin revealed significant decreases in the PM, whereas apigenin, the upstream substrate of luteolin, was remarkably lower in the GY vs. PY. A significant increase was found for two quercetin glycosides in the GY vs. PY with a moderate fold change (Table 1).
Phenylpropanoids
The phenylpropanoid biosynthetic pathway is upstream of the anthocyanin and flavonoid biosynthetic pathways. We identified 18 general metabolites of phenylpropanoids. Esculetin and quinic acid contents were 2.05- and 4.33-fold higher in the PY and PM peels, respectively, whereas cinnamic acid and esculetin contents in the PM were less than half that in the GM (Table 1).
Transcriptome Analysis
RNA-Seq produced 31,591,009, 25,146,641, 32,429,280 and 27,147,120 clean reads from GY, PY, GM and PM libraries, respectively. Clean data from the 12 libraries of 4 samples (3 replicates for each samples), were averaged to 96,158 transcripts of 796.42 bp in length, and 79,355 unigenes were obtained using Trinity software (Supplementary Table 2). The N50 value was 1236 bp, and the average length of the unigenes was 683.07 bp.
There were 2,385, 1,087, 3,911, and 5,413 DEGs in the four comparison groups: GY vs. PY, GM vs. PM, GY vs. GM, and PY vs. PM, respectively. Comparing the two cultivars, 1,009 and 616 genes were upregulated, and 1,376 and 471 genes were downregulated in GY vs. PY and GM vs. PM, respectively (Figure 2A). Venn diagram analysis showed 51 DEGs that were common to all four comparison groups (Figure 2B). GO analysis assigned 46,748, 34,527 and 22,307 unigenes to the biological process, cell component and molecular functional class, respectively (Supplementary Figure 3). The clusters of orthologous groups of proteins database (COG) annotation allocated 15,726 unigenes into 25 COG categories (Supplementary Figure 4); the general functional cluster prediction (2,115 unigenes, 13.45%) was the largest group, followed by signaling mechanism (1,897 unigenes, 12.06%), posttranslational modification and protein turnover (1,572 unigenes, 10.00%).
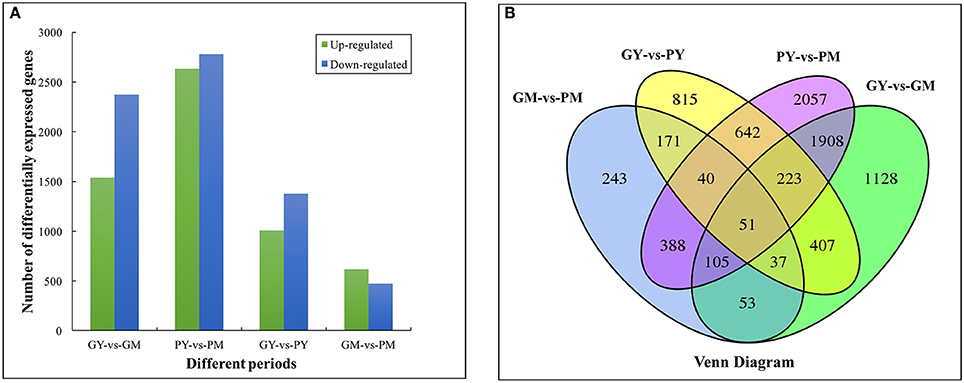
Figure 2. Functional annotation and classification of differentially expressed genes between young and mature stages of “Green Peel” and “Purple Peel.” (A) Numbers of differentially expressed genes. (B) Venn diagram. GY, “Green Peel” young fruit; GM, “Green Peel” mature fruit; PY, “Purple Peel” young fruit; PM, “Purple Peel” mature fruit.
KEGG analysis revealed plant hormone signal transduction, starch and sucrose, phenylpropanoid biosynthesis and alpha-linolenic acid metabolism as the significantly changed pathways in GY vs. PY. Plant hormone signal transduction, phenylpropanoid and flavonoid biosynthetic pathways were significantly changed in GY vs. GM and GM vs. PM (Table 2).
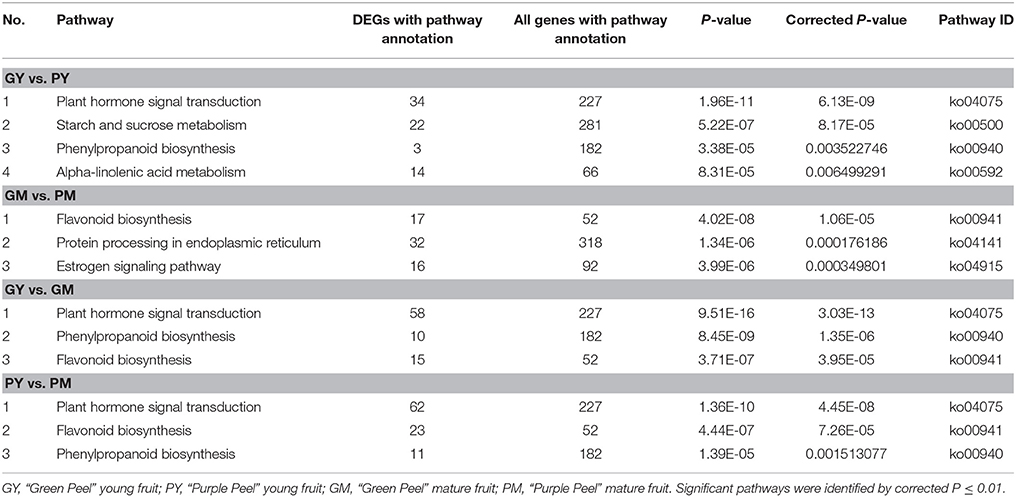
Table 2. Significantly enriched KEGG pathways between “Purple Peel” and “Green Peel” figs.
Phenylpropanoid, Flavonoid, and Anthocyanidin Biosynthetic Pathways
At maturity, most of the secondary metabolite pathways were strengthened by gene-expression upregulation in the “Purple Peel” mutant fruit, except for the DEGs PAL and 4CL. Two PAL genes (c388_g1 and c388_g2) were downregulated (-1.14- and−1.02-fold) and five 4CL unigenes were downregulated, in line with the decreased cinnamic acid content in the PM peel. Simultaneous large-scale upregulation of structural genes of the phenylpropanoid, flavonoid and anthocyanin biosynthetic pathways, including CHS, CHI, and flavonol synthase (2 DEGs each), UFGT (4 DEGs), and other genes (1 DEG) dominated secondary metabolite synthesis modulation in GM vs. PM (Figure 3). High fold upregulation and high RPKM (reads per kilobase of transcript per million mapped reads) enhanced the flux in the flavonoid and anthocyanidin biosynthetic pathways. Structural genes CHS (c46769_g2) and CHI (c658_g1) showed 3.38- and 4.27-fold increments, F3H (c72067_g1) 5.47-fold upregulation, F3′H (c42263_g3) 2.65-fold upregulation, together with 2 flavonol synthase genes that not only catalyze the conversion from kaempferol to quercetin (Pelletier et al., 1997), but also from apigenin to luteolin (Martens et al., 2003; Jaakola, 2013); this could largely explain the high accumulation of luteolin-3′,7-di-O-glucoside in the PM (Table 1). Catechin is produced from leucocyanidin catalyzed by leucoanthocyanidin reductase (LAR) (c31753_g1, 3.95-fold upregulation); the enzyme also catalyzes leucodelphinidin and leucopelargonidin to gallocatechin and afzelechin, respectively, neither of which demonstrated significant content differences between the cultivars, corresponding to the lower change in content of A-type procyanidin (Table 1, Figure 3).
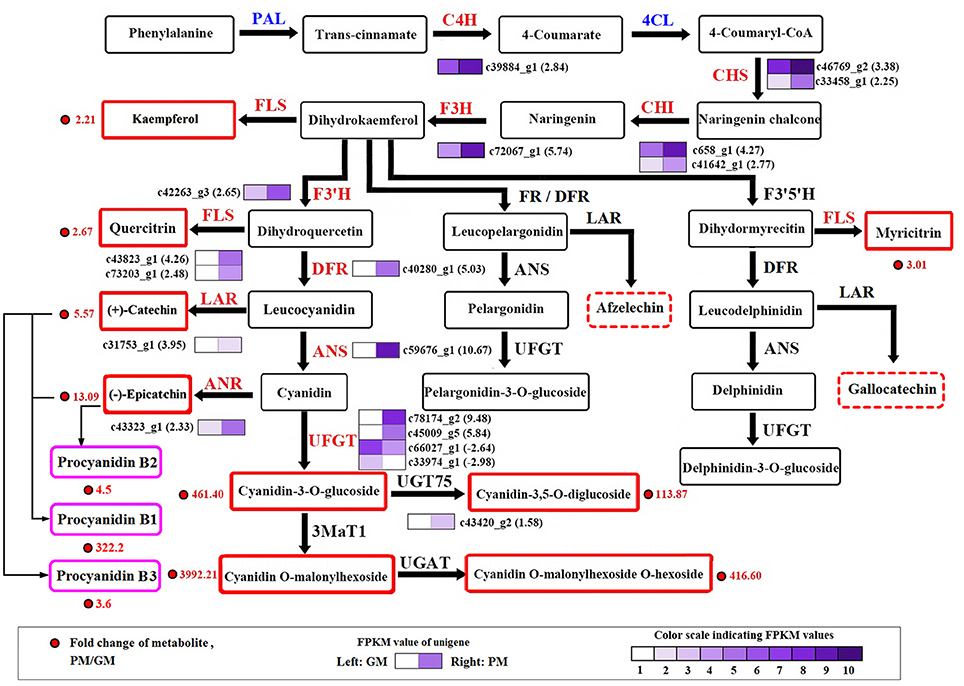
Figure 3. Transcript profiling of genes in the phenylpropanoid and flavonoid biosynthetic pathways in cv. “Green Peel” and “Purple Peel” at mature stages. GM, “Green Peel” mature fruit; PM, “Purple Peel” mature fruit. Grids with color-scale from light to dark represent RPKM values 0–10, 10–20, 20–40, 40–80, 80–160, 160–320, 320–640, 640–1,280, 1,280–2,560, and over 2,560, respectively. PAL, phenylalanine ammonia-lyase; C4H, cinnamic acid 4-hydroxylase; 4CL, 4-coumarate CoA ligase; CHS, chalcone synthase; CHI, chalcone isomerase; F3H, flavanone 3-hydroxylase; F3′H, flavanoid 3′-hydroxylase; DFR, dihydroflavonol 4-reductase; FR, flavanone 4-reductase; ANS/LDOX, anthocyanidin synthase/leucocyanidin oxygenase; UFGT, UDP glucose-flavonoid 3-O-glcosyl-transferase; FLS, flavonol synthesis; LAR, leucocyanidin reductase; ANR, anthocyanin reductase.
LAR expression (c31753_g1) was upregulated 3.95-fold. ANS (c59676_g1) was one of the most significantly DEGs in the GM vs. PM group, increasing 10.67-fold, followed by two UFGT genes (c78174_g2 and c45009_g5) which showed 9.98-fold and 5.84-fold upregulation in the PM fruit (Figure 3). Anthocyanidin 3-O-glucosyltransferase 2 (c45009_g5, 5.84-fold upregulation) catalyzes cyanidin to cyanidin-3-O-glucoside. Cyanidin-3,5-O-diglucoside can be glycosylated from cyanidin-3-O-glucoside or cyanidin-5-O-glucoside; UDP-glycosyltransferase 75D1 (c43420_g2, 1.58-fold upregulation) catalyzes cyanidin-3-O-glucoside to cyanidin-3,5-O-diglucoside, which also supports the high measured accumulation of the two cyanidin mono- and di-glucosides, flavonoids and procyanidins in the “Purple Peel” fig (Table 1, Figure 3).
Transcription Factors
There were 74 and 45 differentially expressed transcription factor genes identified in GY vs. PY and GM vs. PM, respectively, whereas from young fruit to mature fruit, 140 and 141 DEGs were identified as transcription factors in GY vs. GM and PY vs. PM, respectively (Table 3, Supplementary Table 3). The differentially expressed transcription factors were annotated as encoding MYB, bHLH, AP2/ERF, WRKY, HD-ZIP, heat-shock transcription factor (HSF), NF-Y, DIVARICATA, and MADS-box (Table 3).
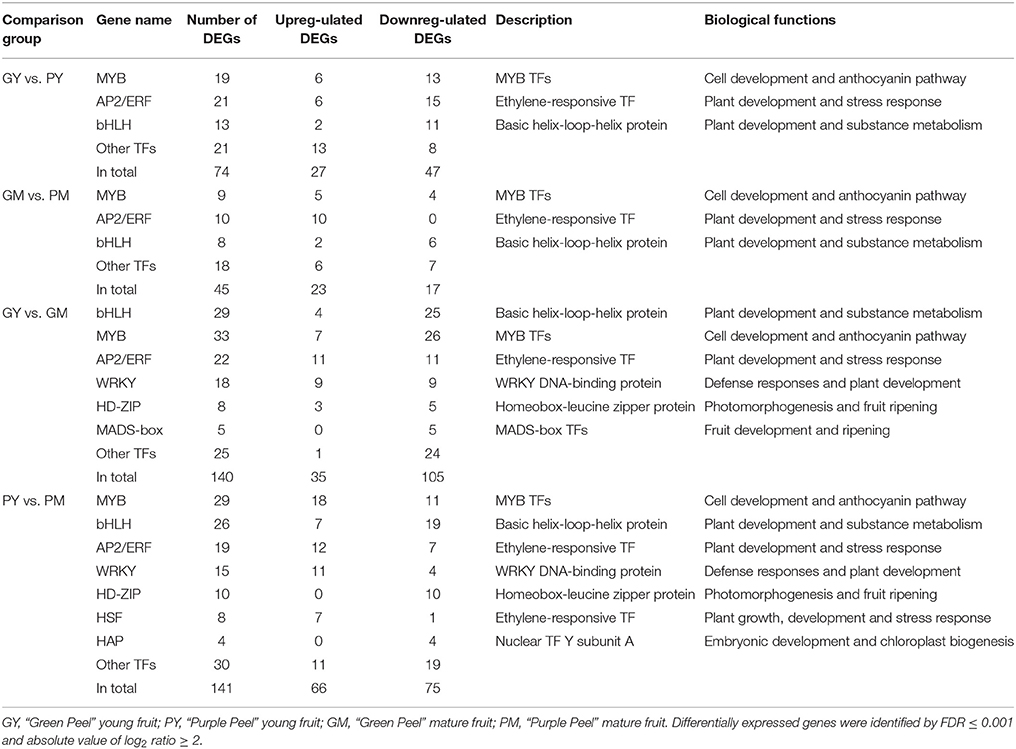
Table 3. Differentially expressed transcription factors in the peel of young and mature fruit of “Green Peel” and “Purple Peel” fig.
Almost all of the MYB DEGs could be further assigned to the R2R3 MYB family, which is closely associated with anthocyanin biosynthesis in fruit trees (Allan et al., 2008; Liu et al., 2016). Nineteen and nine R2R3-MYBs were differentially expressed in the young fruit (GY vs. PY) and mature fruit (GM vs. PM), respectively. Among the MYB DEGs in young fruit, 6 genes were found upregulated and 13 downregulated in PY (Figure 4A). In mature fruit, there were 9 recognized MYB DEGs: 5 more highly expressed MYBs in PM, and 4 more highly expressed MYBs in GM, but all with low FPKM values (Figure 4B). Along fig fruit development, 33 MYB DEGs (7 upregulated and 26 downregulated) were illustrated in GY vs. GM, 29 MYB DEGs (18 upregulated and 11 downregulated) in PY vs. PM (Table 3). Nine MYBs had significantly increased transcripts in both PY vs. PM and GM vs. PM, 4 of them also showing upregulation in GY vs. GM.
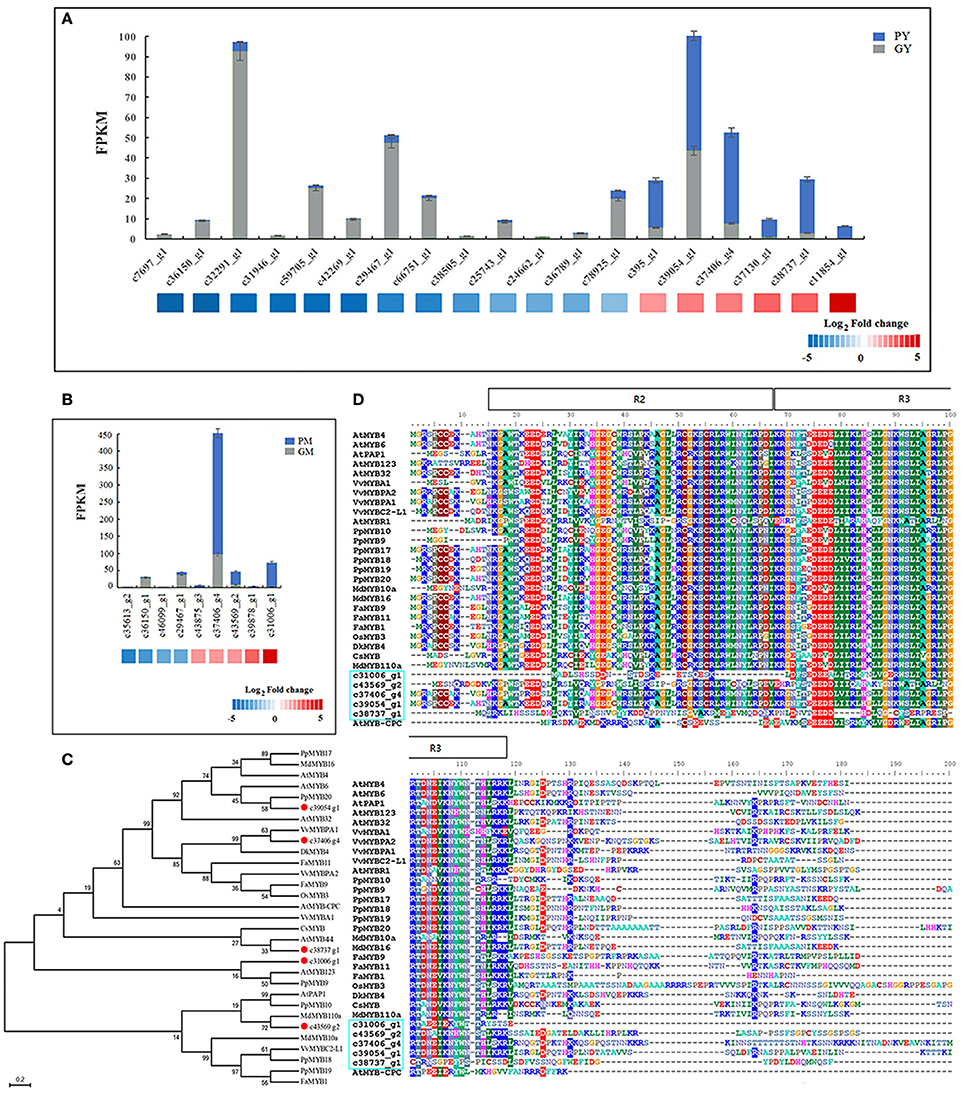
Figure 4. Differentially expressed MYB genes between “Green Peel” and “Purple Peel” fruit at young and mature stages. (A) Differentially expressed MYB genes between the two cultivars' young fruit. (B) Differentially expressed MYB genes between the two cultivars' mature fruit. (C) Phylogenetic analysis of five fig MYBs recruited by high fold expression change. (D) R2R3-MYB protein sequence alignment of five fig MYBs recruited by high fold expression change; R2R3 motif is indicated at the top.
We further recruited five R2R3-MYBs—unigenes c31006_g1, c39054_g1, c37406_g4, c38737_g1, and c43569_g2—which showed high fold change in expression between the two cultivars and/or developmental stages (Figures 4A,B). The expression of c43569_g1 and c31006_g1 was specifically increased in PM. Protein sequence comparison revealed that c43569_g1 is highly homologous (72%) to MdMYB110a of apple (Figure 4C), which plays a key role in the red flesh apple phenotype (Chagné et al., 2013). The unigene c31006_g1 clustered with AtMYB123 of Arabidopsis and PpMYB9 of Prunus persica, which regulates anthocyanin accumulation in different plant tissues (Zhou et al., 2016). The highly expressed MYB c39054_g1 in PY was closely related to the flavonoid MYB repressor PpMYB20 (Figure 4C; Zhou et al., 2016), whereas c37406_g4 and c38737_g1 clustered with the anthocyanin activator groups, with high similarity to AtMYB44, VvMYBPA1 and VvMYBPA2, which regulate anthocyanin biosynthesis in Arabidopsis and grape (Terrier et al., 2009; Jung et al., 2010; Zhou et al., 2016). Figure 4D illustrates the fig R2R3-MYBs' highly homologous R2 and R3 DNA-binding domains at the N-terminus (Espley et al., 2007), and highly variable truncated C-terminal region, which might relate to fig color morph regulation.
Thirteen bHLH DEGs were found in young fruit (GY vs. PY); 2 were highly expressed in PY, and 11 were downregulated. Eight bHLH revealed differences in mature-stage fruit (GM vs. PM): 2 bHLH were highly expressed in PM (Table 3). During fruit development, 29 bHLH DEGs were screened in the Green Peel cultivar, including 4 upregulated and 25 downregulated from young to mature fruit, whereas among 26 bHLH of the Purple Peel cultivar, 7 contigs or transcripts were upregulated and 19 were downregulated from young to mature fruit (Table 3). We found 2 bHLH DEGs (FPKM ≥ 300)—c21697_g1 and c43844_g1—expressed at very high levels in the PY, that decreased rapidly at the mature stage of “Purple Peel,” and their expression levels were very low in GY and GM (Supplementary Figure 5).
Heat-Shock Proteins (HSPs)
HSPs are involved in protein synthesis, folding, cell localization and protein degradation; they also play a role in maintaining intercellular environmental stability (Wang et al., 2004; Waters, 2013). In the mature fig fruit, 15 small HSP family DEGs were identified, including 9 HSP20, 3 HSP90, 2 HSP70, and 1 HSP40, all of which showed significantly higher expression in the GM vs. PM (Table 4); moreover, 3 genes encoding heat-shock transcription factors (HSFs) (c45384_g1, c26517_g2, and c43194_g3) showed a significant expression increment in the PM (Table 4). HSFs bind to the heat shock element of the HSP gene promoter to form transcription complexes, which promote HSP gene expression (Scharf et al., 2012). HSPs are molecular chaperones, also known as stress-induced proteins, which function in protein folding and assembly, protect enzymes from denaturation and cellular degeneration with pigment and flavonoid accumulation, responding to stress and maturation in fig (Sun et al., 2002; Neta-Sharir et al., 2005).
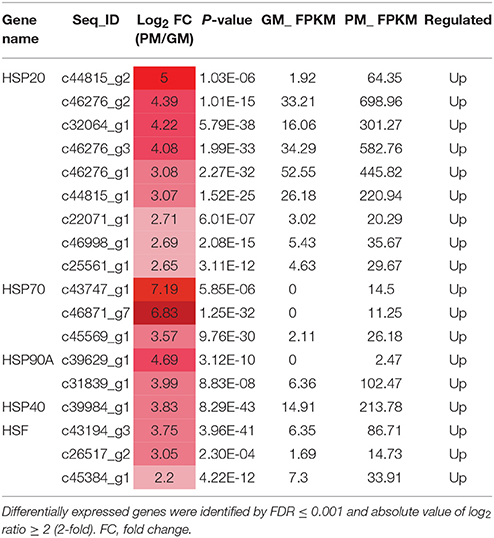
Table 4. Differentially expressed heat-shock protein (HSP) and heat-shock transcription factor (HSF) genes in the mature stage of “Purple Peel” and “Green Peel” fig.
RT-qPCR Validation of the Transcriptomic Data
To validate the key RNA-Seq results, we selected 20 DEGs (4 transcription factor genes, 4 phenylpropanoid biosynthetic pathway genes, and 12 flavonoid biosynthetic pathway genes) (Supplementary Figure 6) and analyzed their expression levels in PY, GY, PM, and GM using RT-qPCR. The expression patterns of these genes were very similar to the RNA-Seq results, with correlation coefficients (R2) > 0.83 (Figure 5). The results validated the relevance of the RNA-Seq data and RT-qPCR showed good consistency for both up- and downregulated gene expression.
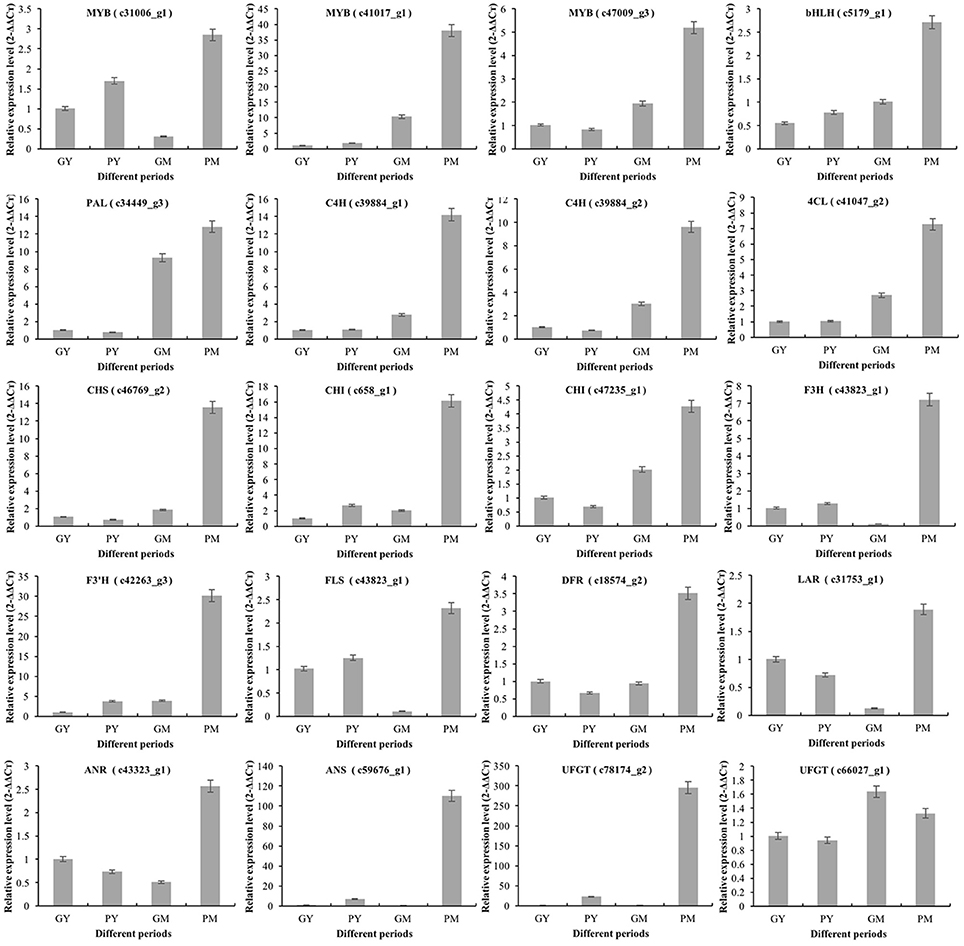
Figure 5. Expression of representative genes in young and mature stages of “Purple Peel” and “Green Peel” fig fruit validated by qRT-PCR. GY, “Green Peel” young fruit; GM, “Green Peel” mature fruit; PY, “Purple Peel” young fruit; PM, “Purple Peel” mature fruit.
Discussion
Natural mutations have been, and still are, observed, deliberately selected for and used in fruit crop production. However, the resultant differences in gene structure and expression regulation in the mutants has only recently begun to be revealed. A combined metabolome and transcriptome study can provide us with new, large-scale information on the shifted secondary metabolic product profiles and the underlying modifications in gene-expression networks.
Large-Scale Secondary Metabolite and Pathway Regulation
Color mutants are widely used in horticultural and other crops, especially those that are commonly propagated vegetatively, such as most fruit trees. The color mutants are usually promoted and regarded as presenting a single-attribute difference. Herein, we identified 4 cyanidin glycosides in “Purple Peel” fig fruit, determined the substance responsible for the mutated purple color, and more importantly, revealed highly significant accumulation of colorless procyanidin B1, luteolin-3′,7-di-O-glucoside, epicatechin and other important secondary metabolites in the phenylpropanoid and flavonoid biosynthetic pathways. These findings illustrate, for the first time, a panorama of the large-scale secondary metabolite changes for a color mutation in the ancient fruit crop Ficus carica. The cyanidin glucosides in PM differed from those in other dark-colored fig cultivars, such as cyanidin-3-O-rhamnoglucoside (cyanidin-3-O-rutinoside), reported as the main anthocyanin in the peel of “Black Mission,” “Bursa,” and “Brown Turkey” figs (Solomon et al., 2006; Ercisli et al., 2012). Acyl-modified anthocyanins are common in Arabidopsis (D'Auria et al., 2007), and increased cyanidin 3-O-(malonyl)-glucoside has been reported in the cool-cultivated red lettuce to be the only pigment responding to temperature (Becker et al., 2014). A comparison of different cranberry cultivars indicated that highly pigmented berries also have higher contents of colorless flavonol (Bilyk and Sapers, 1986). Anthocyanins and flavonoids affect fruit color and taste; their antioxidant and nutraceutical capacities confer healthful properties, reducing the risk of cardiovascular morbidity and mortality (Holt et al., 2002; Wu et al., 2012).
The large-scale transcription expression increments in phenylpropanoid and flavonoid biosynthetic pathway genes in “Purple Peel” fig, revealed by RNA-Seq, strongly supported our metabolome results. Similarly, most of the structural genes in the anthocyanin biosynthetic pathway are upregulated during fruit development of red vs. green color mutations of pear (Yang et al., 2013). Coordinated expression changes of F3H, F3′H, DFR1, ANS, and UFGT have also been demonstrated in differently colored Chinese bayberries (Niu et al., 2010), grapes (Boss et al., 1996), Arabidopsis (Pelletier et al., 1997; Saito et al., 2013) and other plants (Quattrocchio et al., 1993).
The mutated color attribute is observed late in fruit development. However, significant changes in phenylpropanoid biosynthesis were found between the young fruit of the two cultivars, indicating that the mutation-induced change in expression could occur far earlier than the emergence of the phenotype. Anthocyanins are end products of the flavonoid biosynthetic pathway; our finding of upregulation of almost all of this pathway's genes, from the upstream CHS to the end gene UFGT, during “Purple Peel” fruit ripening suggests that fundamental transcriptional regulation of the flavonoid and pigment biosynthetic pathways could be a major factor in the mutation, coordinating gene expression, fruit coloration, and the accumulation of flavonoid intermediates and procyanidins. In crabapple cultivars with dark red, pink and white petal colors, CHS has been found responsible for the red coloration (Tai et al., 2014). Upstream pathway expression regulation has also been reported in arctic mustard flowers, which have a broad range of purple to white petal color polymorphisms; in the white-flowered individuals, CHS was significantly repressed, whereas the expression of other structural genes in the anthocyanin biosynthetic pathway was similar to that in the colored individuals (Dick et al., 2011). The enzymes DFR and LAR are shared by the anthocyanin and flavanone biosynthetic pathways. DFR from different plants has specific substrate biases for dihydroquercetin, dihydrokaempferol and dihydromyricetin (Hua et al., 2013; Saito et al., 2013). LAR belongs to the reductase–epimerase–dehydrogenase family and the short-chain dehydrogenase/reductase superfamily, and each of the LARs has a specific C-terminal domain which may have different substrate specificity (Tanner et al., 2003). From our metabolome and transcriptome data, it seems that fig DFRs and LARs favor dihydroquercetin to produce leucocyanidin and catechin, rather than afzelechin and gallocatechin synthesis (Figure 3); thus, only cyanidin glycosides were the dominant anthocyanins, as with the B-type procyanidin in fig fruit (Table 1).
Transcription Factors in Fruit Color Formation and Ripening
Our finding of upregulation of most or all of the biosynthesis genes in the mutant fruit suggests mutation of a transcription factor. MYBs play a critical role as key transcription factors for all of the anthocyanin biosynthetic pathway genes or for the regulation of single key genes in fruit and flower color formation (Kobayashi et al., 2004; Espley et al., 2007; Tai et al., 2014). In apple, CHS is positively regulated by MYB4 and MYB5 expression (Clark and Verwoerd, 2011), whereas strawberry FcMYB1 switches anthocyanins and flavonoid-derived compound accumulation on and off (Salvatierra et al., 2013). Loss of the MYB cis-element in the CHS promotor leads to white crabapple morphs (Dick et al., 2011). In our study, differentially expressed MYBs were recruited in the “Purple Peel” fig (Table 3, Figure 4), indicating that MYBs in the MBW complex are key regulators of the pathway of anthocyanin and flavonoid biosynthesis in fig.
Hypothesized Nature of the Fig Purple Mutation
Red and black dominate the color spectrum of bird-dispersed fruit worldwide (Willson and Whelan, 1990). Anthocyanin synthesis and pigmentation can be regarded as the wild type for the fruit color trait. In grapes, white cultivars are thought to be mutations of red cultivars (Boss et al., 1996; Kobayashi et al., 2004; Hichri et al., 2011b), and all of the green grape cultivars have a common origin (Walker et al., 2007). The small seeds contained inside the fig syconia are dispersed by birds. We therefore assume that figs with a dark peel are the wild type, those with a green peel represent a color mutation, and the “Purple Peel” mutant of “Green Peel” can be regarded as a reverse mutation, regaining the wild-type trait.
Understanding the nature of the green-color fruit as a mutant of the wild type could facilitate analysis of the mechanism underlying the reverse mutation. Any functional loss of key enzymes in the anthocyanin biosynthetic pathway could lead to a green or white mutation, such as via insertion in the structural genes, and turned off or repressed structural gene expression by MYB transcription factors associated with the components of the MBW complex (Feller et al., 2011; Petroni and Tonelli, 2011; Tai et al., 2014). A large number of publications have demonstrated MYB family transcription factors as key regulators in phenylpropanoid, flavonoid, anthocyanin and proanthocyanidin biosynthesis (Falcone Ferreyra et al., 2012; Verdier et al., 2012; Liu et al., 2015; Xu et al., 2015). Moreover, studies with different fruit have revealed conserved components of the regulatory complex controlling anthocyanin biosynthesis in all higher plants, including conserved cis-regulation elements in promotors of key genes of the pathways (Quattrocchio et al., 1993; Koch et al., 2001; Stracke et al., 2007; Dick et al., 2011). The function and expression level of MYBs could be significantly affected by different types of mutations. A single amino-acid substitution in the R2 domain of VvMYB5b was found to affect the protein's ability to activate the transcription of flavonoid genes (Hichri et al., 2011b). A retrotransposon insertion in grape mybA1 blocks the gene's expression, leading to loss of pigmentation in white grape cultivars (Kobayashi et al., 2004). In our study, differential expression of both transposons and retrotransposons was recorded, and a significant upregulation trend in a large number of reverse transcriptase, integrase and gag sequences was revealed in the “Green Peel” as compared to its purple mutant (Supplementary Table 4), suggesting that “Green Peel” is a retrotransposon insertion mutation.
In grapes, VvMYBA1 and VvMYBA2 have different on/off switch mechanisms: Gret1 retrotransposon insertion in the promoter of VvMybA1 switches off VvMybA1 expression, whereas a non-synonymous single-nucleotide polymorphism present in the coding region switches off the function of VvMybA2 and leads to white grape berries (Kobayashi et al., 2004; Walker et al., 2007). In our case, MYBs, together with the changes in transposon and retrotransposon activation, could be candidates for the “Purple Peel” fig mutation from its “Green Peel” progenitor (Ramsay et al., 2003).
In summary, this combined metabolome and transcriptome study gives us a picture of modulated anthocyanin and flavanoid expression in the “Purple Peel” fig mutant, revealing the large-scale changes in nutritionally important compounds and gene expression in a horticultural mutation with a single phenotypic attribute. Our results provide new information on the anthocyanidin, flavonol and procyanidin metabolites of fig and the global transcriptional changes in fig color regulation, secondary metabolism pathways and regulators in fruit ripening and quality formation.
Ethics Statement
The study was approved by fig cooperatives in Weihai City, Shandong Province in China.
Author Contributions
HM and SC designed the experiments. ZW and YC conducted the experiments and analyzed the results. ZW, YC, AV, SC, and HM prepared the manuscript. All authors have read and approved the manuscript for publication.
Conflict of Interest Statement
The authors declare that the research was conducted in the absence of any commercial or financial relationships that could be construed as a potential conflict of interest.
Acknowledgments
This work was supported by Natural Science Foundation of China project NSFC [31372007]. AV is an incumbent of the Wolfson Chair in Floriculture.
Supplementary Material
The Supplementary Material for this article can be found online at: https://www.frontiersin.org/articles/10.3389/fpls.2017.01990/full#supplementary-material
Abbreviations
4CL, 4-Coumarate:coenzyme A ligase; ANS, Anthocyanidin synthase; bHLH, Basic helix-loop-helix; CHI, Chalcone isomerase; CHS, Chalcone synthase; COG, Clusters of orthologous groups of proteins database; DEG, Differentially expressed gene; DFR, Dihydroflavonol 4-reductase; F3H, Flavanone 3-hydroxylase; F3′H, Flavanone 3′-hydroxylase; LAR, Leucoanthocyanidin reductase; PAL, Phenylalanine ammonia-lyase; UFGT, UDP-glucose: flavonoid 3-O-glucosyltransferase.
References
Allan, A. C., Hellens, R. P., and Laing, W. A. (2008). MYB transcription factors that color our fruit. Trends Plant Sci. 13, 99–102. doi: 10.1016/j.tplants.2007.11.012
Becker, C., Klaering, H. P., Kroh, L. W., and Krumbein, A. (2014). Cool-cultivated red leaf lettuce accumulates cyanidin-3-O-(6″-O-malonyl)-glucoside and caffeoylmalic acid. Food Chem. 146, 404–411. doi: 10.1016/j.foodchem.2013.09.061
Bilyk, A., and Sapers, G. M. (1986). Varietal differences in the quercetin, kaempferol, and myricetin contents of highbush blueberry, cranberry, and thornless blackberry fruits. J. Agric. Food Chem. 34, 585–588. doi: 10.1021/jf00070a001
Boss, P. K., Davies, C., and Robinson, S. P. (1996). Analysis of the expression of anthocyanin pathway genes in developing Vitis vinifera L. cv shiraz grape berries and the implications for pathway regulation. Plant Physiol. 111, 1059–1066. doi: 10.1104/pp.111.4.1059
Cao, L., Xu, X., Chen, S., and Ma, H. (2016). Cloning and expression analysis of Ficus carica anthocyanidin synthase 1, gene. Sci. Hortic. 211, 369–375. doi: 10.1016/j.scienta.2016.09.015
Chagné, D., Lin-Wang, K., Espley, R. V., Volz, R. K., How, N. M., Rouse, S., et al. (2013). An ancient duplication of apple MYB transcription factors is responsible for novel red fruit-flesh phenotypes. Plant Physiol. 161, 225–239. doi: 10.1104/pp.112.206771
Chai, L., Li, Y., Chen, S., Perl, A., Zhao, F., and Ma, H. (2014). RNA sequencing reveals high resolution expression change of major plant hormone pathway genes after young seedless grape berries treated with gibberellin. Plant Sci. 229, 215–224. doi: 10.1016/j.plantsci.2014.09.010
Chai, L., Wang, Z., Chai, P., Chen, S., and Ma, H. (2017). Transcriptome analysis of San Pedro-type fig (Ficus carica L.) parthenocarpic breba and non-parthenocarpic main crop reveals divergent phytohormone-related gene expression. Tree Genet. Genomes 13:83. doi: 10.1007/s11295-017-1166-4
Chen, W., Gong, L., Guo, Z., Wang, W., Zhang, H., Liu, X., et al. (2013). A novel integrated method for large-scale detection, identification, and quantification of widely targeted metabolites: application in the study of rice metabolomics. Mol. Plant 6, 1769–1780. doi: 10.1093/mp/sst080
Clark, S. T., and Verwoerd, W. S. (2011). A systems approach to identifying correlated gene targets for the loss of colour pigmentation in plants. BMC Bioinformatics 12:343. doi: 10.1186/1471-2105-12-343
Crane, J. C., and Baker, R. E. (1953). Growth comparisons of the fruits and fruitlets of figs and strawberries. J. Am. Soc. Hortic. Sci. 62, 257–260.
D'Auria, J. C., Reichelt, M., Luck, K., Svatos, A., and Gershenzon, J. (2007). Identification and characterization of the BAHD acyltransferase malonyl CoA: anthocyanidin 5-O-glucoside-6″-O-malonyltransferase (At5MAT) in Arabidopsis thaliana. Febs Lett. 581, 872–878. doi: 10.1016/j.febslet.2007.01.060
Dick, C. A., Buenrostro, J., Butler, T., Carlson, M. L., Kliebenstein, D. J., and Whittall, J. B. (2011). Arctic mustard flower color polymorphism controlled by petal-specific downregulation at the threshold of the anthocyanin biosynthetic pathway. PLoS ONE 6:e18230. doi: 10.1371/journal.pone.0018230
Dueñas, M., Pérez-Alonso, J. J., Santos-Buelga, C., and Escribano-Bailón, T. (2008). Anthocyanin composition in fig (Ficus carica, L.). J. Food Comp. Anal. 21, 107–115. doi: 10.1016/j.jfca.2007.09.002
Ercisli, S., Tosun, M., Karlidag, H., Dzubur, A., Hadziabulic, S., and Aliman, Y. (2012). Color and antioxidant characteristics of some fresh fig (Ficus carica, L.) genotypes from Northeastern Turkey. Plant Foods Hum. Nutr. 67, 271–276. doi: 10.1007/s11130-012-0292-2
Espley, R. V., Hellens, R. P., Putterill, J., Stevenson, D. E., Kutty-Amma, S., and Allan, A. C. (2007). Red colouration in apple fruit is due to the activity of the MYB transcription factor, MdMYB10. Plant J. 49, 414–427. doi: 10.1111/j.1365-313X.2006.02964.x
Feller, A., Machemer, K., Braun, E. L., and Grotewold, E. (2011). Evolutionary and comparative analysis of MYB and bHLH plant transcription factors. Plant J. 66, 94–116. doi: 10.1111/j.1365-313X.2010.04459.x
Falcone Ferreyra, M. L., Rius, S. P., and Casati, P. (2012). Flavonoids: biosynthesis, biological functions, and biotechnological applications. Front. Plant Sci. 3:222. doi: 10.3389/fpls.2012.00222
Flaishman, M. A., Rodov, V., and Stover, E. (2008). The fig: botany, horticulture, and breeding. Hortic. Rev. 34, 113–196. doi: 10.1002/9780470380147.ch2
Gonzalez, A., Zhao, M., Leavitt, J. M., and Lloyd, A. M. (2008). Regulation of the anthocyanin biosynthetic pathway by the TTG1/bHLH/Myb transcriptional complex in Arabidopsis seedlings. Plant J. 53, 814–827. doi: 10.1111/j.1365-313X.2007.03373.x
Götz, S., García-Gómez, J. M., Terol, J., Williams, T. D., Nagaraj, S. H., Nueda, M. J., et al. (2008). High-throughput functional annotation and data mining with the Blast2GO suite. Nucleic Acids Res. 36, 3420–3435. doi: 10.1093/nar/gkn176
Griesser, M., Hoffmann, T., Bellido, M. L., Rosati, C., Fink, B., Kurtzer, R., et al. (2008). Redirection of flavonoid biosynthesis through the down-regulation of an anthocyanidin glucosyltransferase in ripening strawberry fruit. Plant Physiol. 146, 1528–1539. doi: 10.1104/pp.107.114280
Han, Y., Vimolmangkang, S., Soria-Guerra, R. E., and Korban, S. S. (2012). Introduction of apple ANR genes into tobacco inhibits expression of both CHI and DFR genes in flowers, leading to loss of anthocyanin. J. Exp. Bot. 63, 2437–2447. doi: 10.1093/jxb/err415
Hichri, I., Barrieu, F., Bogs, J., Kappel, C., Delrot, S., and Lauvergeat, V. (2011a). Recent advances in the transcriptional regulation of the flavonoid biosynthetic pathway. J. Exp. Bot. 62, 2465–2483. doi: 10.1093/jxb/erq442
Hichri, I., Deluc, L., Barrieu, F., Bogs, J., Mahjoub, A., Regad, F., et al. (2011b). A single amino acid change within the R2 domain of the VvMYB5b transcription factor modulates affinity for protein partners and target promoter selectivity. BMC Plant Biol. 11:117. doi: 10.1186/1471-2229-11-117
Holt, R. R., Lazarus, S. A., Sullards, M. C., Zhu, Q. Y., Schramm, D. D., Hammerstone, J. F., et al. (2002). Procyanidin dimer b2 [epicatechin-(4beta-8)-epicatechin] in human plasma after the consumption of a flavanol-rich cocoa. Am. J. Clin. Nut. 76, 798–804.
Hua, C., Linling, L., Shuiyuan, C., Fuliang, C., Feng, X., Honghui, Y., et al. (2013). Molecular cloning and characterization of three genes encoding dihydroflavonol-4-reductase from Ginkgo biloba in anthocyanin biosynthetic pathway. PLoS ONE 8:e72017. doi: 10.1371/journal.pone.0072017
Jaakola, L. (2013). New insights into the regulation of anthocyanin biosynthesis in fruits. Trends Plant Sci. 18, 477–483. doi: 10.1016/j.tplants.2013.06.003
Jung, C., Shim, J. S., Seo, J. S., Lee, H. Y., Kim, C. H., Yang, D. C., et al. (2010). Non-specific phytohormonal induction of AtMYB44 and suppression of jasmonate-responsive gene activation in Arabidopsis thaliana. Mol. Cells 29, 71–76. doi: 10.1007/s10059-010-0009-z
Kislev, M. E., and Bar-Yosef, O. (2006). Early domesticated fig in the Jordan Valley. Science 312, 1372–1374. doi: 10.1126/science.1125910
Kobayashi, S., Goto-Yamamoto, N., and Hirochika, H. (2004). Retrotransposon-induced mutations in grape skin color. Science 304, 982–982. doi: 10.1126/science.1095011
Kobayashi, S., Ishimaru, M., Ding, C. K., Yakushiji, H., and Goto, N. (2001). Comparison of UDP-glucose: flavonoid 3-O-glucosyltransferase (UFGT) gene sequences between white grapes (Vitis vinifera) and their sports with red skin. Plant Sci. 160, 543–550. doi: 10.1016/S0168-9452(00)00425-8
Koch, M. A., Weisshaar, B., Kroymann, J., Haubold, B., and Mitchell-Olds, T. (2001). Comparative genomics and regulatory evolution: conservation and function of the CHS and Apetala3 promoters. Mol. Biol. Evol. 18, 1882–1891. doi: 10.1093/oxfordjournals.molbev.a003729
Lepiniec, L., Debeaujon, I., Routaboul, J. M., Baudry, A., Pourcel, L., Nesi, N., et al. (2006). Genetics and biochemistryof seed flavonoids. Ann. Rev. Plant Biol. 57, 405–430. doi: 10.1146/annurev.arplant.57.032905.105252
Li, P., Ma, F., and Cheng, L. (2013). Primary and secondary metabolism in the sun-exposed peel and the shaded peel of apple fruit. Physiol. Planta 148, 9–24. doi: 10.1111/j.1399-3054.2012.01692.x
Liu, C., Long, J., Zhu, K., Liu, L., Yang, W., Zhang, H., et al. (2016). Characterization of a citrus R2R3-MYB transcription factor that regulates the flavonol and hydroxycinnamic acid biosynthesis. Sci. Rep. 6:25352. doi: 10.1038/srep25352
Liu, J., Osbourn, A., and Ma, P. (2015). MYB transcription factors as regulators of phenylpropanoid metabolism in plants. Mol. Plant 8, 689–708. doi: 10.1016/j.molp.2015.03.012
Lou, Q., Liu, Y., Qi, Y., Jiao, S., Tian, F., Jiang, L., et al. (2014). Transcriptome sequencing and metabolite analysis reveals the role of delphinidin metabolism in flower colour in grape hyacinth. J. Exp. Bot. 65, 3157–3164. doi: 10.1093/jxb/eru168
Mao, X., Cai, T., Olyarchuk, J. G., and Wei, L. (2005). Automated genome annotation and pathway identification usingthe KEGG orthology (KO) as a controlled vocabulary. Bioinformatics 21, 3787–3793. doi: 10.1093/bioinformatics/bti430
Martens, S., Forkmann, G., Britsch, L., Wellmann, F., Matern, U., and Lukacin, R. (2003). Divergent evolution of flavonoid 2-oxoglutarate-dependent dioxygenases in parsley. FEBS Lett. 544, 93–98. doi: 10.1016/S0014-5793(03)00479-4
Matus, J. T. (2016). Transcriptomic and metabolomic networks in the grape berry illustrate that it takes more than flavonoids to fight against ultraviolet radiation. Front. Plant Sci. 7:1337. doi: 10.3389/fpls.2016.01337
Mortazavi, A., Williams, B. A., McCue, K., Schaeffer, L., and Wold, B. (2008). Mapping and quantifying mammalian transcriptomes by RNA-Seq. Nat. Methods 5, 621–628. doi: 10.1038/nmeth.1226
Neta-Sharir, I., Isaacson, T., Lurie, S., and Weiss, D. (2005). Dual role for tomato heat shock protein 21: protecting photosystem II from oxidative stress and promoting color changes during fruit maturation. Plant Cell 17, 1829–1838. doi: 10.1105/tpc.105.031914
Niu, S. S., Xu, C. J., Zhang, W. S., Zhang, B., Li, X., Lin-Wang, K., et al. (2010). Coordinated regulation of anthocyanin biosynthesis in Chinese bayberry (Myrica rubra) fruit by a R2R3 MYB transcription factor. Planta 231, 887–899. doi: 10.1007/s00425-009-1095-z
Pelletier, M. K., Murrell, J. R., and Shirley, B. W. (1997). Characterization of flavonol synthase and leucoanthocyanidin dioxygenase genes in Arabidopsis. further evidence for differential regulation of “early” and “late” genes. Plant Physiol. 113, 1437–1445. doi: 10.1104/pp.113.4.1437
Petroni, K., and Tonelli, C. (2011). Recent advances on the regulation of anthocyanin synthesis in reproductive organs. Plant Sci. 181, 219–229. doi: 10.1016/j.plantsci.2011.05.009
Quattrocchio, F., Wing, J. F., Leppen, H. T. C., Mol, J. N. M., and Koes, R. E. (1993). Regulatory genes controlling anthocyanin pigmentation are functionally conserved among plant-species and have distinct sets of target genes. Plant Cell 5, 1497–1512. doi: 10.1105/tpc.5.11.1497
Ramsay, N. A., and Glover, B. J. (2005). MYB-bHLH-WD40 protein complex and the evolution of cellular diversity. Trends Plant Sci. 10, 64–70. doi: 10.1016/j.tplants.2004.12.011
Ramsay, N. A., Walker, A. R., Mooney, M., and Gray, J. C. (2003). Two basic-helix-loop-helix genes (MYC-146 and GL3) from Arabidopsis can activate anthocyanin biosynthesis in a white-flowered Matthiola incana mutant. Plant Mol. Biol. 52, 679–688. doi: 10.1023/A:1024852021124
Rodrigo, M. J., Marcos, J. F., Alférez, F., Mallent, M. D., and Zacarías, L. (2003). Characterization of pinalate, a novel Citrus sinensis mutant with a fruit-specific alteration that results in yellow pigmentation and decreased ABA content. J. Exp. Bot. 54, 727–738. doi: 10.1093/jxb/erg083
Saito, K., Yonekura-Sakakibara, K., Nakabayashi, R., Higashi, Y., Yamazaki, M., Tohge, T., et al. (2013). The flavonoid biosynthetic pathway in Arabidopsis: structural and genetic diversity. Plant Physiol. Biol. 72, 21–34. doi: 10.1016/j.plaphy.2013.02.001
Salvatierra, A., Pimentel, P., Moyaleón, M. A., and Herrera, R. (2013). Increased accumulation of anthocyanins in Fragaria chiloensis fruits by transient suppression of FcMYB1 gene. Phytochemistry 90, 25–36. doi: 10.1016/j.phytochem.2013.02.016
Scharf, K. D., Berberich, T., Ebersberger, I., and Nover, L. (2012). The plant heat stress transcription factor (Hsf) family: structure, function and evolution. Biochim. Biophys. Acta 1819, 104–119. doi: 10.1016/j.bbagrm.2011.10.002
Solomon, A., Golubowicz, S., Yablowicz, Z., Grossman, S., Bergman, M., Gottlieb, H. E., et al. (2006). Antioxidant activities and anthocyanin content of fresh fruits of common fig (Ficus carica L.). J. Agric. Food Chem. 54, 7717–7723. doi: 10.1021/jf060497h
Stracke, R., Ishihara, H., Huep, G., Barsch, A., Mehrtens, F., Niehaus, K., et al. (2007). Differential regulation of closely related R2R3-MYB transcription factors controls flavonol accumulation in different parts of the Arabidopsis thaliana seedling. Plant J. 50, 660–677. doi: 10.1111/j.1365-313X.2007.03078.x
Sun, W., Van Montagu, M., and Verbruggen, N. (2002). Small heat shock proteins and stress tolerance in plants. Biochim. Biophys. Acta 1577, 1–9. doi: 10.1016/S0167-4781(02)00417-7
Tai, D., Tian, J., Zhang, J., Song, T., and Yao, Y. (2014). A Malus crabapple chalcone synthase gene, McCHS, regulates red petal color and flavonoid biosynthesis. PLoS ONE 9:e110570. doi: 10.1371/journal.pone.0110570
Tanner, G. J., Francki, K. T., Abrahams, S., Watson, J. M., Larkin, P. J., and Ashton, A. R. (2003). Proanthocyanidin biosynthesis in plants. Purification of legume leucoanthocyanidin reductase and molecular cloning of its cDNA. J. Biol. Chem. 278, 3147–3156. doi: 10.1074/jbc.M302783200
Terrier, N., Torregrosa, L., Ageorges, A., Vialet, S., Verriès, C., Cheynier, V., et al. (2009). Ectopic expression of VvMybPA2 promotes proanthocyanidin biosynthesis in grapevine and suggests additional targets in the pathway. Plant Physiol. 149, 1028–1041. doi: 10.1104/pp.108.131862
Verdier, J., Zhao, J., Torresjerez, I., Ge, S., Liu, C., He, X., et al. (2012). MtPAR MYB transcription factor acts as an on switch for proanthocyanidin biosynthesis in Medicago truncatula. Proc. Natl. Acad. Sci. U.S.A. 109, 1766–1771. doi: 10.1073/pnas.1120916109
Walker, A. R., Lee, E., Bogs, J., McDavid, D. A. J., Thomas, M. R., and Robinson, S. P. (2007). White grapes arose through the mutation of two similar and adjacent regulatory genes. Plant J. 49, 772–785. doi: 10.1111/j.1365-313X.2006.02997.x
Wang, W., Vinocur, B., Shoseyov, O., and Altman, A. (2004). Role of plant heat-shock proteins and molecular chaperones in the abiotic stress response. Trends Plant Sci. 9, 244–252. doi: 10.1016/j.tplants.2004.03.006
Waters, E. R. (2013). The evolution, function, structure, and expression of the plant sHSPs. J. Exp. Bot. 64, 391–403. doi: 10.1093/jxb/ers355
Willson, M. F., and Whelan, C. J. (1990). The evolution of fruit color in fleshy-fruited plants. Am. Nat. 136, 790–809. doi: 10.1086/285132
Wu, S. B., Dastmalchi, K., and Long, C., and Kennelly, E. J. (2012). Metabolite profiling of jaboticaba (Myrciaria cauliflora) and other dark-colored fruit juices. J. Agri. Food Chem. 60, 7513–7525. doi: 10.1021/jf301888y
Xie, X. B., Li, S., Zhang, R. F., Zhao, J., Chen, Y. C., Zhao, Q., et al. (2012). The bhlh transcription factor mdbhlh3 promotes anthocyanin accumulation and fruit colouration in response to low temperature in apples. Plant Cell Environ. 35, 1884–1897. doi: 10.1111/j.1365-3040.2012.02523.x
Xu, W., Dubos, C., and Lepiniec, L. (2015). Transcriptional control of flavonoid biosynthesis by MYB–bHLH–WDR complexes. Trends Plant Sci. 20, 176–185. doi: 10.1016/j.tplants.2014.12.001
Xu, X., Zeng, L., Zhang, W., and Ma, H. (2016). A new fig cultivar “zibao.” Acta Hortic. Sinica 43, 1623–1624. doi: 10.16420/j.issn.0513-353x.2016-0109
Yang, Y., Zhao, G., Yue, W., Zhang, S., Gu, C., and Wu, J. (2013). Molecular cloning and gene expression differences of the anthocyanin biosynthesis-related genes in the red/green skin color mutant of pear (Pyrus communis L.). Tree Genet. Genomes. 9, 1351–1360. doi: 10.1007/s11295-013-0644-6
Yemiş, O., Bakkalbaşi, E., and Artik, N. (2012). Changes in pigment profile and surface colour of fig (Ficus carica L.) during drying. J. Food Sci. Technol. 47, 1710–1719. doi: 10.1111/j.1365-2621.2012.03025.x
Zhou, H., Lin-Wang, K., Wang, H., Gu, C., Dare, A. P., Espley, R. V., et al. (2015). Molecular genetics of blood-fleshed peach reveals activation of anthocyanin biosynthesis by NAC transcription factors. Plant J. 82, 105–121. doi: 10.1111/tpj.12792
Keywords: fig (Ficus carica L.), anthocyanin, flavonoid, peel color mutation, transcriptome, metabolome
Citation: Wang Z, Cui Y, Vainstein A, Chen S and Ma H (2017) Regulation of Fig (Ficus carica L.) Fruit Color: Metabolomic and Transcriptomic Analyses of the Flavonoid Biosynthetic Pathway. Front. Plant Sci. 8:1990. doi: 10.3389/fpls.2017.01990
Received: 01 September 2017; Accepted: 06 November 2017;
Published: 20 November 2017.
Edited by:
Luciano Freschi, University of São Paulo, BrazilReviewed by:
Rosario Muleo, Università degli Studi della Tuscia, ItalySaleh Alseekh, Max Planck Institute of Molecular Plant Physiology (MPG), Germany
Copyright © 2017 Wang, Cui, Vainstein, Chen and Ma. This is an open-access article distributed under the terms of the Creative Commons Attribution License (CC BY). The use, distribution or reproduction in other forums is permitted, provided the original author(s) or licensor are credited and that the original publication in this journal is cited, in accordance with accepted academic practice. No use, distribution or reproduction is permitted which does not comply with these terms.
*Correspondence: Huiqin Ma, hqma@cau.edu.cn