 Tianheng Ren1†
 Yangshan Hu2†
 Yingzi Tang1Chunsheng Li1Benju Yan2*Zhenglong Ren1Feiquan Tan1Zongxiang Tang1Shulan Fu1
 Zhi Li2*
- 1College of Agronomy, Sichuan Agricultural University, Chengdu, China
- 2College of Life Science, Sichuan Agricultural University, Ya’an, China
Maximum tiller number and productive tiller number are important traits for wheat grain yield, but research involving the temporal expression of tiller number at different quantitative trait loci (QTL) levels is limited. In the present study, a population set of 371 recombined inbred lines derived from a cross between Chuan-Nong18 and T1208 was used to construct a high-density genetic map using a Wheat55K SNP Array and to perform dynamic QTL analysis of the tiller number at four growth stages. A high-density genetic map containing 11,583 SNP markers and 59 SSR markers that spanned 4,513.95 cM and was distributed across 21 wheat chromosomes was constructed. A total of 28 single environmental QTL were identified in the recombined inbred lines population, and among these, seven QTL were stable and used for multi-environmental and dynamic analysis. These QTL were mapped to chromosomes 2D, 4A, 4D, 5A, 5D, and 7D, respectively. Each QTL explained 1.63–21.22% of the observed phenotypic variation, with an additive effect from -20.51 to 11.59. Dynamic analysis showed that cqTN-2D.2 can be detected at four growth stages of tillering, explaining 4.92–17.16% of the observed phenotypic variations and spanning 13.71 Mb (AX-109283238-AX-110544009: 82189047-95895626) according to the physical location of the flanking markers. The effects of the stable QTL were validated in the recombined inbred lines population, and the beneficial alleles could be utilized in future marker-assisted selection. Several candidate genes for MTN and PTN were predicted. The results provide a better understanding of the QTL selectively expressing the control of tiller number and will facilitate future map-based cloning. 9.17% SNP markers showed best hits to the Chinese Spring contigs. It was indicated that Wheat55K Array was efficient and valid to construct a high-density wheat genetic map.
Introduction
Common wheat (Triticum aestivum L.) is one of the most valuable and widely used crops in the world. The grain yield of wheat was 28,462.68 bushels for food use in 2016 according to the United States Department of Agriculture1. In response to the continuous decrease in wheat-cultivated areas and growth in population size, the major object of recent wheat breeding programs is to improve grain yield. Grain yield in wheat is a complex trait that is usually controlled by several quantitative trait loci (QTL) and is also significantly influenced by numerous environment factors. Tiller number (TN) is an important agronomic trait and plays a large role in wheat for yield potential because maximum tiller number per unit area (MTN) determines panicle number per unit area, also known as productive tiller number (PTN), which is a key component of grain yield (Naruoka et al., 2011). In addition, tillering determines shoot architecture, which affects the synchrony of flowering, illumination, plant height, seed set, and ultimately, the grain yield of each plant (Kuraparthy et al., 2007; Xu et al., 2017). However, TN is a trait for which gene expression is dynamical and can easily be measured (Liu et al., 2009). Thus, TN is a model trait for studying developmental behavior (Yan et al., 1998). Previous studies showed that wheat cultivars with limited tillering capacity have higher yield potential than cultivars with more tillers under severe drought conditions (Richards, 1988; Naruoka et al., 2011; Wang et al., 2016). However, Sichuan Province is a typical rain-fed agricultural area in Southwestern China that has very few light hours and more rainy days in winter. This has resulted in a macro-type spike and low tillering-capacity winter wheat with high-density sowing in recent years, but this may change. Macro-type spikes and limited tillering capacity can cause poor resistance to extreme weather, and the main culm may be injured by extreme weather such as frost, which can devastatingly reduce grain yield (Fowler, 1982). More seriously, under high-density sowing conditions, the appearance of flag leaves increases the number of leaves and leaf area, thereby increasing the shadow effect. A larger shadow effect and higher soil humidity can give rise to widespread disease (Kumar and Nagarajan, 1998). Furthermore, there is a highly negative correlation between TN and plant height (Lanning et al., 2012; Lu et al., 2015; Xu et al., 2017). Thus, new breeding hypotheses for wheat in Sichuan Basin and similar environments is to increase TN appropriately to construct an ideal population structure. According to this thinking, our breeding produced wheat cultivars such as CN12, CN17, and CN18 with higher tillering capacity. Previous studies have paid more attention to the cultivation methods affecting TN, such as seeding density and sowing time. However, our understanding of the genetic basis of TN is limited. Thus, to increase TN in future breeding programs, it is essential to elucidate the genetic mechanism controlling TN in wheat.
Quantitative trait loci mapping that utilizes molecular markers is an effective approach to dissect complex traits in crops (Gao et al., 2015; Zhai et al., 2016; Yuan et al., 2017). Studies using molecular markers began with restriction fragment length polymorphisms (RFLPs) three decades ago and have recently culminated with single nucleotide polymorphism (SNP) (Tanksley et al., 1989; Rasheed et al., 2017). SNPs are the most abundant type of molecular markers, and the development and application of SNP arrays based on next-generation sequencing technologies in crop genetics have gained remarkable attention in recent years (Varshney et al., 2009; Rasheed et al., 2017). Several SNP arrays of wheat have been reported, such as 9K, 90 K, 35K, 660K, and 820K (Cavanagh et al., 2013; Wang et al., 2014; Winfield et al., 2016; Allen et al., 2017; Cui et al., 2017). Recently, a high-density genetic map has been used for several traits in wheat (Wu et al., 2015; Cui et al., 2017; Yu et al., 2017), providing useful markers and information for genetic analysis and breeding. The population size is also important for QTL mapping because it affects accuracy. Limited populations can cause overestimation of QTL and can explain phenotypic variations and detection of false positive QTL (Vales et al., 2005; Cui et al., 2011). Previous research has shown that a threshold of population size for QTL mapping is 300 (Li et al., 2006). Using traditional genetic analysis, there have been several reports of QTL controlling TN in wheat. To date, at least four single genes (tin1, tin2, tin3, and ftin) that control TN have been reported (Peng et al., 1998; Spielmeyer and Richards, 2004; Kuraparthy et al., 2007; Zhang et al., 2013). To date, several QTL have been associated with TN mapped to chromosomes 1A, 2B, 2A, 2B, 2D, 3A, 3B, 3D, 4D, 5A, 5D, 6D, 7A, and 7B (Kato et al., 2000; Li et al., 2010; Deng et al., 2011; Naruoka et al., 2011; Nasseer et al., 2016; Wang et al., 2016; Hu et al., 2017; Xu et al., 2017). According to the theory of developmental genetics, genes and QTL are expressed temporally at different growth stages (Zhu, 1995), even though they may have the same ultimate effects. The dissection of tillering dynamics into component traits can provide insight into the interaction of phenotypes and environments in crops (Hammer et al., 2006). The observation of phenotypic expression of component traits is generally more stable across environments than the expression of the complex trait itself, indicating that component traits facilitate identification of QTL or genes (Alam et al., 2014). There are several dynamic QTL analyses for TN in rice (Oryza sativa L.) (Liu et al., 2009, 2012), and despite the importance of tillering dynamics in potential grain yield, the understanding and investigation of the genetic basis and environmental factors affecting TN in wheat are limited.
The Wheat660K and Wheat55K Array were both designed by the Chinese Academy of Agricultural Sciences and synthesized by Affymetrix. Wheat660K is efficient and valid to construct a high-density wheat genetic map (Cui et al., 2017). Compared to Wheat660K, Wheat55K (Affymetrix® Axiom® Wheat55) is more valuable for wheat QTL research, because all 53063 tags of the 55K Array were carefully selected from the 660K Array. These tags were uniformly distributed in 21 wheat chromosomes, and each chromosome had approximately 2600 SNP. The average genetic distance is approximately 0.1 cM, and the average physical distance was smaller than 300 kb.
In the present study, a set of 371 recombined inbred lines (RILs) were used to construct a high-density linkage map by using the Wheat55K SNP Array and to perform dynamic QTL analysis for TN at four growth stages. This is the first report of the use of 55K SNP Array in wheat genetic mapping. The sequences of the flanking SNP marker were employed in BLASTN against Chinese Spring contigs, and the beneficial alleles were identified in the RIL population. These QTL detected in the RIL population will be useful for the development of grain yield and further marker-assisted selection (MAS) and map-based cloning.
Materials and Methods
Plant Materials and Phenotypic Evaluation
Chuan-Nong18 (CN18) was examined and approved as a cultivar by the Sichuan Provincial Variety Examination and Committee in 2003, and the high-tillering and high-yielding characters of CN18 were found to be stably inherited (Ren et al., 2011). T1208 was developed by our lab and exhibited significant differences in tillering numbers compared to CN18. In the present study, 371 F11:12 RILs for integrated linkage map and QTL analyses were developed from a cross between CN18 and T1208 by single-seed descent. The parental lines and 371 RILs were planted in the Qionglai District (30°25′N, 103°28′, altitude 493.3 m) in Sichuan Basin during the 2014.10–2015.05 cropping season and 2015.10–2016.05 cropping season following standard cultivation practices. A randomized block design with three replicates was used for this population. Forty seeds were hand-planted in each row of a four-row plot with a row spacing of 25 cm and length of 2 m. Crop management was performed according to local practices. Fungicide was applied to the seedlings and against at heading to control diseases and pests.
Twenty representative plants from the middle of inner rows of each replicate were selected to measure the TN across four different growth stages: 30 days after seeding, 49 days after seeding, 79 days after seeding, and 157 days after seeding (Zadoks et al., 1974). The trait names were designated tiller number at early stage per unit area (TNES), tiller number during pre-winter per unit area (TNPW), maximum tiller number per unit area (MTN), and productive tiller number per unit area (PTN), respectively. Per unit area for trait measurement was 1 m2 in the present study. The particular phenotyping evaluation was as described in Hu et al. (2017).
Molecular Genotyping and Map Construction
Genomic DNA for the 371 RILs and their parental lines was extracted from tender leaves using the TreliefTM Plant Genomic DNA Kit2, and quality was checked using an agarose gel. The concentration was detected using an Thermo Scientific NanoDrop 2000. The qualified DNA was genotyped using the Affymetrix 55K SNP Array by CapitalBio Technology Company (Beijing, China). Chip genotyping was according to the Axiom® 2.0 Assay for 384 Samples User Manual3. The SSR markers were genotyped in our previous study (Hu et al., 2017).
Biallelic pleomorphic SNPs with >10% missing data and p < 10-6 by chi-square test of segregation distortion (departure from the expect 1:1 segregation ratio) were removed, and the remaining high-quality SNPs were binned by their pattern of segregation using the BIN function of IciMapping Ver. 4.14 (Winfield et al., 2016; Zhang et al., 2017). Each bin had several markers; the correlation coefficient between them was 1, and one marker with the lowest missing rate was chosen to represent this bin. If there was no missing date of the markers in one bin, one marker was chosen randomly. SNP markers and the previously mapped 59 SSR markers were sorted into groups using Carthagene (Givry et al., 2005). LOD thresholds between 5.0 and 10.0 and a threshold of genetic distance of 80 cM were tested to reach an optimum marker number in linkage groups. The linkage map was constructed using the MAP function of IciMapping Ver. 4.1, and the algorithm of groups ordered was “nnTwoOpt” using the Kosambi map function to calculate the map distance from recombination frequencies (Kosambi, 1943). The criterion and window size for Rippling were “SARF” and “5,” respectively. MapChart Ver. 2.25 was used for genetic map drawing. The SNP markers mapped to the genetic map were employed to perform BLASTX search on ENSEMBL6.
Statistical and QTL Analysis
The average measurement of TNES, TNPW, MTN, and PTN of three replicates was used in the subsequent analysis. The heritability and ANOVA of each trait were performed as described (Hu et al., 2017). The correlation was performed using SPSS Ver. 22.0 (IBM SPSS 22.0, Chicago, IL, United States).
The QTL for TN at different growth stages were identified using the IciMapping Ver. 4.1 BIP functionality with the inclusive composite interval mapping (ICIM) method, and each trait value in each replicate of the 2 years was assembled to conduct combined QTL analysis to identify the cQTL with additive-by-environment (A by E) interaction effects in a multi-environment trials (MET) module using the ICIM method. For each trial, a test of 2,000 permutations was performed to identify the LOD threshold corresponding to a genome-wild false discovery rate of 0.01. The walking step for QTL mapping was 0.1 cM with a p-value inclusion threshold (probability in stepwise regression) of 0.001 (Li et al., 2007; Meng et al., 2015). The confidence interval of each QTL was determined by LOD peak -2. A QTL detected in both years at the same growth stage or at least three growth stages was considered a stable QTL. The naming rule of each QTL was designated q and cq for QTL and combined QTL, with TN (including TNES, TNPW, MTN, PTN) for trait name, along with the chromosome information at the end. The sequences of the flanking markers of the stable QTL were employed to perform BLASTN against the Chinese Spring contigs7. The overlapping confidence intervals and the flanking sequences of SNP markers were used to predict the candidate genes by IWGSC WGA of chromosome 2D and 4D8.
Results
Phenotyping Evaluation and Correlation Between TNES, TNPW, MTN, and PTN
Our previous research has shown that the above four traits followed a normal distribution in the RIL population, and the phenotype of two parental lines showed a great discrepancy, indicating that this RIL population is suitable for QTL analysis (Hu et al., 2017). In results using the average measurement of TNES, TNPW, MTN, and PTN between 2 years for correlation analysis, traits were significantly positive correlated with each other in the RIL population (Table 1). The highest correlation coefficient was 0.792 (p < 0.001) between MTN and PTN (Table 1). The mean values of TNES, TNPW, MTN, and PTN in the RIL population for the 2 years are shown in Supplementary Figure S1. These four traits showed an obviously normal distribution in the population.
TABLE 1. Correlation coefficient among various tiller number-related traits in RIL population.
Genetic Map Construction
An RIL population of 371 lines derived from CN18 and T1208 was used to construct the genetic map. Out of 55K SNP markers, approximately 17K (∼30%) were polymorphic between the parental lines. After removing SNPs with more than 10% missing data or a segregation distortion test p < 10-6, a novel high-density genetic map consisting of 11,642 markers spanning 4,513.95 cM and distributed across 21 wheat chromosomes was constructed (Table 2 and Supplementary Figure S2). For the map length, the A, B, and D genomes spanned 1,169.38 cM (25.91%), 1,394.97 cM (30.90%), and 1949.60 cM (43.19%), respectively. The genetic length of different chromosomes varied from 120.52 cM (1A) to 320.21 cM (2D), averaging 214.95 cM. Among these markers, 11,583 were SNPs derived from the Affymetrix Wheat55K SNP Array, and the remaining 59 markers were SSR markers. These 11,642 markers had 2,001 patterns of segregation in the RIL population, and hence, 2,001 markers with the lowest missing rate in each bin were chosen to represent the corresponding bin and are shown in the genetic map. The number of markers in each bin ranged from 1 to 989 (detailed marker information for each bin is shown in Supplementary Table S1). The bin number of different chromosomes ranged from 40 to 164, and the average loci density and marker density of the genetic map were 2.26 cM and 0.39 cM, respectively. Only 1 gap between 30 cM and 40 cM on chromosome 3D was found in the genetic map. In order to specify the coding region SNP markers mapped to the CN18/T1208 RIL population, the BLASTX search was performed by using the flanking sequences of SNP markers as queries on ENSEMBL. Out of the 11,583 SNP markers, 1,062 SNP (9.17%) markers showed best hits to the Chinese Spring contigs (Supplementary Table S3). Thus, these SNP markers were considered to be the coding region SNP.
TABLE 2. Distribution of mapped markers on 21 chromosomes in genetic map constructed by CN18/T1208 RIL population.
QTL Analysis in Individual Environments
Using the ICIM method, a total of 28 additive QTL for TNES, TNPW, MTN, and PTN were identified within at least 1 year (Table 3). The LOD thresholds for each trait were 4.06, 4.22, 4.23, and 4.08, respectively. If the confidence interval of the corresponding QTL were overlapped, these QTL were considered, and named, as one QTL. The putative additive QTL were mapped to chromosomes 1A, 2B, 2D, 4A, 4D, 5A, 5D, 6D, and 7D, respectively (Figure 1 and Table 3). The LOD values of each QTL ranged from 4.88 to 35.11, with an additive effect from -37.66 to 18.71, and each QTL explained 0.74–19.39% of the observed phenotypic variation. At the MTN and PTN stages, qTN-2D.1, qTN-2D.2, qTN-4A, qTN-4D.2, qTN-5D.1, and qTN-7D were identified in both years. qTN-2D.1, qTN-2D.2, and qTN-5A.1 were identified in at least three growth stages. The QTL mentioned above were considered stable QTL. The seven stable QTL were verified in combined QTL analysis. For qTN-2D.1, qTN-2D.2, qTN-5A.1, qTN-5D.1, and qTN-7D, the positive effects that increased TN were derived from CN18. Conversely, the positive effects were provided by T1208 for the remaining two QTL.
TABLE 3. Putative additive QTL for TN at different growth stages by ICIM method.
FIGURE 1. Chromosomal locations of the seven stable QTL associated with TNES, TNPW, MTN, and PTN based on a 371 RIL population derived from a across between CN18 and T1208. QTL intervals were determined by LOD-2 from the peak. The putative QTL clusters were marked clearly on the chromosomes.
Combined QTL by Environment Interaction Analysis
The results of using the MET module for combined QTL by environment interaction analysis of the seven putative stable QTL showed that all the QTL were detected across the different tiller growth stages (Figure 1 and Table 4). The LOD values of the cQTL ranged from 4.47 to 69.52, and each cQTL explained 1.63–21.22% of the observed phenotypic variation. The LOD (A) and LOD (AE) of the seven stable cQTL were 1.55–39.73 and 1.35–54.70, respectively. Among these cQTL, cqTN-2D.2 could be detected in all tiller growth stages, two cQTL (cqTN-4A and cqTN-5D.1) could be detected in three growth stages, and two cQTL (cqTN-2D.1 and cqTN-5A.1) could be detected in two growth stages. The additive effects of cqTN-2D.1, cqTN-2D.2, cqTN-5A.1, cqTN-5D.1, and cqTN-7D were negative, indicating that alleles from CN18 enhance TN across different growth stages at these QTL levels. The chromosomal location of all QTL showed six QTL clusters mapped to 2D, 4A, 4D, 5A, 5D, and 7D, respectively (Figure 1 and Table 5). These QTL clusters contained 14 single environmental QTL and 19 combined QTL associated with TN. QTL clusters C1, C3, C4, and C5 contained major QTL. In C1, C4, C5, and C6, beneficial alleles derived from CN18 contributed to increased TN at different growth stages. In C2, alleles from T1208 increased TN. C1 is a 25.70 cM region on chromosome 2D that consists of 11 QTL associated with all traits (Table 5).
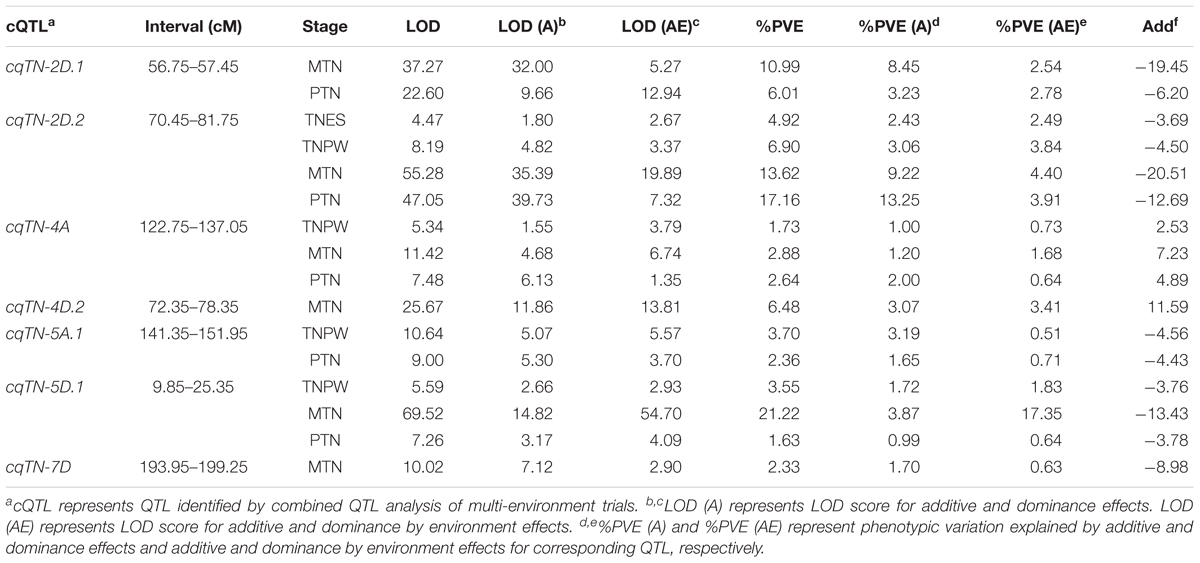
TABLE 4. Combined QTL analysis for stable QTL.
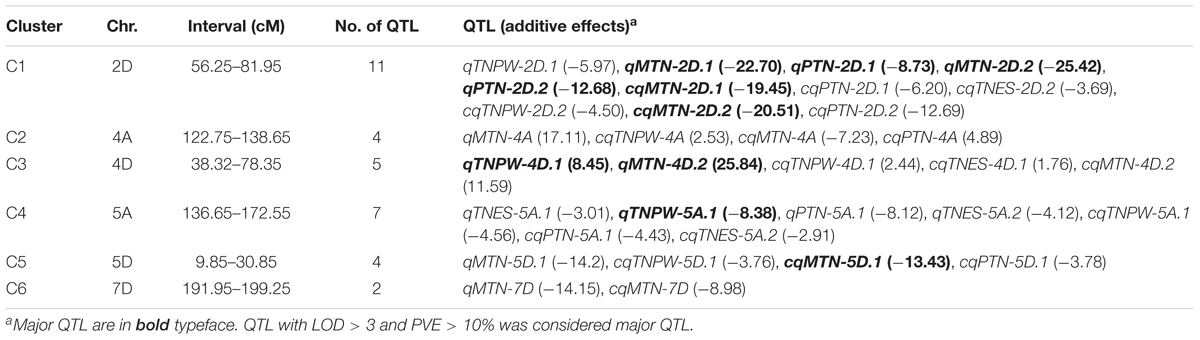
TABLE 5. QTL clusters simultaneously affecting TNES, TNPW, MTN, and PTN in CN18/T1208 RIL population.
The flanking sequences of the closet SNP markers of the seven stable QTL were used in BLASTN against the Chinese Spring contigs. cqTN-2D.1, cqTN-2D.2, cqTN-4A, cqTN-4D.2, cqTN-5A.1, and cqTN-7D showed the best hits to chromosomes 2DS, 2DS, 4AL, 4DL, 5AL, and 7DS, respectively. In addition, cqTN-5D.1 showed the best hits for both 5DS and 5DL. All flanking SNP markers showed 100% hits against the chosen Chinese Spring contigs. By comparing the flanking markers to the physical locations, these QTL spanned 11.68 Mb, 13.71 Mb, 21.98 Mb, 7.36 Mb, 62.46 Mb, 40.50 Mb, and 26.98 Mb, respectively. The candidate genes prediction of cqTN-2D.2 (AX-109283238-AX-110544009: 82189047-95895626) and cqTN-4D.2 (AX-109330191-AX-110466464: 374963016-382320415) was performed by the flanking sequences of linkage SNP markers. The results showed that 136 and 56 candidate genes in the mentioned above regions of chromosome 2D and chromosome 4D, respectively (Supplementary Figure S3). The regions might include candidate genes for cqTN-2D.2 and cqTN-4D.2.
The closest markers of the seven stable cQTL were employed to detect effects in the RIL population (Table 6). The closest marker of cqTN-2D.2 was AX-109283238, its biallelic polymorphic alleles were C//T, and the TN of homozygous alleles from CN18 were 250.88, 493.56, and 310.94 in the TNPW, MTN, and PTN growth stages, respectively. The TN of homozygous alleles from T1208 were 227.05, 382.06, and 267.36, respectively. The TN differences between the two genotypes of AA (from CN18) and aa (from T1208) were significant (p < 0.001).
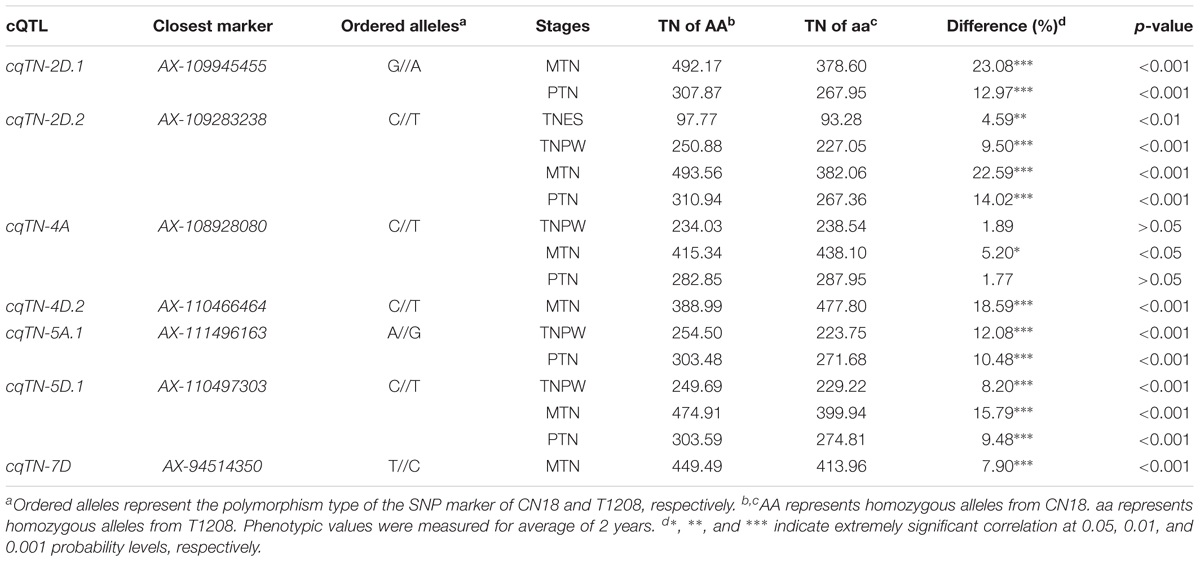
TABLE 6. Effects of seven stable QTL in RIL population.
Dynamic QTL Analysis for TN Across Different Growth Stages
The results of combined QTL analysis were used to perform dynamic QTL analysis, and a total of seven QTL were detected in different growth stages of tillering (Table 4, Figure 2, and Supplementary Table S2). These QTL were mapped to chromosomes 2B, 2D, 4A, 5A, 5D, and 6D, respectively. Among these QTL, cqTN-2D.1, cqTN-2D.2, cqTN-4A, cqTN-5A.1, and cqTN-5D.1 were considered stable QTL and were co-segregated with the QTL identified in the individual environments. The cqTN-2D.2 QTL was detected in the four growth stages, the LOD of cqTN-2D.2 ranged from 4.47 to 55.28, and the LOD (A) and LOD (AE) ranged from 1.80 to 39.73 and 2.67 to 19.89, respectively. The total phenotypic variation explained (PVE) ranged from 4.92 to 17.06%, and the PVE (A) and PVE (AE) ranged from 2.43 to 13.25% and 2.49 to 4.40%, respectively (Table 4). Both cqTN-5A.1 and cqTN-6D were detected at the TNPW and PTN growth stages with similar additive effects, but these two QTL did not express at the MTN growth stage (Table 4 and Figure 2). The most important QTL cluster C1 was mapped to chromosome 2DS, where the beneficial alleles from CN18 increased TN at all growth stages (Tables 5, 6).
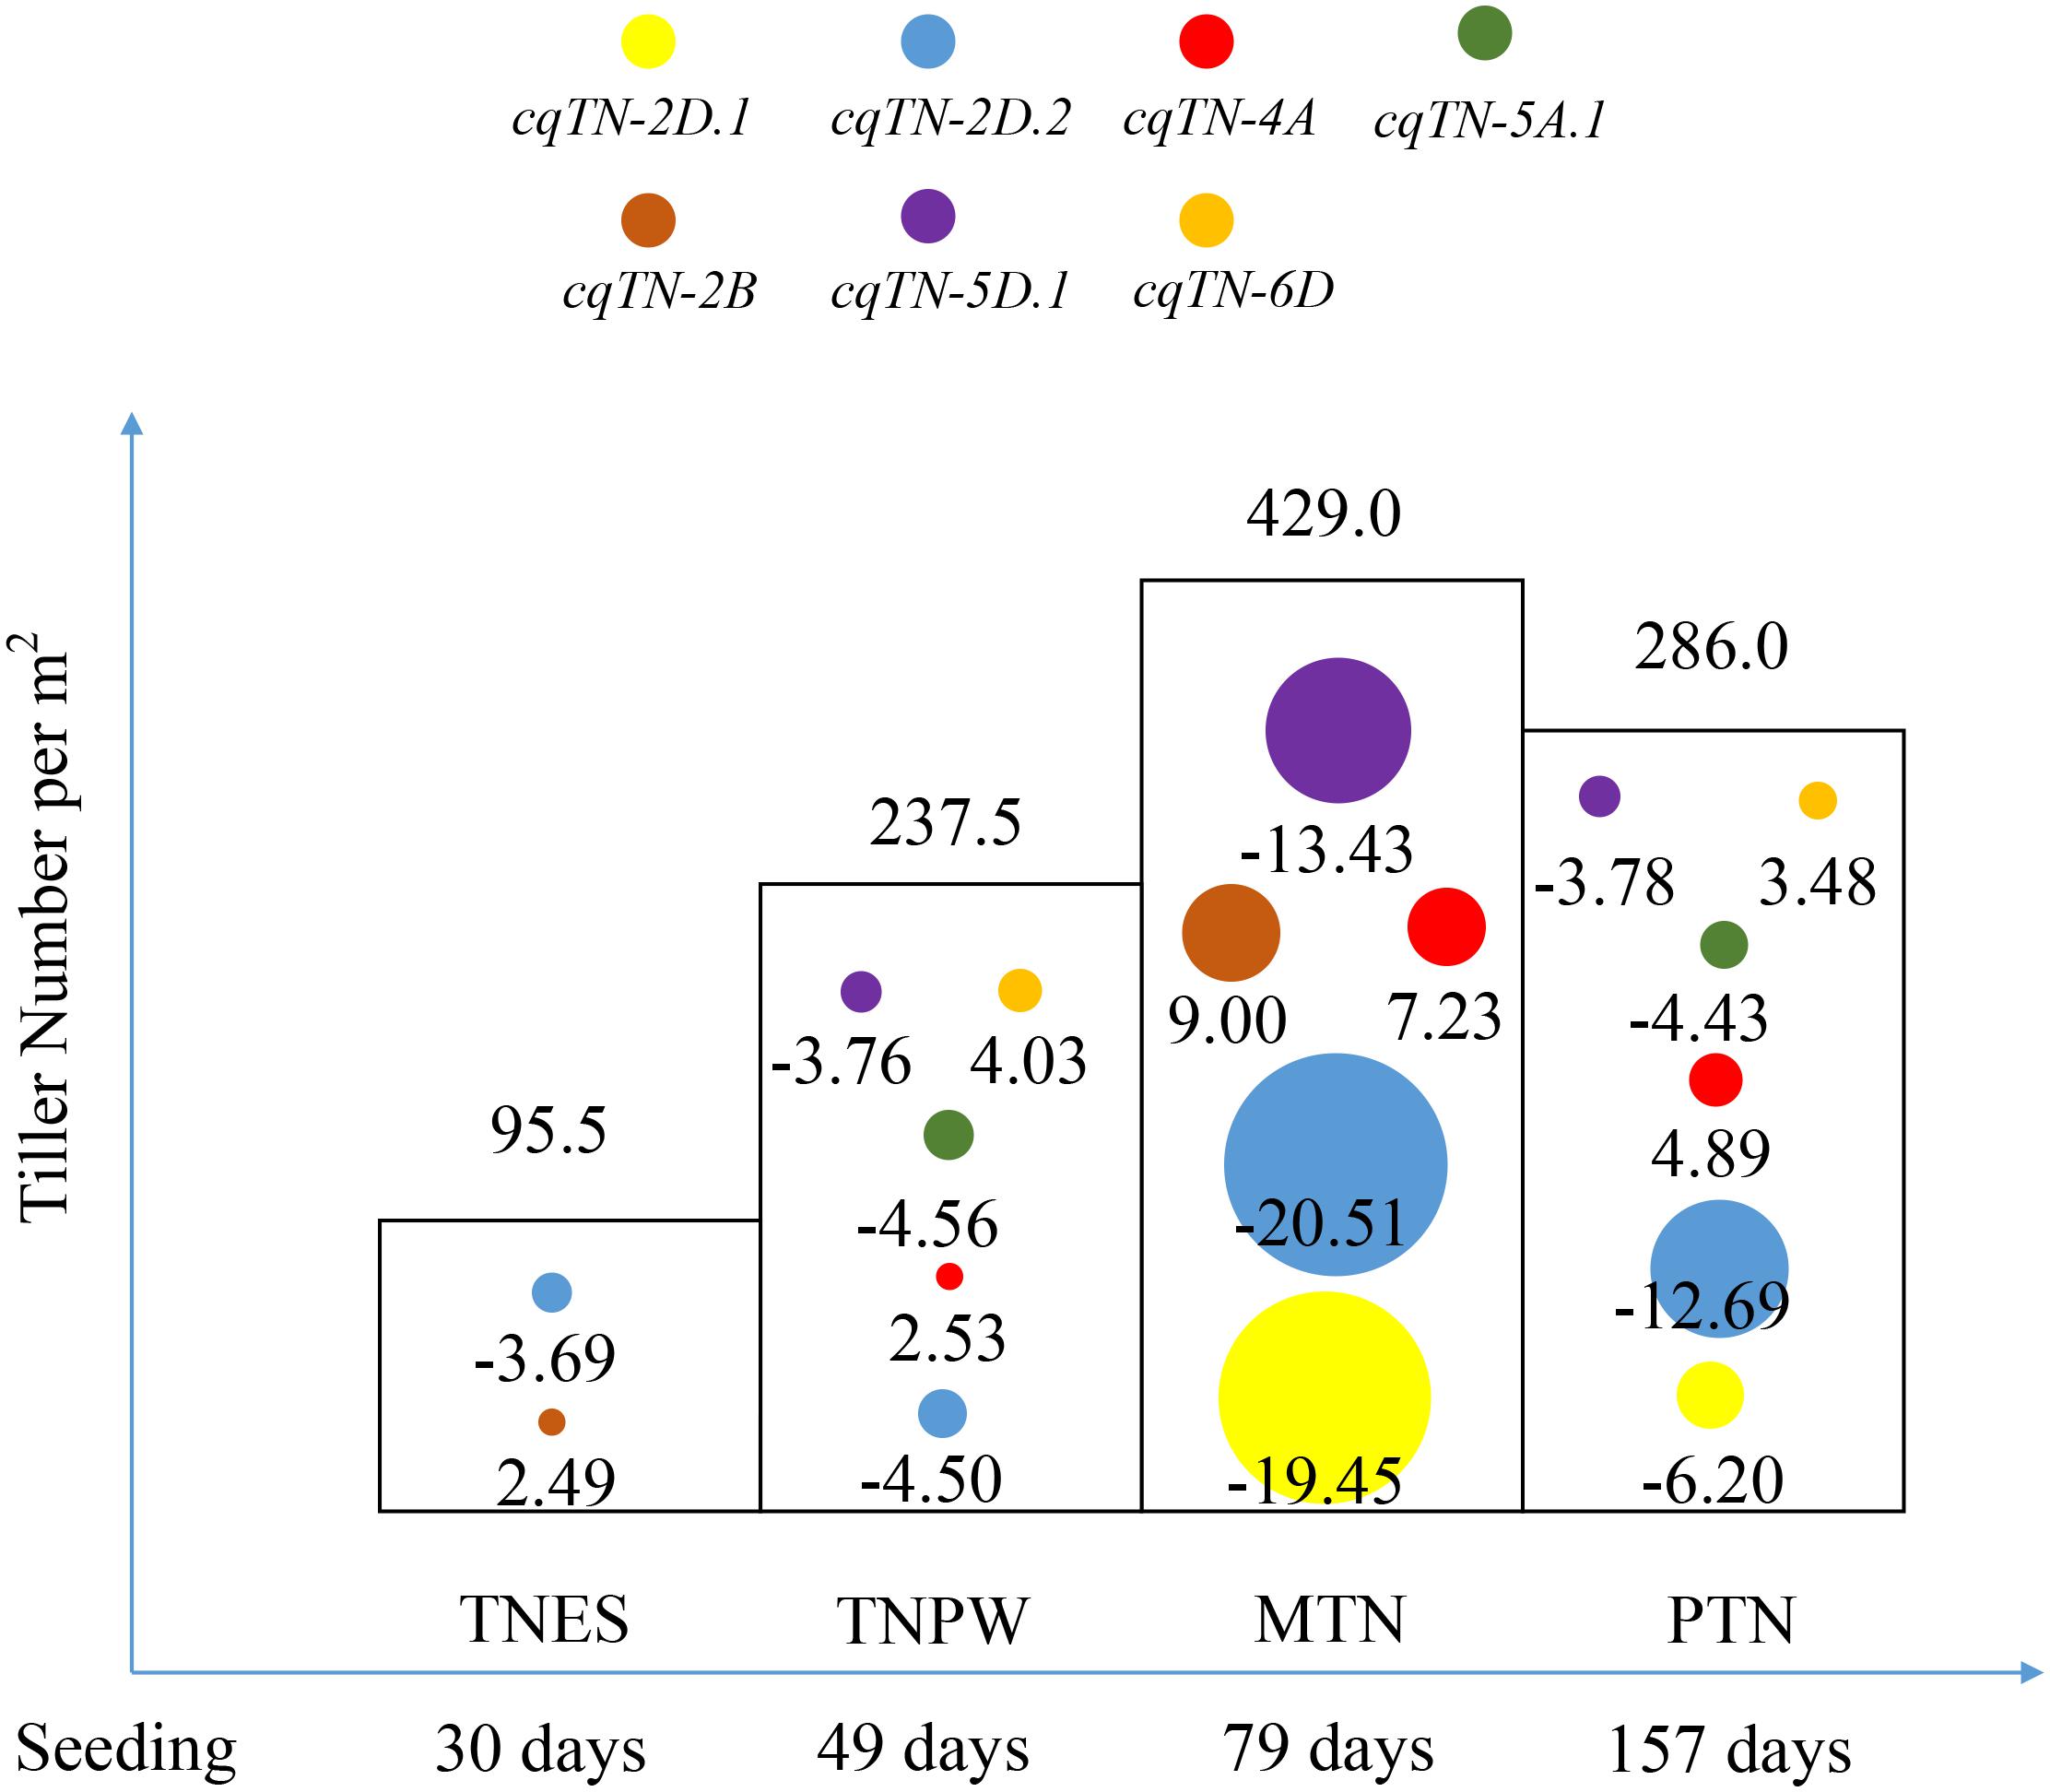
FIGURE 2. The dynamic QTL analysis for TN across four growth stages. Circles with different colors represent different QTL identified by combined QTL analysis. The value below each circle represents the additive effect of corresponding QTL. The value at the top of each column represents the average tiller number across the RIL population between 2 years. TNES, TNPW, MTN, and PTN represent the different growth stages of tillering.
Discussion
QTL Mapping for TN and Comparison With Other Studies
In the present study, seven stable QTL for TNES, TNPW, MTN, and PTN were mapped to different chromosomes (Tables 3, 4). Among them, cqTN-2D.1 at the MTN growth stage, cqTN-2D.2 at the MTN and PTN growth stages, and cqTN-5D.1 at the MTN growth stage were considered major. TN were affecting by the environmental factors, such as seeding density, sowing time and temperature, etc. In our previous study it was indicated that influence of weather was in a credible range during 2014–2016 (Tang et al., 2017). Moreover, the correlation of TNES, TNPW, MTN, and PTN between two experiment years were significant positive (p < 0.001) (Table 1 and Supplementary Figure S1). These also could prove that the data were accurate and believable. The results of QTL and environment interaction analysis showed that the phenotypic variation explained by environment effects of cqTN-2D.2 were small, indicated that cqTN-2D.2 might be a stable QTL (Table 4). Huang et al. (2003) reported a QTL associated with TN mapped to chromosome 2DL. In addition, Qltn.sicau-2D was a major, stable QTL mapped to chromosome 2DL that reduces the tiller number in the H461/CN16 RIL population (Wang et al., 2016). However, cqTN-2D.1 and cqTN-2D.2 were both localized in a QTL cluster on chromosome 2DS, according to the results of BLASTN of the flanking SNPs against the Chinese Spring contigs. Xu et al. (2017) reported a major QTL for plant height and MTN on chromosome 2DS that is linked with SSR marker Xcfd11, which was located on the short arm far from the centromere based on the physical location of Chinese Spring from the United States Department of Agriculture9. Neither cqTN-2D.1 nor cqTN-2D.2 were the same as these QTL. Therefore, cqTN-2D.1 and cqTN-2D.2 were novel QTL for TN in wheat and have application value for MAS in breeding programs; the beneficial alleles of these QTL were both from CN18. We have reported a major QTL associated with TNPW and MTN, and this QTL (cqTN-4D.1) was also detected in the present study (Supplementary Table S2). As no polymorphism markers were detected between SSR markers Xcfd23 and Xwmc288, we could not refine mapping of this QTL. However, it is conceivable that a QTL cluster mapped to chromosome 4D controls TN and related traits. Li et al. (2010) reported a QTL controlling TN mapped to chromosome 5D that is closely linked to SSR marker Xwmc215. The method of relative percentages was used by converting genetic distances to identify the relationship of this QTL and cqTN-5D.1 (Wang et al., 2016). The results showed that the average relative percentage of Xwmc215 was 57.48%, whereas the relative percentage of cqTN-5D.1 in this study was 9.79%, indicating that these two QTL are not the same. A major QTL increasing TN was mapped to chromosome 5AL and linked to SSR marker Xpsr370 (Kato et al., 2000), and it was proved that is near the end of chromosome 5AL associated with Qltn.sicau-5A (Wang et al., 2016). In the present study, cqTN-5A.1 and cqTN-5A.2 were also detected approximately 20 cM near the end of chromosome 5AL, and these QTL were considered to be linked or identical. In addition, Zou et al. (2017) reported a QTL cluster near the end of chromosome 5AL that was associated with flowering time and maturity in wheat using the 90K SNP Array. Based on various genetic backgrounds and different marker types, we assume that there is an enrichment region near the end of chromosome 5AL that controls several agronomic traits.
One hundred and thirty-six and fifty-six candidate genes of cqTN-2D.2 (13.71 Mb) and cqTN-4D.2 (7.36 Mb) were predicted by the flanking sequences of linkage SNP markers, respectively (Supplementary Figure S3). These candidate genes could provide more information of MTN and PTN. The results provide a better understanding of the QTL selectively expressing the control of tiller number and will facilitate future map-based cloning.
The BLASTX search was performed by using the flanking sequences of SNP markers as queries on ENSEMBL. 1,062 out of 11,583 (9.17%) SNP markers showed best hits to the Chinese Spring contigs (Supplementary Table S3). In the previously study, the Wheat660K Array hit 8.90% to the Chinese Spring contigs (Cui et al., 2017). It was indicated that Wheat55K Array was efficient and valid to construct a high-density wheat genetic map as Wheat660K Array.
Dynamic Analysis of TN at QTL Level
The theory of developmental genetics suggests that QTL may have temporal expression during trait growth stages (Zhu, 1995; Liu et al., 2009). Therefore, it is necessary to identify the dynamic expression of QTL at different growth stages. The dynamic QTL analysis of rice TN and plant height has been reported (Liu et al., 2010, 2012), but dynamic QTL analyses of TN in wheat are limited. Xie et al. (2016) reported QTL cluster-associated tillering dynamics of wheat using RFLP and SSR markers that were mapped to chromosome 5AL. The dynamic analysis of wheat PH also showed a temporal expression pattern of QTL in various growth stages and environments (Wang et al., 2010). In the present study, a high-density genetic map derived from the Wheat55K SNP Array was employed for dynamic QTL analysis for TN and spike number (designated at PTN and considered as a growth stage of tillering) in wheat. cqTN-2D.2 (Table 4) is a major, stable QTL located in QTL cluster C1 and mapped to chromosome 2DS, and the PVE of this QTL is <10% in the TNES and TNPW stages and >10% in MTN and PTN stages, which are the most important stages affecting final grain yield (Naruoka et al., 2011). In addition, the PVE (AE) of the QTL varied at 2.49–4.40%, indicating that this QTL was stable and less affected by environmental factors. Most QTL were detected at the TNPW, MTN, and PTN growth stages. More interestingly, two QTL exhibited dynamic changes across stages. cqTN-5A.1 and cqTN-6D were detected at TNPW and PTN growth stages, with similar additive effects but were not expressed at MTN stage. These two QTL verified the theory of developmental genetics that temporal QTL may have similar final effects (Zhu, 1995; Liu et al., 2009). Both cqTN-4D.2 and cqTN-7D were only expressed at the MTN stage; although previous studies demonstrated that MTN determines PTN (Li et al., 2010; Naruoka et al., 2011), there are QTL controlling tiller development but not tiller survival. Previous studies suggested that genes and QTL of high pleiotropy are expected to be under strong stabilizing selection (Hodgkin, 1998). Therefore, for breeding, cqTN-2D.2 may be the best choice because it can be more stable across different environments. Furthermore, its additive effects are negative, indicating that beneficial alleles derived from CN18 increased TN at all growth stages. Understanding the temporal expression pattern of QTL based on dynamic analysis would help elucidate the genetic basis of tillering and help breeders decide when to utilize these QTL and their associated markers.
Elite Alleles From CN18
Identification of useful alleles by association analysis has been an effective method for plant genomic research and MAS in recent years (Wang et al., 2016; Chen et al., 2017). In the present study, we verified the effects and beneficial alleles of QTL in the RIL population (Table 6). For instance, RILs with CN18 alleles at the cqTN-2D.1, on average, had 23.08% (p < 0.001) and 12.97% (p < 0.001) more TN than RILs with T1208 alleles, respectively. In addition, cqTN-2D.2, cqTN-5A.1, cqTN-5D.1, and cqTN-7D had the same effects in the RIL population. Only cqTN-4A had no significant differences in the RIL population, and the beneficial allele at cqTN-4D.2 was from T1208. Almost all beneficial alleles were from CN18, and the lines that carry these elite alleles could provide valuable information in breeding programs. The validation of QTL effects in the RIL population is a powerful tool for identifying the molecular markers associated with quantitative traits in wheat.
Previous research has suggested that limited-tillering cultivars have higher yield-increasing potential than free-tillering cultivars in wheat and barley (Richards, 1988; Donald, 2009). However, this may not apply to Sichuan Province due to special environmental factors, such as fewer light hours and high humidity. CN18 is a multiple-spike wheat cultivar with high-tillering capacity, and the average spike formation rate of CN18 was 0.77 (Hu et al., 2017). According to the variety region trials in Sichuan Province, the yield of CN18 was 17.70% higher than the control cultivar (Ren et al., 2011), indicating that free-tillering cultivars had the same yield-increasing potential as limited-tillering cultivars in Sichuan Province and similar environments. For multiple-spike wheat cultivars, although some tillers die before harvest, small tillers contribute to the carbohydrate supply in spike formation (Lupton and Pinthus, 1969). Thus, beneficial alleles from CN18 at the QTL level are useful resources for elucidating the regulatory mechanisms underlying the genetic basis of tillering.
Conclusion
In the present study, a high-density genetic map was constructed using the Wheat55K SNP Array for the first time in the CN18/T1208 RIL population; this map consisted of 371 lines. Seven stable QTL for TN at different growth stages were identified, and among these, cqTN-2D.1, cqTN-2D.2, and cqTN-5D.1 were novel stable QTL. The beneficial alleles of these QTL were detected in the RIL population, and the beneficial alleles from CN18 at the QTL level and wheat lines with transgressive phenomena in the RIL population are useful germplasm resources. The present study improves our understanding of the genetic basis of TN and temporal expression of these QTL in wheat, as well as MAS and map-based cloning. The Wheat55K SNP Array is valid for wheat genetic mapping.
Author Contributions
TR and ZL conceived the project. TR and ZR constructed the RIL population. TR, YH, YT, CL and ZL carried out the experiments. TR, YH, ZL, YT, ZR, FT, ZT, SF, and BY performed the phenotypic data. YH and TR analyzed the experimental results and wrote the manuscript.
Funding
This work was supported by the National Natural Science Foundation of China [#31271722].
Conflict of Interest Statement
The authors declare that the research was conducted in the absence of any commercial or financial relationships that could be construed as a potential conflict of interest.
Supplementary Material
The Supplementary Material for this article can be found online at: https://www.frontiersin.org/articles/10.3389/fpls.2018.00333/full#supplementary-material
FIGURE S1 | Phenotypic distribution of tiller number at early stage per unit area (TNES), tiller number during pre-winter per unit area (TNPW), maximum tiller number per unit area (MTN), and productive tiller number per unit area (PTN) in 2015 and 2016, respectively. The arrows indicate values of the parental lines: CN18 (C) and T1208 (T).
FIGURE S2 | Genetic map of CN18/T1208 RIL population constructed by Wheat55K SNP Array.
FIGURE S3 | Predicted genes of cqTN-2D.2 (2D: 82189047-95895626) and cqTN-4D.2 (4D: 374963016-382320415) in Triticum aestivum.
TABLE S1 | The detail information of each bin in linkage map construction.
TABLE S2 | QTL detected by multi-environmental analysis.
TABLE S3 | The coding region SNP (cSNP) marker mapped to the CN18/T1208 RIL population.
Footnotes
- ^https://www.ers.usda.gov/data-products/wheat-data.aspx
- ^http://www.tsingke.net
- ^http://www.affymetrix.com/support/downloads/manuals/axiom_analysis_suite_user_guide.pdf
- ^http://www.isbreeding.net/
- ^http://www.mybiosoftware.com/mapchart-2-2-graphical-presentation-linkage-maps-qtls.html
- ^http://plants.ensembl.org
- ^http://www.wheatgenome.org/
- ^http://urgi.versailles.inra.fr/download/iwgsc/
- ^http://wheat.pw.usda.gov/cgi-bin/cmap/
References
Alam, M. M., Mace, E. S., van Oosterom, E. J., Cruickshank, A., Hunt, C. H., Hammer, G. L., et al. (2014). QTL analysis in multiple sorghum populations facilitates the dissection of the genetic and physiological control of tillering. Theor. Appl. Genet. 127, 2253–2266. doi: 10.1007/s00122-014-2377-9
Allen, A. M., Winfield, M. O., Burridge, A. J., Downie, R. C., Benbow, H. R., Barker, G. L., et al. (2017). Characterization of a Wheat Breeders’ Array suitable for high-throughput SNP genotyping of global accessions of hexaploid bread wheat (Triticum aestivum). Plant Biotechnol. J. 15, 390–401. doi: 10.1111/pbi.12635
Cavanagh, C. R., Chao, S., Wang, S., Huang, B. E., Stephen, S., Kiani, S., et al. (2013). Genome-wide comparative diversity uncovers multiple targets of selection for improvement in hexaploid wheat landraces and cultivars. Proc. Natl. Acad. Sci. U.S.A. 110, 8057–8062. doi: 10.1073/pnas.1217133110
Chen, G. F., Wu, R. G., Li, D. M., Yu, H. X., Deng, Z., and Tian, J. C. (2017). Genomewide association study for seeding emergence and tiller number using snp markers in an elite winter wheat population. J. Genet. 96, 177–186. doi: 10.1007/s12041-016-0731-1
Cui, F., Ding, A., Li, J., Zhao, C., Wang, L., Wang, X., et al. (2011). QTL detection of seven spike-related traits and their genetic correlations in wheat using two related RIL populations. Euphytica 186, 177–192. doi: 10.1007/s10681-011-0550-7
Cui, F., Zhang, N., Fan, X. L., Zhang, W., Zhao, C. H., Yang, L. J., et al. (2017). Utilization of a Wheat660K SNP array-derived high-density genetic map for high-resolution mapping of a major QTL for kernel number. Sci. Rep. 7:3788. doi: 10.1038/s41598-017-04028-6
Deng, S., Wu, X., Wu, Y., Zhou, R., Wang, H., Jia, J., et al. (2011). Characterization and precise mapping of a QTL increasing spike number with pleiotropic effects in wheat. Theor. Appl. Genet. 122, 281–289. doi: 10.1007/s00122-010-1443-1
Donald, C. M. (2009). A barley breeding programme based on an ideotype. J. Agric. Sci. 93, 261–269. doi: 10.1017/S0021859600037941
Fowler, D. B. (1982). Date of seeding, fall growth, and winter survival of winter wheat and rye. Agron. J. 74:1060. doi: 10.2134/agronj1982.00021962007400060030x
Gao, F., Wen, W., Liu, J., Rasheed, A., Yin, G., Xia, X., et al. (2015). Genome-Wide linkage mapping of QTL for yield components, plant height and yield-related physiological traits in the Chinese wheat cross Zhou 8425B/Chinese Spring. Front. Plant Sci. 6:1099. doi: 10.3389/fpls.2015.01099
Givry, S., Bouchez, M., Chabrier, P., Milan, D., and Schiex, T. (2005). CARTHA GENE: multipopulation integrated genetic and radiation hybrid mapping. Bioinformatics 21, 1703–1704. doi: 10.1093/bioinformatics/bti222
Hammer, G., Cooper, M., Tardieu, F., Welch, S., Walsh, B., van Eeuwijk, F., et al. (2006). Models for navigating biological complexity in breeding improved crop plants. Trends Plant Sci. 11, 587–593. doi: 10.1016/j.tplants.2006.10.006
Hu, Y. S., Ren, T. H., Li, Z., Tang, Y. Z., Ren, Z. L., and Yan, B. J. (2017). Molecular mapping and genetic analysis of a QTL controlling spike formation rate and tiller number in wheat. Gene 634, 15–21. doi: 10.1016/j.gene.2017.08.039
Huang, X. Q., Coster, H., Ganal, M. W., and Roder, M. S. (2003). Advanced backcross QTL analysis for the identification of quantitative trait loci alleles from wild relatives of wheat (Triticum aestivum L.). Theor. Appl. Genet. 106, 1379–1389. doi: 10.1007/s00122-002-1179-7
Kato, K., Miura, H., and Sawada, S. (2000). Mapping QTLs controlling grain yield and its components on chromosome 5A of wheat. Theor. Appl. Genet. 101, 1114–1121. doi: 10.1007/s001220051587
Kosambi, D. D. (1943). The estimation of map distances from recombination values. Ann. Eugen. 12, 172–175. doi: 10.1111/j.1469-1809.1943.tb02321.x
Kumar, J., and Nagarajan, S. (1998). Role of flag leaf and spike emergence stage on the incidence of Karnal bunt in wheat. Plant Dis. 82, 1368–1370. doi: 10.1094/PDIS.1998.82.12.1368
Kuraparthy, V., Sood, S., Dhaliwal, H. S., Chhuneja, P., and Gill, B. S. (2007). Identification and mapping of a tiller inhibition gene (tin3) in wheat. Theor. Appl. Genet. 114, 285–294. doi: 10.1007/s00122-006-0431-y
Lanning, S. P., Martin, J. M., Stougaard, R. N., Guillen-Portal, F. R., Blake, N. K., Sherman, J. D., et al. (2012). Evaluation of near-isogenic lines for three height-reducing genes in hard red spring wheat. Crop Sci. 52:1145. doi: 10.2135/cropsci2011.11.0625
Li, H., Ye, G., and Wang, J. (2007). A modified algorithm for the improvement of composite interval mapping. Genetics 175, 361–374. doi: 10.1534/genetics.106.066811
Li, X., Quigg, R. J., Zhou, J., Xu, S., Masinde, G., Mohan, S., et al. (2006). A critical evaluation of the effect of population size and phenotypic measurement on QTL detection and localization using a large F2 murine mapping population. Genet. Mol. Biol. 29, 166–173. doi: 10.1590/S1415-47572006000100030
Li, Z., Peng, T., Xie, Q., Han, S., and Tian, J. (2010). Mapping of QTL for tiller number at different stages of growth in wheat using double haploid and immortalized F2 populations. J. Genet. 89, 409–415. doi: 10.1007/s12041-010-0059-1
Liu, G., Zeng, R., Zhu, H., Zhang, Z., Ding, X., Zhao, F., et al. (2009). Dynamic expression of nine QTLs for tiller number detected with single segment substitution lines in rice. Theor. Appl. Genet. 118, 443–453. doi: 10.1007/s00122-008-0911-3
Liu, G., Zhu, H., Liu, S., Zeng, R., Zhang, Z., Li, W., et al. (2010). Unconditional and conditional QTL mapping for the developmental behavior of tiller number in rice (Oryza sativa L.). Genetica 138, 885–893. doi: 10.1007/s10709-010-9471-y
Liu, G., Zhu, H., Zhang, G., Li, L., and Ye, G. (2012). Dynamic analysis of QTLs on tiller number in rice (Oryza sativa L.) with single segment substitution lines. Theor. Appl. Genet. 125, 143–153. doi: 10.1007/s00122-012-1822-x
Lu, Y., Xing, L., Xing, S., Hu, P., Cui, C., Zhang, M., et al. (2015). Characterization of a putative new semi-dominant reduced height gene, Rht_NM9, in wheat (Triticum aestivum L.). J. Genet. Genomics 42, 685–698. doi: 10.1016/j.jgg.2015.08.007
Lupton, F. G. H., and Pinthus, M. J. (1969). Carbohydrate translocation from small tillers to spike-producing shoots in wheat. Nature 221, 483–484. doi: 10.1038/221483a0
Meng, L., Li, H., Zhang, L., and Wang, J. (2015). QTL IciMapping: integrated software for genetic linkage map construction and quantitative trait locus mapping in biparental populations. Crop J. 3, 269–283. doi: 10.1016/j.cj.2015.01.001
Naruoka, Y., Talbert, L. E., Lanning, S. P., Blake, N. K., Martin, J. M., and Sherman, J. D. (2011). Identification of quantitative trait loci for productive tiller number and its relationship to agronomic traits in spring wheat. Theor. Appl. Genet. 123, 1043–1053. doi: 10.1007/s00122-011-1646-0
Nasseer, A. M., Martin, J. M., Heo, H. Y., Blake, N. K., Sherman, J. D., Pumphrey, M., et al. (2016). Impact of a quantitative trait locus for tiller number on plasticity of agronomic traits in spring wheat. Crop Sci. 56, 595–602. doi: 10.2135/cropsci2015.05.0325
Peng, Z. S., Yen, C., and Yang, J. L. (1998). Genetic control of oligo-culms character in common wheat. Wheat Inform. Serv. 86, 19–24.
Rasheed, A., Hao, Y., Xia, X., Khan, A., Xu, Y., Varshney, R. K., et al. (2017). Crop breeding chips and genotyping platforms: progress, challenges, and perspectives. Mol. Plant 10, 1047–1064. doi: 10.1016/j.molp.2017.06.008
Ren, T. H., Chen, F., Zhang, H. Q., Yan, B. J., and Ren, Z. L. (2011). Application of 1RS.1BL translocation in the breeding of “Chuannong” series wheat cultivars. J. Triticeae Crops 31, 430–436.
Richards, R. A. (1988). A tiller inhibitor gene in wheat and its effect on plant growth. Aust. J. Agric. Res. 39, 749–757. doi: 10.1071/AR9880749
Spielmeyer, W., and Richards, R. A. (2004). Comparative mapping of wheat chromosome 1AS which contains the tiller inhibition gene (tin) with rice chromosome 5S. Theor. Appl. Genet. 109, 1303–1310. doi: 10.1007/s00122-004-1745-2
Tang, H., Wang, H., He, M., Zhang, M., Hu, Y., Li, Z., et al. (2017). QTL analysis for wheat falling number in a recombinant inbred line population segregated with 1BL/1RS translocation in a rainfed agricultural area of China. Euphytica 213:235. doi: 10.1007/s10681-017-2028-8
Tanksley, S. D., Young, N. D., Paterson, A. H., and Bonierbale, M. W. (1989). RFLP mapping in plant breeding: new tools for an old science. Nat. Biotechnol. 7, 257–264. doi: 10.1038/nbt0389-257
Vales, M. I., Schon, C. C., Capettini, F., Chen, X. M., Corey, A. E., Mather, D. E., et al. (2005). Effect of population size on the estimation of QTL: a test using resistance to barley stripe rust. Theor. Appl. Genet. 111, 1260–1270. doi: 10.1007/s00122-005-0043-y
Varshney, R. K., Nayak, S. N., May, G. D., and Jackson, S. A. (2009). Next-generation sequencing technologies and their implications for crop genetics and breeding. Trends Biotechnol. 27, 522–530. doi: 10.1016/j.tibtech.2009.05.006
Wang, Y., Cheng, X., Shan, Q., Zhang, Y., Liu, J., Gao, C., et al. (2014). Simultaneous editing of three homoeoalleles in hexaploid bread wheat confers heritable resistance to powdery mildew. Nat. Biotechnol. 32, 947–951. doi: 10.1038/nbt.2969
Wang, Z., Liu, Y., Shi, H., Mo, H., Wu, F., Lin, Y., et al. (2016). Identification and validation of novel low-tiller number QTL in common wheat. Theor. Appl. Genet. 129, 603–612. doi: 10.1007/s00122-015-2652-4
Wang, Z., Wu, X., Ren, Q., Chang, X., Li, R., and Jing, R. (2010). QTL mapping for developmental behavior of plant height in wheat (Triticum aestivum L.). Euphytica 174, 447–458. doi: 10.1007/s10681-010-0166-3
Winfield, M. O., Allen, A. M., Burridge, A. J., Barker, G. L., Benbow, H. R., Wilkinson, P. A., et al. (2016). High-density SNP genotyping array for hexaploid wheat and its secondary and tertiary gene pool. Plant Biotechnol. J. 14, 1195–1206. doi: 10.1111/pbi.12485
Wu, Q. H., Chen, Y. X., Zhou, S. H., Fu, L., Chen, J. J., Xiao, Y., et al. (2015). High-density genetic linkage map construction and QTL mapping of grain shape and size in the wheat population Yanda1817 x Beinong6. PLoS One 10:e0118144. doi: 10.1371/journal.pone.0118144
Xie, Q., Mayes, S., and Sparkes, D. L. (2016). Optimizing tiller production and survival for grain yield improvement in a bread wheat x spelt mapping population. Ann. Bot. 117, 51–66. doi: 10.1093/aob/mcv147
Xu, T., Bian, N., Wen, M., Xiao, J., Yuan, C., Cao, A., et al. (2017). Characterization of a common wheat (Triticum aestivum L.) high-tillering dwarf mutant. Theor. Appl. Genet. 130, 483–494. doi: 10.1007/s00122-016-2828-6
Yan, J. Q., Zhu, J., He, C. X., Benmoussa, M., and Wu, P. (1998). Quantitative trait loci analysis for the developmental behavior of tiller number in rice (Oryza sativa L.). Theor. Appl. Genet. 97, 267–274.
Yu, K., Liu, D., Wu, W., Yang, W., Sun, J., Li, X., et al. (2017). Development of an integrated linkage map of einkorn wheat and its application for QTL mapping and genome sequence anchoring. Theor. Appl. Genet. 130, 53–70. doi: 10.1007/s00122-016-2791-2
Yuan, Y., Gao, M., Zhang, M., Zheng, H., Zhou, X., Guo, Y., et al. (2017). QTL mapping for phosphorus efficiency and morphological traits at seedling and maturity stages in wheat. Front. Plant Sci. 8:614. doi: 10.3389/fpls.2017.00614
Zadoks, J. C., Chang, T. T., and Konzak, C. F. (1974). A decimal code for the growth stages of cereals. Weed Res. 14, 415–421. doi: 10.1111/j.1365-3180.1974.tb01084.x
Zhai, H., Feng, Z., Li, J., Liu, X., Xiao, S., Ni, Z., et al. (2016). QTL analysis of spike morphological traits and plant height in winter wheat (Triticum aestivum L.) using a high-density SNP and SSR-based linkage map. Front. Plant Sci. 7:1617. doi: 10.3389/fpls.2016.01617
Zhang, J., Wu, J., Liu, W., Lu, X., Yang, X., Gao, A., et al. (2013). Genetic mapping of a fertile tiller inhibition gene, ftin, in wheat. Mol. Breed. 31, 441–449. doi: 10.1007/s11032-012-9801-0
Zhang, N., Fan, X., Cui, F., Zhao, C., Zhang, W., Zhao, X., et al. (2017). Characterization of the temporal and spatial expression of wheat (Triticum aestivum L.) plant height at the QTL level and their influence on yield-related traits. Theor. Appl. Genet. 130, 1235–1252. doi: 10.1007/s00122-017-2884-6
Zhu, J. (1995). Analysis of conditional genetic effects and variance components in developmental genetics. Genetics 141, 1633–1639.
Keywords: Triticum aestivum L., Wheat55K SNP Array, tiller number, QTL, genetic mapping
Citation: Ren T, Hu Y, Tang Y, Li C, Yan B, Ren Z, Tan F, Tang Z, Fu S and Li Z (2018) Utilization of a Wheat55K SNP Array for Mapping of Major QTL for Temporal Expression of the Tiller Number. Front. Plant Sci. 9:333. doi: 10.3389/fpls.2018.00333
Received: 20 September 2017; Accepted: 28 February 2018;
Published: 15 March 2018.
Edited by:
Anna Maria Mastrangelo, Centro di Ricerca per l’Orticoltura, ItalyReviewed by:
Kaitao Lai, Commonwealth Scientific and Industrial Research Organisation, AustraliaLiezhao Liu, Southwest University, China
Marco Maccaferri, University of Bologna, Italy
Copyright © 2018 Ren, Hu, Tang, Li, Yan, Ren, Tan, Tang, Fu and Li. This is an open-access article distributed under the terms of the Creative Commons Attribution License (CC BY). The use, distribution or reproduction in other forums is permitted, provided the original author(s) and the copyright owner are credited and that the original publication in this journal is cited, in accordance with accepted academic practice. No use, distribution or reproduction is permitted which does not comply with these terms.
*Correspondence: Zhi Li, lizhi@sicau.edu.cn Benju Yan, yanbenju@sicau.edu.cn
†These authors have contributed equally to this work.