 Zhen Yang
 Tiantian Zhao
 Qinghua Ma
- Key Laboratory of Tree Breeding and Cultivation of the State Forestry and Grassland Administration, Research Institute of Forestry, Chinese Academy of Forestry, Beijing, China
Corylus L. is an economically and phylogenetically important genus in the family Betulaceae. Taxonomic and phylogenetic relationships of Corylus species have long been controversial for lack of effective molecular markers. In this study, the complete chloroplast (cp) genomes of six Corylus species were assembled and characterized using next-generation sequencing. We compared the genome features, repeat sequences, sequence divergence, and constructed the phylogenetic relationships of the six Corylus species. The results indicated that Corylus cp genomes were typical of the standard double-stranded DNA molecule, ranging from 160,445 base pairs (bp) (C. ferox var. thibetca) to 161,621 bp (C. yunnanensis) in length. Each genome contained a pair of inverted repeats (IRs), a large single-copy (LSC) region and a small single-copy (SSC) region. Each of the six cp genomes possessed 113 unique genes arranged in the same order, including 80 protein-coding, 29 tRNA, and 4 rRNA genes. C. yunnanensis contained the highest number of repeat sequences, and the richest SSRs in six cp genomes were A/T mononucleotides. Comparative analyses of six Corylus cp genomes revealed four hotspot regions (trnH-psbA, rpoB-trnC, trnF-ndhJ, and rpl32-trnL) that could be used as potential molecular markers. Phylogenetic analyses of the complete chloroplast genomes and 80 protein-coding genes exhibited nearly identical topologies that strongly supported the monophyly of Corylus and simultaneously revealed the generic relationships among Betulaceae. The availability of these genomes can offer valuable genetic information for further taxonomy, phylogeny, and species delimitation in Corylus or even Betulaceae plants.
Introduction
Corylus, comprising 16–20 species, is a transitionally and phylogenetically important genus in the family Betulaceae. Except for abundant phenotypes and species diversity, increasing attention has been paid to this genus, as it includes several economically important species for their commercial and ornamental values. One of the most economic values of Corylus is the nuts sales from several species such as C. avellana in Europe and hybrid variety (C. heterophylla × C. avellana) in China. Another economically important species is C. heterophylla, which is cultivated and utilized as human food in China. Many other species of the genus Corylus also have potential breeding value, such as C. kweichowensis. Furthermore, Corylus species are of important ornamental values, especially C. colurna, C. avellana, and C. chinensis.
Corylus species distribute disjunctively in north temperate zones that ranges from East Asia to Europe and North America. Due to frequent geological vicissitude, climatic change and interspecific hybridization, Corylus has evolved and differentiated toward different directions, making it to be regarded a taxonomically and phylogenetically challenging taxon in plants. Traditional classification of Corylus using a morphology-based system is often unreliable and controversial (Yu, 1979; Zheng, 1985; Huxley et al., 1992; Chen et al., 1999), since it is often influenced by environmental factors. The lack of polymorphic genetic markers and proper DNA fragments for phylogenetic analysis has long hindered the achievement of a reliable phylogeny, which deters better understanding the evolution of the genus Corylus. By using whole-genome scanning markers, including RAPD (Radicati et al., 1997; Galderisi et al., 1999), SSR (Tozaki et al., 2000; Boccacci and Botta, 2010; Bassil et al., 2013; Zhao et al., 2015; Beltramo et al., 2016), AFLP (Leinemann et al., 2013; Martins et al., 2014; Zong et al., 2015), ISSR (Essadki et al., 2006; Ferreira et al., 2009), SRAP (Di et al., 2014), and DNA fragments such as ITS regions and cpDNA fragments (Erdogan and Mehlenbacher, 2000; Whitcher and Wen, 2001; Leinemann et al., 2013; Zong et al., 2015), numerous previous endeavors have illuminated further insights into the phylogeny and taxonomy of the Corylus species but still have not reached a satisfied resolution. Due to the incomplete cognition on Corylus classification, only 11 species have often been described by different taxonomists (Li and Cheng, 1979; Whitcher and Wen, 2001). Accordingly, the genus Corylus is divided into two sections or subgenus: Acanthochlamys and Corylus. The tree species C. ferox, with its distinctive spiny bur-like involucres, has been placed in section Acanthochlamys. Correspondingly, section Corylus consists of the remaining ten Corylus species: C. colurna, C. jacquemontii, C. chinensis, C. fargesii, C. sieboldiana, C. californica, C. cornuta, C. avellana, C. americana and the C. heterophylla complex. Although these 11 species are commonly recognized, other species designations can also be found in the literature. Within the bristle-husked shrubs, C. californica has been considered as a distinct species by some taxonomists but a botanical variety of C. cornuta by others, and C. mandshurica is noted as synonyms or variety of C. sieboldiana (Thompson et al., 1996). Within the Asian leafy-husked shrubs, var. sutchuenensis and var. yunnanensis are both viewed as botanical varieties of C. heterophylla by some researchers (Yu, 1979; Thompson et al., 1996), and as distinct species, C. kweichowensis and C. yunnanensis by Liang and Zhang (1988). Similarly, C. wangii, a Chinese endemic species, has been treated by Hu (1948) as the same species to C. jacquemontii, but as two separated species by Liang and Zhang (1988), Whitcher and Wen (2001), and Bassil et al. (2013). Thus, high-resolution molecular markers will be helpful in the species delimitation of the genus Corylus.
The cpDNA sequences of most woody plants have extremely low molecular evolution rates and lack polymorphic information sites useful for phylogenetic analysis. We have validated in our experiment that the chloroplast DNA fragments (rbcL, matK, and trnH-psbA) commonly used in plant molecular phylogeny have few sequence divergence in genus Corylus, which is one of the main reasons why phylogenetic relationships have remained unresolved. Recent studies have successfully proven that the chloroplast genomes were more effective than cpDNA sequences in illuminating phylogeny of land plants (Suo et al., 2012; Dong et al., 2016; Wang et al., 2017; Xu et al., 2017). Compared to nuclear genomes, complete chloroplast genome sequences of land plants are useful and cost-effective for evolutionary and phylogenetic studies due to their mostly uniparental inheritance, dense gene content, and slower evolutionary rate (Drouin et al., 2008; Smith, 2015). These features make it possible to be sequenced from the total genomic DNA using next-generation sequencing technologies (Nock et al., 2011; Kim et al., 2015). Cp phylogenomics, which comparatively analyzes closely related cp genome sequences, has been extensively applied in the reestablishment of some complex phylogenetic questions. Comparative cp genome analyses were carried out between five Chinese Juglans taxa and several closely related species to discuss the genetic divergence of Juglandaceae (Hu et al., 2017). Similar studies were also performed on genus or species with taxonomic difficulties such as Epimedium (Zhang et al., 2016), Orchid (Niu et al., 2017), Camellia (Fang et al., 2010; Huang et al., 2014), Ginkgo biloba (Wu et al., 2013), and Nicotiana otophora (Asaf et al., 2016). Meanwhile, quite a number of genetic markers with high resolution, e.g., intergenic spacer (IGS) such as rpl32-trnL, psbA-trnH, and trnL-F (Liu et al., 2017), repetitive sequences (Provan et al., 2001), SSRs (Huang et al., 2014), and SNPs (Li et al., 2014) have previously been developed from chloroplast genomes and used for phylogenetic and evolutionary studies in plants.
In this study, we sequenced six complete cp genomes of Corylus species using the next-generation sequencing platform. Combined with fourteen cp genomes previously published in GenBank, the first comprehensive analysis on cp genomes for Corylus was performed. The objectives of this study were as follows: (1) to compare the structural variation of the Corylus cp genomes; (2) to investigate and screen mutational hotspots, simple sequence repeats (SSRs) and repeat sequences from the Corylus cp genomes; (3) to illuminate the phylogenetic relationships of representative species. Our results will not only provide a robust evidence for taxonomic and phylogenetic frame of Corylus, but also contribute to develop more genetic markers for future application.
Materials and Methods
Taxon Sampling and DNA Extraction
Fresh and healthy leaves of six Corylus species were collected from the Research Institute of Forestry Chinese Academy of Forestry, Beijing, China; Resources Nursery of Forestry Bureau of Weixi County, Yunnan Province, China; Resources Nursery of Northwest A&F University, Shaanxi Province, China. Fresh leaves were dried in silica gel and stored at -4°C for further DNA extraction. Voucher specimens were deposited in the Economic forest research office of Research Institute of Forestry Chinese Academy of Forestry, Beijing, China. High-quality genomic DNA was extracted using a modified CTAB method (Zhao and Woeste, 2011). The DNA concentration was quantified using a NanoDrop spectrophotometer (Thermo Fisher Scientific, Carlsbad, CA, United States). The final DNA concentration >30 ng μL-1 were chosen for further Illumina sequencing.
Genome Sequencing and Assembly
The harvested DNA was detected by the agarose gel electrophoresis and quantified by Qubit. Whole-genome sequencing was performed on the Illumina HiSeq 2500-PE125 platform with massively parallel sequencing (MPS) Illumina technology. A-tailed, ligated to paired-end adaptors and PCR amplified with a 500 bp insert and a mate-pair library with an insert size of 5 kb were used for the library construction at the Beijing Novogene Bioinformatics Technology Co., Ltd. Illumina PCR adapter reads and low quality reads from the paired-end and mate pair library were filtered by the step of quality control using compiling pipeline. All good quality paired reads were assembled using the SOAPdenovo2 program (Luo et al., 2012) into a number of scaffolds. Then the filter reads were assembled with the program BLAST (Altschul et al., 1990) using C. heterophylla (KX822769.2) as a reference genome, with >80% matches and gaps filled by filtered reads at 90% similarity over 50% length.
Genome Annotation and Analysis
Assembled genomes of all species were initially annotated using the online program DOGMA (Wyman et al., 2004). Then, the annotation results were manually corrected for the codon positions and intron/exon boundaries by comparing to the homologous genes with other known cp genomes in Corylus. Furthermore, transfer RNAs were also checked with tRNAscan-SE (Schattner et al., 2005) using default settings. The circular maps of cp genomes were drawn using the OGDRAW tool (Lohse et al., 2007). The exact boundaries of IR/LSC and IR/SSC regions were affirmed by aligning them with the homologous sequences from other Corylus species. GC content of each section was calculated using MEGA 6 (Tamura et al., 2013).
Repeat Structure and Microsatellites
Repeat structure including palindromic, reverse, and direct repeats within the chloroplast genomes were identified using REPuter software (Kurtz et al., 2001). The following parameters were set in REPuter: repeat size of ≥30 bp and 90% or greater sequence identity (Hamming distance of 3). Tandem repeats were screened using the online program Tandem Repeats Finder 4.07 b (Benson, 1999), with 2, 7, and 7 set for the alignment parameters match, mismatch, and indels, respectively. The minimum alignments score and maximum period size were 70 and 500, respectively. Furthermore, single sequence repeats (SSRs) within these cp genomes were detected by Msatcommander v0.8.2 (Faircloth, 2008), with the parameters set at ≥10 for mononucleotides, ≥5 for dinucleotides, ≥4 for trinucleotides, and ≥3 for tetranucleotides, pentanucleotides, and hexanucleotides.
Sequence Divergence Analysis
Whole-genome alignments were conducted to evaluate rearrangements and substantial sequence divergence using the progressive Mauve aligner implemented in Mauve 2.3.1 (Darling et al., 2010). Furthermore, to identify the divergent hotspots, the six cp genomes were aligned using MAFFT 7.0 (Katoh and Standley, 2013), and then, a sliding window analysis was conducted to generate nucleotide diversity (Pi) of these cp genomes using DnaSP 5.0 (Librado and Rozas, 2009). The window length was set to 600 bp, with a step size 200 bp.
Selective Pressure Analysis
To verify evolutionary rates of protein-coding genes in the cp genomes within Corylus, we separated each coding gene from the six species (varieties). The non-synonymous mutation rate Ka, synonymous mutation rate Ks, and Ka/Ks ratio of genes found in all cp genome regions of the six Corylus species were calculated using the program KaKs_Calculator 2.0 (Wang et al., 2010), with the genome of C. avellana as a reference. We tested the hypothesis that positive selection was operating in genes that showed Ka/Ks values higher than 1, and we also tested the hypothesis of purifying selection action in genes that showed Ka/Ks values less than 1.
Phylogenetic Analysis
The complete cp genome sequences of twelve Corylus species were used for phylogenetic analyses, including the six cp genomes reported in this study, two drafted cp genome sequences of C. kweichowensis var. brevipes and C. wangii, and four previously sequenced cp genomes obtained from the NCBI GenBank. Eight cp genomes from the genus Ostrya, Carpinus, Ostryopsis, Alnus, and Betula in Betulaceae were chosen as outgroup. The analyses were performed based on the following two datasets: (1) the complete cp genome sequences; and (2) a set of 80 protein-coding genes shared by these cp genomes. All the gaps were excluded after alignment in both analyses.
All phylogenetic analyses were carried out through two algorithms: maximum likelihood (ML), and Bayesian inference (BI) implemented in PhyML 3.1 (Guindon et al., 2010) and MrBayes 3.1.2 (Ronquist and Huelsenbeck, 2003), respectively. The best-fitting models for both datasets were determined by Modeltest 3.7 (Posada and Crandall, 1998) based on the Akaike information criterion. ML analysis for heuristic tree searches was performed using the selected substitution model, random taxon addition of 1000 replicates, TBR branch swapping, the MULPARS option on, 1,00,000 trees held in RAM and 100 replications of the bootstrap analysis. The BI analysis was run for 100,000 generations and sampled every 100 generations. The first 25% of the trees were discarded as burn-in, the remaining trees were used to build a 50% majority-rule consensus tree and estimate the Bayesian posterior probabilities. Analysis was run to completion and the average standard deviation of the split frequencies was <0.01.
Results
Chloroplast Genome Features of Corylus Species
The Corylus complete cp genomes ranged from 160,445 (C. ferox var. thibetca) to 161,621 bp (C. yunnanensis) in length, with the minimum and maximum differences being 28 and 1,176 bp, respectively (Table 1 and Figure 1). All six cp genomes showed a typical quadripartite structure that consisted of a pair of IR regions (26,561–27,118 bp) separated by the LSC (88,409–88,628 bp) and SSC (18,769–18,857 bp) regions, which was similar to the majority of land plant cp genomes. The GC content ranged from 36.43 to 36.49%, indicating nearly identical levels among the six Corylus cp genomes. The raw sequence data reported in this paper have been deposited in the Genome Sequence Archive in BIG Data Center, under accession numbers CRA000795 that are publicly accessible at http://bigd.big.ac.cn/gsa.
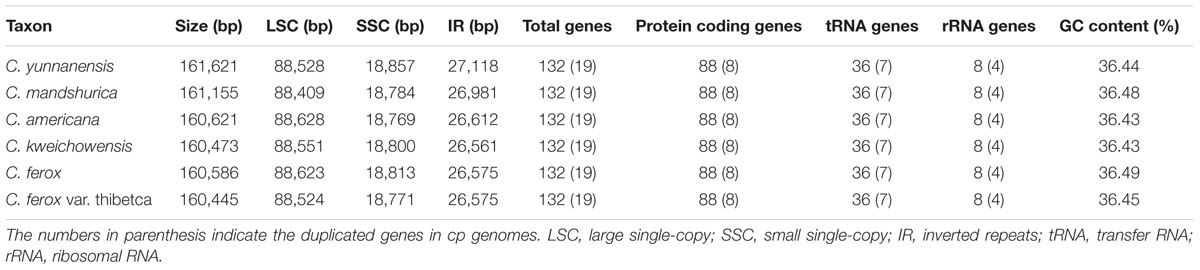
TABLE 1. Comparison of features of chloroplast genomes among six Corylus species.
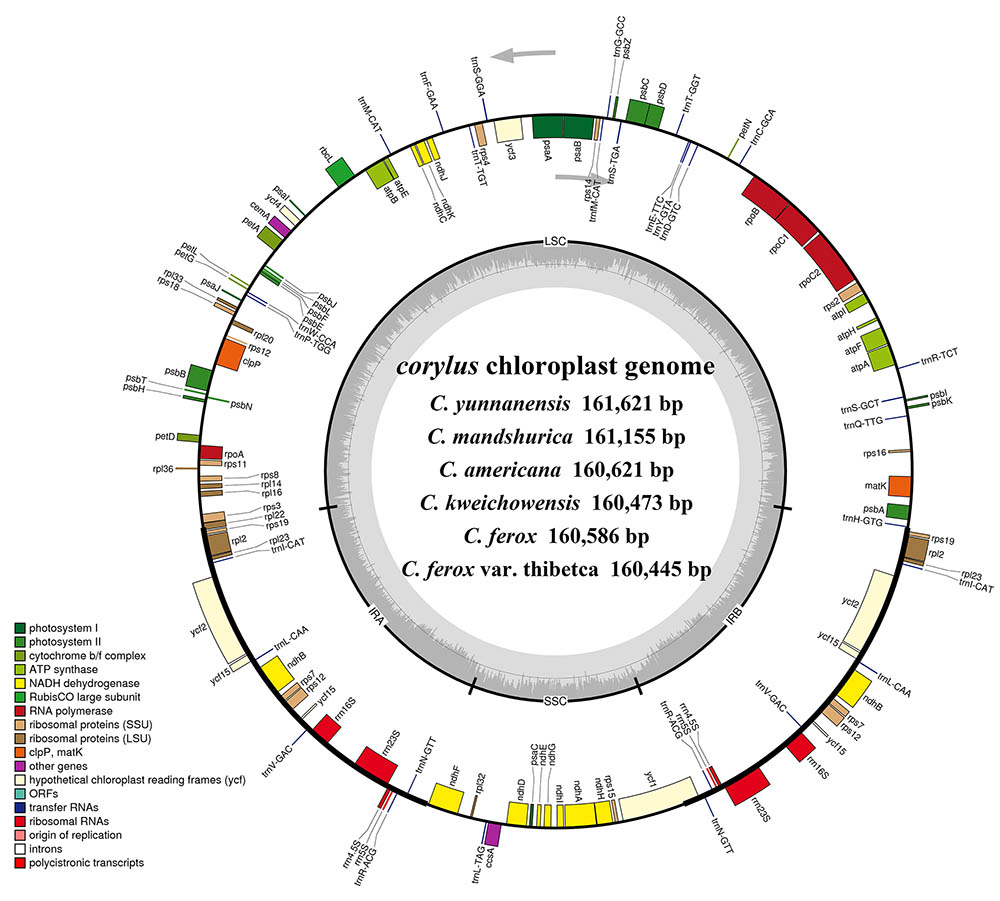
FIGURE 1. Gene maps of the six Corylus chloroplast genomes. Genes shown outside the outer circle are transcribed clockwise and those inside are transcribed counterclockwise. Genes belonging to different functional groups are color-coded. Dashed area in the inner circle indicates the GC content of the chloroplast genome.
Overall, the cp genome of all Corylus species encoded an identical set of 132 genes, including 88 protein-coding genes, 36 tRNA genes, and 8 rRNA genes (Table 1). Due to the uniform gene number, order, and names, the annotated cp genomes of these six species were represented in one circular map (Figure 1). In all cp genomes, seven protein-coding genes (ndhB, rps7, rps12, rps19, rpl2, rpl23, and ycf2), seven tRNA genes (trnA-UGC, trnI-CAU, trnI-GAU, trnL-CAA, trnN-GUU, trnR-ACG, and trnV-GAC), and four rRNA genes (rrn16, rrn23, rrn5, and rrn4.5) were duplicated in the IR regions. Sixteen protein-coding genes, 14 tRNA genes, and 8 rRNA genes were identified within IRs, 60 protein-coding and 21 tRNA genes occurred in the LSC region, while 12 protein-coding genes and 1 tRNA genes were contained in the SSC region. Simultaneously, the automatic annotation with DOGMA also identified four genes (rps12-3end, trnfM-CAU, ycf15, and ycf68) and three open reading frames (orf42, orf56, and orf188) that were not kept at the geneious refinement. The gene rps12 was trans-spliced, with the 5-end exon located in the LSC region and the 3-exon and intron duplicated and located in the IR regions.
Of the 113 unique genes (excluding 19 duplicated genes), 10 genes (ndhA, ndhB, atpF, rpoC1, trnA-UGC, trnG-UCC, trnI-GAU, trnK-UUU, trnL-UAA, and trnV-UAC) contained one intron, while two protein-coding genes (ycf3 and clpP) contained two introns each (Table 2). Most of these genes that contained introns were located in the LSC region, i.e., six genes with one intron plus ycf3 and clpP with two introns, three genes distributed in the IRs, while only ndhA gene was in the SSC region. Notably, there was a special phenomenon that gene rpl2 of four Corylus cp genomes contained one intron, whereas two introns were detected in the cp genomes of C. yunnanensis and C. mandshurica, which could be regarded as a unique feature for these two species.
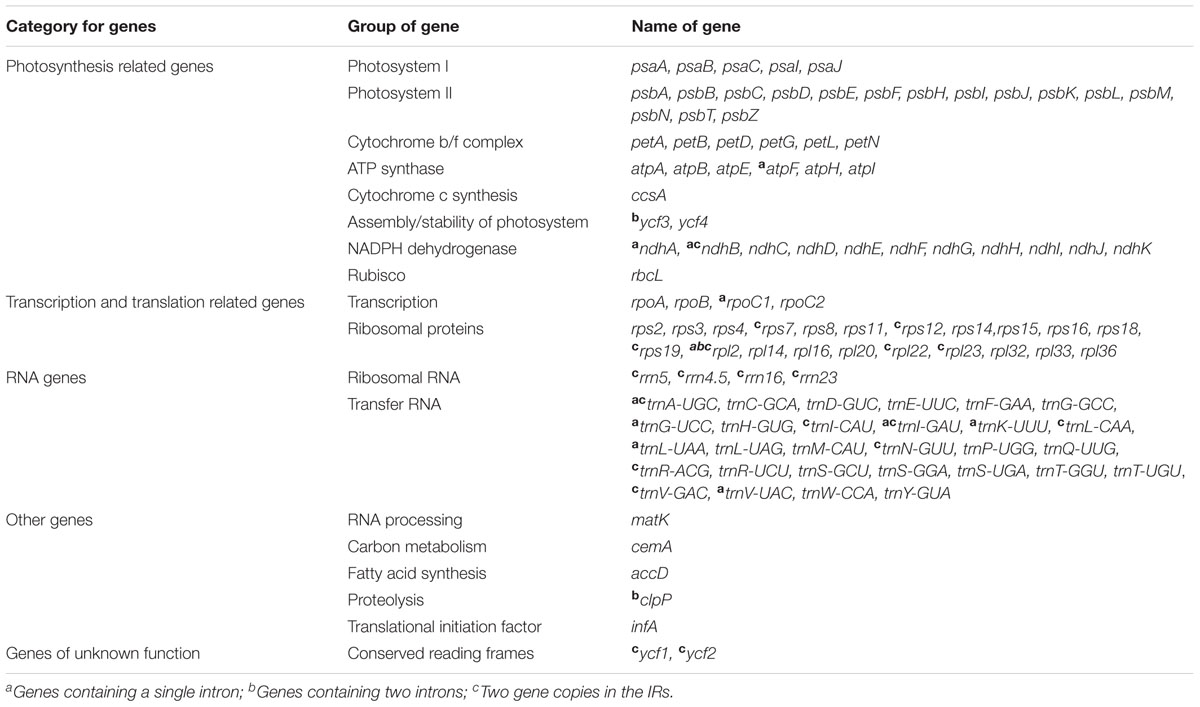
TABLE 2. List of genes encoded in the chloroplast genome of Corylus.
Expansion and Contraction of the Border Regions
The border regions and adjacent genes of the six Corylus cp genomes were compared to analyze the expansion and contraction variation in junction regions (Figure 2). Although overall genomic structure including gene order and gene number was well conserved, the six Corylus cp genomes exhibited visible differences at the IRa/LSC and IRb/SSC borders. The IRa region expanded into the gene rpl22 with 120–131 bp in the IRa regions (131 bp for C. yunnanensis, C. mandshurica, and C. Americana, 125 bp for C. kweichowensis, 120 bp for C. ferox, and 128 bp for C. ferox var. thibetca). The IRb/SSC borders displayed a marked difference among the six cp genomes, of which the gene rpl22 located closely to the junction with no gaps in C. yunnanensis, C. mandshurica, and C. Americana, while it generated a distance of 1 and 3 bp in C. ferox and C. kweichowensis, respectively, while the rpl22 gene crossed the IRb /LSC region in C. ferox var. thibetca. The gene rpl2 formed another boundary by expanding into the LSC regions of C. yunnanensis and C. mandshurica. The trnH-GUG gene in the LSC regions contracted 107–127 bp from the junction region of IRb/LSC in C. Americana, C. ferox, and C. kweichowensis. In contrast, the IR/SSC boundary regions were relatively conserved. The ycf1 gene crossed the IRa/SSC junction extending nearly identical distance (4 bp) to the junction in C. yunnanensis, C. mandshurica, C. ferox, C. ferox var. thibetca, and C. kweichowensis except for 1 bp in C. Americana, whereas ndhF was entirely located in the SSC region and the distance to the junction ranged from 85 to 135 bp. The gene ycf1 crossed the boundary regions between IRb/SSC, leading to incomplete duplication of the gene within IRs. The variations at IR/SC boundary regions in the six Corylus cp genomes led to their length difference of the four regions and whole genome sequences.
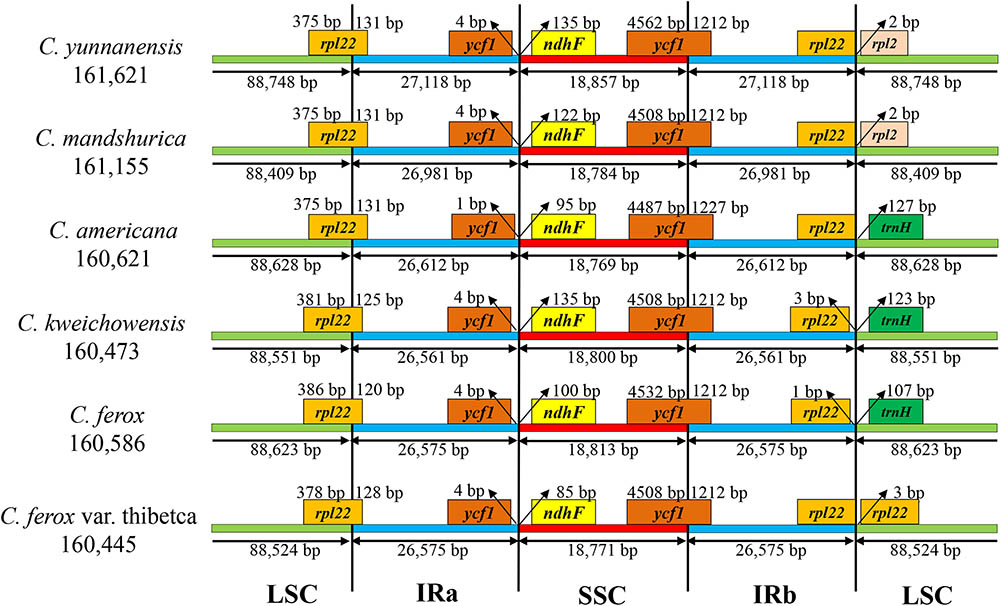
FIGURE 2. The comparison of the LSC, IR, and SSC border regions among the six Corylus chloroplast genomes.
Repeat Sequences and Microsatellites Analyses
In this study, we detected forward, palindromic, complement, and reverse repeats in all sequenced Corylus cp genomes. Overall, 36–69 repeat sequences were identified in each cp genome, of which 16–31 forward repeats, 19–37 palindromic repeats, and 1–4 reverse repeats were separately screened (Figure 3A and Supplementary Table S1), however, only one complement repeat was predicted in C. ferox var. thibetica. The lengths of repeats in the six Corylus cp genomes ranged from 30 to 200 bp, and the repeated lengths with 31–39 bp are most common (47.37%), while those with 40–49 bp (4.91%) and 50–59 bp (3.86%) were relatively rare. Notably, majority of the repeats in all cp genomes had a length of 30 bp (Figure 3B and Supplementary Table S1). Simultaneously, 18–23 tandem repeats were also detected in these six cp genomes, with repeat number 2–4, and repeated lengths 14–191, respectively (Figure 3A and Supplementary Table S2). The repeated sequences were primarily distributed in non-coding regions (CNS), including the IGSs and intron regions. Nevertheless, a small number of coding genes and tRNA genes such as ycf1, ycf2, ycf3, atpA, psaB, and trnS were also found to contain repeat sequences (Supplementary Tables S1, S2).
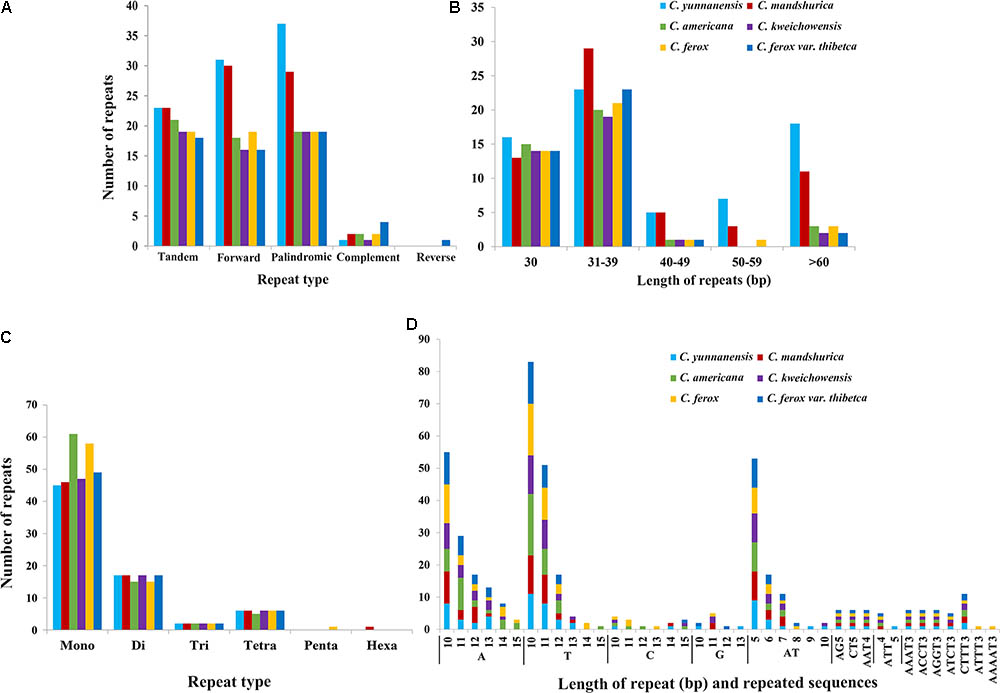
FIGURE 3. The type and distribution of repeated sequences and SSRs in the cp genome of six Corylus species. (A) Number of five repeat types; (B) Number of repeat sequences by length; (C) Number of six SSR types; (D) Number of identified SSR motifs in different repeat class types.
For microsatellites or SSRs, the mono-, di-, tri-, tetra-, penta-, and hexanucleotide SSRs were all predicted for each cp genome (Figures 3C,D and Supplementary Table S3). For each genome, a total of 70–83 microsatellites were detected in the six cp genomes, with the majority of the SSRs being mononucleotides (especially for A/T), varying in quantity from 45 in C. yunnanensis to 61 in C. americana. Besides, dinucleotides (especially for AT) were the second most predominant, ranging from 15 in C. americana and C. ferox to 17 in other four genomes. Furthermore, C. americana was found to have two trinucleotides and five tetranucleotides, while the other five cp genomes contained two trinucleotides and six tetranucleotides. Additionally, few penta and hexanucleotides were found in Corylus cp genomes, with only one pentanucleotide (AAAAT) and one hexanucleotide (AATTTT) existing in C. ferox and C. mandshurica, respectively. Similarly, SSRs mainly located in CNS, particularly in IGS, whereas several coding genes such as matK, atpF, rpoC2, ndhK, atpB, and ycf1 were also identified to contain SSRs. In the four structural regions, SSRs distributed unevenly across the cp genomes, with the majority of SSRs located in LSC region, and followed by SSC and IR regions.
Sequence Divergence and Hot Spots
To elucidate levels of genome divergence, multiple alignments of six Corylus cp genome sequences were conducted in Mauve 2.3.1. The locally collinear blocks (LCBs) identified by the Mauve alignment revealed high sequence similarity across the six Corylus cp genomes, indicating that the genome structure were quite conserved with respect to both gene identity and order (Figure 4). As expected, the two IR regions were more conserved than SC regions. Furthermore, visible differences were observed among Corylus cp genomes. The most divergent regions mainly located at the position between 5,000–20,000 bp, 25,000–45,000 bp, 50,000–80,000 bp, and 115,000–135,000 bp, which included the intergenic regions trnK-rps16, rps12-trnV, trnH-trnI, rpoB-trnC, trnF-ndhJ, and psbE-petL, and rpl32-trnL. Additionally, the nucleotide variability (Pi) values within 600 bp in the LSC, SSC, and IR regions were calculated separately to evaluate the sequence divergence level (Figure 5). The SSC region showed the highest nucleotide diversity (0.00327), followed by the LSC region (0.00241) and then the IR region (0.00079), which illustrated that the IR regions had lower mutations than single copy regions. Four divergence hotspots (Pi > 0.01) in the IGS regions were screened as potential molecular markers for phylogenetic study, they were: trnH-psbA, rpoB-trnC, trnF-ndhJ, and rpl32-trnL. Moreover, another seven spacers (trnK-rps16, rps12-trnV, atpH-atpI, accD-psaI, psbE-petL, rpl22-rps19, and trnL-ccsA-ndhD) and two coding genes (ndhF and ycf1) also exhibited higher variability (Pi > 0.005). Among these 13 divergence regions, eight loci were located in the LSC region, four in the SSC region, and only one lied in the IRa/LSC boundary region.
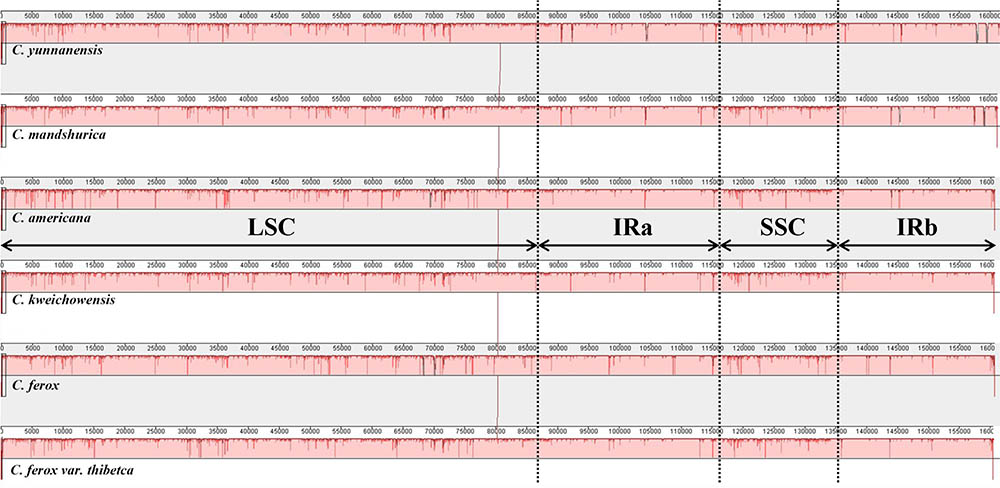
FIGURE 4. MAUVE Alignment of the six Corylus chloroplast genomes. The C. yunnanensis genome is shown at top as the reference genome. Within each of the alignments, local collinear blocks are represented by blocks of the same color connected by lines.
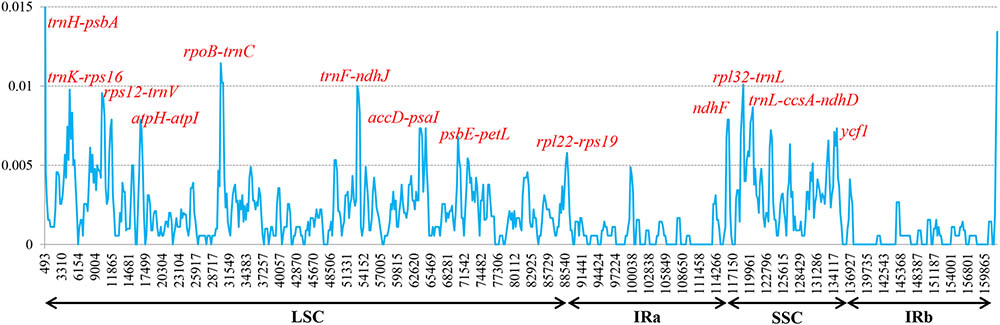
FIGURE 5. Sliding-window analysis of the whole cp genomes of six Corylus species. Window length: 600 bp; step size: 200 bp. X-axis: position of the midpoint of a window. Y-axis: nucleotide diversity of each window.
Estimating Rates of Chloroplast Evolution
The Ka, Ks and Ka/Ks ratio of 80 protein-coding genes shared in six cp genomes of Corylus species were shown in Supplementary Table S4. Our results indicated that the evolutionary rates of these genes were not uniform among six Corylus species relative to C. avellana. Most of Ka/Ks values of these Corylus species were less than 1, providing the evidence of purifying selection on the cp protein-coding genes of Corylus species. Furthermore, the Ka/Ks ratios of the remaining comparisons were not available because the Ks values were equal to zero. However, we also identified ycf1 in C. yunnanensis, C. mandshurica, and C. kweichowensis, rpoC2 in C. ferox, rpl14 and rpl22 in C. americana were under positive selection (Ka/Ks ratios > 1).
Phylogenetic Analysis of Corylus Species
We used two datasets (complete chloroplast genomes and protein-coding genes) to evaluate the phylogenetic relationships within genus Corylus and among members of closely related species in Betulaceae. The best substitution models for two datasets used in ML and BI analysis are TVM + I + G and GTR + G, respectively. All the ML and BI trees reconstructed based on the two datasets were highly congruent in identifying the phylogenetic position of these six genera (Corylus, Betula, Alnus, Ostryopsis, Ostrys, and Carpinus) in the family Betulaceae (Figures 6A,B). All nodes of these phylogenetic trees were strongly supported by bootstrap values (BS) in ML analysis and posterior probabilities (PP) in BI analysis. The 20 taxa were classified into three major clades, of which all the Corylus species constituted a monophyly, Betula and Alnus located at the basal position showed a close genetic relationship, whereas Carpinus, Ostrya, and Ostryopsis clustered into another clade. The clade including Carpinus, Ostrya, and Ostryopsis was the sister to the clade Corylus, and showed a large divergence from the clade formed by Betula and Alnus.
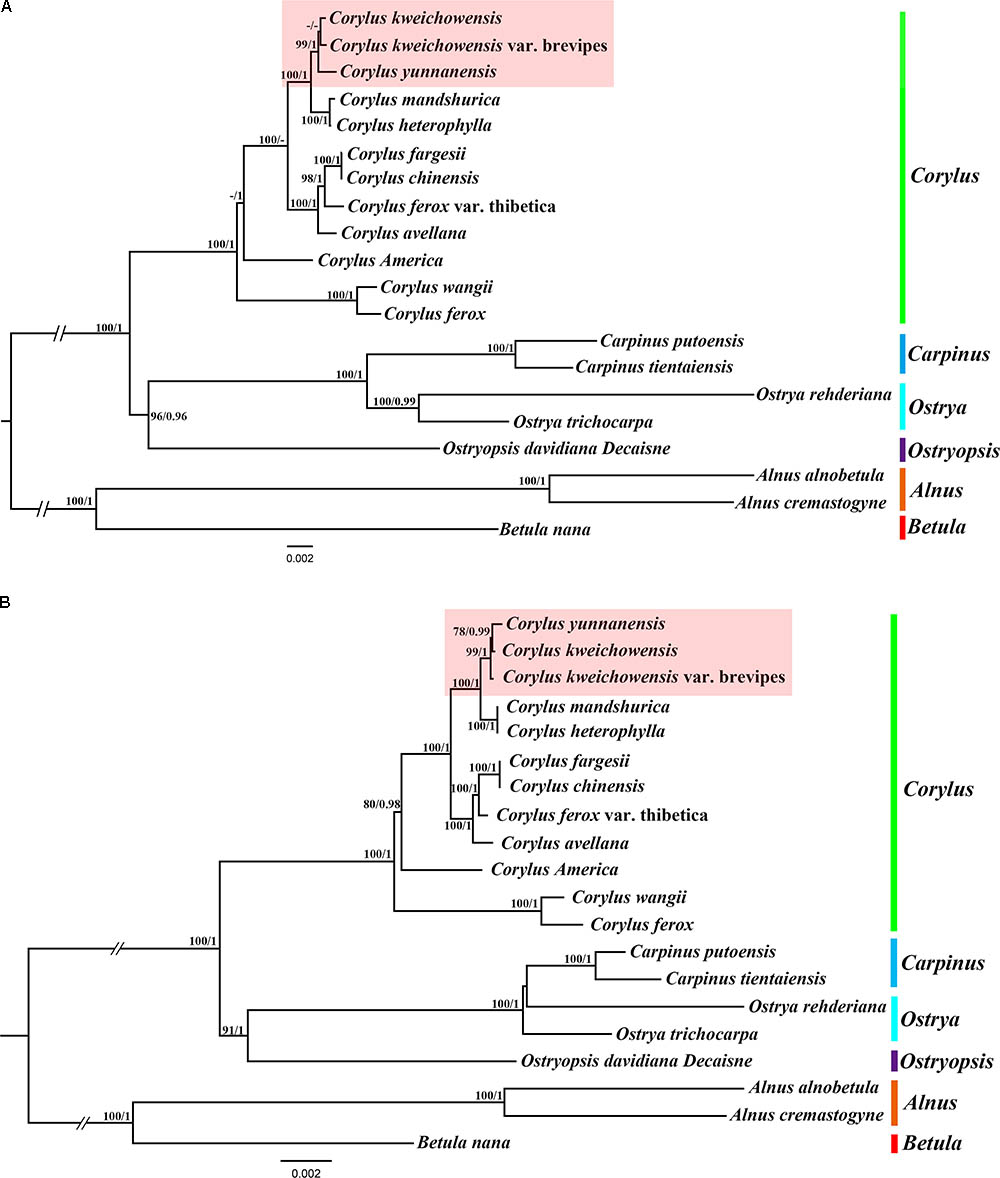
FIGURE 6. Phylogenetic tree of Corylus and closely related species in Betulaceae using Maximum likelihood (ML) and Bayesian inference (BI) methods based on: (A) the complete chloroplast genome sequences, (B) 80 protein-coding genes. Six genera designated in this study are highlighted with different vertical bars in different colors on the cladogram. Bootstrap values (BS) ≥ 70% in ML analysis and posterior probabilities (PP) ≥ 0.95 in BI analysis are listed above the branches (BS/PP). The hyphen refers to BS ≤ 70% in ML or PP ≤ 0.95 in BI.
In the monophyly of Corylus, 12 species were divided into five distinct subclades. C. ferox and C. wangii clustered together and were located at the basal position within genus Corylus; C. Americana formed a monophyly; C. fargesii and C. chinensis showed a close relationship, and further constituted a larger subclade combining C. ferox var. thibetica and C. avellana. The sympatric species C. mandshurica and C. heterophylla clustered into a common subclade, and further formed the sister group to the subclade formed by C. yunnanensis, C. kweichowensis, and C. kweichowensis var. brevipes. Furthermore, minor differences were revealed between the phylogeny inferred from the two datasets (highlight with red background). C. kweichowensis and its nominal variety C. kweichowensis var. brevipes clustered together firstly, and then formed sister to C. yunnanensis in the phylogenetic tree of complete cp genome, whereas C. kweichowensis exhibited closer relationship with C. yunnanensis than that with C. kweichowensis var. brevipes. Generally, our results disclosed closer ties among these three Corylus species.
Discussion
The Chloroplast Genome of Corylus
Recently, chloroplast phylogenetic genomics have been used to evaluate the genetic relationships among related species (Song et al., 2015; Niu et al., 2017). Comparative genome analysis of the six Corylus cp genome showed highly conserved structures and genes and no rearrangement events were found in all of our species, which can be inferred from the same coding genes, tRNAs and rRNAs among the six cp genomes. Nevertheless, the genome size varied from 160,445 to 161,621 bp, suggesting the genetic differences among them. Generally, this phenomenon may have resulted from the contraction and expansion events of the IR regions, which was mainly responsible for length mutations of cp genomes and has been revealed in many angiosperm cp genomes (Lu et al., 2017; Zhang et al., 2017). In our study, similar results also displayed the position changes in the IR/SC border regions. However, three junctions of Corylus cp genomes showed high similarity, especially for gene rpl22 located in IRa/LSC, ycf1 in IRb/SSC, ndhF and pseudogene ycf1 in IRa/SSC.
Simultaneously, our annotation discovered two regions (ycf15 and ycf68) that are hypothesized to represent functional protein-coding genes in some studies (Raubeson et al., 2007), but identified as pseudogenes by others for containing several internal stop codons (Lu et al., 2017). In the present study, we did not annotate the two pseudogenes because their coding sequences (CDS) contained several internal stop codons. Besides, numerous studies reveal that the gene ycf15 is located between ycf2 and trnL-CAA, while some other findings annotate it between rps7 and trnV-GAC (Choi and Park, 2015; Williams et al., 2015). Interestingly, our results obtained ambiguous annotations by displaying the ycf15 gene in both positions (Figure 1), which deserves further study to clarify this issue.
Diversity of Repetitive Sequences and SSRs
Previous studies supports that repetitive sequences may play a crucial role in chloroplast genome arrangement and sequence divergence (Guisinger et al., 2011; Weng et al., 2013). Moreover, analyses of the various cp genomes asserted that repetitive sequences are essential to induce substitutions and indels (Yi et al., 2013). Due to a high polymorphism rate at the species level, SSRs in the cp genome have been viewed as a major source of molecular markers, and have been extensively applied in phylogenetic research (Xue et al., 2012). We counted five sorts of repetitive sequences in the cp genomes of Corylus, especially in the IGS, which is analogous to other angiosperm lineages (Yang et al., 2017). Altogether, Corylus species presented a significant difference in number and distribution pattern of dispersed repeats within their cp genomes. Notably, C. yunnanensis has the highest number of dispersed repeats within Corylus, whereas C. kweichowensis has the least dispersed repeats. In contrast, there were no significant differences in tandem repeats among these cp genomes. Besides, we also identified numerous SSRs within six genomes, with most of them distributed in the intergenic regions, whereas a small amount was located in several coding genes. Furthermore, cp SSRs of these Corylus genomes were mainly composed of adenine (A) or thymine (T) repeats, but rarely contained guanine (G) or cytosine (C) repeats. Our findings are identical with those of previous reports (Qian et al., 2013; Jiang et al., 2017). To sum up, all these features can facilitate the species delimitation of Corylus and lay a foundation for the development of markers for phylogenetic studies.
Genome Variation and Mutational Hotspots
It has been identified that multi-genome alignments contribute to the development of mutational hotspots used for interspecies discrimination (Ahmed et al., 2013) and phylogenetic studies at the species level (Shaw et al., 2014; Downie and Jansen, 2015). In several studies, numerous coding regions have been reported to be useful in species-level phylogenetic analyses. For instance, the coding gene ycf1 in Anemopaegma (Firetti et al., 2017), rps16, psaI, psbT, psbH, petB, rpoA, and rps11 in Notopterygium (Yang et al., 2017) were more divergent than non-coding regions. However, more studies confirmed that the non-coding sequences, including the IGS regions and introns exhibited higher substitution rates. trnS-trnG, psaC-ndhE, clpP-psbB, rpl16 intron, rpoB-trnC, trnT-psbD, rbcL-accD, rpl32-trnL, ccsA-ndhD, and ndhC-trnV were selected as markers for identifying species of Phalaenopsis (Shaw et al., 2014), and trnH-psbA, trnG-trnM, trnT-trnL, rpl32-trnL, rps15-ycf1, ycf4-cemA, petD-rpoA were the divergence hotspot regions in Veroniceae and Veronica (Choi et al., 2016). In our study, both multiple alignments and sliding window analyses of the six Corylus cp genomes revealed common variable sites, including eleven intergenic regions and two coding genes, of which trnH-psbA, rpl32-trnL, ccsA-ndhD, and rpoB-trnC, ndhF, and ycf1 have been identified as genetic markers just as mentioned above. Furthermore, we screened four most mutational hotspots: trnH-psbA, rpoB-trnC, trnF-ndhJ, and rpl32-trnL, which can be used as genetic markers for species delimitation and phylogenetic studies of the genus Corylus. More remarkably, we observed that almost all the hotspots were located in SC regions, while no mutation was discovered in two IRs, reinforcing the point that plastid substitution rates in IRs are considerably lower than that of SC regions (Wu and Chaw, 2015).
Phylogenetic Relationships Inference
At present, the concepts of dividing Betulaceae into two subfamilies (Betuloideae and Coryloideae) have been accepted by most taxonomists (Heywood, 1993; Mabberley, 1997; Chen et al., 1999). It is generally agreed that subfamily Betuloideae consists of two sister genera: Alnus and Betula, while subfamily Coryloideae comprises the remaining four genera: Corylus, Carpinus, Ostrya, and Ostryopsis (Flora of China Editorial Committee, 1979; Mabberley, 1997; Chen et al., 1999). Coryloideae differs from Betuloideae by having solitary male flowers (Mabberley, 1997). Some scholars, however, have pointed out that the generic relationships in Coryloideae are controversial depending on emphasizing different morphological traits such as floral morphology (Abbe, 1974), leaf survivorship (Kikuzawa, 1982), and fruit types (Stone, 1973), or molecular markers including rbcL (Bousquet et al., 1992), matK gene (Kato et al., 1998), and ITS regions (Chen et al., 1999). Nearly all the above studies supported the monophyly of Coryloideae, and a close relationship of Carpinus and Ostrya. The phylogenetic position of Ostryopsis was indefinable. The ITS and rbcL phylogenies placed it basal to the Carpinus-Ostrya clade (Chen et al., 1999), while the matK phylogeny found Ostryopsis sister to Corylus (Kato et al., 1998). The results of our current analyses strongly support the monophyly of genus Corylus in Coryloideae. Ostryopsis formed the sister group to Carpinus-Ostrya clade and that these three genera together constituted a sister group to Corylus. Accordingly, we agree with the view of Chen et al. (1999) by dividing the extant genera of the Coryloideae into two tribes: Coryleae (Corylus) and Carpineae (Ostryopsis, Carpinus, and Ostrya).
It has long been controversial as regards to the interspecific relationships within Corylus partly because of the incomplete taxon sampling for Corylus species, and partly due to the lack of molecular markers with high resolution (Erdogan and Mehlenbacher, 2000). Our study centers on ten native species in East Asia and two major species that originate from Europe and North America. The results validate that East Asia is the diversity center of Corylus species, with C. wangii and C. ferox being the primitive species, while those shrub species (C. yunnanensis, C. mandshurica, C. heterophylla, and C. kweichowensis) and tree species (C. fargesii, C. chinensis, and C. ferox var. thibetica) exhibit close affinity, respectively. All these facts suggest the adaptive radiation and species differentiation at different degrees among Corylus species. The deep phylogenetic relationships and divisions within the genus Corylus and its relationships with other genera in Betulaceae remain to be further investigated. The nucleotide sequences of these cp genomes will offer effective genetic information necessary for grasping the evolution of Corylus or even Betulaceae.
Author Contributions
TZ and GW conceived and designed the experiments. ZY, TZ, GW, QM, and LL participated in collection of study materials. ZY and TZ participated in the DNA extraction and data analysis. ZY wrote the manuscript. All authors read and approved the final manuscript.
Funding
This study was supported by the National Natural Science Foundation of China (Grant No. 31500555) and the Special Fund for Basic Scientific Research Business of Central Public Research Institutes (Grant Nos. CAFYBB2016QB003 and CAFYBB2017ZA004-9).
Conflict of Interest Statement
The authors declare that the research was conducted in the absence of any commercial or financial relationships that could be construed as a potential conflict of interest.
Acknowledgments
The authors sincerely thank Dr. Zhaoshan Wang of the Chinese Academy of Forestry and Beijing Novogene Bioinformatics Technology Co., Ltd., for assistance with this work.
Supplementary Material
The Supplementary Material for this article can be found online at: https://www.frontiersin.org/articles/10.3389/fpls.2018.00927/full#supplementary-material
References
Abbe, E. C. (1974). Flowers and inflorescences of the “Amentiferae”. Bot. Rev. 40, 159–255. doi: 10.1007/BF02859135
Ahmed, I., Matthews, P. J., Biggs, P. J., Naeem, M., Mclenachan, P. A., and Lockhart, P. J. (2013). Identification of chloroplast genome loci suitable for high-resolution phylogeographic studies of Colocasia esculenta (L.) Schott (Araceae) and closely related taxa. Mol. Ecol. Resour. 13, 929–937. doi: 10.1111/1755-0998.12128
Altschul, S. F., Gish, W., Miller, W., Myers, E. W., and Lipman, D. J. (1990). Basic local alignment search tool. J. Mol. Biol. 215, 403–410. doi: 10.1016/S0022-2836(05)80360-2
Asaf, S., Khan, A. L., Khan, A. R., Waqas, M., Kang, S. M., Khan, M. A., et al. (2016). Complete chloroplast genome of Nicotiana otophora and its comparison with related species. Front. Plant Sci. 7:843. doi: 10.3389/fpls.2016.00843
Bassil, N., Boccacci, P., Botta, R., Postman, J., and Mehlenbacher, S. (2013). Nuclear and chloroplast microsatellite markers to assess genetic diversity and evolution in hazelnut species, hybrids and cultivars. Genet. Resour. Crop Evol. 60, 543–568. doi: 10.1007/s10722-012-9857-z
Beltramo, C., Valentini, N., Portis, E., Torello Marinoni, D., Boccacci, P., Sandoval Prando, M. A., et al. (2016). Genetic mapping and QTL analysis in European hazelnut (Corylus avellana L.). Mol. Breed. 36:27. doi: 10.1007/s11032-016-0450-6
Benson, G. (1999). Tandem repeats finder: a program to analyze DNA sequences. Nucleic Acids Res. 27, 573–580. doi: 10.1093/Nar/27.2.573
Boccacci, P., and Botta, R. (2010). Microsatellite variability and genetic structure in hazelnut (Corylus avellana L.) cultivars from different growing regions. Sci. Hortic. 124, 128–133. doi: 10.1016/j.scienta.2009.12.015
Bousquet, J., Strauss, S. H., and Li, P. (1992). Complete congruence between morphological and rbcL-based molecular phylogenies in birches and related species (Betulaceae). Mol. Biol. Evol. 9, 1076–1088.
Chen, Z. D., Manchester, S. R., and Sun, H. Y. (1999). Phylogeny and evolution of the Betulaceae as inferred from DNA sequences, morphology, and paleobotany. Am. J. Bot. 86, 1168–1181. doi: 10.2307/2656981
Choi, K. S., Chung, M. G., and Park, S. (2016). The complete chloroplast genome sequences of three Veroniceae species (Plantaginaceae): comparative analysis and highly divergent regions. Front. Plant Sci. 7:355. doi: 10.3389/fpls.2016.00355
Choi, K. S., and Park, S. (2015). The complete chloroplast genome sequence of Aster spathulifolius (Asteraceae); genomic features and relationship with Asteraceae. Gene 572, 214–221. doi: 10.1016/j.gene.2015.07.020
Darling, A. E., Mau, B., and Perna, N. T. (2010). progressiveMauve: multiple genome alignment with gene gain, loss and rearrangement. PLoS One 5:e11147. doi: 10.1371/journal.pone.0011147
Di, X. Y., Liu, K. W., Hou, S. Q., Ji, P. L., and Wang, Y. L. (2014). Genetic variation of hazel (Corylus heterophylla) populations at different altitudes in Xingtangsi forest park in Huoshan. Plant Omics J. 7, 213–220.
Dong, W., Xu, C., Li, D., Jin, X., Li, R., Lu, Q., et al. (2016). Comparative analysis of the complete chloroplast genome sequences in psammophytic Haloxylon species (Amaranthaceae). PeerJ 4:e2699. doi: 10.7717/peerj.2699
Downie, S. R., and Jansen, R. K. (2015). A comparative analysis of whole plastid genomes from the Apiales: expansion and contraction of the inverted repeat, mitochondrial to plastid transfer of DNA, and identification of highly divergent noncoding regions. Syst. Bot. 40, 336–351. doi: 10.1600/036364415X686620
Drouin, G., Daoud, H., and Xia, J. (2008). Relative rates of synonymous substitutions in the mitochondrial, chloroplast and nuclear genomes of seed plants. Mol. Phylogenet. Evol. 49, 827–831. doi: 10.1016/j.ympev.2008.09.009
Erdogan, V., and Mehlenbacher, S. A. (2000). Phylogenetic relationships of Corylus species (Betulaceae) based on nuclear ribosomal DNA ITS region and chloroplast matK gene sequences. Syst. Bot. 25, 727–737. doi: 10.2307/2666730
Essadki, M., Ouazzani, N., Lumaret, R., and Moumni, M. (2006). ISSR variation in olive-tree cultivars from Morocco and other western countries of the Mediterranean Basin. Gene Resour. Crop Evol. 53, 475–482. doi: 10.1007/s10722-004-1931-8
Faircloth, B. C. (2008). Msatcommander: detection of microsatellite repeat arrays and automated, locus-specific primer design. Mol. Ecol. Resour. 8, 92–94. doi: 10.1111/j.1471-8286.2007.01884.x
Fang, W., Yang, J., Yang, S., and Li, D. (2010). Phylogeny of Camellia sects. Longipedicellata, Chrysantha and Longissima (Theaceae) based on sequence data of four chloroplast DNA loci. Acta Bot. Yunnanica 32, 1–13. doi: 10.3724/SP.J.1143.2010.00001
Ferreira, J. J., Garcia, C., and Tous, J. (2009). Structure and genetic diversity of local hazelnut collected in Asturias (Northern Spain) revealed by ISSR markers. Acta Hortic. 845, 163–168. doi: 10.17660/ActaHortic.2009.845.20
Firetti, F., Zuntini, A. R., Gaiarsa, J. W., Oliveira, R. S., Lohmann, L. G., and Van Sluys, M. A. (2017). Complete chloroplast genome sequences contribute to plant species delimitation: a case study of the Anemopaegma species complex. Am. J. Bot. 104, 1493–1509. doi: 10.3732/ajb.1700302
Flora of China Editorial Committee (1979). Flora of China. St. Louis, MO: Missouri Botanical Garden Press. doi: 10.1007/s002990050637
Galderisi, U., Cipollarom, A., Bernardo, G., De Masi, L., Galano, G., and Cascino, A. (1999). Identification of hazelnut (Corylus avellana) cultivars by RAPD analysis. Plant Cell Rep. 18, 652–655. doi: 10.1007/s002990050637
Guindon, S., Dufayard, J.-F., Lefort, V., Anisimova, M., Hordijk, W., and Gascuel, O. (2010). New algorithms and methods to estimate maximum- likelihood phylogenies: assessing the performance of PhyML 3.0. Syst. Biol. 59, 307–321. doi: 10.1093/sysbio/syq010
Guisinger, M. M., Kuehl, J. V., Boore, J. L., and Jansen, R. K. (2011). Extreme reconfiguration of plastid genomes in the angiosperm family geraniaceae: rearrangements, repeats, and codon usage. Mol. Biol. Evol. 28, 583–600. doi: 10.1093/molbev/msq229
Hu, H. H. (1948). Notulae Systematicae ad Floram Sinensium XI. Bulletin of the Fan Memorial Institute of Biology (New Series), 1:149.
Hu, Y., Woeste, K. E., and Zhao, P. (2017). Completion of the chloroplast genomes of five Chinese Juglans and their contribution to chloroplast phylogeny. Front. Plant Sci. 7:1955. doi: 10.3389/fpls.2016.01955
Huang, H., Shi, C., Liu, Y., Mao, S. Y., and Gao, L. Z. (2014). Thirteen Camellia chloroplast genome sequences determined by high-throughput sequencing: genome structure and phylogenetic relationships. BMC Evol. Biol. 14:151. doi: 10.1186/1471-2148-14-151
Huxley, A. J., Griffiths, M., and Margot, L. (1992). The New Royal Horticultural Society Dictionary of Gardening, Vol. 1. London: McMillan Press Ltd.
Jiang, D., Zhao, Z., Zhang, T., Zhong, W., Liu, C., Yuan, Q., et al. (2017). The chloroplast genome sequence of Scutellaria baicalensis provides insight into intraspecific and interspecific chloroplast genome diversity in Scutellaria. Genes 8:227. doi: 10.3390/genes8090227
Kato, H., Oginuma, K., Gu, Z., Hammel, B., and Tobe, H. (1998). Phylogenetic relationships of Betulaceae based on matK sequences with particular reference to the position of Ostryopsis. Acta Phytotaxon. Geobot. 49, 89–97.
Katoh, K., and Standley, D. M. (2013). MAFFT multiple sequence alignment Software Version 7: improvements in performance and usability. Mol. Biol. Evol. 30, 772–780. doi: 10.1093/molbev/mst010
Kikuzawa, K. (1982). Leaf survival and evolution in Betulaceae. Ann. Bot. 50, 345–353. doi: 10.1093/oxfordjournals.aob.a086374
Kim, K., Lee, S. C., Lee, J., Yu, Y., Yang, T. J., Choi, B. S., et al. (2015). Complete chloroplast and ribosomal sequences for 30 accessions elucidate evolution of Oryza AA genome species. Sci. Rep. 5:15655. doi: 10.1038/srep15655
Kurtz, S., Choudhuri, J. V., Ohlebusch, E., Schleiermacher, C., Stoye, J., and Giegerich, R. (2001). REPuter: the manifold applications of repeat analysis on a genomic scale. Nucleic Acids Res. 29, 4633–4642. doi: 10.1093/nar/29.22.4633
Leinemann, L., Steiner, W., Hosius, B., Kuchma, O., Arenhövel, W., Fussi, B., et al. (2013). Genetic variation of chloroplast and nuclear markers in natural populations of hazelnut (Corylus avellana L.) in Germany. Plant Syst. Evol. 299, 369–378. doi: 10.1007/s00606-012-0727-0
Li, H., Cao, H., Cai, Y. F., Wang, J. H., Qu, S. P., and Huang, X. Q. (2014). The complete chloroplast genome sequence of sugar beet (Beta vulgaris ssp. vulgaris). Mitochondrial DNA 25, 209–211. doi: 10.3109/19401736.2014.883611
Li, P. C., and Cheng, S. X. (1979). “Betulaceae,” in Flora Republicae Popularis Sinicae, Vol. 21, eds K.-Z. Kuang and P.-C. Li (Beijing: Science Press).
Liang, W. J., and Zhang, Y. M. (1988). “Investigation and study of filbert resources in China,” in Proceedings of the International Symposium on Horticultural Germplasm, Cultivated and Wild, Beijing.
Librado, P., and Rozas, J. (2009). DnaSP v5: a software for comprehensive analysis of DNA polymorphism data. Bioinformatics 25, 1451–1452. doi: 10.1093/bioinformatics/btp187
Liu, X., Wang, Z., Shao, W., Ye, Z., and Zhang, J. (2017). Phylogenetic and taxonomic status analyses of the Abaso section from multiple nuclear genes and plastid fragments reveal new insights into the North America origin of Populus (Salicaceae). Front. Plant Sci. 7:2022. doi: 10.3389/fpls.2016.02022
Lohse, M., Drechsel, O., and Bock, R. (2007). Organellar Genome DRAW (OGDRAW): a tool for the easy generation of high-quality custom graphical maps of plastid and mitochondrial genomes. Curr. Genet. 52, 267–274. doi: 10.1007/s00294-007-0161-y
Lu, R. S., Li, P., and Qiu, Y. X. (2017). The complete chloroplast genomes of three Cardiocrinum (Liliaceae) species: comparative genomic and phylogenetic analyses. Front. Plant Sci. 7:2054. doi: 10.3389/fpls.2016.02054
Luo, R., Liu, B., Xie, Y., Li, Z., Huang, W., Yuan, J., et al. (2012). SOAPdenovo2: an empirically improved memory-efficient short-read de novo assembler. Gigascience 1:18. doi: 10.1186/2047-217X-1-18
Martins, S., Simões, F., Matos, J., Silva, A. P., and Carnide, V. (2014). Genetic relationship among wild, landraces and cultivars of hazelnut (Corylus avellana) from Portugal revealed through ISSR and AFLP markers. Plant Syst. Evol. 300, 1035–1046. doi: 10.1007/s00606-013-0942-3
Niu, Z., Xue, Q., Zhu, S., Sun, J., Liu, W., and Ding, X. (2017). The complete plastome sequences of four orchid species: insights into the evolution of the Orchidaceae and the utility of plastomic mutational hotspots. Front. Plant Sci. 8:715. doi: 10.3389/fpls.2017.00715
Nock, C. J., Waters, D. L. E., Edwards, M. A., Bowen, S. G., Rice, N., Cordeiro, G. M., et al. (2011). Chloroplast genome sequences from total DNA for plant identification. Plant Biotechnol. J. 9, 328–333. doi: 10.1111/j.1467-7652.2010.00558.x
Posada, D., and Crandall, K. A. (1998). Modeltest: testing the model of DNA substitution. Bioinformatics 14, 817–818. doi: 10.1093/bioinformatics/14.9.817
Provan, J., Powell, W., and Hollingsworth, P. M. (2001). Chloroplast microsatellites: new tools for studies in plant ecology and evolution. Trends Ecol. Evol. 16, 142–147. doi: 10.1016/S0169-5347(00)02097-8
Qian, J., Song, J. Y., Gao, H. H., Zhu, Y. J., Xu, J., Pang, X. H., et al. (2013). The complete chloroplast genome sequence of the medicinal plant Salvia miltiorrhiza. PLoS One 8:e57607. doi: 10.1371/journal.pone.0057607
Radicati, L., Botta, R., Vergano, G., and Akkak, A. (1997). DNA characterization of Corylus seedlings and their evaluation as rootstocks for hazelnut. Acta Hortic. 445, 423–432. doi: 10.17660/ActaHortic.1997.445.55
Raubeson, L. A., Peery, R., Timothy, W., Dziubek, C. C., Fourcade, H. M., Booreet, J. L., et al. (2007). Comparative chloroplast genomics: analyses including new sequences from the angiosperms Nuphar advena and Ranunculus macranthus. BMC Genomics 8:174. doi: 10.1186/1471-2164-8-174
Ronquist, F., and Huelsenbeck, J. P. (2003). MrBayes 3: Bayesian phylogenetic inference under mixed models. Bioinformatics 19, 1572–1574. doi: 10.1093/bioinformatics/btg180
Schattner, P., Brooks, A. N., and Lowe, T. M. (2005). The tRNAscan-SE, snoscan and snoGPSweb servers for the detection of tRNAs and snoRNAs. Nucleic Acids Res. 33, W686–W689. doi: 10.1093/nar/gki366
Shaw, J., Shafer, H. L., Leonard, O. R., Kovach, M. J., Schorr, M., and Morris, A. B. (2014). Chloroplast DNA sequence utility for the lowest phylogenetic and phylogeographic inferences in angiosperms: the tortoise and the hare IV. Am. J. Bot. 101, 1987–2004. doi: 10.3732/ajb.1400398
Smith, D. R. (2015). Mutation rates in plastid genomes: they are lower than you might think. Genome Biol. Evol. 7, 1227–1234. doi: 10.1093/gbe/evv069
Song, Y., Dong, W., Liu, B., Xu, C., Yao, X., Gao, J., et al. (2015). Comparative analysis of complete chloroplast genome sequences of two tropical trees Machilus yunnanensis and Machilus balansae in the family Lauraceae. Front. Plant Sci. 6:662. doi: 10.3389/fpls.2015.00662
Stone, D. E. (1973). Patterns in the evolution of amentiferous fruits. Brittonia 25, 371–384. doi: 10.2307/2805641
Suo, Z., Zhang, C., Zheng, Y., He, L., Jin, X., Hou, B., et al. (2012). Revealing genetic diversity of tree peonies at micro-evolution level with hyper- variable chloroplast markers and floral traits. Plant Cell Rep. 31, 2199–2213. doi: 10.1007/s00299-012-1330-0
Tamura, K., Stecher, G., Peterson, D., Filipski, A., and Kumar, S. (2013). MEGA6: molecular evolutionary genetics analysis version 6.0. Mol. Biol. Evol. 30, 2725–2729. doi: 10.1093/molbev/mst197
Thompson, M. M., Lagerstedt, H. B., and Mehlenbacher, S. A. (1996). “Hazelnuts,” in Fruit Breeding: Nuts, Vol. 3, eds J. Janick and J. N. Moore (New York, NY: Wiley), 125–184.
Tozaki, T., Inoue, S., Mashima, S., Ohta, M., Miura, N., and Tomita, M. (2000). Sequence analysis of trinucleotide repeat microsatellites from an enrichment library of the equine genome. Genome 43, 354–365. doi: 10.1139/g99-140
Wang, D., Zhang, Y., Zhang, Z., Zhu, J., and Yu, J. (2010). KaKs-Calculator 2.0: a toolkit incorporating gamma-series methods and sliding window strategies. Genomics Proteomics Bioinformatics 8, 77–80. doi: 10.1016/S1672-0229(10)60008-3
Wang, M., Xie, X., Yan, B., Yan, X., Luo, J., Liu, Y., et al. (2017). The completed chloroplast genome of Ostrya trichocarpa. Conserv. Genet. Resour. 1–3. doi: 10.1007/s12686-017-0869-z
Weng, M. L., Blazier, J. C., Govindu, M., and Jansen, R. K. (2013). Reconstruction of the ancestral plastid genome in Geraniaceae reveals a correlation between genome rearrangements, repeats and nucleotide substitution rates. Mol. Biol. Evol. 31, 645–659. doi: 10.1093/molbev/mst257
Whitcher, I. N., and Wen, J. (2001). Phylogeny and biogeography of Corylus (Betulaceae): inferences from ITS sequences. Syst. Bot. 26, 283–298. doi: 10.1043/0363-6445-26.2.283
Williams, A. V., Boykin, L. M., Howell, K. A., Nevill, P. G., and Small, I. (2015). The complete sequence of the Acacia ligulata chloroplast genome reveals a highly divergent clpP1 gene. PLoS One 10:e0125768. doi: 10.1371/journal.pone.0125768
Wu, C. S., and Chaw, S. M. (2015). Evolutionary stasis in cycad plastomes and the first case of plastome GC-biased gene conversion. Genome Biol Evol. 7, 2000–2009. doi: 10.1093/gbe/evv125
Wu, C. S., Chaw, S. M., and Huang, Y. Y. (2013). Chloroplast phylogenomics indicates that Ginkgo biloba is sister to cycads. Genome Biol. Evol. 5, 243–254. doi: 10.1093/gbe/evt001
Wyman, S. K., Jansen, R. K., and Boore, J. L. (2004). Automatic annotation of organellar genomes with DOGMA. Bioinformatics 20, 3252–3255. doi: 10.1093/bioinformatics/bth352
Xu, C., Dong, W. P., Li, W. Q., Lu, Y. Z., Xie, X. M., Jin, X. B., et al. (2017). Comparative analysis of six Lagerstroemia complete chloroplast genomes. Front. Plant Sci. 8:15. doi: 10.3389/fpls.2017.00015
Xue, J., Wang, S., and Zhou, S. L. (2012). Polymorphic chloroplast microsatellite loci in Nelumbo (Nelumbonaceae). Am. J. Bot. 99, e240–e244. doi: 10.3732/ajb.1100547
Yang, J., Vázquez, L., Chen, X., Li, H., Zhang, H., Liu, Z., et al. (2017). Development of chloroplast and nuclear DNA markers for Chinese oaks (Quercus subgenus Quercus) and assessment of their utility as DNA barcodes. Front. Plant Sci. 8:816. doi: 10.3389/fpls.2017.00816
Yi, X., Gao, L., Wang, B., Su, Y. J., and Wang, T. (2013). The complete chloroplast genome sequence of Cephalotaxus oliveri (Cephalotaxaceae): evolutionary comparison of Cephalotaxus chloroplast DNAs and insights into the loss of inverted repeat copies in gymnosperms. Genome Biol. Evol. 5, 688–698. doi: 10.1093/gbe/evt042
Zhang, S. D., Jin, J. J., Chen, S. Y., Chase, M. W., Soltis, D. E., Li, H. T., et al. (2017). Diversification of Rosaceae since the Late Cretaceous based on plastid phylogenomics. New Phytol. 214, 1355–1367. doi: 10.1111/nph.14461
Zhang, Y., Du, L., Liu, A., Chen, J., Wu, L., Hu, W., et al. (2016). The complete chloroplast genome sequences of five Epimedium species: lights into phylogenetic and taxonomic analyses. Front. Plant Sci. 7:306. doi: 10.3389/fpls.2016.00306
Zhao, P., and Woeste, K. E. (2011). DNA markers identify hybrids between butternut (Juglans cinerea L.) and Japanese walnut (Juglans ailantifolia Carr.). Tree Genet. Genomes 7, 511–533. doi: 10.1007/s11295-010-0352-4
Zhao, S., Su, S. C., Chen, Z. G., and Shuyan, W. Z. (2015). An assessment of the genetic diversity and population genetic structure concerning the Corylus heterophylla Fisch., grown in the Tieling district of Liaoning province, using SSR markers. J. Fruit Sci. 33, 24–33. doi: 10.13925/j.cnki.gsxb.20150187
Keywords: Corylus, comparative genomics, phylogenetic analysis, chloroplast genome variation, interspecific relationships
Citation: Yang Z, Zhao T, Ma Q, Liang L and Wang G (2018) Comparative Genomics and Phylogenetic Analysis Revealed the Chloroplast Genome Variation and Interspecific Relationships of Corylus (Betulaceae) Species. Front. Plant Sci. 9:927. doi: 10.3389/fpls.2018.00927
Received: 20 March 2018; Accepted: 11 June 2018;
Published: 09 July 2018.
Edited by:
TingFung Chan, The Chinese University of Hong Kong, Hong KongReviewed by:
Jinming Chen, Wuhan Botanical Garden (CAS), ChinaXiaoming Pang, Beijing Forestry University, China
Copyright © 2018 Yang, Zhao, Ma, Liang and Wang. This is an open-access article distributed under the terms of the Creative Commons Attribution License (CC BY). The use, distribution or reproduction in other forums is permitted, provided the original author(s) and the copyright owner(s) are credited and that the original publication in this journal is cited, in accordance with accepted academic practice. No use, distribution or reproduction is permitted which does not comply with these terms.
*Correspondence: Tiantian Zhao, Zhaotian1984@163.com Guixi Wang, wanggx0114@126.com