 Xiao-Mei Zhu
 Xiao-Yu Shao1†
 Mei-Ai Zhao
- 1Key Lab of Plant Biotechnology in Universities of Shandong Province, College of Life Sciences, Qingdao Agricultural University, Qingdao, China
- 2College of Agronomy, Qingdao Agricultural University, Qingdao, China
- 3Key Laboratory of Qingdao Major Crop Germplasm Resource Innovation and Application, Qingdao, China
Kernel and ear traits are key components of grain yield in maize (Zea mays L.). Investigation of these traits would help to develop high-yield varieties in maize. Genome-wide association study (GWAS) uses the linkage disequilibrium (LD) in the whole genome to determine the genes affecting certain phenotype. In this study, five ear traits (kernel length and width, ear length and diameter, cob diameter) were investigated across multi-environments for 2 years. Combining with the genotype obtained from Maize SNP50 chip, genetic diversity and association mapping in a set of 292 inbred lines were performed. Results showed that maize lines were clustered into seven subgroups and a total of 20 SNPs were found to be associated with ear traits significantly (P < 3.95E-05). The candidate genes identified by GWAS mainly encoded ubiquitin-activation enzymes (GRMZM2G015287), carotenoid cleavage dioxygenase (GRMZM2G446858), MYB-CC type transfactor, and phosphate starvation response protein 3, and they were associated with kernel length (KL) and ear diameter (ED), respectively. Moreover, two novel genes corresponding to RNA processing and fructose metabolism were found. Further, the SNPs detected by GWAS were confirmed by meta-QTL analysis. These genes and SNPs identified in the study would offer essential information for yield-related genes clone and breeding program in maize.
Introduction
Maize (Zea mays L.) is one of the most significant cereal crops worldwide and plays a crucial role in sustaining food security. In addition, forage crop and industrial energy require maize as a raw material. The wide demands of maize make grain yield a major breeding target. In the past century, maize grain yield has increased eight-fold with the majority of the yield being attributed to selection and hybrid breeding (Duvick, 2005; Xiao et al., 2016). Grain yield is a quantitative trait and easily affected by environmental factors (Messmer et al., 2009; Liu et al., 2014). Kernel and ear traits, kernel length (KL), kernel width (KW), ear length (EL), ear diameter (ED), and cob diameter (CD), are all important yield components in maize (Liu et al., 2014; Zhang et al., 2014), and KL was the most effective one among them in principal component analysis (PCA). Li X. et al. (2016) also found that KL and KW were positive correlation with the single ear yield and grain yield per unit significantly. Thus, it is useful to find the genes of these traits for breeding program.
Genome-wide association study (GWAS) have been verified to be a powerful approach for identifying genes, alleles or haplotypes related to a certain agronomic traits under complex environments (Yan J.B. et al., 2011; Li X. et al., 2016), which is based on the linkage disequilibrium (LD) resulting from the association of target trait and haplotype loci. GWAS provide the opportunity to methodically analyze the genetic architecture of complex quantitative traits in many crops including maize and benefit from the high diversity and rapid LD decay in this species (Li et al., 2012). Using the 24,355 SNPs distributed in the whole genome of wheat, 38 SNPs were found to have high relationship with wheat height by GWAS analysis (Chen et al., 2015), 11 loci of which steadily expressed at least two environments. In maize, GWAS was also successfully identify numerous candidate genes controlling complex traits (Cui et al., 2016), such as plant height (Li X. et al., 2016), drought tolerance (Wang X. et al., 2016), disease resistance (Mammadov et al., 2015), stalk cell wall components (Li K. et al., 2016), ear height (Li X. et al., 2016), etc. Additionally, many QTLs about ear and kernel traits were mapped with linkage populations. Using a F2 population, Yang (2008) detected three consistent QTLs of maize ear diameter, which located in chromosome 2, 5, and 7 and explained 0.8, 1.5, and 0.52% of the phenotype variation, respectively. Liu et al. (2010) mapped QTLs about the number of panicles and the number of row grains with 239 recombinant intersections of Mo17 × Huangzaosi by composite interval mapping (CIM). Li et al. (2009) detected QTLs of KL on chromosome 1, 3, and 6, respectively, with a F2:3 population created from Qi 319 and Huangzaosi. Six QTLs identified by Liu (2013) were individually accounted for 1.18–12.92% of the phenotypic variation. Wang (2015) detected one QTL-qKL9 for KL by using 263 single plants of BC2F2 population, which explained 14.38% of the phenotypic variation. Qin et al. (2015) detected a total of seven QTLs distributing on chromosome 1, 4, 7, and 10, respectively. And the main effect QTL for KL, named as qklen1, was mapped on the physical location of 210–212 Mb on chromosome 1 using the average value of multi-environments. Qin et al. (2015) identified 22 QTLs about KW distributed on chromosomes 1, 2, 3, 4, 5, 6, 9, and 10, respectively, and among them, one QTL on chromosome 10 was further mapped on the physical location of 147 Mb. Also, another four QTLs for KW was detected on each of chromosome 4, 6, 9, and 10 using average value of multi-environments, and named as qkwid4, qkwid6, qkwid9 and qkwid10, respectively (Qin et al., 2015). These identified QTLs and genes were helpful for studying the mechanism of yield-related traits. However, the above studies often use biparental mapping populations, which could not reveal the genetic variation of broader genetic back-ground.
Recently, some kernel related genes had been cloned. With Zheng 58 as the plant material, Xia et al. (2016) obtained a gene ZmMADS-RIN using the homologous cloning method, which has sufficient homology with the gene OsMADS6 related to kernels development in rice. Based on the yield-related gene OsGW2 in rice, Kong et al. (2014) cloned a maize homologous gene ZmGW2-1, which encoded E3 ubiquitin ligase protein and probably regulated the development of ear. A CLAVATA receptor protein locus on chromosome 4 was cloned, and its mutation led to the increase of meristem and ear row number (Bommert et al., 2013). Using a F2 population constructed by a near isogenic line, a 3 kb intergenic region at downstream of Unbranched3 (UB3) gene on chromosome 4 was found, which was responsible for the quantitative variation in kernel row number (KRN) by regulating UB3 expression (Liu L. et al., 2015). According to a key kernel size-related gene (OsGS5) in rice, a 981 bp gene segment ZmGS5 was obtained using homologous cloning method, which encoded protein sequence that belonged to serine carboxypeptidase in maize (Li et al., 2014). And this sequence was as highly as 75% homologous to the protein sequence encoded by OsGS 5 in rice. The results of bioinformatics analysis carried out by Tian et al. (2014) showed that the gene GRMZM2G070323 on chromosome 1 and GRMZM2G148539 on chromosome 5 in maize were homologous with a kernel length-related gene (OsPPKL) in rice. At present, most of yield-related genes of maize come from the homology genes in rice, so the study of GWAS and QTL mapping for maize yield-related traits is imperative.
In this study, the phenotype of five ear traits for an association mapping panel consisting of 292 maize inbred lines were collected in 2015 and 2016. Then, QTLs associated with the five traits were identified with GWAS method, and candidate genes were also predicted. This study would provide useful insights into the genetic basis of related traits, and supply molecular tools for improving kernel size and grain yield in maize.
Materials and Methods
Materials
A total of 292 maize inbred lines (Supplementary Table S2) were analyzed in the study, which were derived from four subgroups of China, Reid, Lvdahonggu, P group, and Sipingtou, as well as some tropical lines and sweet-waxy maize. All the materials were collected or bred by the maize molecular breeding team, Qingdao Agriculture University, China and were commonly used in maize breeding program.
Experimental Design and Phenotyping
The 292 maize inbred lines were grown at three locations of China in 2 years, which were Qingzhou, Shandong Province in 2015 and 2016 (QZ15 and QZ16), Luoyang, Henan Province 2015 (LY15), and Jiaozhou, Shandong Province 2016 (JZ16). Experiment was arranged in a randomized complete block design with three replications, and each inbred line was grown in a single row with 15 plants, 3 m in length, 0.6 m between adjacent rows, and 0.2 m between adjacent plants. The measure method of KL and KW were as described in Jiang et al. (2015). The field management followed normal agricultural practices.
When harvest, five well-developed ears in the middle of each row were selected so as to minimize the boundary effect. A digital caliper (Guilin Guanglu Measuring Instrument Co., Ltd., CHINA) was used to measure KL, KW, EL, EW, and CD, in which EW and CD were measured at the middle of each ear and cob, KL and KW were measured with ten mixed and randomly selected kernels from each inbred line. To ensure accuracy, the data of each trait were determined with the average value of three replications.
Statistical Analysis of Phenotypic Data
SPSS20 statistical software (Armonk, NY, United States: IBM Corp) was used to calculate the phenotypic data, including Normal analysis of each trait and Pearson correlation analysis between traits and environments.
The broad-sense heritability (h2) was calculated using the following formula:
Where, VP is phenotype variation, VG is genetic variation, VE represents environmental variance. Basing on the formula, the smaller the variance of the environment was, the higher ratio the genetic variance in the phenotypic variance accounted for, thus the genetic variation is mostly inherited, and vice versa.
DNA Extraction and SNP Genotyping
Genomic DNA was extracted from the tender leaves at the six-leaf growth stage with the modified cetyltrimethylammonium bromide (CTAB) method (Chen and Ronald, 1999). A total of 56,110 SNPs were selected from the whole maize genome and anchored on a maizeSNP50 DNA chip, and then each inbred line was genotyped with the chip from Pioneer Dupont (United States). After the SNPs with missing rate >20% and heterozygosity >20% were excluded, 35,355 SNPs was kept to be analyzed further. Then, some SNPs with minor allele frequency (MAF) <0.05 also were excluded through genetic diversity analysis of maize population, and only 25,331 SNPs were left for GWAS analysis. The number of alleles and allele frequency of each SNP locus was calculated with PowerMarker V3.25 software1 (Liu and Muse, 2005) .
Molecular Diversity, Linkage Disequilibrium and Population Structure Analysis
Genetic distance of the 292 inbred lines and LD of each chromosome were calculated with Cladogram and LD functions of Tassel 5.2.312 (Bradbury et al., 2007), respectively, and the neighbor-joining (NJ) cluster map constructed. LD level and its decay rate between each pair of SNPs on each chromosome was analyzed with the squared of Pearson correlation coefficient (r2). The calculation result was imported into Excel to create the LD decay plot.
The molecular markers used for subgroups division by the Structure V2.3.4 software3 (Pritchard et al., 2000; Evanno et al., 2005) were selected bases on the distance between the markers of r2 = 0.1. Bayesian cluster analysis of 292 maize inbred lines was carried out using the selected 1361 independent SNPs. Then, the reasonable subgroups number (K) of the population was inferred according to lnP (D) value in Structure V2.3.4. With the optimum K-values ranging from 1 to 10, the strong Markov Chain Monte Carlo (MCMC) after the non-repeated iteration was set to 10000 times at the beginning, and then set to 50000 times with the number of iterations set at 7. The probability of each inbred line grouped into a subgroup to determine the genetic composition of materials.
GWAS Analysis
Fixed and random model Circulating Probability Unification (FarmCPU) (Liu, 2015) was adapted for analyzing large data and calculation speed was quick. With this model, an iterative usage of fixed and random effects for powerful and efficient GWAS was developed to solve the mixed problem of false positive and false negative SNPs in MLM. Then, a total of 25331 SNPs were used for GWAS, with the genome-wide threshold of P = 1/total number of SNPs = 3.95E-05 (Wang et al., 2015; Bai et al., 2016; Ma et al., 2016). Further, to ensure the GWAS results with FarmCPU model, we did GWAS analysis using the compressed mixed linear model (CMLM) in GAPIT package (Lipka et al., 2012). The CMLM is a compression and optimization model based on MLM in Tassel.
Candidate Genes Mining
Based on the SNP locus which were significantly association with target traits, the genome sequence of the maize line B73 was used as the reference genome for selecting candidate gene (Schnable et al., 2009; Liu et al., 2016). The genes corresponding to each SNP locus were checked using the molecular marker database in MaizeGDB4 according to the physical positions of the SNPs. Then, the functional annotations of candidate genes were predicted in NCBI5. The significant association regions were scanned for putative genes using IGV downloaded6, and LD analysis of the linkage SNPs in 310-kb window were conducted using Haploview v.4.27.
Integration of Meta-QTL
Now many QTLs have been reported, but most of them are different due to different mapping populations, different analysis methods, and different environmental conditions, thus resulting in the problems of oversizing or overlapping of QTL position. In this study, we used the meta-analysis function in software BioMercator V4.2, to integrate the many QTLs related to ear traits into the IBM2 2008 Neighbors Map. Thus, many information of QTLs on maize ear traits were collected from the main literatures published from 2007 to 2016 basing on China National Knowledge Infrastructure (CNKI8 and NCBI, which included the size and type of the mapping population, the markers’ genetic distance, mapping function, and the position, LOD value, contribution rate, and confidence intervals of QTLs. Because the maximum likelihood value, confidence interval, and contribution rate are important information of QTL (Okuda et al., 2007), the 95% confidence interval of each QTL is inferred from the two equations below before it was introduced into the IBM2 2008 Neighbors Map.
Where, CI is the confidence interval, N represents the mapping population size, R2 represents the contribution ratio. And Equation 1 is suitable for backcross and F2 mapping populations, and Equation 2 is suitable for the recombinant inbred lines (Qi et al., 2011).
So, the high-density genetic linkage map IBM2 2008 Neighbors was obtained. The specific position on the map successively contained 1, 2, 3, 4, and N “real” QTL(s) in five models of QTL given by the simulation operation, and the optimal model was judged by the value of the minimum Akaike-type criteria value (AIC) (Goffinet and Gerber, 2000). And the initial QTLs used for mata-QTL was not less than three.
Results
Genetic Diversity, Linkage Disequilibrium and Population Structure Analysis
Based on the 25331 SNPs for GWAS, we made relationship diagram among 292 maize inbred lines (Figure 1A). And 96.75% of the relationship values between two lines ranged between 0.25 and 0.75, and only 0.06% of them was zero, 3.19% >1, and 38.48% <0.5, which mean that most of the materials are relatively relevant to each other, with a few irrelevant.
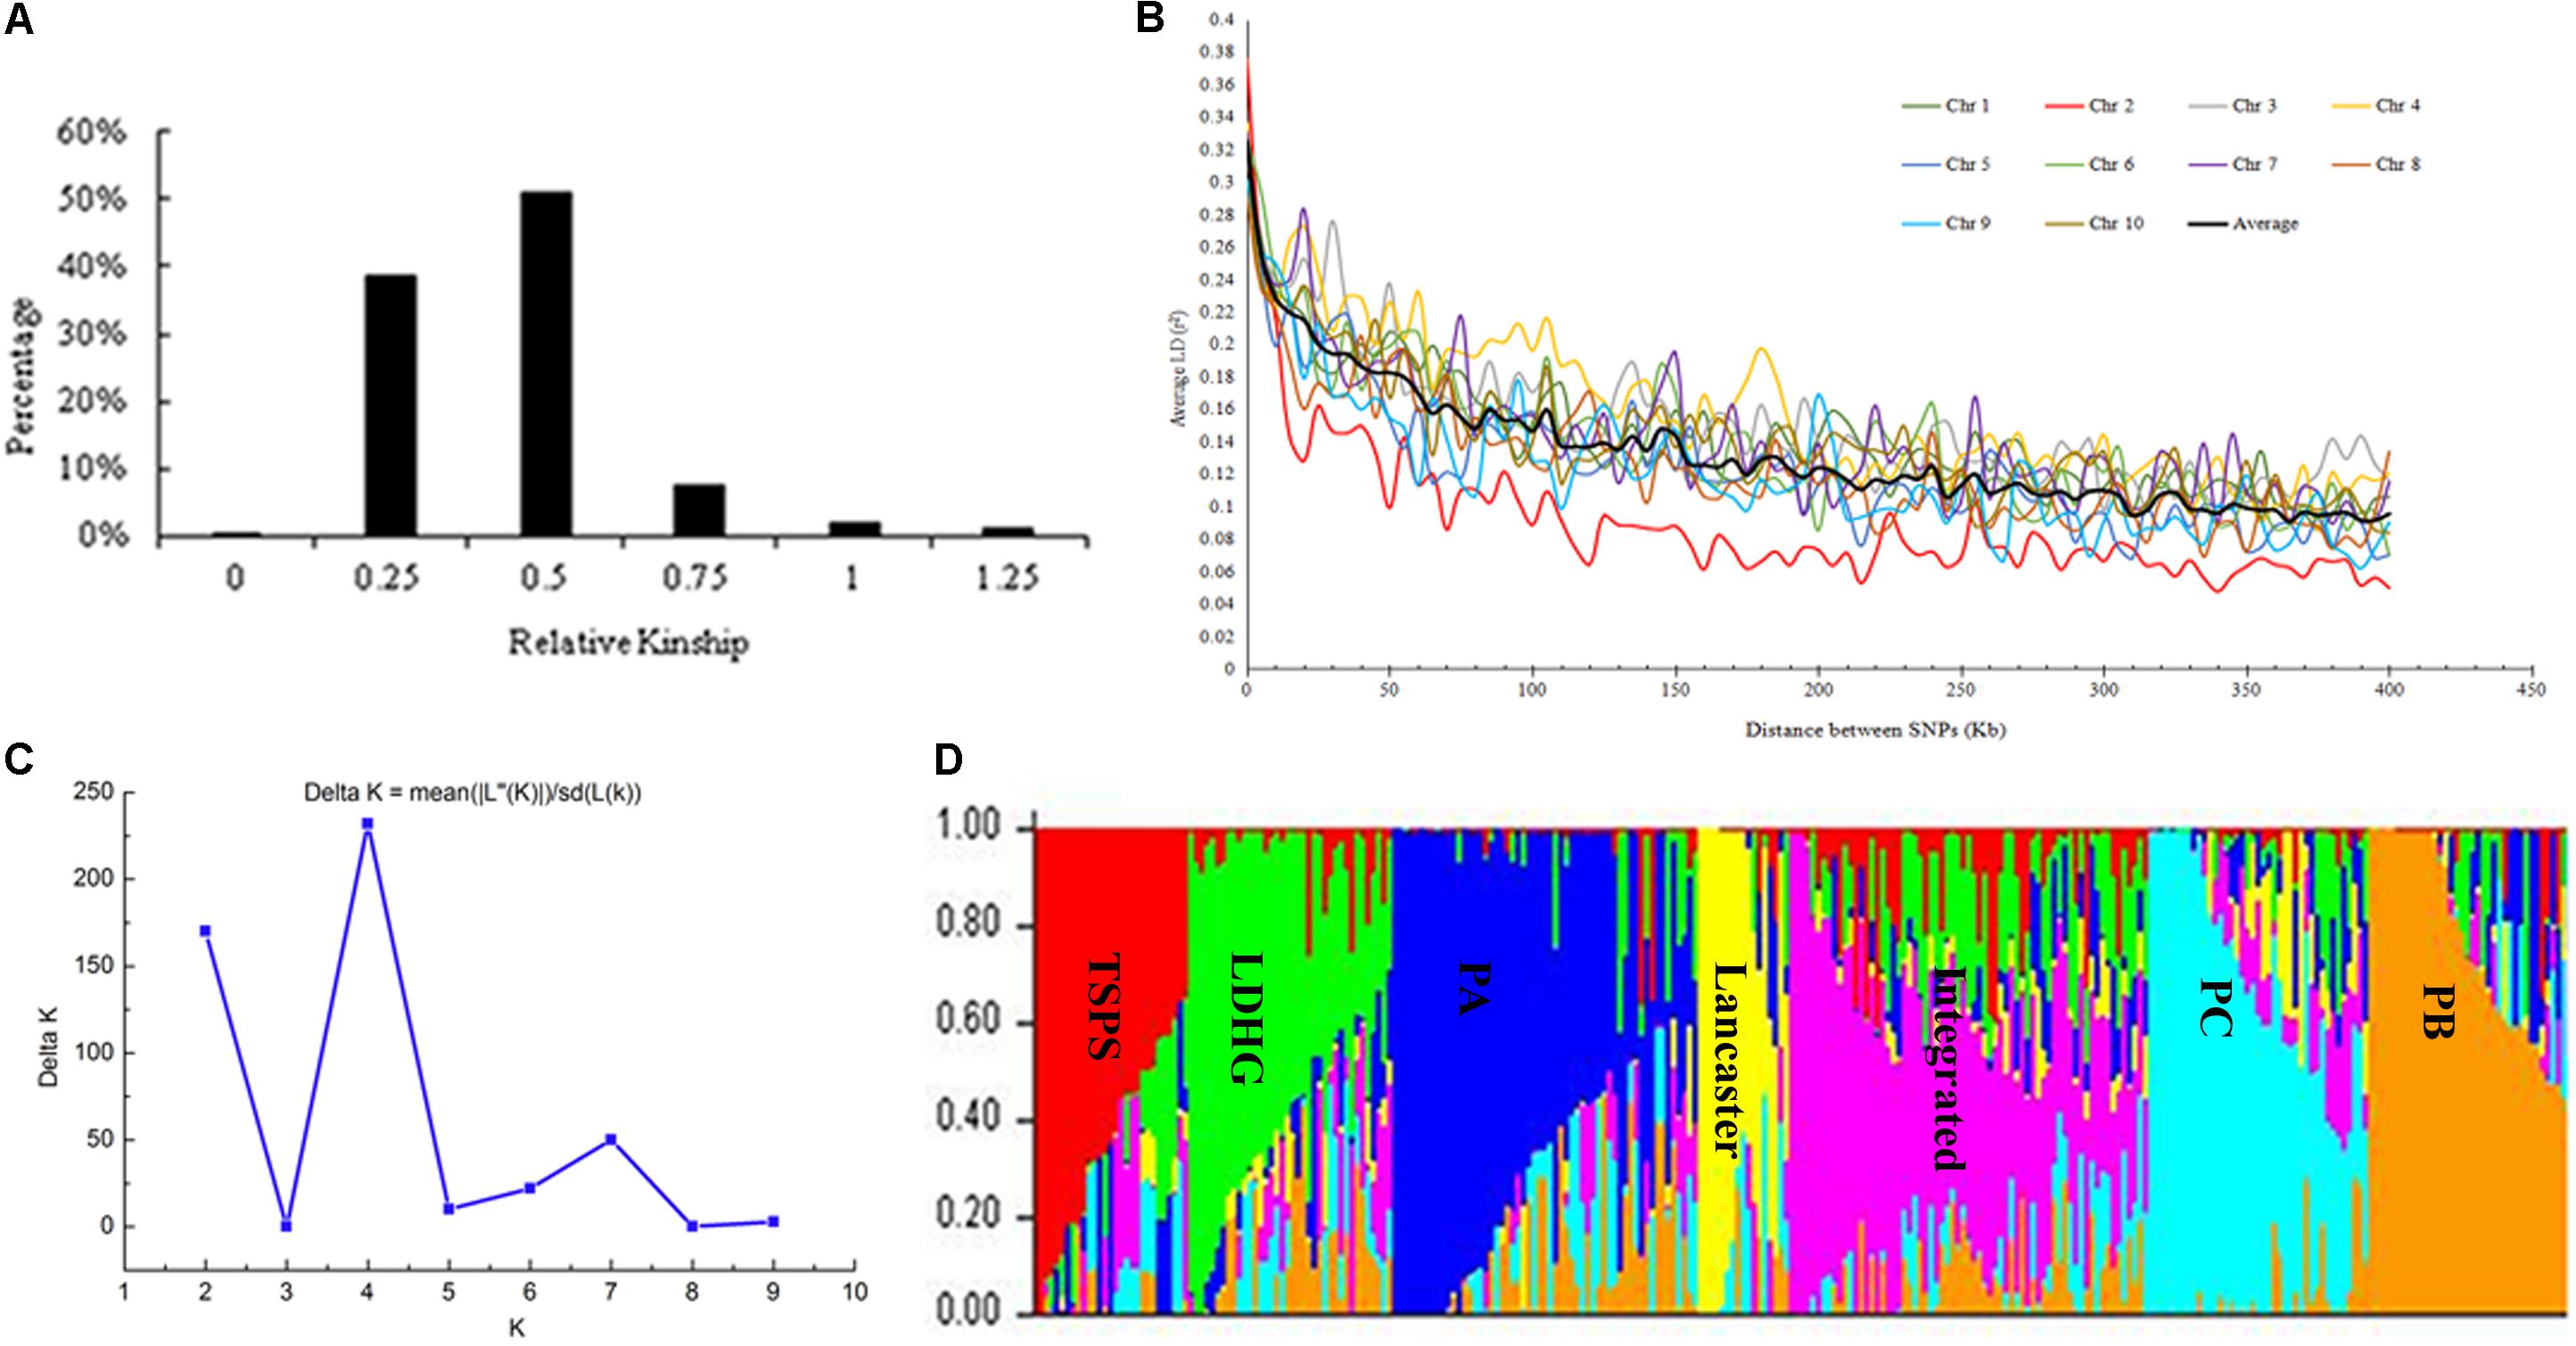
FIGURE 1. Analysis of genetic diversity. (A) Distribution of pairwise relative kinship for 292 maize inbred lines calculated using 25331 filtered SNPs. (B) Whole-genome LD in the entire panel based on 292 maize inbred lines. (C) ΔK-value of 292 inbred lines based on 1362 SNPs. (D) The Bayes cluster plot of 292 maize inbred lines when K = 7.
The LD level of the whole genome of inbred lines was estimated using 25331 SNPs. Results showed that LD decayed differently in ten chromosomes, with chromosome 2 had the most rapid decay rate and chromosome 4 had the slowest. At a cut-off value of r2 = 0.1, the averaged LD decay distance of 292 maize inbred lines was approximately 310 kb (Figure 1B).
The genetic distance between 292 maize inbred materials was calculated by Tassel 5.2.31, and a neighbor-joining clustering graph was constructed (Figure 2). The entire materials were divided into seven groups, namely, Tangsipingtou, PA, PB, PC, Lvdahonggu, Lancaster, and an integrated groups. Tangsipingtou group mainly consists of inbred lines such as Chang 7-2, Lx 9801, H 21 as well as hybrids selected from Chang 7-2 hybridizing with other materials in this study. The PA group tends to Reid, including Zheng 58, Ye 478 etc. PB group mainly includes Ex, Qi 319, P 138, Qi 318, X 178 and so on. PC group tends to BSSS, mainly including B73. Lvdahonggu group mainly contains E28, Dan 340 and other materials. Most of the inbred lines were clustered into their corresponding subgroup, and the tropical lines and sweet-waxy maize derived from Philippines and Mexico were clustered into the integrated group. However, a few inbred lines belonging to Lancaster subgroup, such as Qi 205 and Ji 846, were diffused in other subgroups.
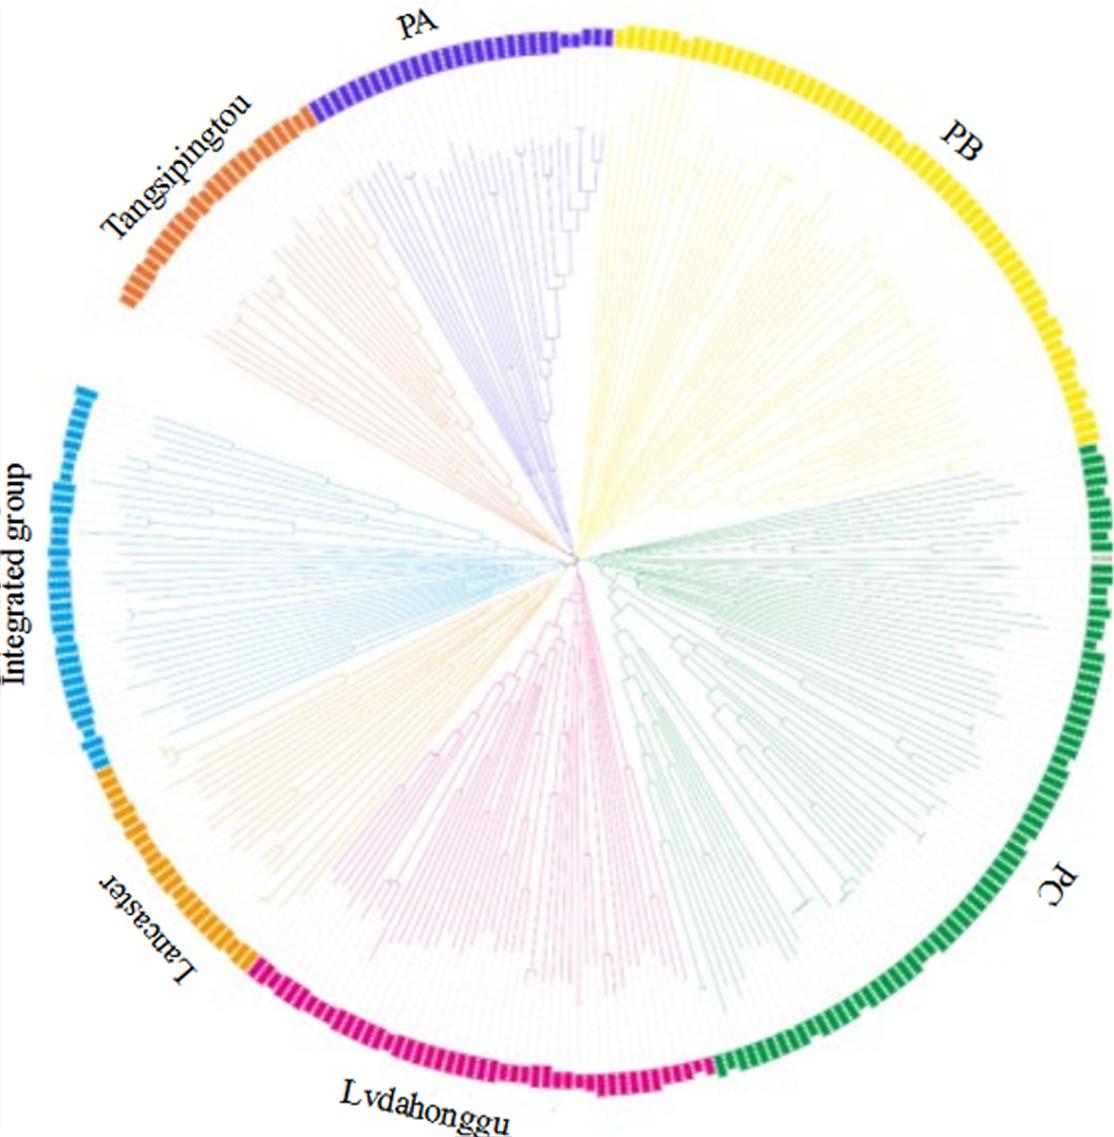
FIGURE 2. Neighbor-joining (NJ) tree for the 292 maize inbred lines based on 25331 SNPs analysis data.
The genetic diversity results analyzed with the Structure software are the same as that of NJ clustering. When K = 7, the 292 inbred lines could be grouped into seven large subgroups (Figures 1C,D).
Phenotype Statistics
The descriptive statistics for ear and kernel traits under three natural environments in 2 years are presented in Table 1. Abundant and large variation of the five traits, KL, KW, EL, ED, and CD, was observed in each location. But the variation values of each trait were different at different environments. For example, the variation for the KL in LY15 ranged from 65.04 to 135.96 mm (mean ±SD = 98.54 ± 10.40 mm), but it ranged from 67.30 to 117.95 mm (92.71 ± 9.04 mm) in JZ16. The H2 of the five traits was relatively high, ranging from 68.86 for EL to 85.88% for ED (Table 1), indicating that a large portion of phenotypic variance for ear and grain traits could be attributed to genotypic effects. All the phenotypic data of every trait follow Normal distribution, as the absolute values of kurtosis and skewness among these environments were less than 1, thus they were suitable for QTL mapping (Figure 3).
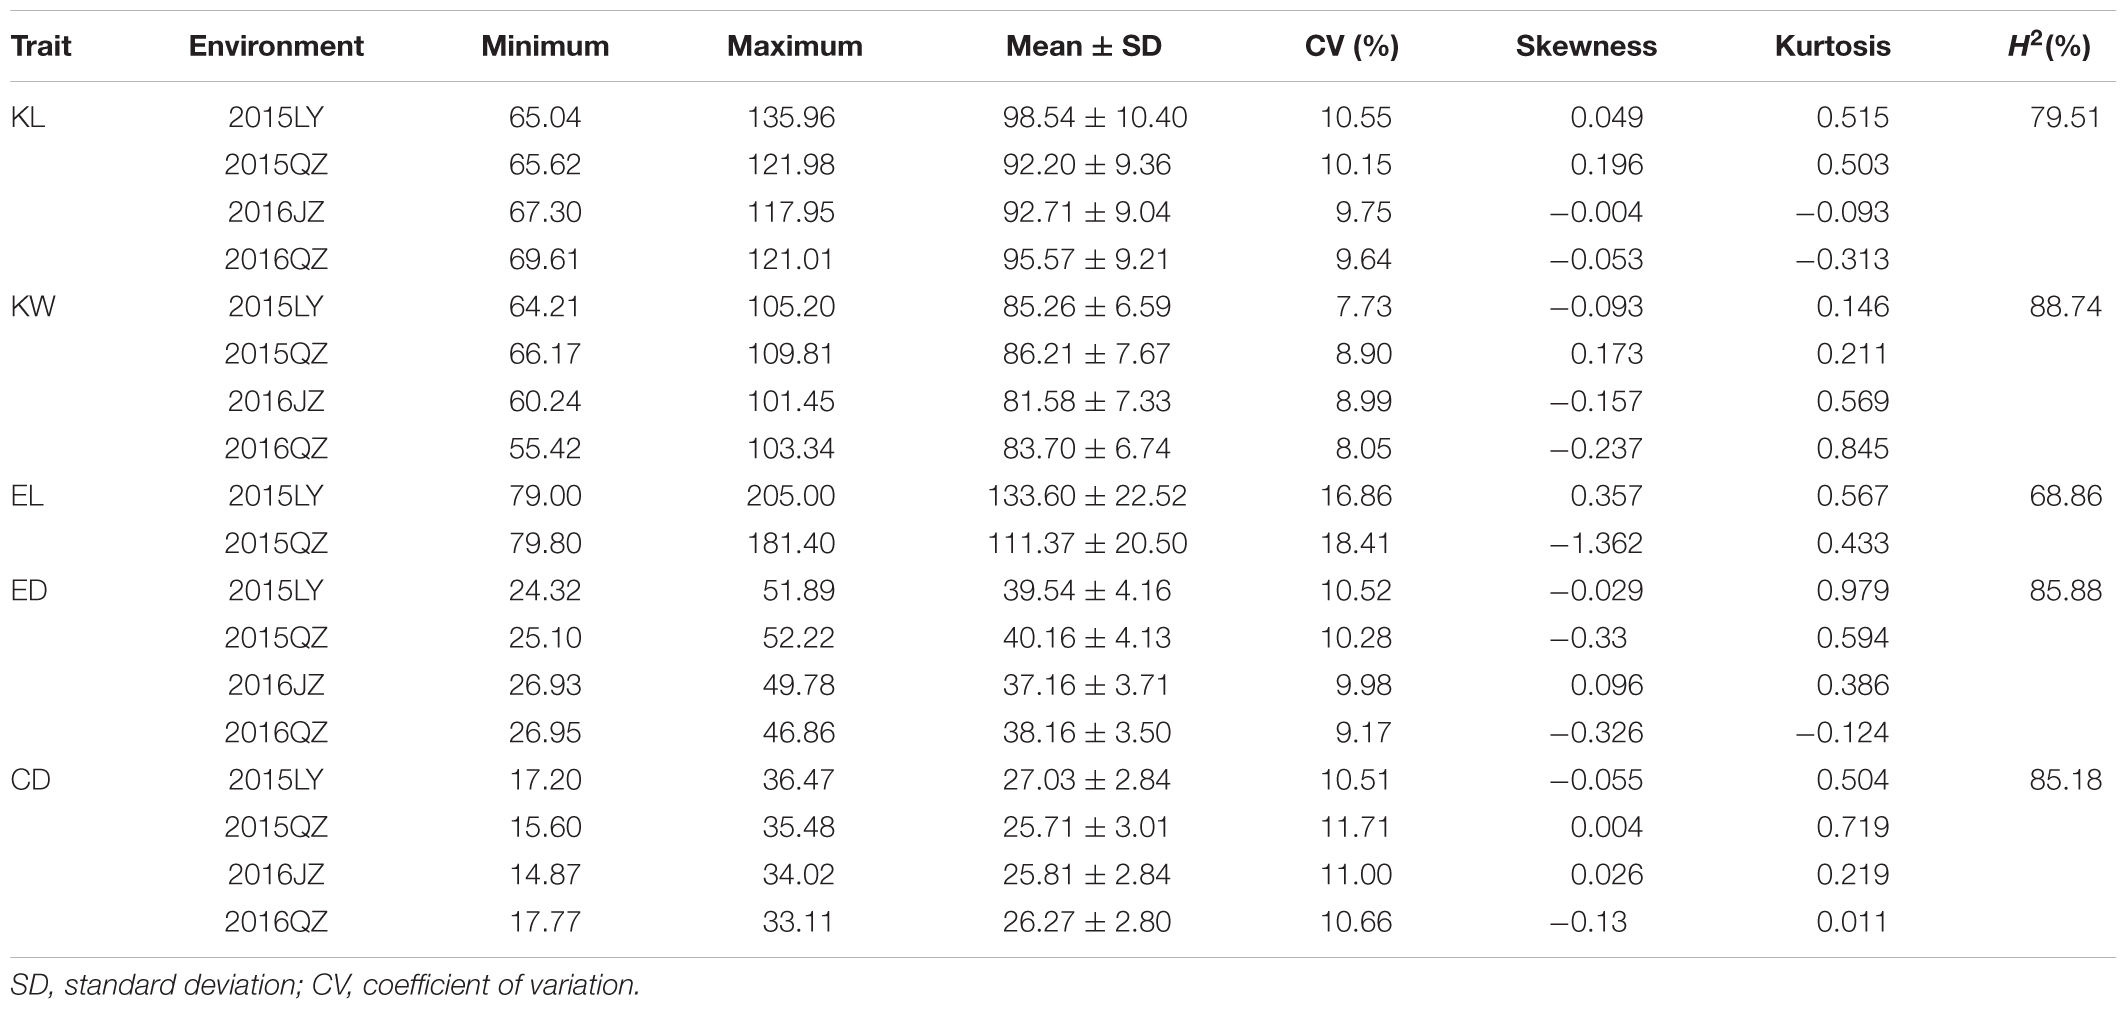
TABLE 1. Descriptive statistics and broad-sense heritability (H2) for five traits including kernel length (KL), kernel width (KW), ear length (EL), ear diameter (ED), and cob diameter (CD) among 292 accessions across four environments.
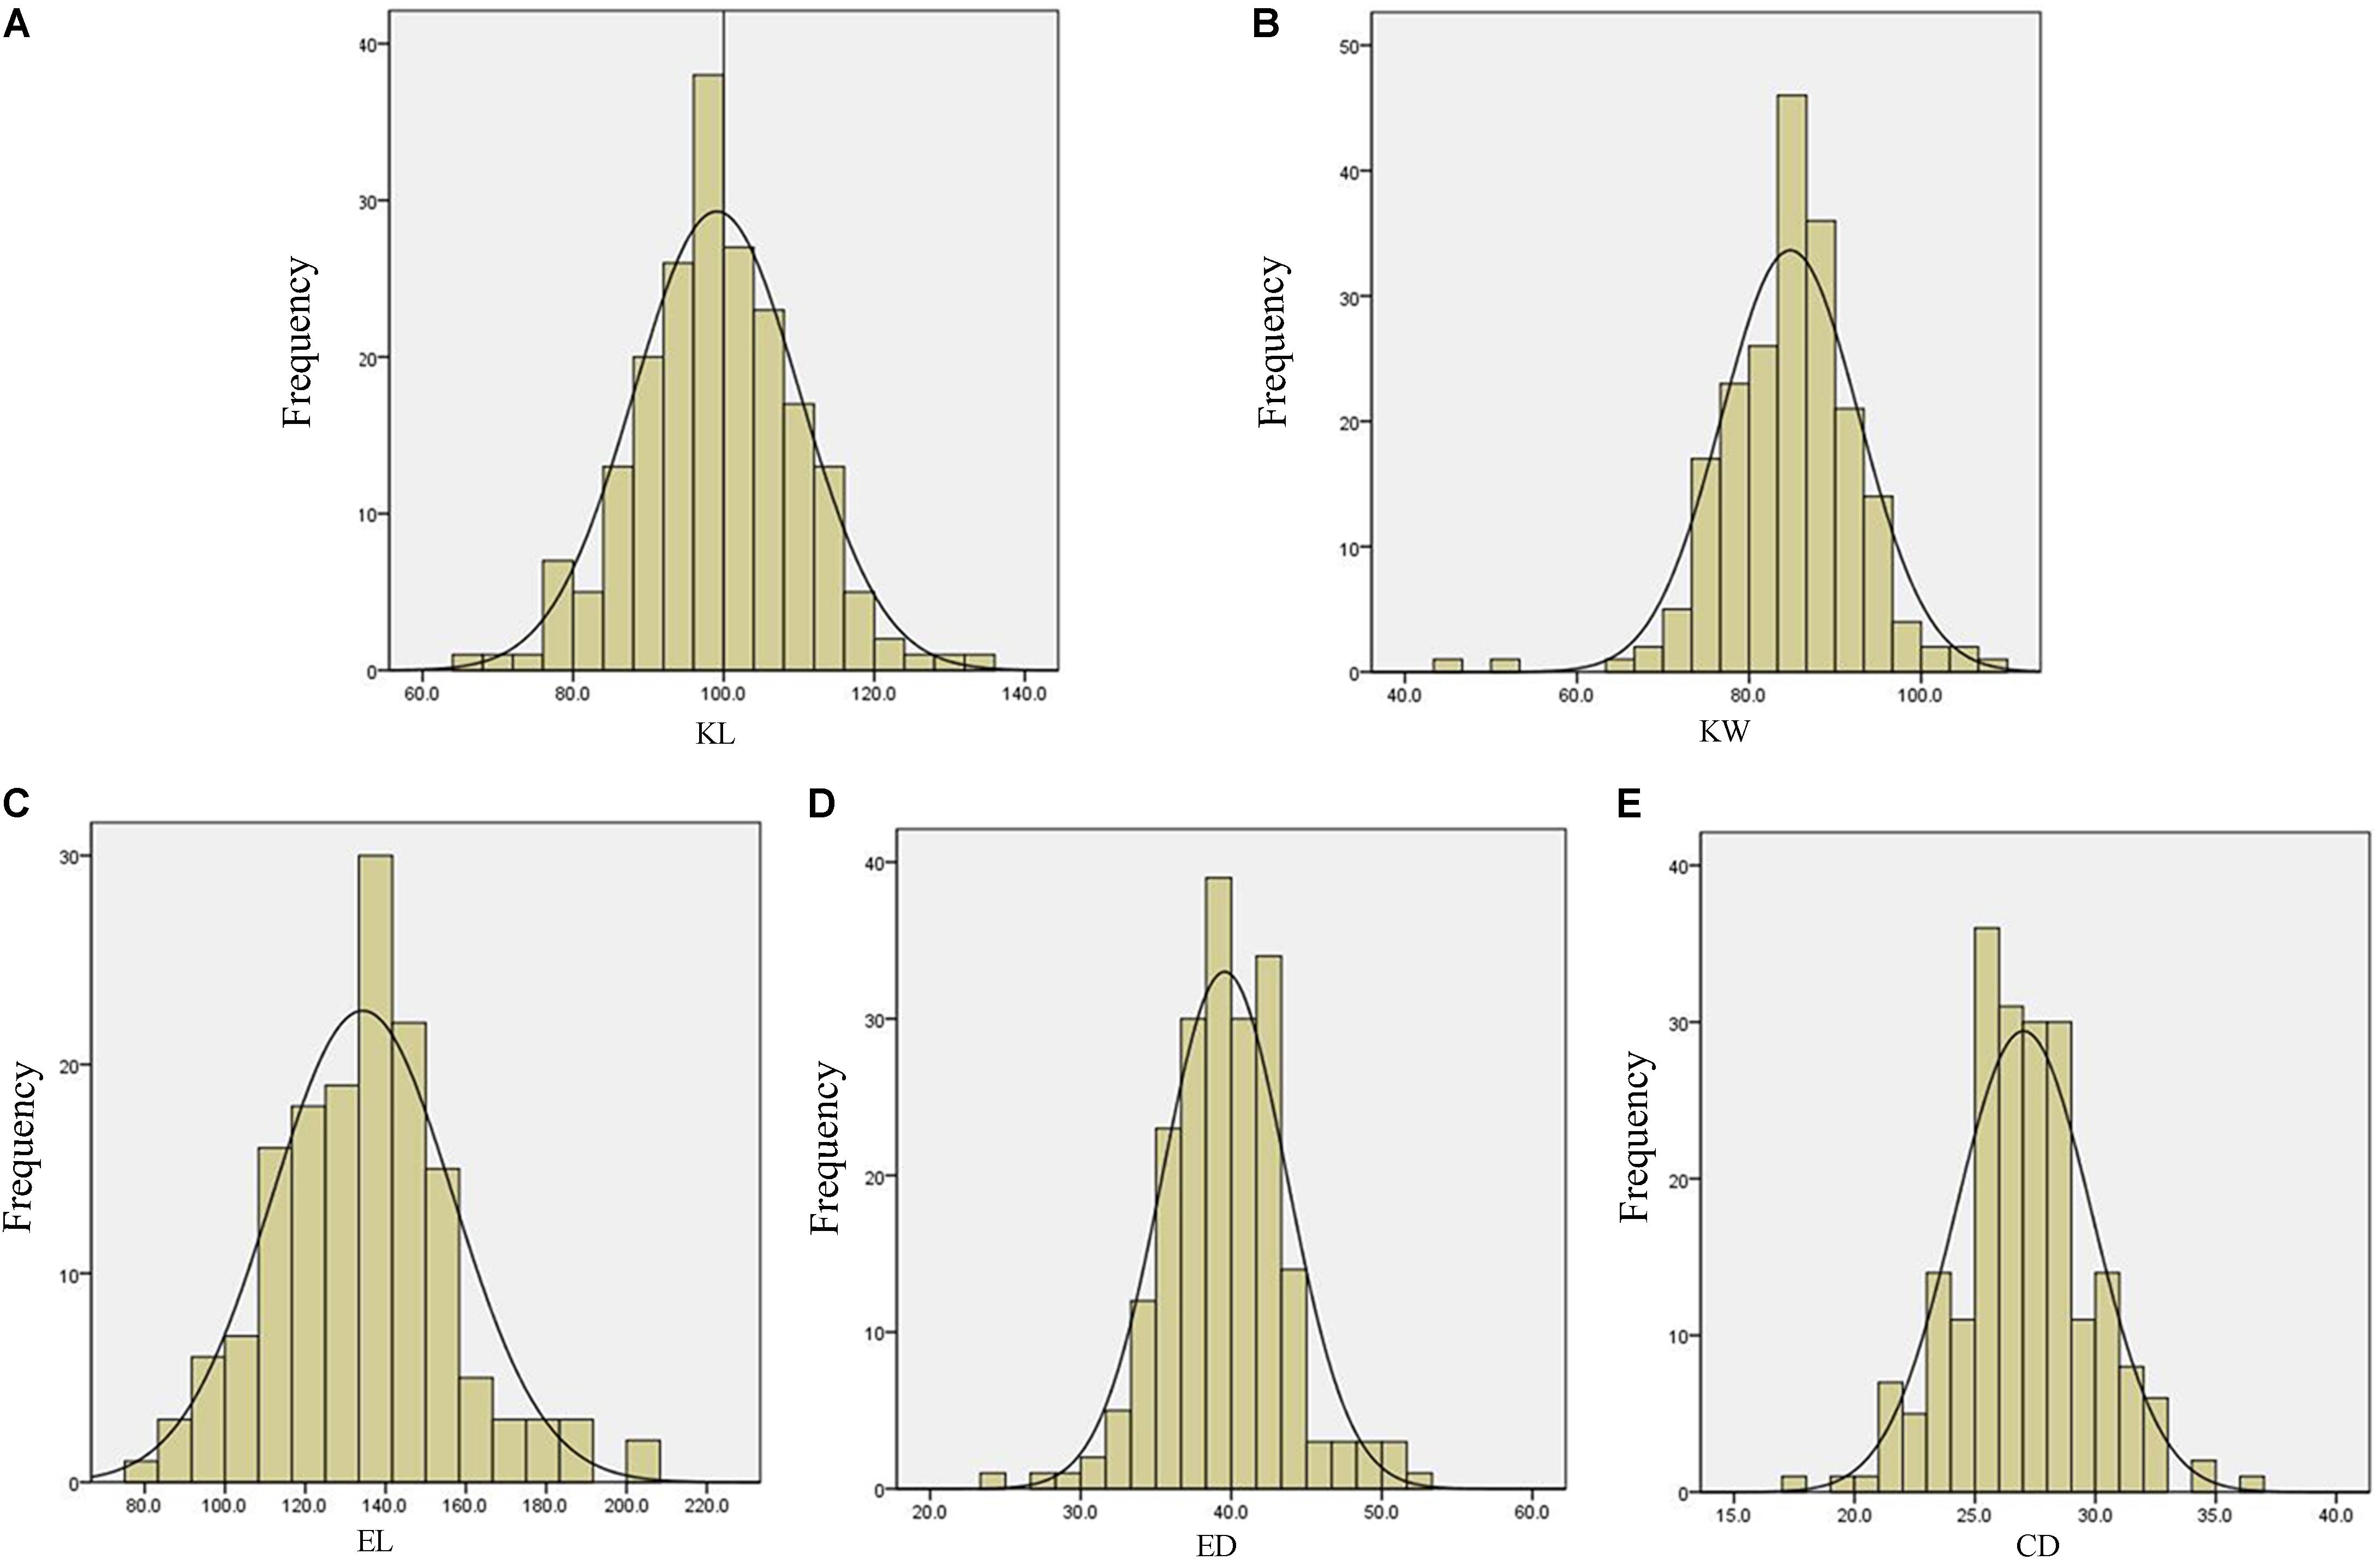
FIGURE 3. Phenotypic distribution for measured traits of Luoyang in 2015. (A) KL, kernel length; (B) KW, kernel width; (C) EL, ear length; (D) ED, ear diameter; (E) CD, cob diameter.
Correlation Analysis
To verify the accuracy and consistency of the results, ANOVA was conducted to reveal the significant correlation among the five ear traits in 2 years (Table 2). Among all the positive correlations in 2015, the highest value was found between ED and CD, while the lowest value was between ED and KW. In 2016, significantly positive correlations were obtained between all traits except KL and CD in Jiaozhou (Supplementary Table S1).
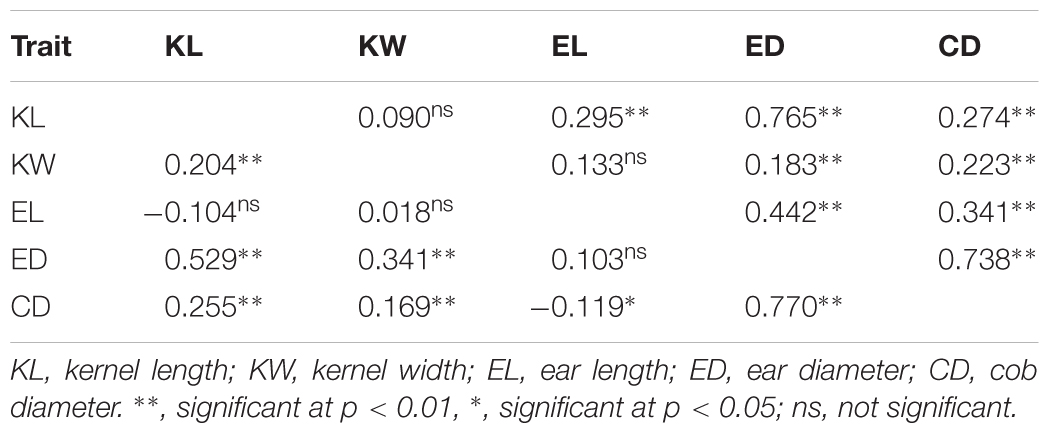
TABLE 2. Phenotypic correlation coefficient estimates for each trait in Luoyang, 2015 (above diagonal) and Qingzhou, 2015 (below diagonal).
GWAS Analysis
Using FarmCPU, the phenotype data of five ear traits and the genotype data of 25331 SNPs were analyzed for GWAS. Quantile–quantile (Q–Q) plots implied that the population structure and kinship relationship were well controlled in the GWAS for each trait. The horizontal and the verticle axises show the values of -lg (Transformed expected P-value) and -lg (Transformed observed P-value), respectively (Figure 4 and Supplementary Figures S1–S3).
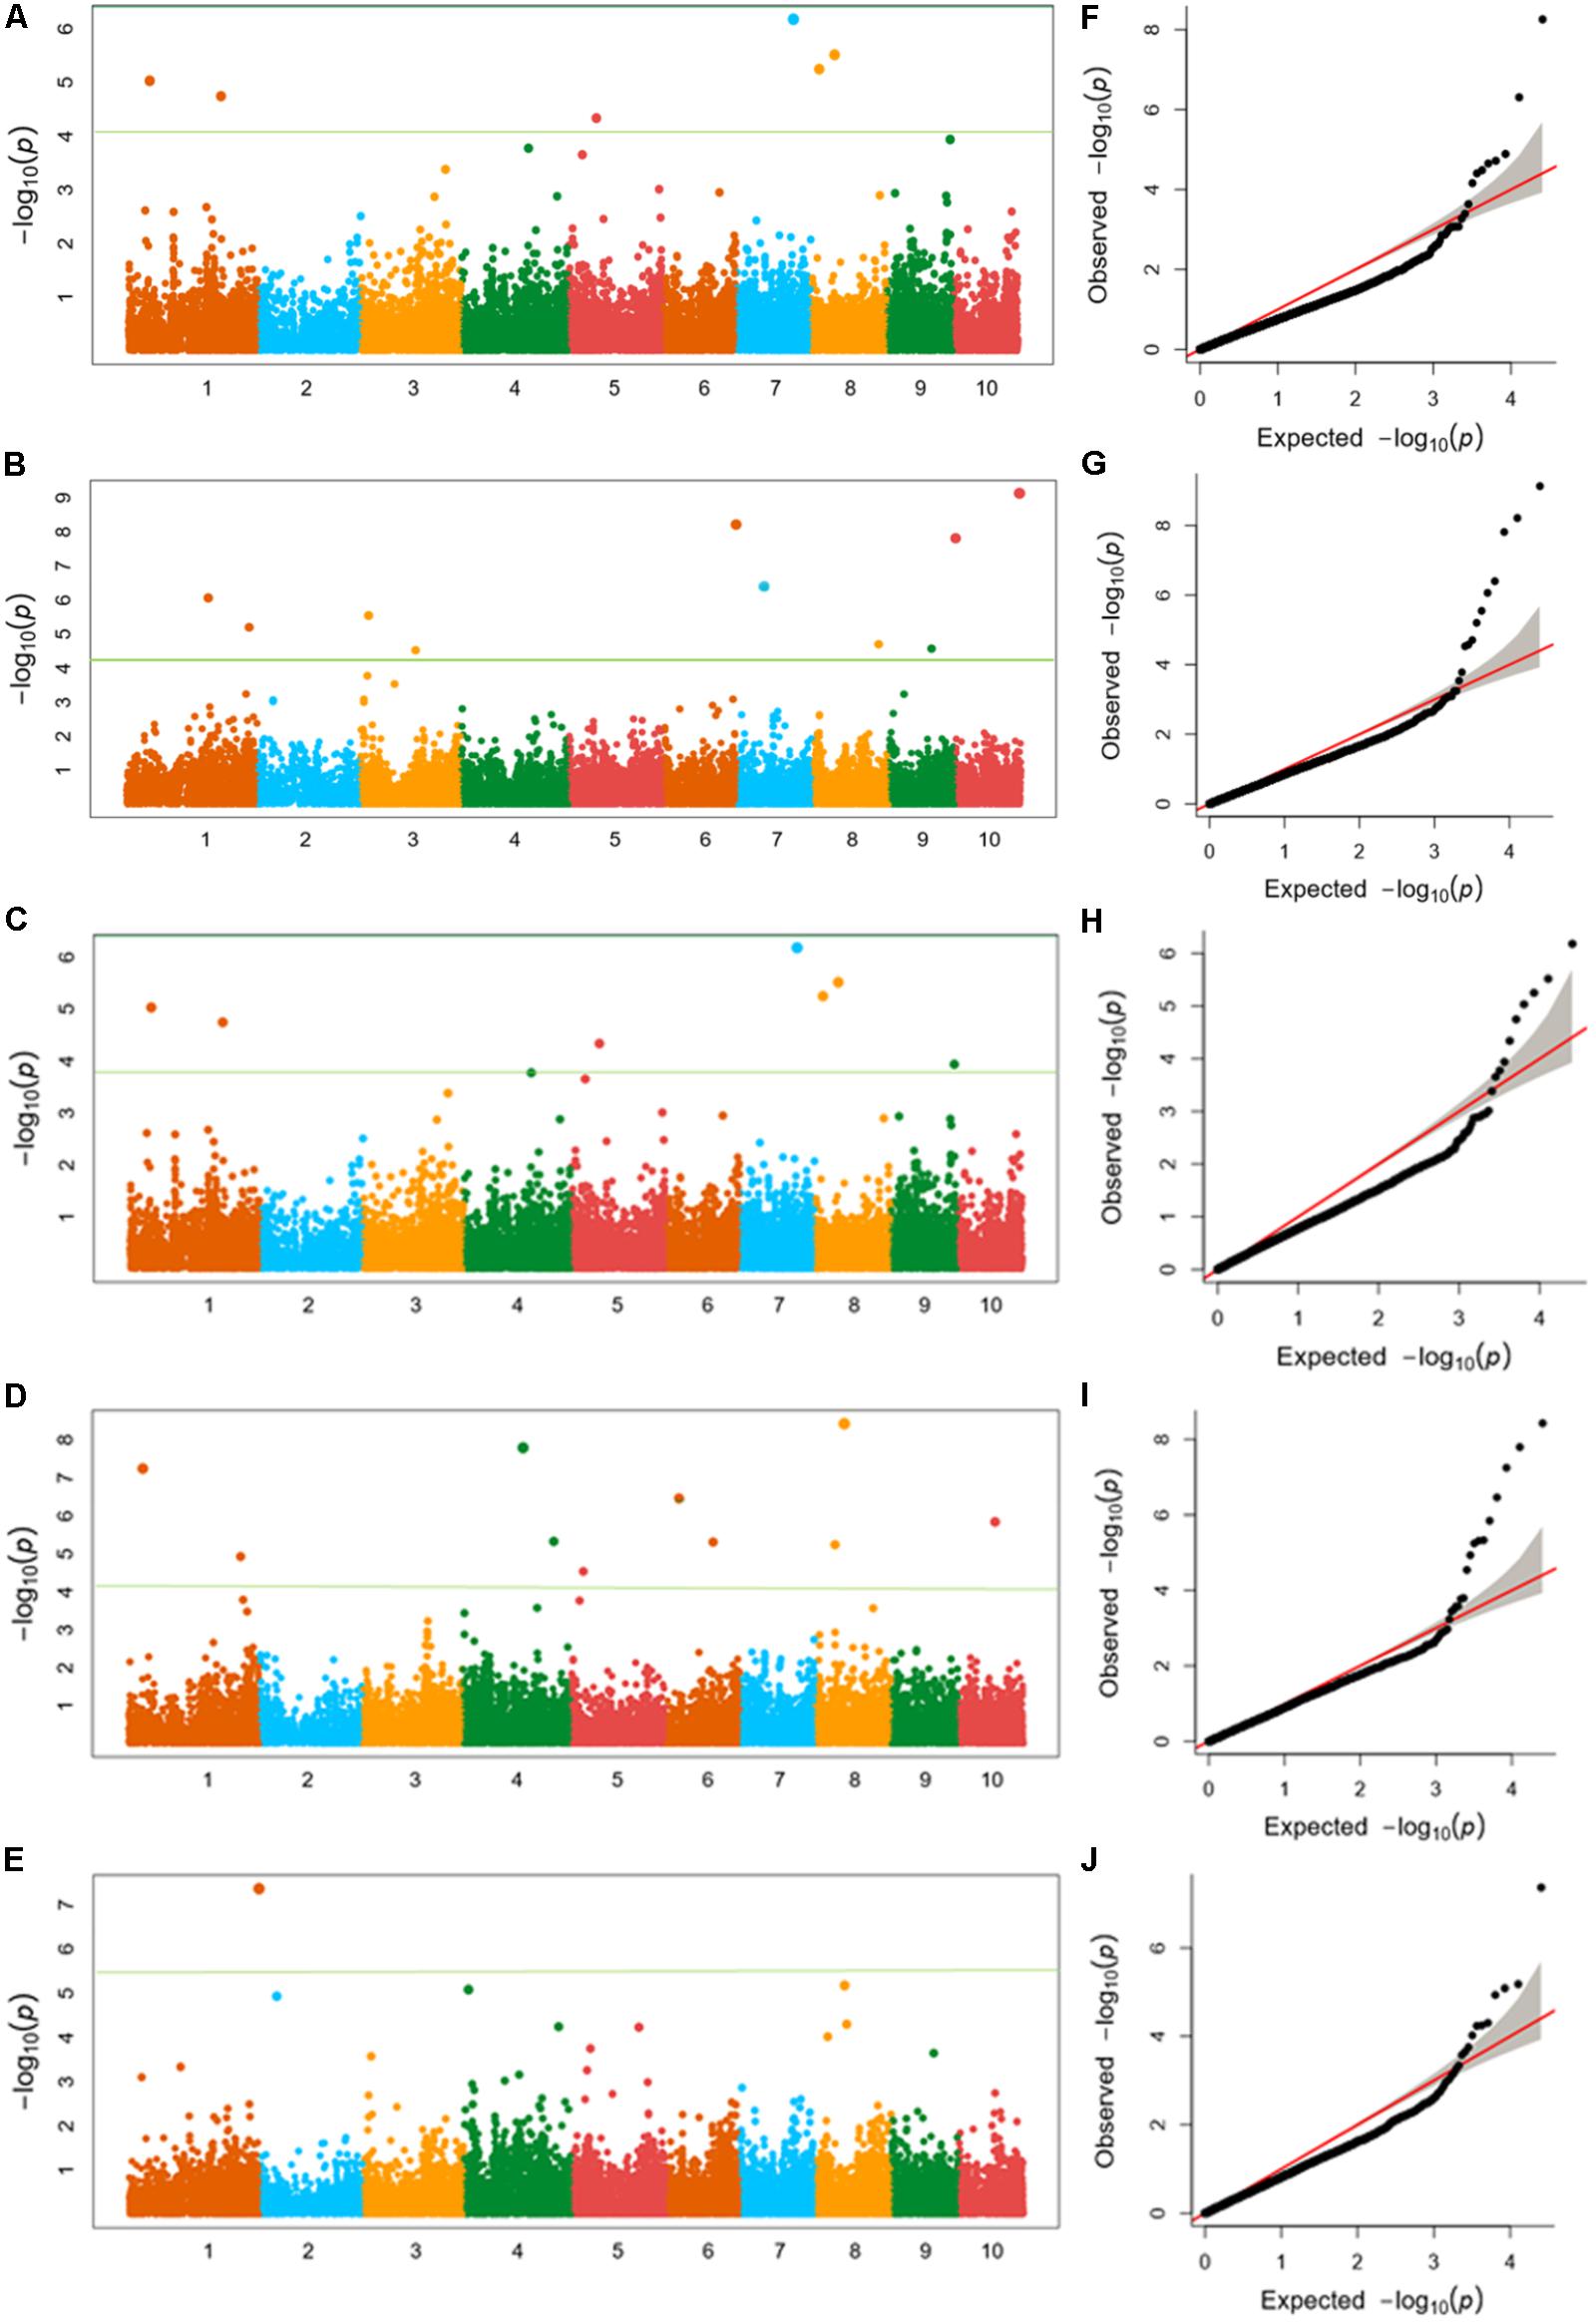
FIGURE 4. (A–E) Manhattan plots of (A) kernel length, (B) kernel width, (C) ear length, (D) ear diameter, (E) cob diameter for the 10 chromosomes carrying the significant markers detected by FarmCPU in Luoyang, 2015; (F–J) Quantile–Quantile (Q–Q) plots of the five traits in the same order with Manhattan plots showing expected null distribution of p-value assuming no associations, represented as solid red line; distribution of p-value observed.
Twenty SNPs, significantly associated with the five ear-related traits, have been detected and distributed on eight chromosomes of maize (Table 3). Among them, four SNPs, associated with KL dispersed on chromosome 3, 6, and 7 (2), were detected. Especially, the SNP locus PZE_107042407 on bin7.02 was detected both in JZ16 and LY15. For KW, three SNPs were detected only in LY15 and distributed on chromosomes 6 and 10 (2), respectively. Additional, one SNP locus associated with EL, seven loci associated with ED, and five associated with CD were also identified. Among all the SNPs related to ear traits in this study, the one related to CD on chromosome 1 was the most significant among them. All the details of SNPs and candidate genes were shown in Supplementary Table S3.
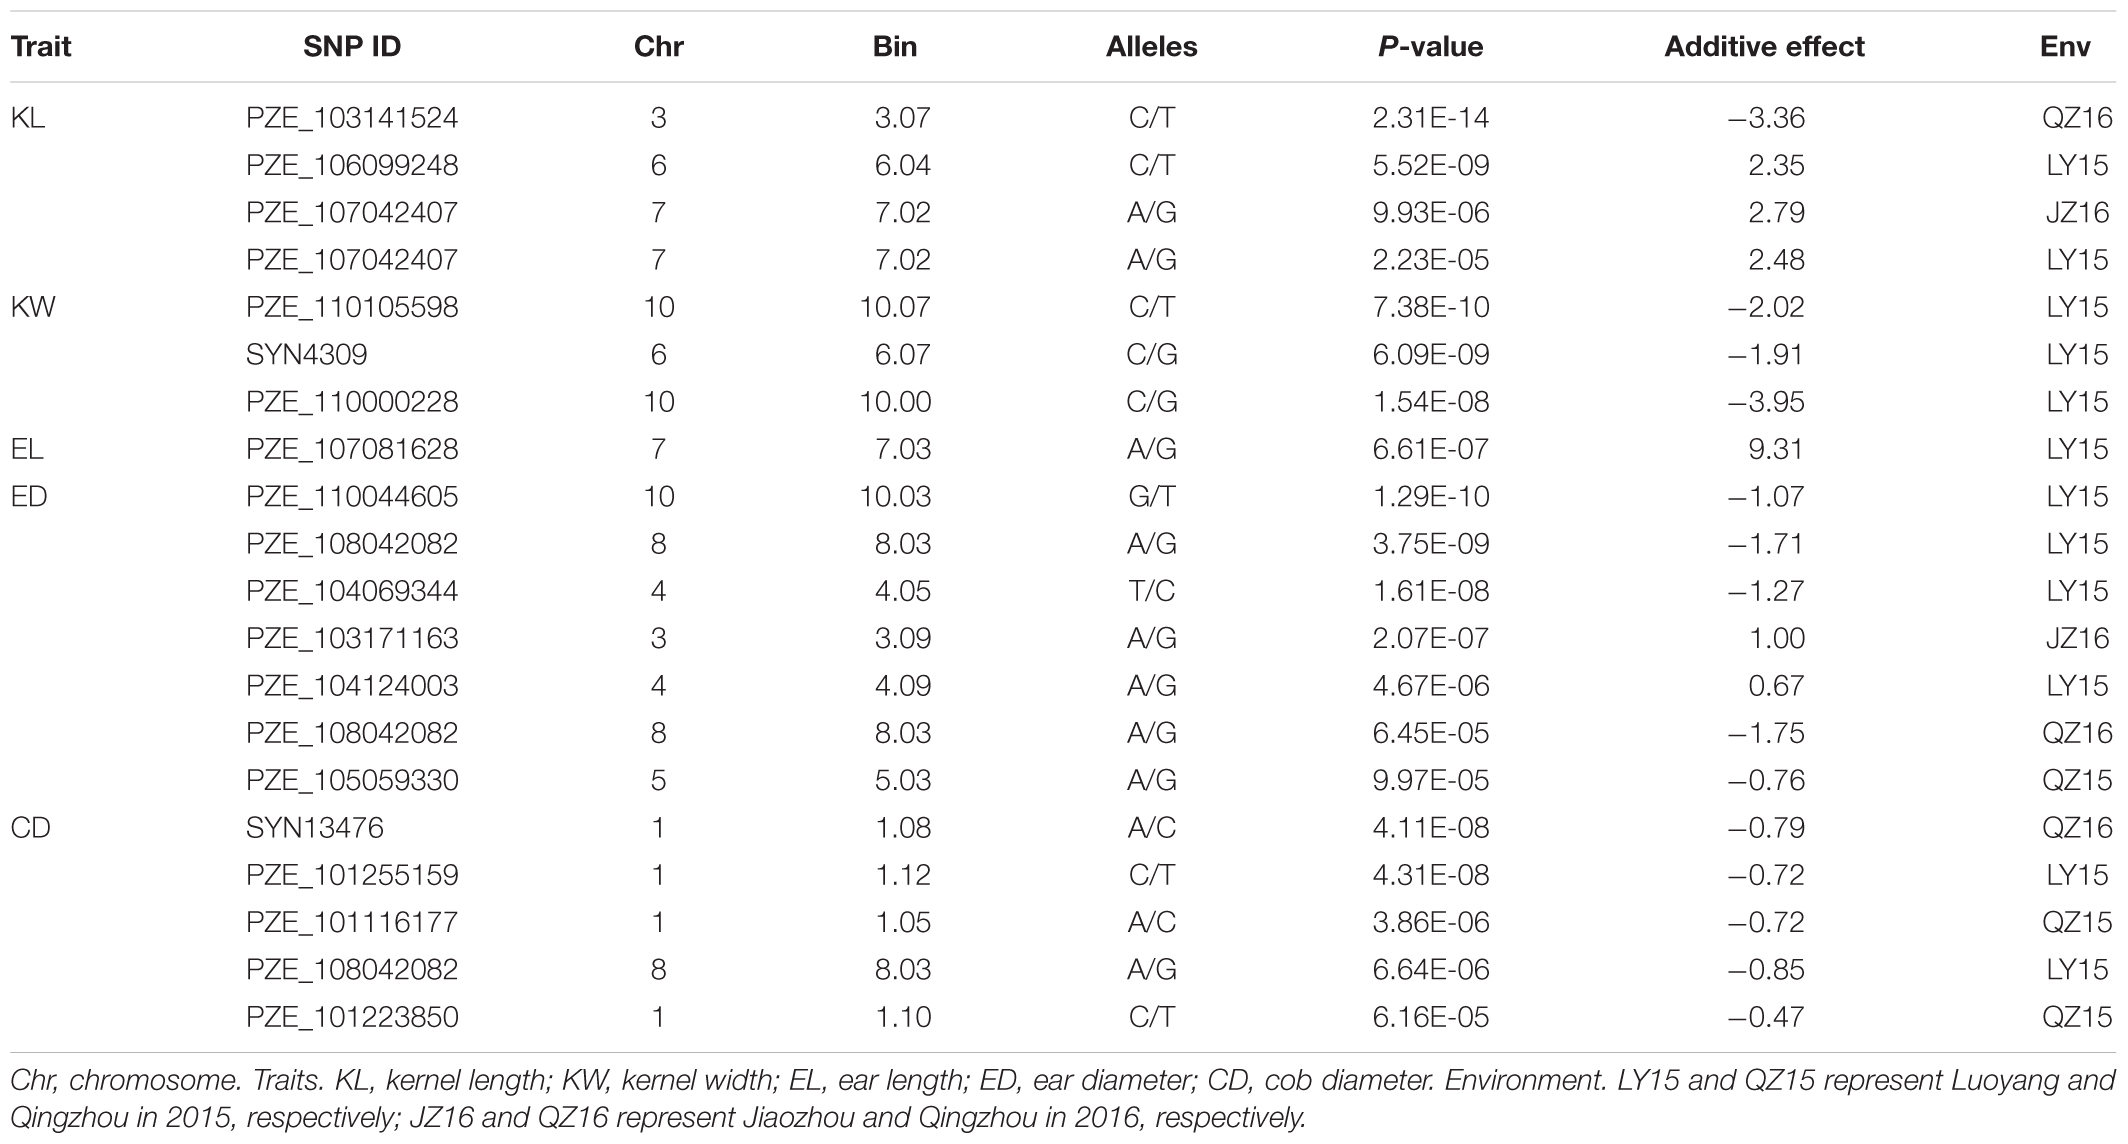
TABLE 3. Most significant marker loci associated with five traits over 2 years in three locations.
We also analyzed the five traits using CMLM model in GAPIT package (Figure 5). In the Q-Q plots of association studies, the signal above the Bonferroni correction line by FarmCPU was better than that by CMLM model in GAPIT, which suggested that candidate genes were difficult to be distinguished from the background noise by CMLM. Namely, CMLM reduces the detection efficiency of the associated sites with known candidate genes when compared with FarmCPU (Figure 6). In our study, and the significantly association loci decreased to 26 when the CMLM was employed.
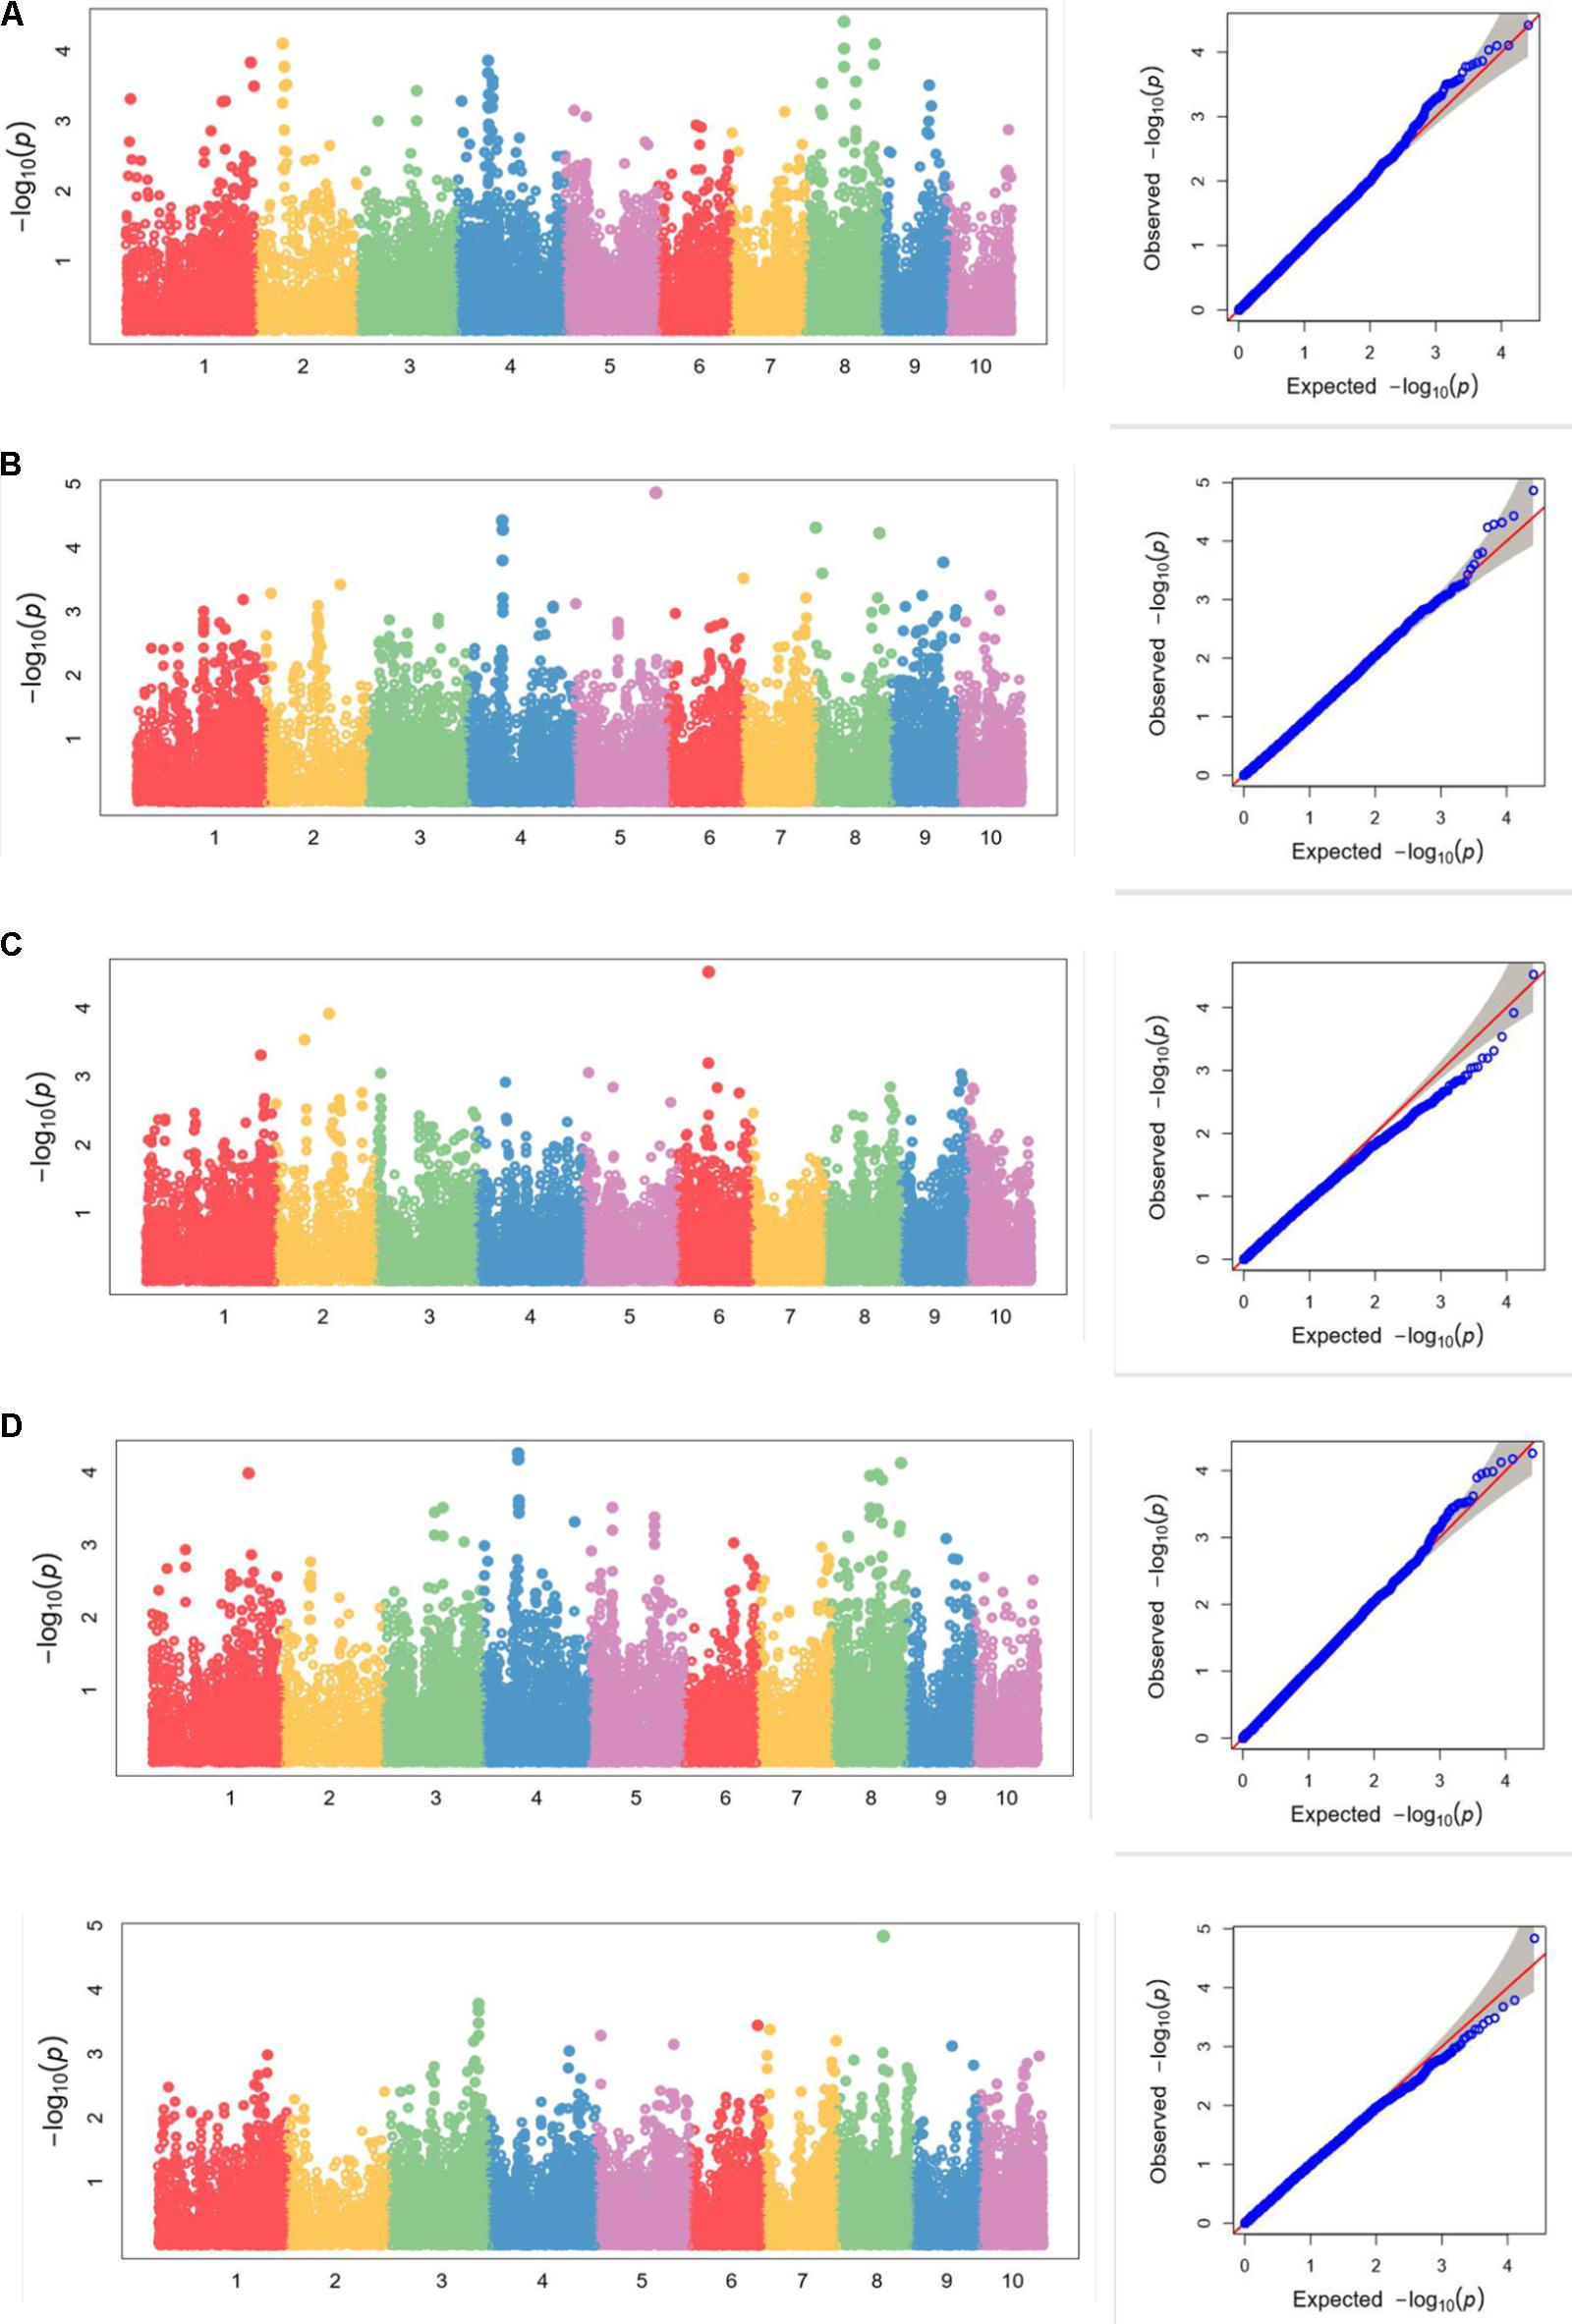
FIGURE 5. (A–E) Manhattan plots and Q-Q plots of (A) kernel length, (B) kernel width, (C) ear length, (D) ear diameter, (E) cob diameter resulted by GAPIT in Luoyang, 2015.
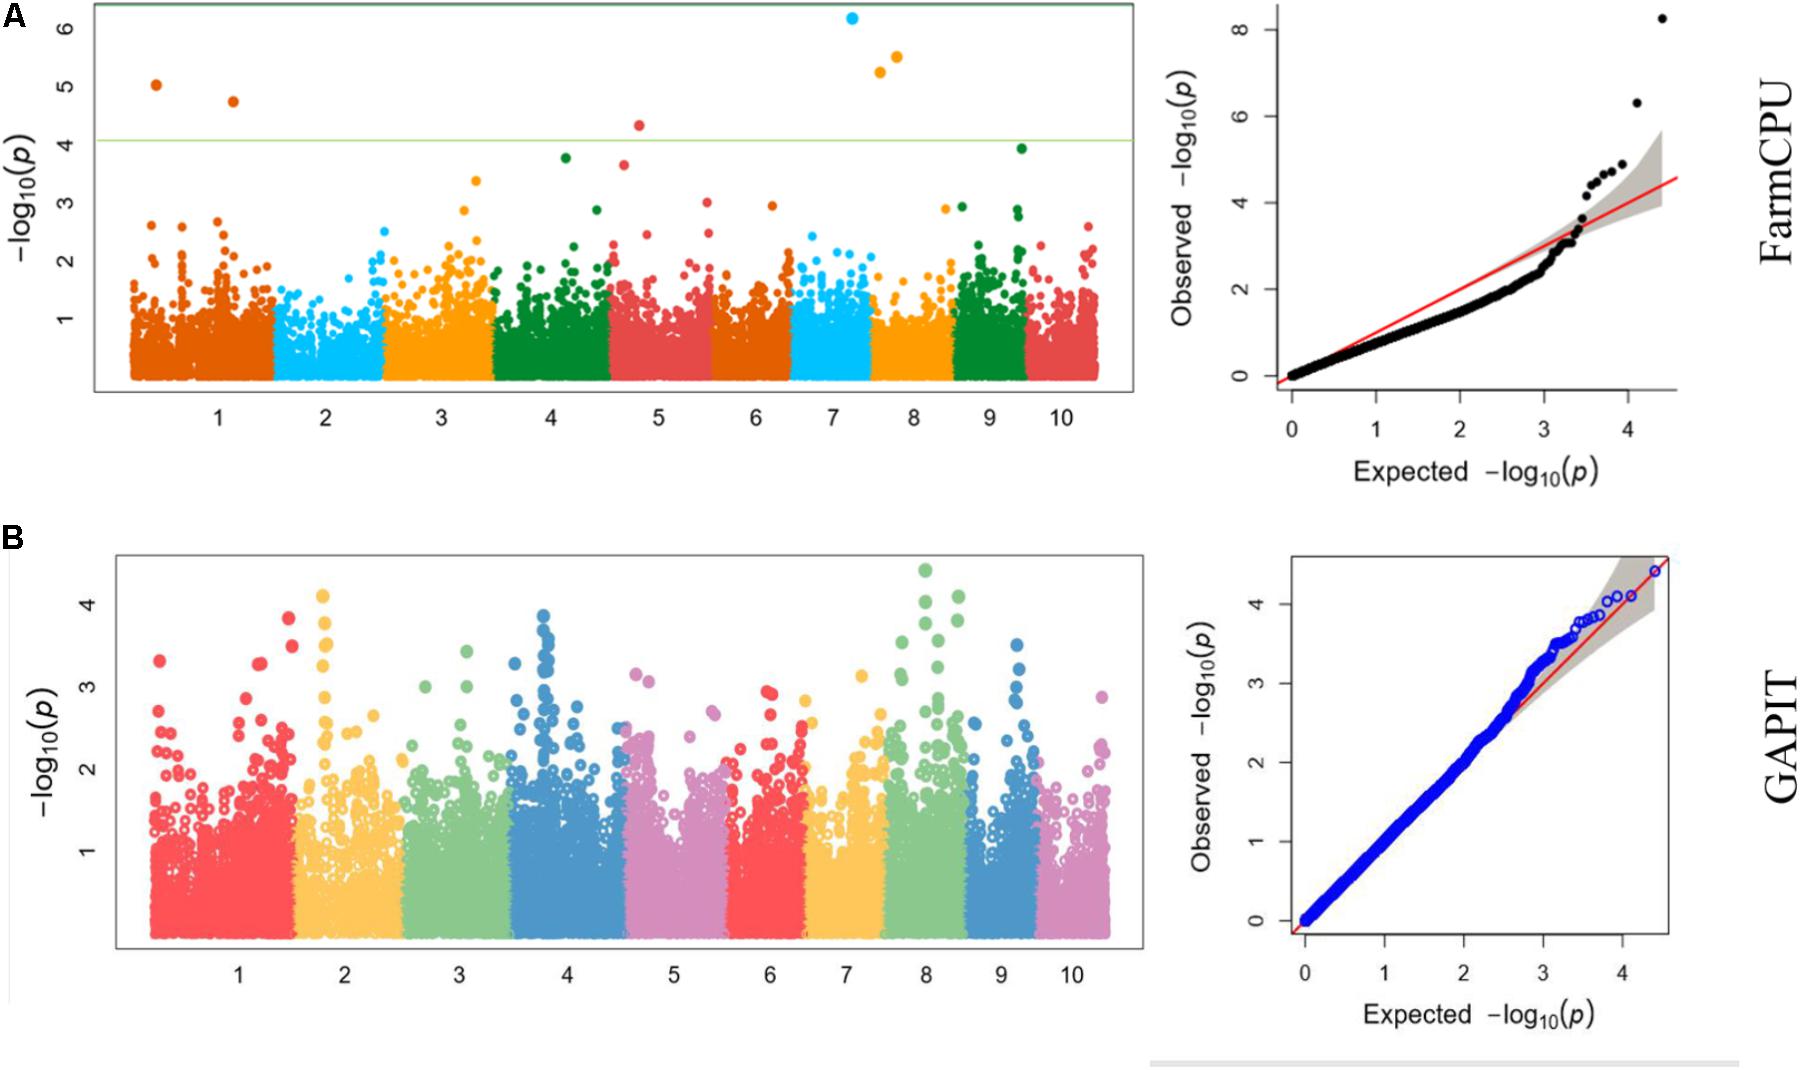
FIGURE 6. Manhattan plots and Q-Q plots of kernel length in Luoyang, 2015 resulted by (A) FarmCPU and (B) GAPIT.
Candidate Genes Predicting
Candidate genes containing SNPs associated with the five ear-related traits were identified, and their function were predicted basing on MaizeGDB and NCBI (Table 4). SNP locus, PZE_107042407, which was detected in two environments of JZ16 and LY15 simultaneously, was located within the interval of gene GRMZM2G173943, whose functional annotation is MYB-CC type transfactor. Reported genes, Arabidopsis AtPHR1 and algal PSR1, are members of MYB-CC gene family and regulated phosphorous hunger signal pathway (Moseley et al., 2006; Li, 2007; Bournier et al., 2013). Besides, a gene related to ED (LOC103626417), responded to protein phosphoric acid hunger was discovered in this study. Three SNPs associated with KW were located within the intervals of gene GRMZM2G124502, GRMZM2G092475, and GRMZM2G057441, respectively, and the three genes are related to encoding SWIB complex BAF60b domain-containing protein, probable sodium/metabolite co-transporter BASS4, chloroplastic and ubiquitin-activating enzyme E1 2, respectively. What’s more, four candidate genes related to ubiquitin, GRMZM2G057441, GRMZM2G015287, GRMZM2G018798, and LOC100381748 were screened. Among them, GRMZM2G015287 correlated with ED and CD was detected in LY15 and QZ16 simultaneously. The genes located at the association regions flanked by three significant SNPs were also identified within the estimated 310-kb window (Table 5). Two linkage genes at chr: 72.21–72.53 Mb were identified in the same LD block with PZE_107042407 (Figure 7).
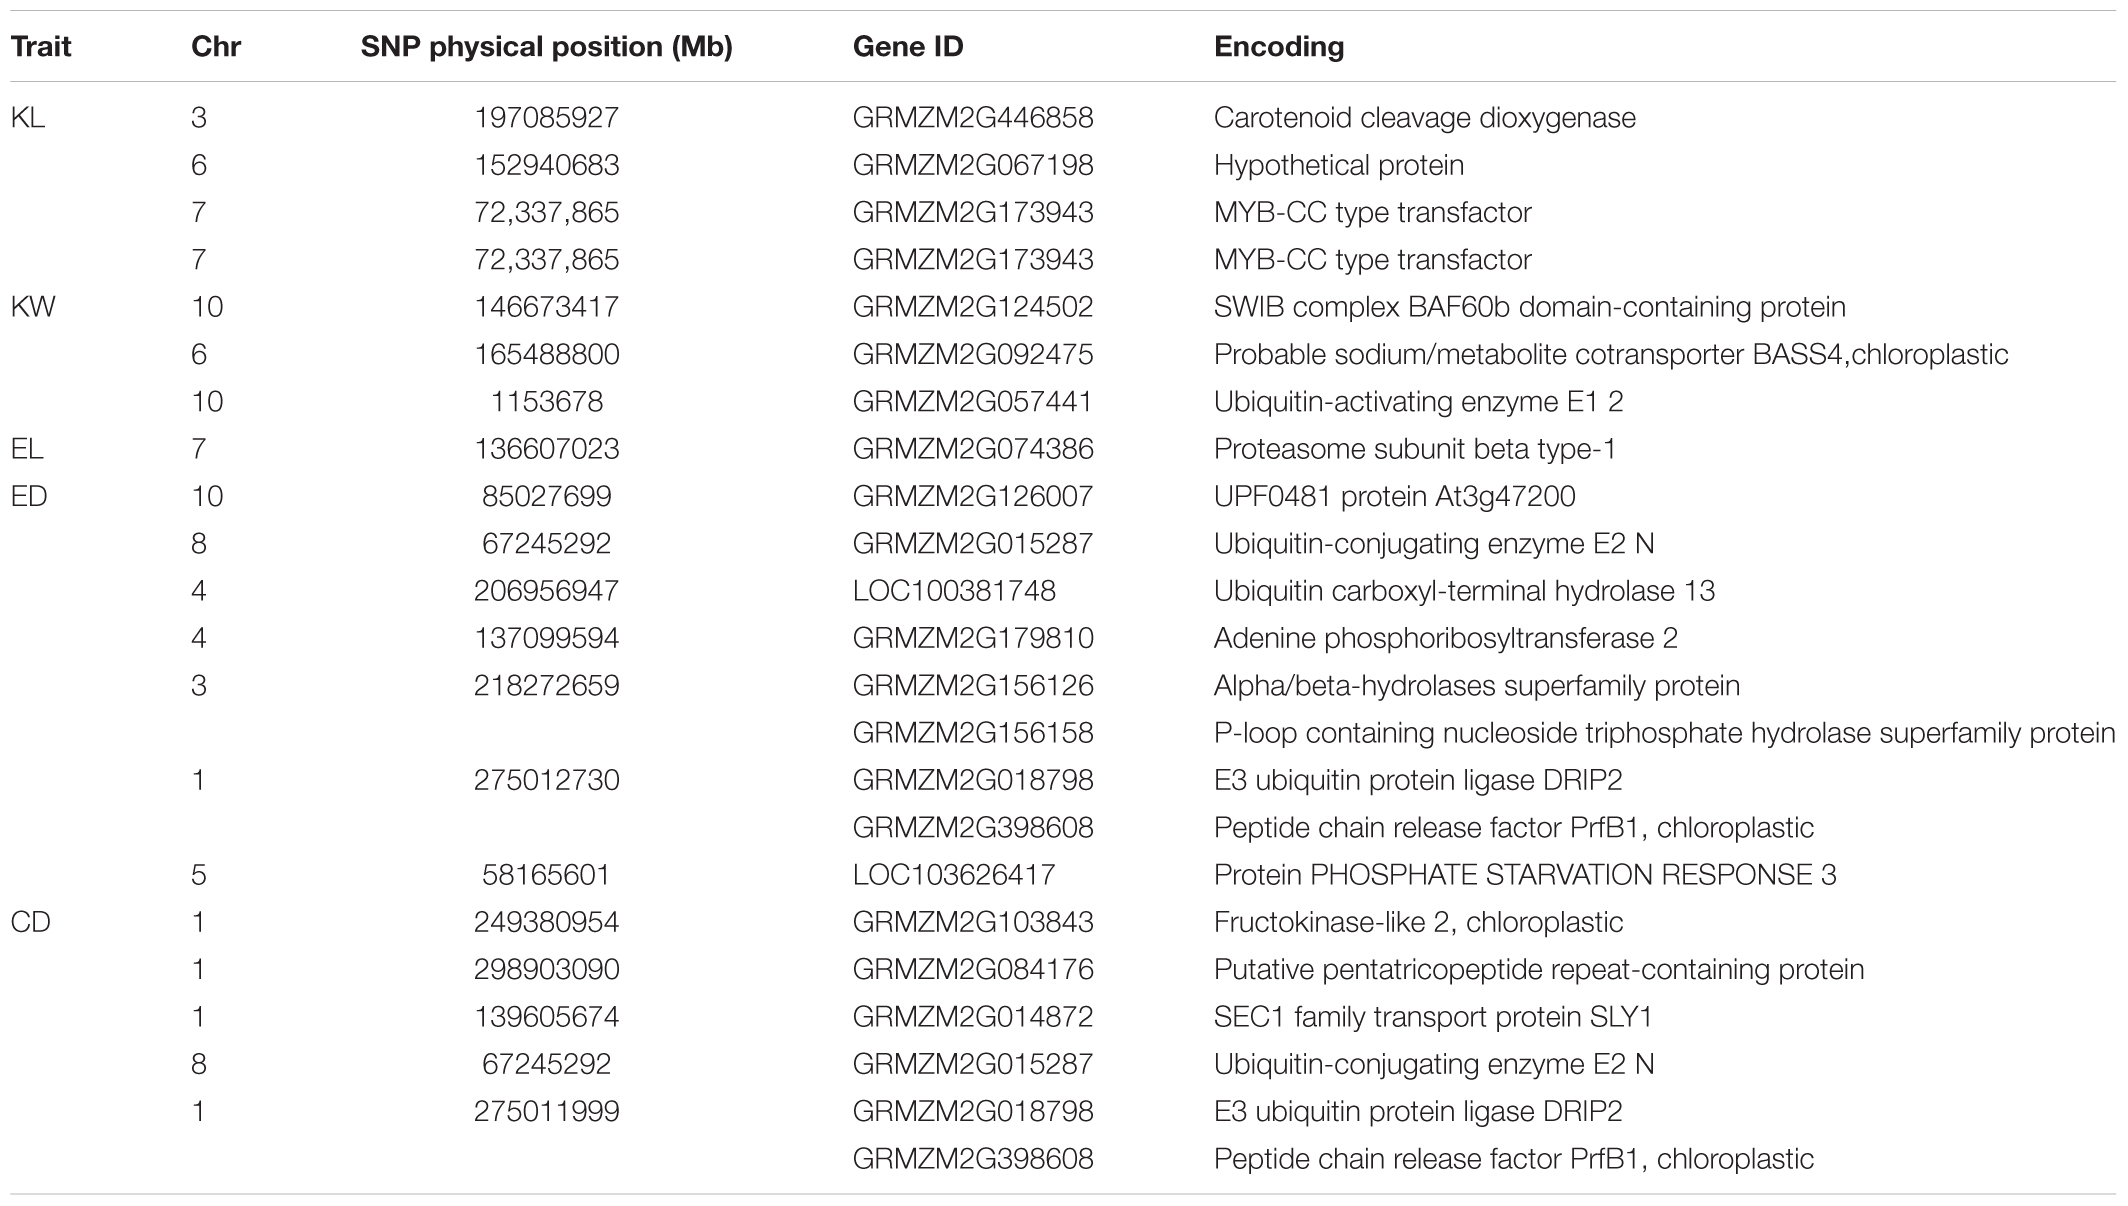
TABLE 4. Candidate genes for each significant SNP associated with traits and theirs encoding products.
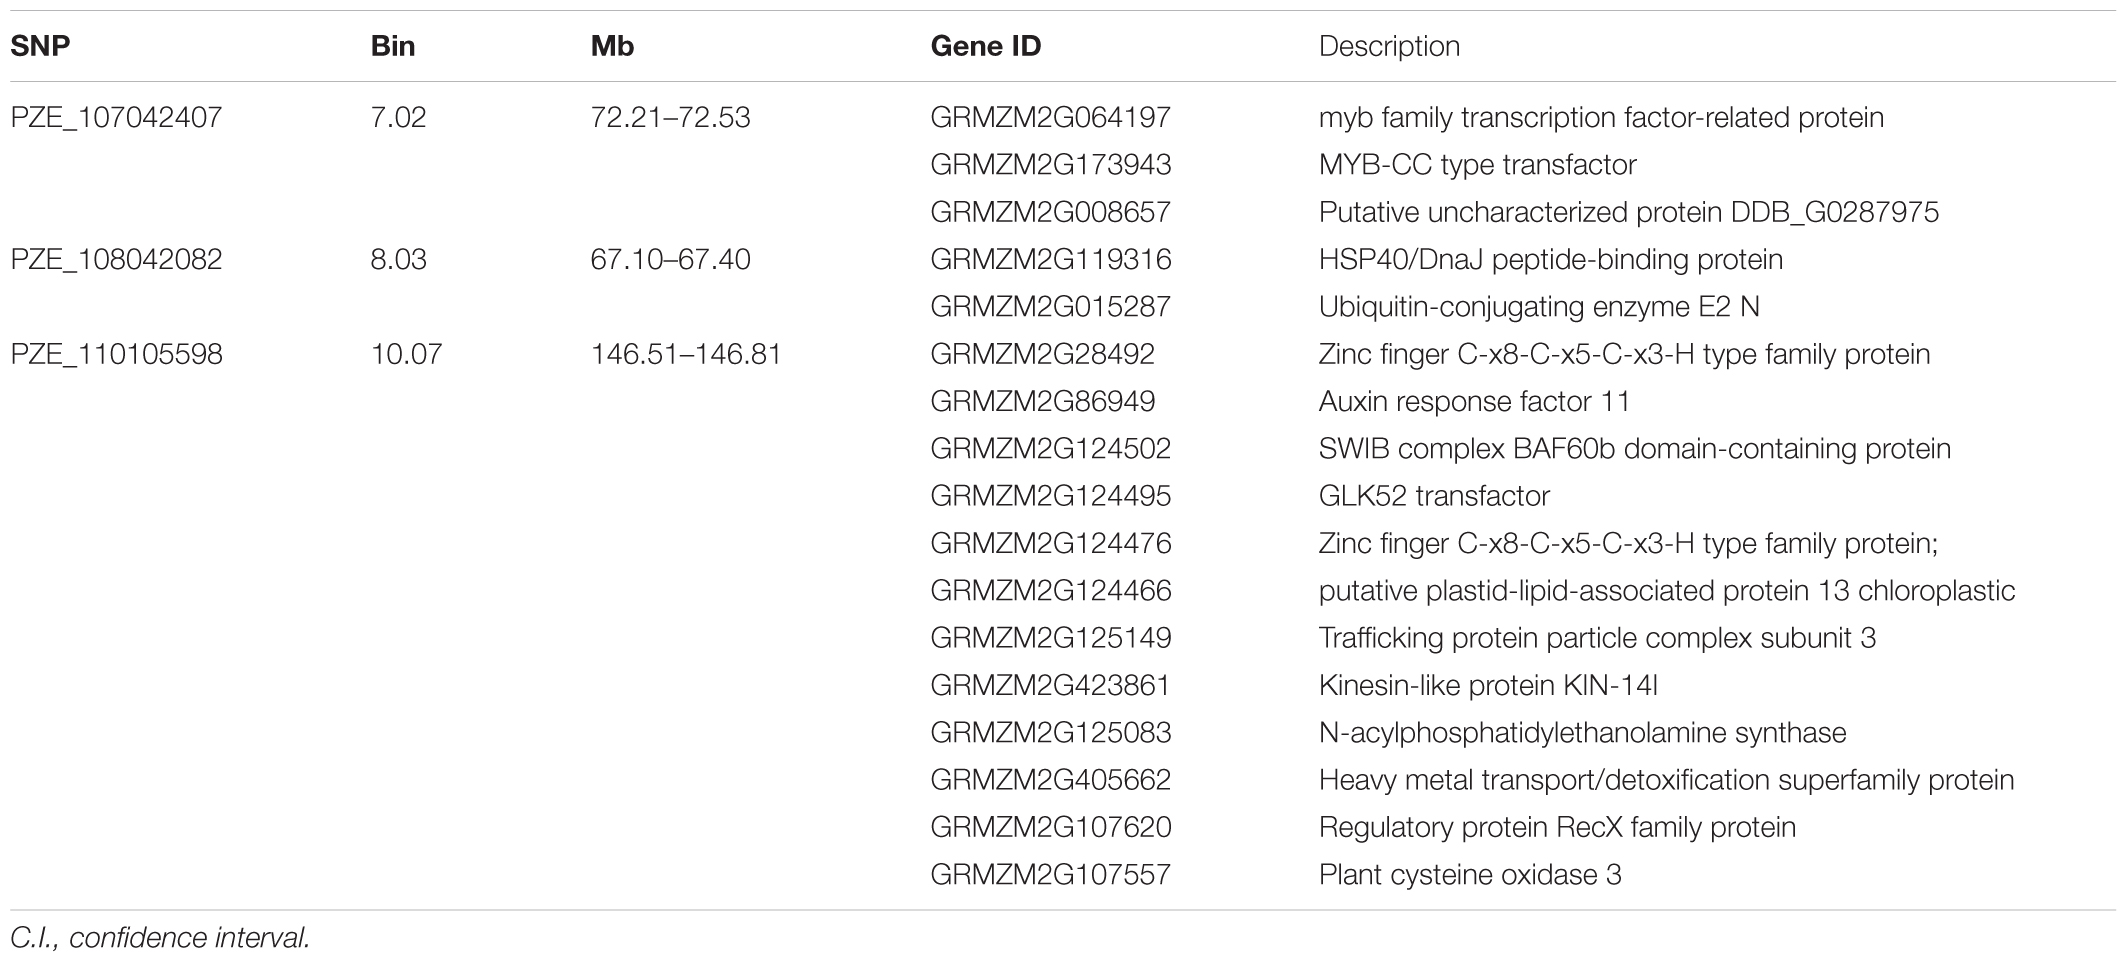
TABLE 5. Candidate genes scanned within a approximately 310 kb extended region for three significant SNPs.
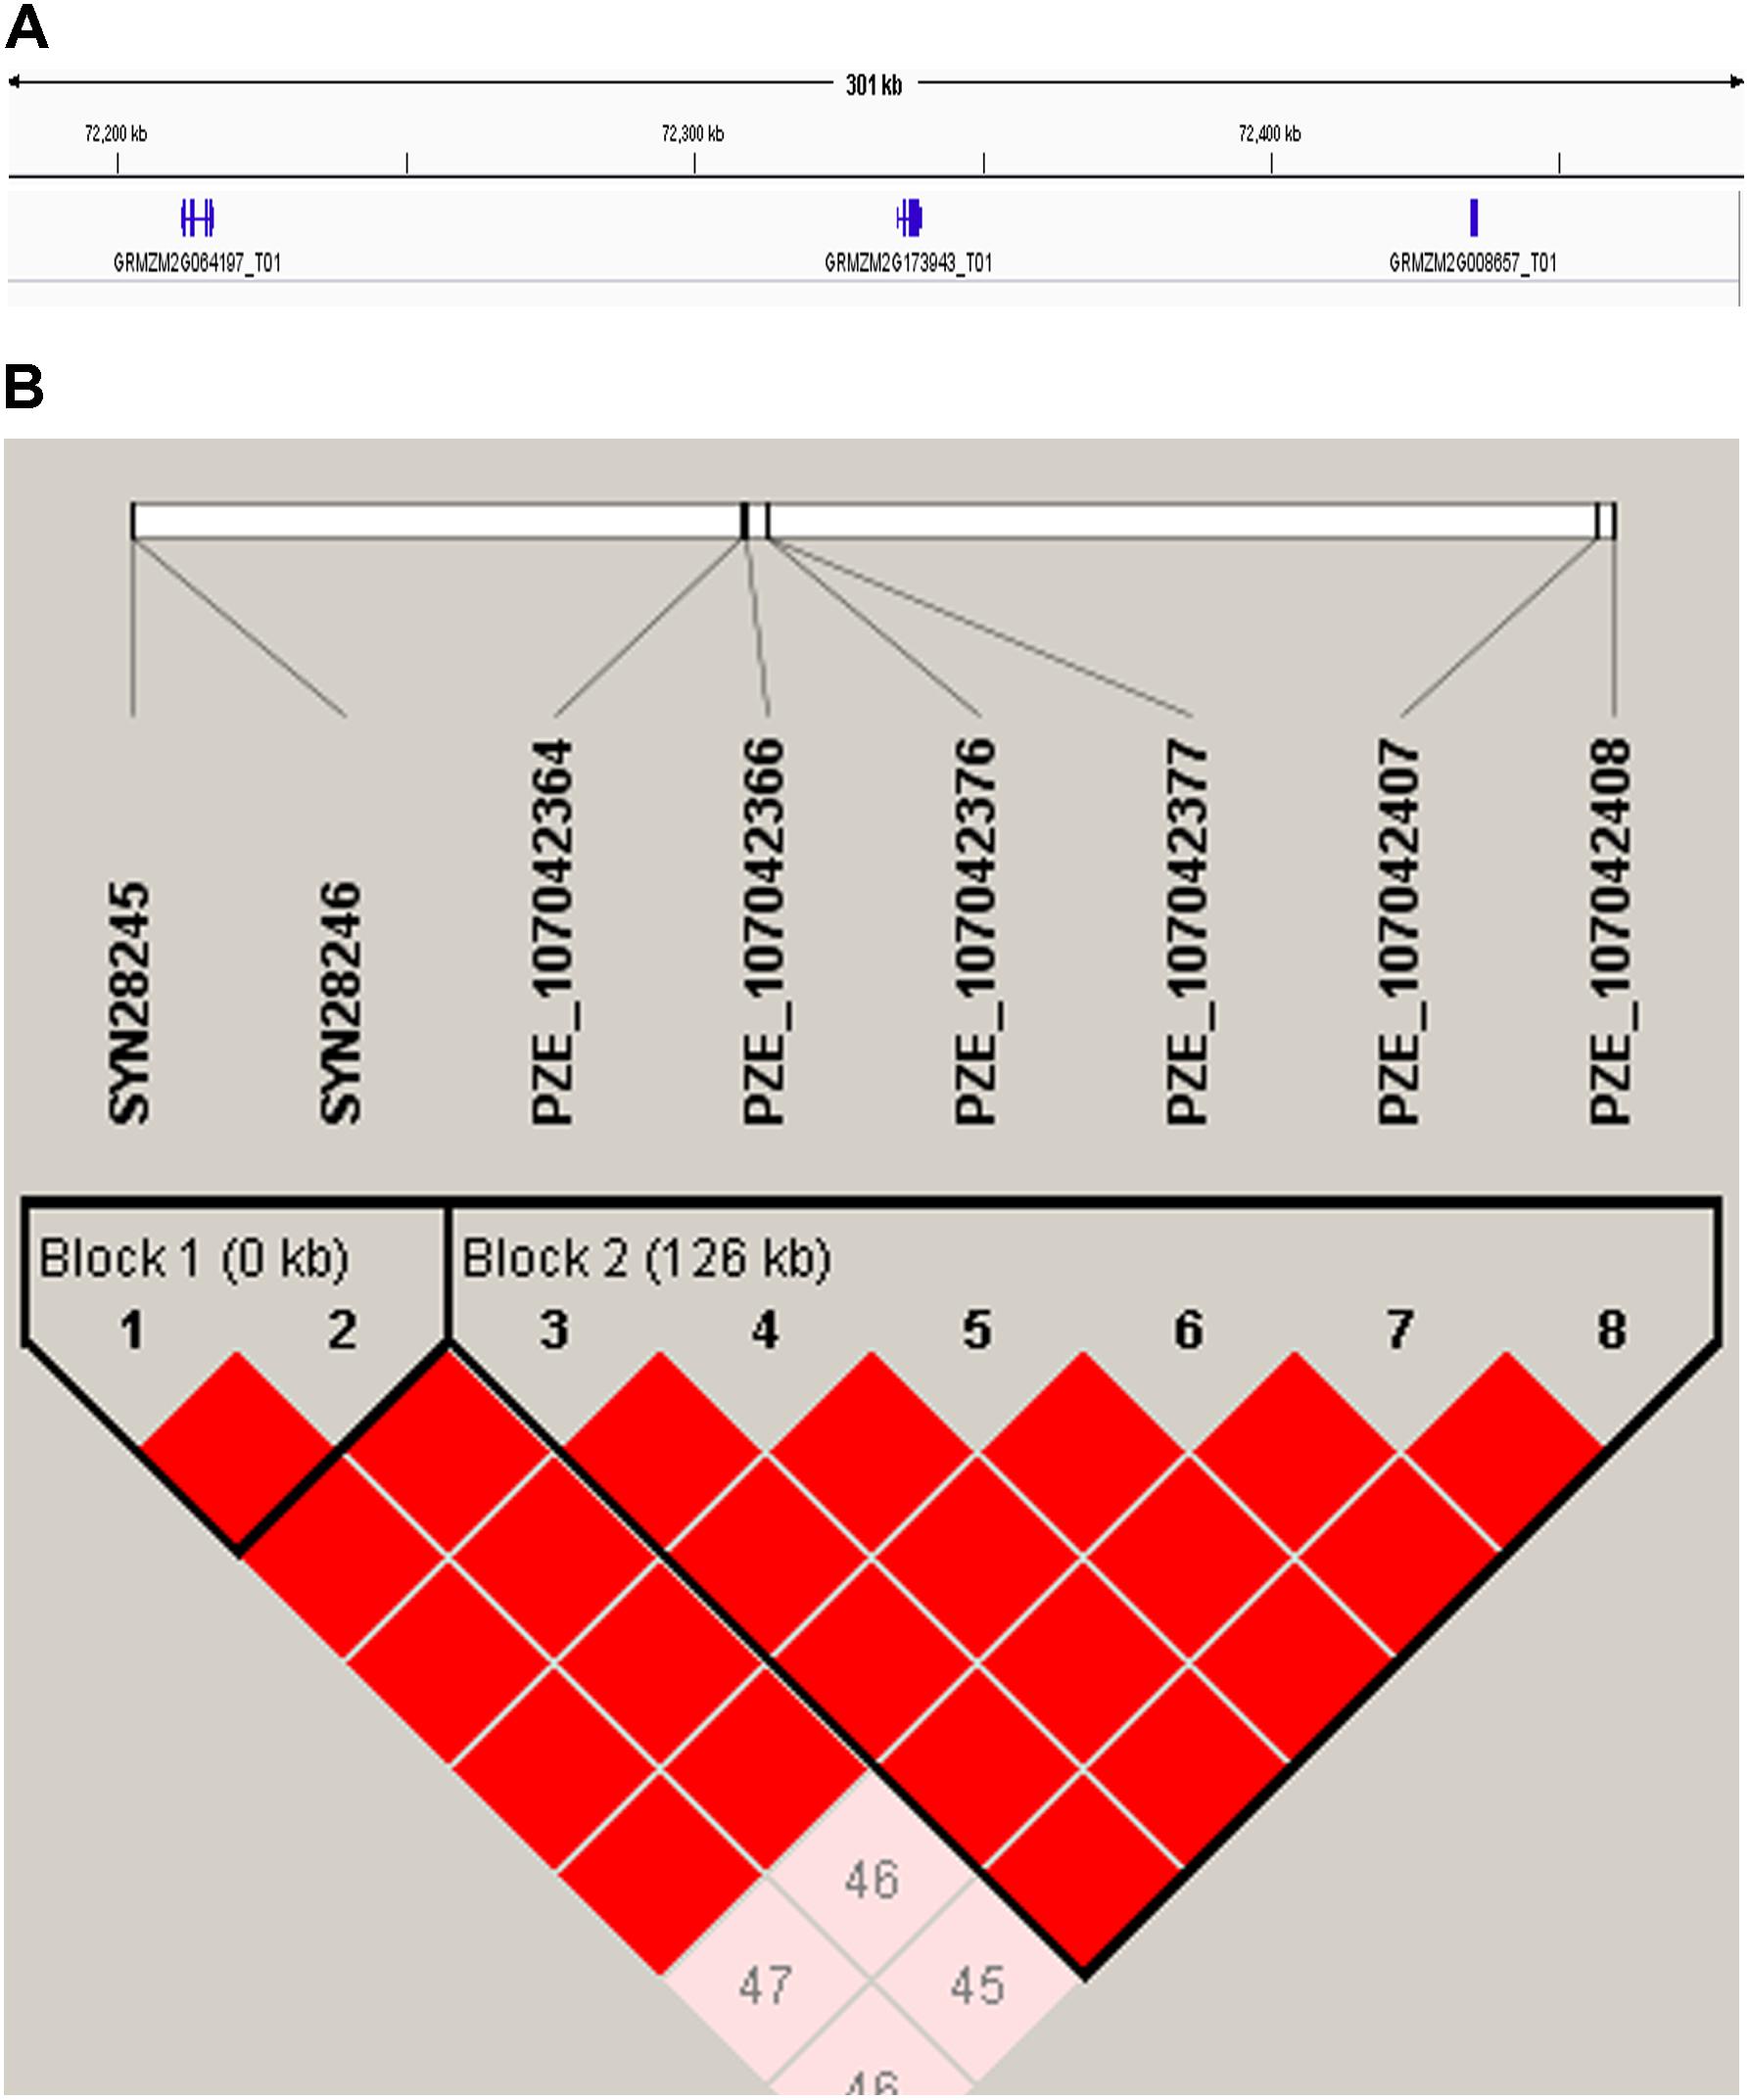
FIGURE 7. (A) 310-kb association region of gene GRMZM2G173943 on chromosome 7. (B) The linkage disequilibrium blocks of the major SNP (PZE_107042407) within 310-kb window.
Meta-QTL Analysis
Information of 293 QTLs related to the panicle traits (Table 6) were collected and used to construct the consistency map (Figure 8). In the meta-analysis, the model with the minimum AIC value was chosen as the optimal one, then 20 meta-QTLs were obtained according to the selection criteria of at least three initial QTLs existing within one location. These meta-QTLs are mainly distributed on chromosomes 1(4), 3 (3), 4 (3), and 9 (5), respectively, with confidence intervals ranging from 4.2 to 15.13 cM (Table 7). Then, these meta-QTLs and the SNPs associated with ear traits in this study was mapped according to the physical distance of SNP on both sides of MQTL tag, Results showed that five of the detected SNPs was located within the intervals of these meta-QTLs, such as locus PZE_101048890 in MQTL4 interval, PZE_103171163 in MQTL8, SYNGENTA6857 in MQTL12, and PZE_110067406 and PZE_110061773 were both in MQTL20 interval. These results further i verified the accuracy of the SNP loci related to ear traits in this study.
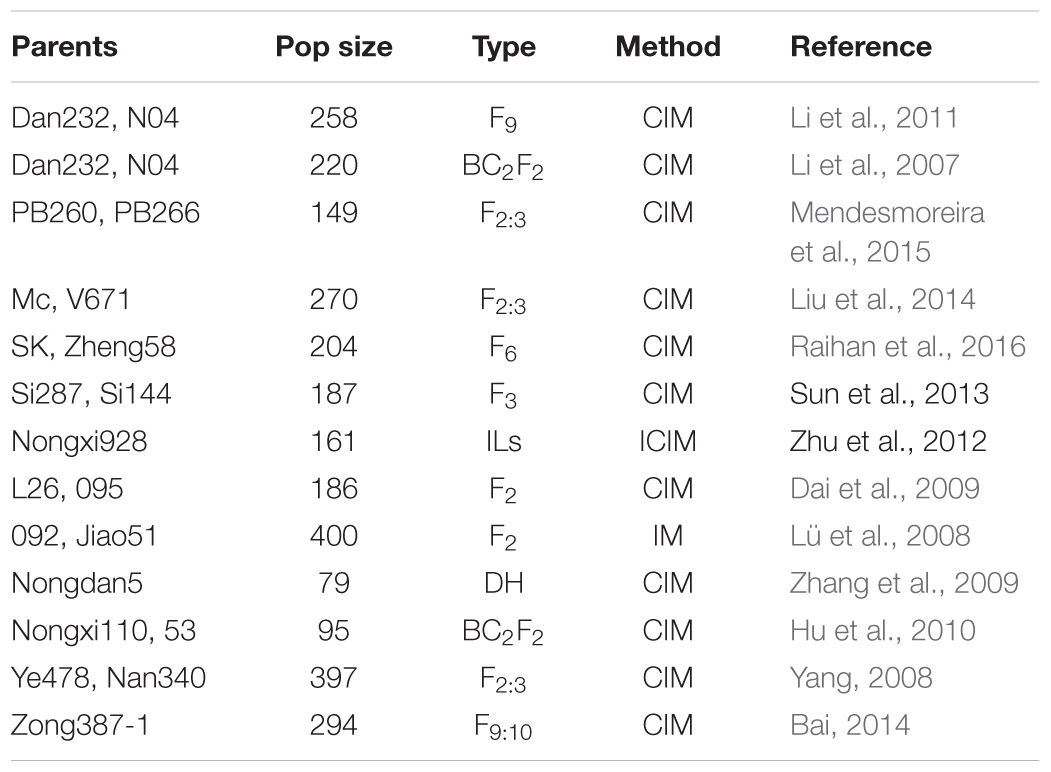
TABLE 6. Summary of the QTLs of ear traits in maize (2007–2016).
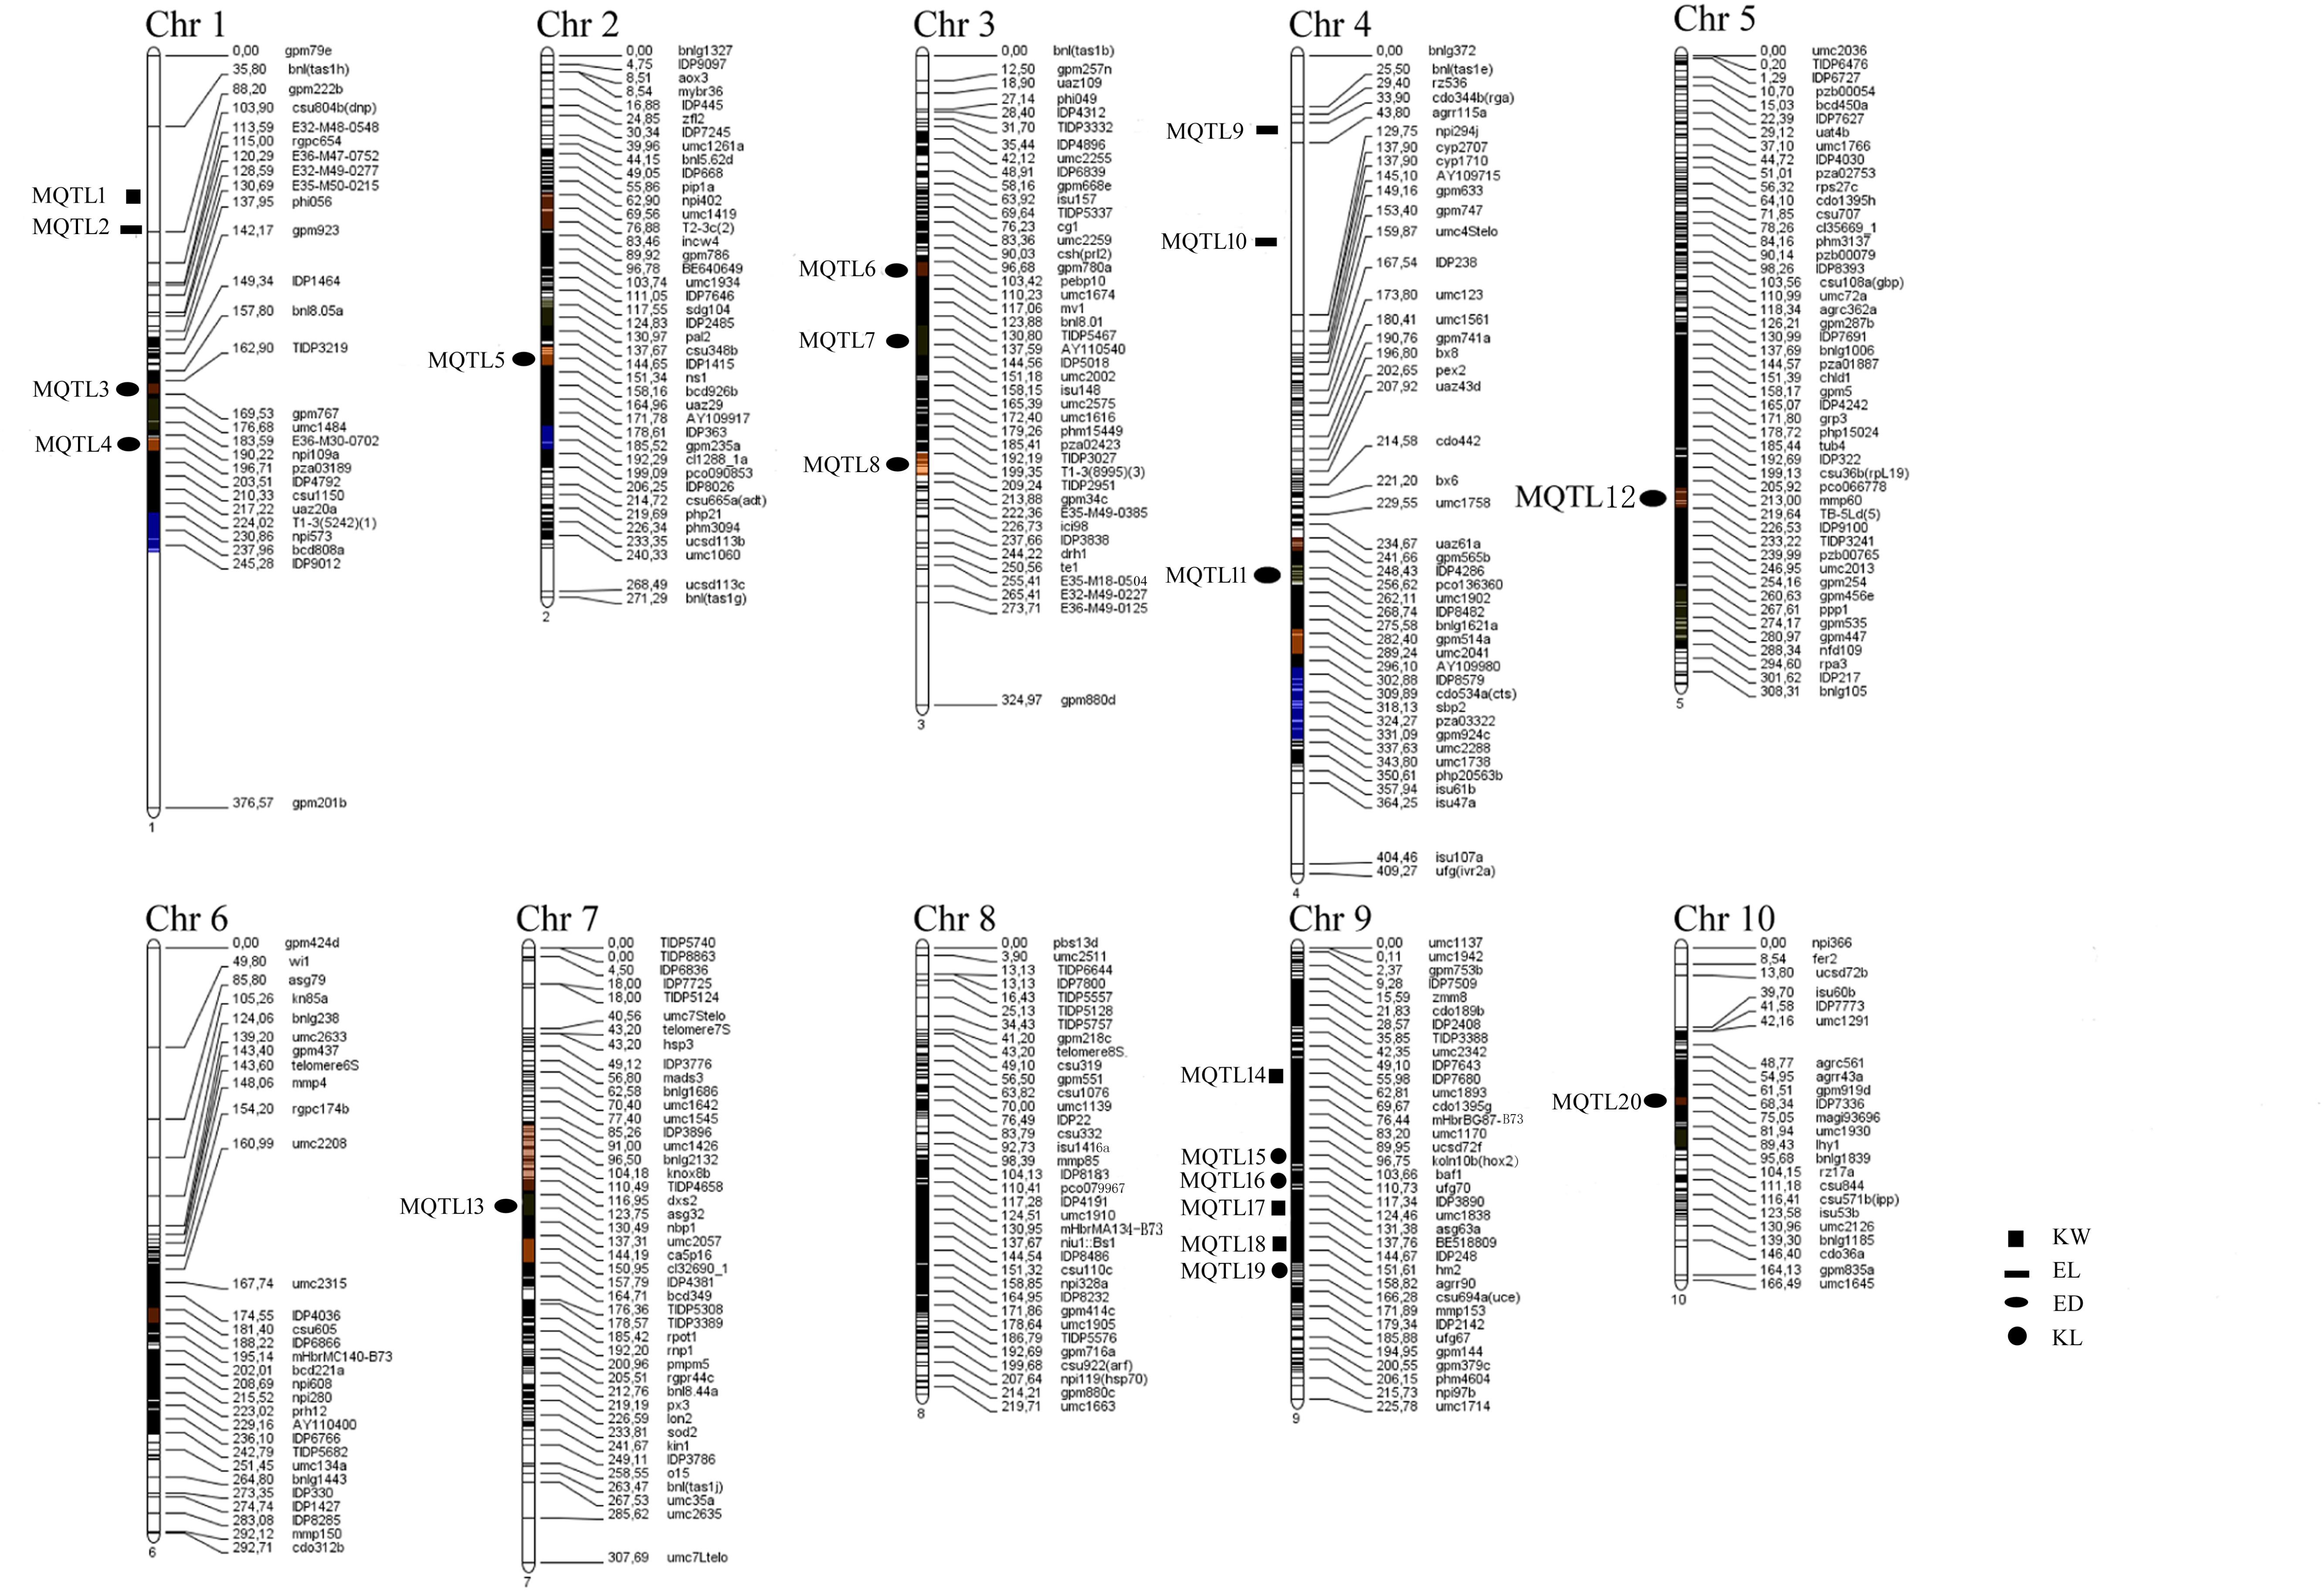
FIGURE 8. “Consensus” QTL map integrated for ear and kernel traits in maize.
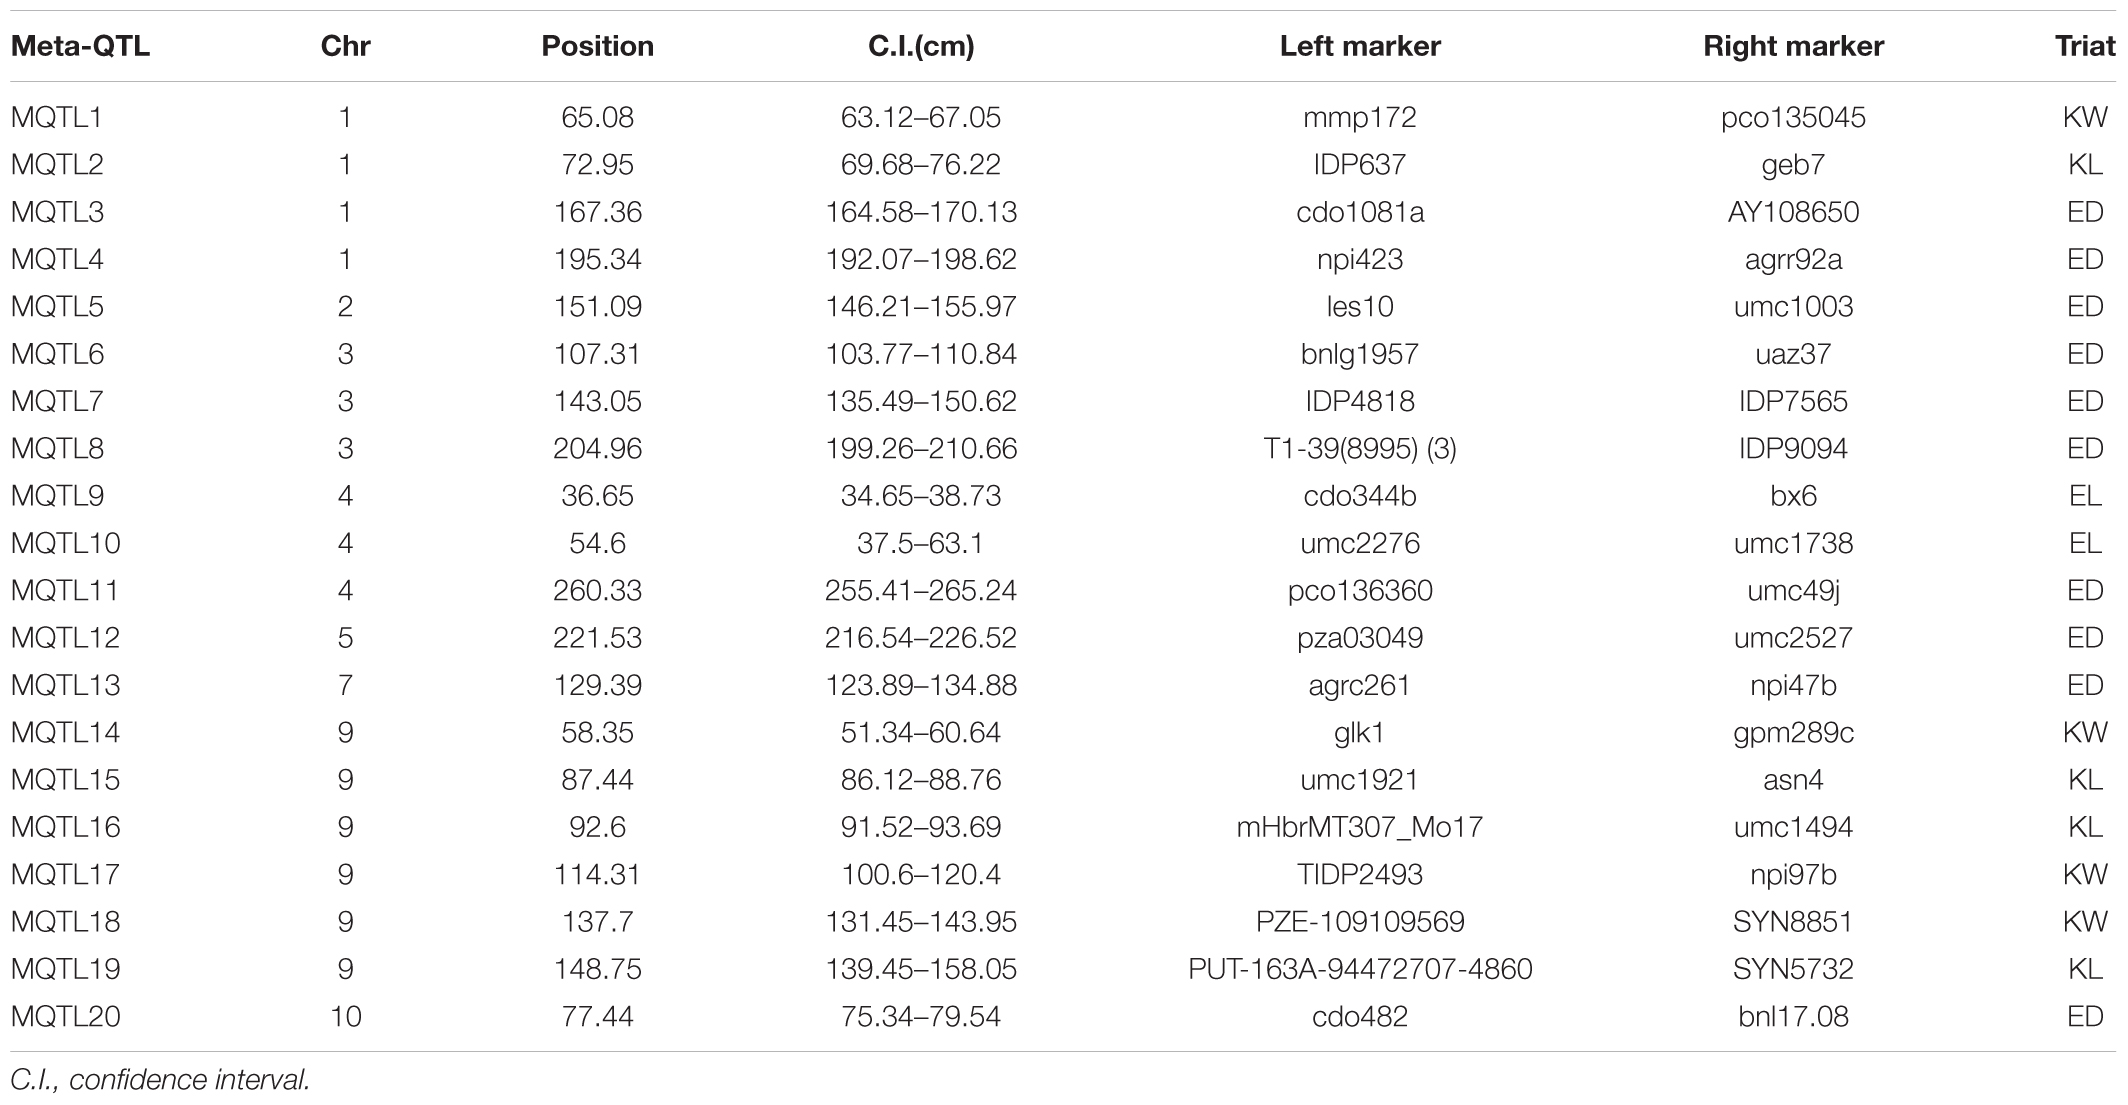
TABLE 7. Information of position of Meta-QTL by meta-analysis for ear and kernel traits in maize.
Discussion
Natural germplasm with a broad genetic base could be a potential resource for improving yield (Wang H. et al., 2016). Genetic diversity analysis of the germplasm available provides key information on heterosis exploitation and breeding strategies, especially in maize hybrid breeding. In the present study, a panel consisting of 292 inbred lines representing temperate germplasm from Huang-Huai-Hai region were separated into seven subgroups, Tangsipingtou, Lvdahonggu, PA, PB, PC, Lancaster and an integrated group based on NJ cluster analysis, which were consistent with the results of UPGMA tree analyzed with genetic distance by Rogers (1972). The integrated group mainly included the tropical lines from Mexico, and the other six were consistent with the subgroups of maize germplasm in China (Liu C.L. et al., 2015). In addition, because LD patterns of population structure are crucial for association mapping and selection of candidate genes (Liu et al., 2014), LD of the 292 inbred lines was also analyzed, with the average LD decay distance of about 310 kb, which was similar to the 391 kb of 367 inbred lines in Wu et al. (2014), but lower than the 643 bp in 240 temperate inbred lines (Liu et al., 2014) and the 0.50–0.75 Mb in 362 Southwest lines of China (Zhang et al., 2016). The lower LD of the materials in this study was due to that most of the 292 inbred lines were temperate germplasm, while it was still lower than that of other temperate population suggested that the these materials have some excellent genes related to plant resistance (Lu et al., 2011).
Usually, a lot of QTLs for a certain trait have been detected with different populations in different environments, and most of them are not consistence with each other. In previous studies, Yang et al. (2016) detected six QTLs for KL and KW, with a minimum physical distance of 0.72 Mb between chr. 2-11541 and chr. 2-12258 on chromosome 2. Liu et al. (2014) detected 83 QTLs for KL and KW with a minimum physical interval of 1.37 Mb and average of 17.30 Mb between umc1165 and umc1265 on chromosome 2. Li et al. (2013) detected three QTLs for KL at bin 1.07, 4.08, and 9.03, respectively, and seven QTLs for KW at bin 1.04, 1.11, 2.07, 3.07, 4.03, 4.05, and 10.07, respectively. Previous reports also showed that bin 4.05 and bin 10.03 were important genomic regions for controlling maize yield-related traits, such as KL or kernel number per row (KNPR), KW and 10-kernel thickness (KT) (Peng et al., 2011). In this study, we used an interactive usage model, FarmCPU instead of MLM or CMLM, in GWAS, which could exclude the false positive associations exactly. And the Q–Q plots also suggested that the false positive associations in this study were well controlled for the GWAS of the five traits across different environments. Then, we filtrated 20 unique loci (SNPs) at P < 3.95E-05 level among 97 SNPs that were associated with five ear-related traits. The twenty consistent SNPs about ear and kernel traits were found at the same chromosome intervals by integrating the previously reported QTLs information, among which four SNPs for KL were located at bin 3.07, 6.04, and 7.02 (2), three for KW at bin 6.07, 10.00, and 10.07, one for EL at bin 7.03, seven for ED at bin 1.10, 3.09, 4.05, 5.03, 8.03 (2), and 10.03, and five for CD at bin 1.05, 1.08, 1.10, 1.12, and 8.03, respectively. Especially, the SNP for KL at bin 7.02 was common in two environments. Besides, another SNP at bin 8.03 (PZE_108042082) was detected both for ED and CD, indicating that ED and CD may have same genetic basis, which was supported by the significant correlations of the two traits in our research materials. Therefore, our results would provide important information for further fine mapping yield-related genes, thus to reveal corresponding molecular mechanisms.
In addition, four functional genes detected are related to ubiquitin (Ub), which is widely existing in eukaryotes and highly conservative. The most important gene, GRMZM2G015287, encoded ubiquitin-conjugating enzyme E2N, and the other three separately encoded ubiquitin-activating enzyme E1 2, ubiquitin carboxyl-terminal hydrolase 13, and E3 ubiquitin protein ligase DRIP2. Ubiquitination pathway is an important regulatory process in plant biological activities including growth and development, response to biological and abiotic stress signals, etc. The covalent attachment of Ub to target proteins involves a three kinds of enzymes (ubiquitin-activating enzyme E1, ubiquitin-conjugating enzyme E2 and ubiquitin ligase E3) and a series of reactions via the transfer of thioester linkage between these enzymes (Ramadan et al., 2015). Previous studies have found that E3 is an important specific identification factor in regulating seed size during the process of ubiquitination (Hershko and Ciechanover, 1998). The gene GW2 in rice could decrease cell division, associated with grain width, grain weight and growth period, codes a RING-type protein with E3 ubiquitin ligase activity that locating in the cytoplasm and degradating zymolytes by anchoring them into proteasomes and ultimately decreasing cell division.
The candidate genes mined in this study suggested that development of grain was related to ubiquitination pathway, then grain and related traits affect the maize yield. Jiang et al. (2015) found genes of ZmGS3-CHR1-1, ZmGS3-CHR1-2, ZmGS3-CHR2, ZmGS3-CHR7, ZmGS3-CHR4, and ZmGS3-CHR5 that homologous with ring E3 ubiquitin-protein ligase gene GS3 and GS2 in rice by integrating meta-QTLs of ear row number and grain weight reported in major journals over 1994–2012. The gene GW2 in rice could decrease cell division, and loss of GW2 function would result in a larger and wider spikelet hull, which accelerated grain milk filling rate and enhanced grain width, weight and yield (Song et al., 2007; Yan S. et al., 2011). WY3, alleles of GW2, can significantly increase grain width and 1000-grain weight, resulting in the output raise of single plant. D3, a gene that encoding ubiquitin E3, was associated with ear number and plant height (Ishikawa et al., 2005) and encoded an F-box leucine-rich repeat (LRR) protein which can inhibit the activity of rice tiller buds, maintain their dormancy and participate in the dark-induced leaf senescence process and hydrogen-induced leaf cell death process (Yan H.F. et al., 2007; Falcon de Longevialle et al., 2008). So, four functional genes detected are related to ubiquitin, which is widely existing in eukaryotes and highly conservative.
Except that, two novel genes PRFB1 (GRMZM2G398608) encoding peptide chain release factor PrfB1 in chloroplast (AtPrfB1) and GRMZM2G103843 encoding fructokinase-2 were found. PRFB1 responses to the peptide chain termination codon UGA, which is necessary for the proper translation and stability of UGA-containing polycistronic transcripts in chloroplasts. So AtPrfB1 participates in the biological processes of plastid organization (Meurer et al., 1996), RNA processing and translational termination (Meurer et al., 2002). Fructokinase-2 encoded by gene FRK1 in maize, may play an important role in fructose metabolic process, thus maintaining the flux of carbon toward starch formation during seed development (Zhang et al., 2003; Riggs et al., 2017).
Conclusion
Genetic diversity and GWAS of maize ear traits were performed in a panel of 292 inbred lines. And 20 significant SNPs associated with kernel size and grain yield were detected using FarmCPU software. Among them, a candidate genes on chromosome 1 was related to ubiquitin, and two novel candidate genes, (GRMZM2G398608 and GRMZM2G103843) related with ED and CD, were also explored in the study. Bioinformatics analysis showed that gene PRFB1 (GRMZM2G398608) encode peptide chain release factor PrfB1 in chloroplast (AtPrfB1) and GRMZM2G103843 encoded fructokinase-2. Besides, a MYB-CC type transfactor and a gene encoding phosphate starvation response protein 3 were found to be associated with KL and ED, respectively. These results would be helpful for understanding the relationship between yield and the ear-traits in maize.
Author Contributions
X-YSo and M-AZ conceived and designed the study. M-AZ, X-MZ, X-YSh, Y-HP, X-MG, and JL performed the experiments, phenotyped the populations and field work. X-MZ and X-YSh contributed to genotype and phenotype data analysis. X-YSh conducted the meta-analysis. X-MZ drafted the manuscript. All authors read and approved the final manuscript.
Funding
This research was funded by the National Natural Science Foundation of China (31371636), “The Innovation Team in Maize” Modern Agricultural System of Shandong Province, China (SDAIT-01-022-01), Key R&D Project of Shandong Province, China (2016GNC110018), and Applied Basic Research Project of Qingdao, China (14-2-4-13-jch).
Conflict of Interest Statement
The authors declare that the research was conducted in the absence of any commercial or financial relationships that could be construed as a potential conflict of interest.
Supplementary Material
The Supplementary Material for this article can be found online at: https://www.frontiersin.org/articles/10.3389/fpls.2018.00966/full#supplementary-material
FIGURE S1 | Manhattan plots and Quantile–Quantile (Q–Q) plots of (A) kernel length, (B) kernel width, (C) ear length, (D) ear diameter, (E) cob diameter in Qingzhou, 2015.
FIGURE S2 | Manhattan plots and Quantile–Quantile (Q–Q) plots of (A) kernel length, (B) kernel width, (C) ear diameter, (D) cob diameter in Jiaozhou, 2016.
FIGURE S3 | Manhattan plots and Quantile–Quantile (Q–Q) plots of (A) kernel length, (B) kernel width, (C) ear diameter, (D) cob diameter in Qingzhou, 2016.
TABLE S1 | Phenotypic correlation coefficient estimates for each trait in Jiaozhou, 2016 (above diagonal) and Qingzhou, 2016 (below diagonal).
TABLE S2 | List of 292 maize inbred lines.
TABLE S3 | Complete imformation about SNPs and candidate genes using FarmCPU for GWAS.
Footnotes
- ^ https://brcwebportal.cos.ncsu.edu/powermarker/
- ^ http://www.maizegenetics.net/tassel
- ^ http://pritch.bsd.uchicago.edu/structure.html
- ^ http://www.maizegdb.org/
- ^ http://www.ncbi.nlm.nih.gov/gene
- ^ http://software.broadinstitute.org/software/igv/
- ^ http://www.broadinstitute.org/haploview
- ^ http://www.cnki.net/
References
Bai, H. G. (2014). Methods of Kernel Traits Measurement and QTL Mapping and Analysis of Association. Master’s thesis, Xinjiang Agricultural University, Urumchi.
Bai, X., Zhao, H., Huang, Y., Xie, W., Han, Z., Zhang, B., et al. (2016). Genome-wide association analysis reveals different genetic control in panicle architecture between indica and japonica rice. Plant Genome 9, 1–10. doi: 10.3835/plantgenome2015.11.0115
Bommert, P., Nagasawa, N. S., and Jackson, D. (2013). Quantitative variation in maize kernel row number is controlled by the FASCIATED EAR2 locus. Nat. Genet. 45, 334–337. doi: 10.1038/ng.2534
Bournier, M., Tissot, N., Mari, S., Boucherez, J., Lacombe, E., Briat, J. F., et al. (2013). Arabidopsis ferritin 1 (AtFer1) gene regulation by the phosphate starvation response 1 (AtPHR1) transcription factor reveals a direct molecular link between iron and phosphate homeostasis. J. Biol. Chem. 288, 22670–22680. doi: 10.1074/jbc.M113.482281
Bradbury, P. J., Zhang, Z., Kroon, D. E., Casstevens, T. M., Ramdoss, Y., and Buckler, E. S. (2007). TASSEL: software for association mapping of complex traits in diverse samples. Bioinformatics 23, 2633–2635. doi: 10.1093/bioinformatics/btm308
Chen, D. H., and Ronald, P. (1999). A rapid DNA minipreparation method suitable for AFLP and other PCR applications. Plant Mol. Biol. Rep. 17, 53–57. doi: 10.1023/A:1007585532036
Chen, G. F., Chen, J. S., and Tian, J. C. (2015). Genome-Wide association analysis between SNP markers and plant height related traits in wheat. Mol. Plant Breed. 41, 1500–1509. doi: 10.3724/SP.J.1006.2015.01500
Cui, Z. H., Luo, J. H., Qi, C. Y., Ruan, Y. Y., Li, J., Zhang, A., et al. (2016). Genome-wide association study (GWAS) reveals the genetic architecture of four husk traits in maize. BMC Genomics 17:946. doi: 10.1186/s12864-016-3229-6
Dai, G. L., Cai, Y. L., Xu, D. L., Lv, X. G., Wang, G. Q., Wang, J. G., et al. (2009). QTL mapping for ear traits in maize (Zea mays, L.). J. Southwest China Norm. Univ. Nat. Sci. Ed. 34, 133–138. doi: 10.13718/j.cnki.xsxb.2009.05.030
Duvick, D. N. (2005). Genetic progress in yield of United States Maize (Zea mays L.). Maydica 50, 193–202.
Evanno, G., Regnaut, S., and Goudet, J. (2005). Detecting the number of clusters of individuals using the software STRUCTURE: a simulation study. Mol. Ecol. 14, 2611–2620. doi: 10.1111/j.1365-294X.2005.02553.x
Falcon de Longevialle, A., Hendrickson, L., Taylor, N., Delannoy, E., Lurin, C., Badger, M., et al. (2008). The pentatricopeptide repeat gene OTP51 with two LAGLIDADG motifs is required for the cis-splicing of plastid ycf3 intron 2 in Arabidopsis thaliana. Plant J. 56, 157–168. doi: 10.1111/j.1365-313X.2008.03581.x
Goffinet, B., and Gerber, S. (2000). Quantitative trait loci: a meta-analysis. Genetics 155, 463–473.
Hershko, A., and Ciechanover, A. (1998). The ubiquitin system. Annu. Rev. Biochem. 67, 425–479. doi: 10.1146/annurev.biochem.67.1.425
Hu, L.-z., Liu, J.-g., and Guo, J.-j. (2010). QTL analysis of ear traits based on BC2F2 population in maize (Zea may L.). Acta Agric. Bar. Sin. 25, 73–77. doi: 10.7668/hbnxb.2010.04.016
Ishikawa, S., Maekawa, M., Arite, T., Onishi, K., Takamure, I., and Kyozuka, J. (2005). Suppression of tiller bud activity in tillering dwarf mutants of rice. Plant Cell Physiol. 46, 79–86. doi: 10.1093/pcp/pci022
Jiang, L., Ge, M., Zhao, H., and Zhang, T. (2015). Analysis of heterosis and quantitative trait loci for kernel shape related traits using triple testcross population in maize. PLoS One 10:e0124779. doi: 10.1371/journal.pone.0124779
Kong, M. L., Li, C. Y., Sun, Q. P., Lu, M., Wang, W. X., Pan, J. B., et al. (2014). Isolation and expression analysis of the E3 ubiquitin ligase encoding gene ZmGW2-1 in maize. J. Anhui Agric. Univ. 41, 1004–1011. doi: 10.13610/j.cnki.1672-352x.20141029.009
Li, C. H., Li, Y. X., Sun, B. C., Peng, B., Liu, C., Liu, Z. Z., et al. (2013). Quantitative trait loci mapping for yield components and kernel-related traits in multiple connected RIL populations in maize. Euphytica 193, 303–316. doi: 10.1007/s10681-013-0901-7
Li, C. Y., Kong, M. L., Sun, Q. P., Lu, M., Wang, W. X., Pan, J. B., et al. (2014). Cloning of homologous gene ZmGS5 in maize based on OsGS5. J. Beijing Univ. Agric. 29, 14–17.
Li, H., Peng, Z. Y., Yang, X. H., Wang, W. D., Fu, J. J., Wang, J. H., et al. (2012). Genome-wide association study dissects the genetic architecture of oil biosynthesis in maize kernels. Nat. Genet. 45, 43–50. doi: 10.1038/ng.2484
Li, K., Wang, H., Hu, X., Liu, Z., Wu, Y., and Huang, C. (2016). Genome-wide association study reveals the genetic basis of stalk cell wall components in maize. PLoS One 11:e0158906. doi: 10.1371/journal.pone.0158906
Li, X., Zhou, Z., Ding, J., Wu, Y., Zhou, B., Wang, R., et al. (2016). Combined linkage and association mapping reveals QTL and candidate genes for plant and ear height in maize. Front. Plant Sci. 7:833. doi: 10.3389/fpls.2016.00833
Li, Y. X., Wang, Y., Shi, Y. S., Song, Y. C., Wang, T. Y., and Li, Y. (2009). Correlation analysis and QTL mapping for traits of kernel structure and yield components in maize. Sci. Agric. Sin. 42, 408–418.
Li, Y. Y. (2007). The Genes Functional Compare Analysis between the OSPHR2 and ATPHRI. Master’s thesis, Zhejiang University, Hangzhou.
Lipka, A. E., Tian, F., Wang, Q. S., Peiffer, J., Li, M., and Bradbury, P. J. (2012). GAPIT: genome association and prediction integrated tool. Bioinformatics 28, 2397–2399. doi: 10.1093/bioinformatics/bts444
Li, J. Z., Zhang, Z. W., Li, Y. L., Wang, Q. L., and Zhou, Y. G. (2011). QTL consistency and meta-analysis for grain yield components in three generations in maize. Theor. Appl. Genet. 122, 771–782. doi: 10.1007/s00122-010-1485-4
Li, Y. L., Niu, S. Z., Dong, Y. B., Cui, D. Q., Wang, Y. Z., Liu, Y. Y., et al. (2007). Identification of trait-improving quantitative trait loci for grain yield components from a dent corn inbred line in an advanced backcross BC2F2 population and comparison with its F2:3 population in popcorn. Theor. Appl. Genet. 115, 129–140. doi: 10.1007/s00122-007-0549-6
Liu, C. L., Hao, Z. F., Zhang, D. G., Xie, C. X., Li, M. S., Zhao, X. C., et al. (2015). Genetic properties of 240 maize inbred lines and identity-by-descent segments revealed by high-density DNP markers. Mol. Breed. 35, 146–157. doi: 10.1007/s11032-015-0344-z
Liu, K., and Muse, S. V. (2005). PowerMaker: an integrated analysis environment for genetic maker analysis. Bioinformatics 21, 2128–2129. doi: 10.1093/bioinformatics/bti282
Liu, L., Du, Y. F., Shen, X. M., Li, M. L., Sun, W., Huang, J., et al. (2015). KRN4 controls quantitative variation in maize kernel row number. PLoS Genet. 11:e1005670. doi: 10.1371/journal.pgen.1005670
Liu, N., Xue, Y. D., Guo, Z. Y., Li, W. H., and Tang, J. H. (2016). Genome-wide association study identifies candidate genes for starch content regulation in maize kernels. Front. Plant Sci. 7:1046. doi: 10.3389/fpls.2016.01046
Liu, X. H., He, S. L., Zheng, Z. P., Huang, Y. B., Tan, Z. B., and Wu, X. (2010). QTL identification for row number per ear and grain number per row in maize. Maydica 55, 127–133.
Liu, X. L. (2015). Development of an Iterative Usage of Fixed Effect and Random Effect Models for Powerful and Efficient Genome-Wide Association Studies. Master’s thesis, Huazhong agricultural University, Wuhan.
Liu, Y. (2013). QTL Mapping and Genetic Analysis of Kernel Size and Yield Components in Maize. Master’s thesis, Huazhong Agricultural University, Wuhan.
Liu, Y., Wang, L., Sun, C., Zhang, Z., Zheng, Y., and Qiu, F. (2014). Genetic analysis and major QTL detection for maize kernel size and weight in multi-environments. Theor. Appl. Genet. 127, 1019–1037. doi: 10.1007/s00122-014-2276-0
Lü, X.-g., Cai, Y.-l., Chen, T.-q., Xu, D.-l., Wang, W.-l., Liu, Z.-z., et al. (2008). QTL mapping for ear traits in maize (Zea mays L.). J. Southwest China Norm. Univ. (Nat. Sci. Edn.) 34, 133–138. doi: 10.13718/j.cnki.xdzk.2008.02.021
Lu, Y. L., Shah, T., Hao, Z. F., Taba, S., Zhang, S. H., Gao, S. B., et al. (2011). Comparative SNP and haplotype analysis reveals a higher genetic diversity and rapider LD decay in tropical than temperate germplasm in maize. PLoS One 6:e24861. doi: 10.1371/journal.pone.0024861
Ma, X. S., Feng, F. J., Wei, H. B., Mei, H. W., Xu, K., Chen, S. J., et al. (2016). Genome-wide association study for plant height and grain yield in rice under contrasting moisture regimes. Front. Plant Sci. 7:1801. doi: 10.3389/fpls.2016.01801
Mammadov, J., Sun, X., Gao, Y., Ochsenfeld, C., Bakker, E., Ren, R., et al. (2015). Combining powers of linkage and association mapping for precise dissection of QTL controlling resistance to gray leaf spot disease in maize (Zea mays L.). BMC Genomics 10:916. doi: 10.1186/s12864-015-2171-3
Mendesmoreira, P., Alves, M. L., Satovic, Z., Dos Santos, J. P., Santos, J. N., Souza, J. C., et al. (2015). Genetic architecture of ear fasciation in maize (Zea mays L.) under QTL scrutiny. PLoS One 10:e0124543. doi: 10.1371/journal.pone.0124543
Messmer, R., Fracheboud, Y., Banziger, M., Vargas, M., Stamp, P., and Ribaut, J. M. (2009). Drought stress and tropical maize: QTL-by-environment interactions and stability of QTLs across environments for yield components and secondary traits. Theor. Appl. Genet. 119, 913–930. doi: 10.1007/s00122-009-1099-x
Meurer, J., Berger, A., and Westhoff, P. (1996). A nuclear mutant of Arabidopsis with impaired stability on distinct transcripts of the plastid psbB, psbD/C, ndhH, and ndhC operons. Plant Cell 8, 1193–1207. doi: 10.1105/tpc.8.7.1193
Meurer, J., Lezhneva, L., Amann, K., Gödel, M., Bezhani, S., Sherameti, I., et al. (2002). A peptide chain release factor 2 affects the stability of UGA-containing transcripts in Arabidopsis chloroplasts. Plant Cell 14, 3255–3269. doi: 10.1105/tpc.006809
Moseley, J. L., Chang, C. W., and Grossman, A. R. (2006). Genome-based approaches to understanding phosphorus deprivation responses and PSR1 control in Chlamydomonas reinhardtii. Eukaryot. Cell 5, 26–44. doi: 10.1128/EC.5.1.26-44.2006
Okuda, K., Myouga, F., Motohashi, R., Shinozaki, K., and Shikanai, T. (2007). Conserved domain structure of pentatricopeptide repeat proteins involved in chloroplast RNA editing. Proc. Natl. Acad. Sci. U.S.A. 104, 8178–8183. doi: 10.1073/pnas.0700865104
Peng, B., Li, Y., Wang, Y., Liu, C., Liu, Z., Tan, W., et al. (2011). QTL analysis for yield components and kernel-related traits in maize across multi-environments. Theor. Appl. Genet. 122, 1305–1320. doi: 10.1007/s00122-011-1532-9
Pritchard, J. K., Stephens, M., and Donnelly, P. (2000). Inference of population structure using multilocus genotype data. Genetics 155, 945–959.
Qi, Z. M., Sun, Y. N., Wang, J. L., Zhang, D. W., Liu, C. Y., Hu, G. H., et al. (2011). Meta-Analysis of 100-seed weight QTLs in soybean. Agric. Sci. China 10, 327–334. doi: 10.1016/S1671-2927(11)60011-4
Qin, W. W., Li, Y. X., Li, C. H., Chen, L., Wu, X., Bai, N., et al. (2015). QTL mapping for kernel related traits based on a high-density genetic map. J. Crops 9, 1510–1518. doi: 10.3724/SP.J.1006.2015
Raihan, M. S., Liu, J., Huang, J., Guo, H., Pan, Q., and Yan, J. (2016). Multi-environment QTL analysis of grain morphology traits and fine mapping of a kernel-width QTL in Zheng58 × SK maize population. Theor. Appl. Genet. 129, 1465–1477. doi: 10.1007/s00122-016-2717-z
Ramadan, A., Nemoto, K., Seki, M., Shinozaki, K., Takeda, H., Takahashi, H., et al. (2015). Wheat germ-based protein libraries for the functional characterisation of the Arabidopsis E2 ubiquitin conjugating enzymes and the RING-type E3 ubiquitin ligase enzymes. BMC Plant Biol. 15:275. doi: 10.1186/s12870-015-0660-9
Riggs, J. W., Cavales, P. C., Chapiro, S. M., and Calli, S. J. (2017). Identification and biochemical characterization of the fructokinase gene family in Arabidopsis thaliana. BMC Plant Biol. 17:83. doi: 10.1186/s12870-017-1031-5
Rogers, J. S. (1972). Measures of genetic similarity and genetic distance. Stud. Genet. Univ. Texas Publ. 7213, 145–153.
Schnable, P. S., Ware, D., Fulton, R. S., Stein, J. C., Wei, F., Pasternak, S., et al. (2009). The B73 maize genome:- complexity, diversity, and dynamics. Science 326, 1112–1115. doi: 10.1126/science.1178534
Song, X. J., Huang, W., Shi, M., Zhu, M. Z., and Lin, H. X. (2007). A QTL for rice grain width and weight encodes a previously unknown RING-type E3 ubiquitin ligase. Nat. Genet. 39, 623–630. doi: 10.1038/ng2014
Tian, Y. H., Zhang, Y. L., Fan, Z. X., and Tao, Y. S. (2014). Bioinformatics analysis of orthologous maize gene based on rice kernel length gene OsPPKL1. Guizhou Agric. Sci. 42, 1–6.
Wang, H., Li, K., Hu, X., Liu, Z., Wu, Y., and Huang, C. (2016). Genome-wide association analysis of forage quality in maize mature stalk. BMC Plant Biol. 16:227. doi: 10.1186/s12870-016-0919-9
Wang, L. W. (2015). Fine Mapping of the Main Effect QTL qKL9 of Kernel Length. Master’s thesis, Huazhong Agricultural University, Wuhan.
Wang, Q. X., Xie, W. B., Xing, K. J., Yan, J., Meng, X. J., Li, X. L., et al. (2015). Genetic architecture of natural variation in rice chlorophyll content revealed by a genome-wide association study. Mol. Plant 8, 946–957. doi: 10.1016/j.molp.2015.02.014
Wang, X., Wang, H., Liu, S., Ferjani, A., Li, J., Yan, J., et al. (2016). Genetic variation in ZmVPP1 contributes to drought tolerance in maize seedlings. Nat. Genet. 48, 1233–1241. doi: 10.1038/ng.3636
Wu, X., Li, Y., Shi, Y., Song, Y., Wang, T., Huang, Y., et al. (2014). Fine genetic characterization of elite maize germplasm using high-throughput SNP genotyping. Theor. Appl. Genet. 127, 621–631. doi: 10.1007/s00122-013-2246-y
Xia, X., Ma, Y. C., Bai, Q. H., Feng, Y. Y., Wang, S. Y., Wang, X., et al. (2016). Cloning and expression analysis of ZmMADS-RIN gene for regulating the kernel development of maize. Acta Agron. Sin. 42, 1656–1665. doi: 10.3724/SP.J.1006.2016.01656
Xiao, Y., Tong, H., Yang, X., Xu, S., Pan, Q., Qiao, F., et al. (2016). Genome-wide dissection of the maize ear genetic architecture using multiple populations. New Phytol. 210, 1095–1106. doi: 10.1111/nph.13814
Yan, H. F., Saika, H., Maekawa, M., Takamure, I., Tsutsumi, N., Kyozuka, J., et al. (2007). Rice tillering dwarf mutant dwarf3 has increased leaf longevity during darkness-induced senescence or hydrogen peroxide-induced cell death. Genes Genet. Syst. 82, 361–366. doi: 10.1266/ggs.82.361
Yan, J. B., Warburton, M., and Crouch, J. (2011). Association mapping for enhancing maize (Zea mays L.) genetic improvement. Crop Sci. 51, 433–449. doi: 10.2135/cropsci2010.04.0233
Yan, S., Zou, G., Li, S., Wang, H., Liu, H., Zhai, G., et al. (2011). Seed size is determined by the combinations of the genes controlling different seed characteristics in rice. Theor. Appl. Genet. 123, 1173–1181. doi: 10.1007/s00122-011-1657-x
Yang, C., Zhang, L., Jia, A., and Rong, T. (2016). Identification of QTL for maize grain yield and kernel-related traits. J. Genet. 95, 239–247. doi: 10.1007/s12041-016-0628-z
Yang, X. J. (2008). Mapping of Quantitative Trait Loci (QTL) and Genetic Effect for Important Traits with an Elite Maize Hybrid. Master’s thesis, Xinjiang Agricultural University, Urumchi.
Zhang, H. X., Weng, J. F., Zhang, X. C., Liu, C. L., Yong, H. J., Hao, Z. F., et al. (2014). Genome-wide association analysis of kernel row number in maize. Acta Agron. Sin. 40:1. doi: 10.3724/SP.J.1006.2014.00001
Zhang, J. H., Liu, Z. Z., and Zhu, Y. L. (2009). QTL mapping for ear traits under different densities using DH population of maize. J. Hebei Agric. Univ. 32, 1–6.
Zhang, S. R., Nichols, S. E., and Dong, J. G. (2003). Cloning and characterization of two fructokinases from maize. Plant Sci. 165, 1051–1058. doi: 10.1016/0021-9150(95)05574-G
Keywords: maize ear traits, genetic diversity, GWAS, candidate gene, meta-QTL
Citation: Zhu X-M, Shao X-Y, Pei Y-H, Guo X-M, Li J, Song X-Y and Zhao M-A (2018) Genetic Diversity and Genome-Wide Association Study of Major Ear Quantitative Traits Using High-Density SNPs in Maize. Front. Plant Sci. 9:966. doi: 10.3389/fpls.2018.00966
Received: 09 March 2018; Accepted: 15 June 2018;
Published: 09 July 2018.
Edited by:
Nicolas Rispail, Consejo Superior de Investigaciones Científicas (CSIC), SpainReviewed by:
Hongjun Liu, Shandong Agricultural University, ChinaDarlene Lonjas Sanchez, Texas A&M AgriLife Research & Extension Center at Beaumont, United States
Sivakumar Sukumaran, International Maize and Wheat Improvement Center (CIMMYT), Mexico
Copyright © 2018 Zhu, Shao, Pei, Guo, Li, Song and Zhao. This is an open-access article distributed under the terms of the Creative Commons Attribution License (CC BY). The use, distribution or reproduction in other forums is permitted, provided the original author(s) and the copyright owner(s) are credited and that the original publication in this journal is cited, in accordance with accepted academic practice. No use, distribution or reproduction is permitted which does not comply with these terms.
*Correspondence: Mei-Ai Zhao, meiai@qau.edu.cn Xi-Yun Song, songxy@qau.edu.cn
†These authors have contributed equally to this work.