 Mohd Aamir1*
 Sarvesh Pratap Kashyap2,3
 Andleeb Zehra1
 Manish Kumar Dubey1
 Vinay Kumar Singh4
 Waquar Akhtar Ansari2,3
 Ram S. Upadhyay1Surendra Singh1
- 1Laboratory of Mycopathology and Microbial Technology, Centre of Advanced Study in Botany, Institute of Science, Banaras Hindu University, Varanasi, India
- 2Division of Crop Improvement and Biotechnology, Indian Institute of Vegetable Research, Indian Council of Agricultural Research, Varanasi, India
- 3Department of Botany, Institute of Science, Banaras Hindu University, Varanasi, India
- 4Centre for Bioinformatics, School of Biotechnology, Institute of Science, Banaras Hindu University, Varanasi, India
The beneficial association and interaction of rhizocompetent microorganisms are widely used for plant biofertilization and amelioration of stress-induced damage in plants. To explore the regulatory mechanism involved in plant defense while associating with beneficial microbial species, and their interplay when co-inoculated with pathogens, we evaluated the response of tomato defense-related WRKY gene transcripts. The present study was carried out to examine the qRT–PCR-based relative quantification of differentially expressed defense-related genes in tomato (Solanum lycopersicum L.; variety S-22) primed with Trichoderma erinaceum against the vascular wilt pathogen (Fusarium oxysporum f. sp. lycopersici). The tissue-specific and time-bound expression profile changes under the four different treatments “(unprimed, Fol challenged, T. erinaceum primed and Fol+ T. erinaceum)” revealed that the highest upregulation was observed in the transcript profile of SlWRKY31 (root) and SlWRKY37 (leaf) in T. erinaceum bioprimed treated plants at 24 h with 16.51- and 14.07-fold increase, respectively. In contrast, SlWRKY4 showed downregulation with the highest repression in T. erinaceum bioprimed root (24 h) and leaf (48 h) tissue samples with 0.03 and 0.08 fold decrease, respectively. Qualitative expression of PR proteins (chitinases and glucanases) was found elicited in T. erinaceum primed plants. However, the antioxidative activity of tomato superoxide dismutase and catalase increased with the highest upregulation of SOD and SlGPX1 in Fol + T. erinaceum treatments. We observed that these expression changes were accompanied by 32.06% lesser H2O2 production in T. erinaceum bioprimed samples. The aggravated defense response in all the treated conditions was also reflected by an increased lignified stem tissues. Overall, we conclude that T. erinaceum bio-priming modulated the defense transcriptome of tomato after the Fol challenged conditions, and were accompanied by enhanced accumulation of defense-related WRKY transcripts, increased antioxidative enzyme activities, and the reinforcements through a higher number of lignified cell layers.
Introduction
Microbial bio-priming represents an adaptive strategy to improve the defensive capacity of plants that result in increased resistance/stress tolerance, and/or a more aggravated defense response against the stress challenged conditions. Plant growth-promoting fungi (PGPF) include many strains of Trichoderma spp., which have been used as a potential biocontrol agent. The rhizocompetent nature of Trichoderma spp. allows it to colonize roots, stimulates the plant immune system (induced systemic resistance; ISR), and pre-activation (priming) of the molecular mechanisms of defense against several potent phytopathogens (Hermosa et al., 2012; Pieterse et al., 2014; Martínez-Medina et al., 2017). Furthermore, colonization of this beneficial fungi promotes plant growth and also ameliorates the host plants against various abiotic and biotic stresses (Brotman et al., 2013; Zhang et al., 2016; Fu et al., 2017).
The WRKY family of transcription factors (Tfs) play a central role in plant development and the defense response against various abiotic and biotic stresses (Kiranmai et al., 2018; Singh et al., 2018; Vives-Peris et al., 2018) are plant-specific zinc finger type regulatory proteins. The WRKY proteins regulate the gene expression directly or indirectly by modulating the downstream target genes, by activating or repressing the other genes (encoding Tfs) or by self-regulating their own expression (Shankar et al., 2013). In tomato (Solanum lycopersicum), a total of 83 WRKY genes (previously documented 81 genes; Huang et al., 2012) has been identified (Bai et al., 2018; Karkute et al., 2018). WRKY TFs play an indispensable role in the regulation of diverse biological processes, but most notably are the key players in plant responses to biotic and abiotic stresses (Bai et al., 2018). The plant defense regulation involving WRKY proteins can be determined through dynamic changes in the levels of accumulated WRKY transcripts inside the cell (Chi et al., 2013). One of the most crucial aspects of WRKY gene regulation is that despite of having the functional diversity among different WRKY members, almost all analyzed WRKY proteins recognize and bind conserved TTGACC/T W-box sequences (de Pater et al., 1996; Rushton et al., 1996; Eulgem et al., 2000; Ciolkowski et al., 2008). However, DNA binding assays revealed the importance of the invariant “GAC” core consensus sequences of the core promoter element in a feasible DNA-protein interaction (Sun et al., 2003; Ciolkowski et al., 2008; Brand et al., 2010, 2013). Further, some WRKY members exhibit differences in their DNA binding preferences, which are partly dependent on additional adjacent DNA sequences lying outside of the TTGACY-core motif (Ciolkowski et al., 2008). By homology modeling, in vitro DNA-protein interaction-enzyme-linked immunosorbent assay and molecular simulation studies performed with different AtWRKY proteins revealed differences in DNA binding specificities (Brand et al., 2013). The two most important questions arise if all the WRKY factors bind with the W-box DNA; how the specificity for certain promoters is accomplished, and how the stimulus-specific responses are mediated by diverse members of the WRKY gene family. Later, studies revealed that besides the W-box-specific DNA binding, WRKY specific stimulus-response is facilitated by other essential components that regulate the biological function of different WRKY members (Brand et al., 2013). Furthermore, activation or repression through W-box and W-box like sequences is regulated at transcriptional, translational, and domain level (Phukan et al., 2016) and the interaction of WRKY Tfs with the W-box (with core motif TTGACC/T) and clustered W-boxes present in the promoters of downstream genes, regulate a dynamic web of signaling through the kinase or other phosphorylation cascades. Epigenetic, retrograde and proteasome-mediated regulation pathways enable WRKYs to accomplish a dynamic cellular homeostatic reprograming (Bakshi and Oelmüller, 2014; Phukan et al., 2016). Microbial priming is also associated with chromatin modification in promoters of WRKY Tfs genes that regulates SA dependent defenses, thereby promoting the enhanced expression of WRKYs upon pathogen challenged condition (Jaskiewicz et al., 2011). Furthermore, WRKYs role in transcriptional reprogramming becomes clearer because of in silico analysis of cis-acting DNA regulatory elements from the promoter region of stress-responsive WRKYs revealed the presence of various abiotic stress-responsive elements (Karkute et al., 2018). In this way, characterization of the promoter elements could help in understanding the functional dimension and regulation of WRKY members at the molecular level which is particularly important for those WRKYs that have been reported in the crosstalk between abiotic and biotic stress tolerance (Bai et al., 2018). Because of the tight regulation involved in the specific recognition and binding of WRKYs to the downstream promoters, they have been considered as a promising candidate for crop improvement (Karkute et al., 2018).
The rhizospheric microbiome (beneficial) are known to play an indispensable role in the transcriptional reprogramming required for plant defense against pathogens (Spence et al., 2014) and requires complex signaling cascades, involving multiple Tfs that primarily function as transcriptional regulators. At the molecular level, the biocontrol mechanism induced by Trichoderma is mediated through the adaptive recruitment and reprogramming of defense-related transcripts (Shaw et al., 2016). The transcriptional regulation of stress-inducible genes and the activation of an adaptive response (microbial symbiosis) are mediated and modulated through an immediate early expression of the WRKY genes (Chen et al., 2012). Therefore, the level of the WRKY proteins inside the cell accumulate sharply, which further directs the transcriptional regulation of the target genes through regulation with other cis-acting response elements (Chen et al., 2012). In addition, bio-priming with Trichoderma spp. has been found to be associated with the expression of several genes involved in regulating the general oxidative stress as well as osmoprotection. Further, the signaling cascade that regulates the plant pathogen interaction may involve classical phytohormones such as salicylic acid (SA), jasmonic acid (JA), and ethylene (ET) or may incorporate auxin, abscisic acid (ABA), cytokinins (CKs), and brassinosteroids (Robert-Seilaniantz et al., 2011). The pathogen-triggered immunity (PTI) and effector-triggered immunity (ETI) has been reported to function at differently regulatory levels and their signaling network is regulated by WRKY proteins (Shen et al., 2007; Mangelsen et al., 2008; Bakshi and Oelmüller, 2014). In one prominent example, it was found that in barley (Hordeum vulgare) HvWRKY1 and HvWRKY2 were found to activate by the FLG22 (a MAMP) and were reported to play a critical role by acting as a negative regulator (repressor) of the PTI against the powdery mildew fungus, Blumeria graminis f. sp. hordei (Bai et al., 2018).
Trichoderma induced bioprimed signaling involves a systemic resistance type immune response (Tucci et al., 2011; Yoshioka et al., 2012; Martínez-Medina et al., 2013), interconnected in a complex network of cross-communicating hormone pathways involving the JA/ET-induced systemic resistance (ISR) or SA dependent signaling mechanism. It has been documented that the early signaling events following the interaction of Trichoderma spp. with the host plant, is mediated through the pattern recognition receptors (PRRs) that activate the MAMPs/DAMPs-triggered immunity (MTI/DTI) (Hermosa et al., 2013; Ruocco et al., 2015). The WRKY mediated defense response regulates the signaling crosstalk through the activation of JA/ET-mediated signaling pathways, encoding repressors that suppress the SA regulated gene expression (Lai et al., 2008). Therefore, WRKY Tfs also acts as an important node of convergence between the SA and JA signaling (Pieterse et al., 2012). During pathogen challenged conditions, plants protect themselves through a plethora of mechanisms including activation of the ROS system, accumulation of H2O2, cellular reinforcement at the infection sites (through deposition of the suberin and lignin), expression of the plant pathogenesis-related (PR) proteins (Pusztahelyi et al., 2015) which further reflects the role of the SA mediated systemic acquired resistance (SAR) pathway (Gharbi et al., 2017). Among the differentially expressed PR proteins, chitinases and β-1, 3-glucanases are two major hydrolytic enzymes abundant in many plant species following the infection of different fungal pathogens (Ebrahim et al., 2011; Balasubramanian et al., 2012). Both chitinases and glucanases play a crucial role in plant defense against fungal pathogens since the cell wall of pathogenic fungi is composed of the two most crucial elements chitin and β-1, 3-glucan, and constitute the structural barrier of pathogenic cell wall fungi. Further, β-1, 3- glucanases appear to be coordinately expressed along with chitinases after fungal infection (Balasubramanian et al., 2012). The lignification event is an important mechanism which is accompanied by the accumulation of lignin or lignin-like phenolic compounds following the pathogenic attack and has been reported to occur in the plethora of plant-microbe interactions during the plant defense responses (Ebrahim et al., 2011). As a part of the host defense mechanism, lignification plays an indispensable role in preventing pathogen growth and dissemination. The lignified tissues represent the structural barrier and provide resistance in plants against biotic damages.
Trichoderma spp. induced bio-priming is characterized by the secretion of various antimicrobial compounds through the participation of the phenylpropanoid pathway that not only delimits the infection and dissemination of pathogens but also confers tolerance against various abiotic stresses (Mastouri et al., 2012; Ahmad et al., 2015). The inoculation of Trichoderma spp. leads to the activation of an efficient reactive oxygen species (ROS) detoxification system (De Palma et al., 2019). Further, mycoparasitic colonization by Trichoderma spp. leads into induction and accumulation of the PR proteins at early stages of root colonization (Yedidia et al., 2000). In many studies, it has been demonstrated that treatment of plants with beneficial microbes, particularly Trichoderma, enhances plant resistance against pathogens through ROS generation and lignification (Patel et al., 2017; Meshram et al., 2019).
In recent years, experimental studies done with Arabidopsis thaliana co-inoculated with T. asperelloides T203 provides sufficient data showing an increased expression of the specific WRKY genes and activation of the JA pathway that stimulates JA signaling through repression of the jasmonate ZIM domain (JAZ) repressors (Brotman et al., 2013). However, the signaling cascades and molecular events involved in Trichoderma-root association in the presence of elicitors or effectors from the pathogen Fusarium oxysporum f. sp. lycopersici (Fol) have not been investigated in light of WRKYs gene-mediated defense regulation of the host. Therefore, the objective of the present study is to provide a comparative approach for unraveling the WRKY gene-mediated defense signaling in the presence and absence of the beneficial microbe (Trichoderma spp.). The study was carried out to examine the real-time based relative quantification of differently expressed defense-related WRKY genes in tomato plants primed with T. erinaceum against the fungal pathogen Fusarium oxysporum f. sp. lycopersici. Additionally, we have also analyzed the time-dependent and tissue-specific expression profile changes in genes that constitute the ROS detoxification system, including superoxide dismutase (SOD), glutathione peroxidase (GPX1) and PR proteins. The biochemical response of the host has been investigated in terms of antioxidative enzyme activities, H2O2 content, and lignin deposition.
Materials and Methods
Fungal Inoculum Preparation
The pathogenic cultures Fusarium oxysporum f. sp. lycopersici (Fol) was brought from the Department of Mycology and Plant pathology, Institute of Agricultural Sciences, Banaras Hindu University (BHU). The fungal inoculum was prepared from the 7 day old culture of Fol pathogen as per the method suggested by (Taylor et al. (2013)). In brief, the Petri dish containing the culture was suspended with sterile distilled water. The spores were gently removed using a glass spreader, and then the heterogeneous suspension was filtered using muslin cloth for removing the mycelial mat. The filtered suspension was diluted with sterile distilled water to maintain a minimum density of 2 × 10⁵ to 2 × 10⁶ spores mL–1 as quantified through the hemocytometer.
Pathogenicity Test
The pathogenicity test was performed with the Fol isolate to validate the Koch postulates for confirmation of the role of the pathogen in developing vascular wilt disease symptoms. The spore suspension of the Fol pathogen prepared above was used for pathogenicity testing. Twenty days old healthy tomato seedlings from both control and bioprimed plants were inoculated by the standard root dip method (Nirmaladevi et al., 2016). The healthy seedlings were uprooted from pots with gentle care without disturbing and disrupting the root integrity, shaken for removal of adhered soil particles and washed gently under the running tap water. The sterilized scissor was used for trimming the root apex portion (about 1 cm) and then the trimmed root portion was dipped in the prepared conidial suspension (2 × 10⁵ to 2 × 10⁶ spores mL–1) of the Fol pathogen for 30–40 min, for soaking in the conidial suspension. The inoculated seedlings were then used for transplantation to mini pots (15 cm diameter, surface sterilized with 0.1% mercuric chloride) containing the sterilized soil and sand mixed in a 2:1 ratio. Three seedlings per pot were used for transplantation. Plants were maintained in a greenhouse under 16 h light/8 h dark conditions with temperature ranging 28–29°C. Seedlings were watered on a daily basis. The symptoms of vascular wilt disease were initially observed 15–20 days after post inoculation of the Fusarium oxysporum f. sp. lycopersici (Fol) pathogen.
In vitro Antagonistic Assay
Ten different isolates of Trichoderma spp. (T1–T10) were brought about from NBAIMCC, Kushmaur, Mau, Uttar Pradesh, India. The isolates were as follows: Trichoderma fasiculatum (T1) (NAIMCC-F-01714), T. hamatum (T2) (NAIMCC-F-01717), T. koningii (T3) (NAIMCC-F-01757), T. longibrachiatum (T4) (NAIMCC-F-01770), T. pseudokoningii (T5) (NAIMCC-F-01775), T. asperellum (T6) (NAIMCC-F-02170), T. erinaceum (T7) (NAIMCC-F-02171), T. virense (T8) (NAIMCC-F-02231), T. piluliferum (T9) (NAIMCC-F-02227), T. viride (T10) (NAIMCC-F-02500). The detailed information regarding the Trichoderma spp. used in this study including accession identities, source of isolation and isolation code has been provided in Supplementary Table S1. The in vitro antagonistic activity was checked for all the selected 10 isolates of Trichoderma spp. against the Fol pathogen, to find out the best isolate that could be used for seed bio-priming and further experiments. A 5 mm mycelial plug was cut with the help of cork borer from both the Fol Petri plate and each of the Trichoderma isolates (T1–T10) culture plates. The disks from Fol and each of the Trichoderma isolates were placed in a fresh culture plate with a separation of 3 cm apart from each other. The plates were then incubated at 27 ± 2°C for 5 days. The mycelial growth was recorded, and the percent inhibition was calculated. The experiment was done in replicates of three and the percentage inhibition of radial growth was measured from formula [100 × (C–T)/C] where C = radial growth of the pathogen in control and T = radial growth of the pathogen in dual culture with antagonist (Garrett, 1956).
Preparation of T. erinaceum Spore Suspension and Seed Bio-Priming
The Trichoderma isolates showing the maximum growth inhibition (among the 10 isolates under study) of the Fol pathogen (T. erinaceum; NAIMCC-F-02171) was further grown on PDB medium for 7 days at 27 ± 2°C. The spores were harvested in sterile saline (NaCl 0.85%) and filtered with a sterile muslin cloth. The optical density OD was measured at 600 nm with OD of 1.026 that contained 2.26 × 10⁷ spores mL–1. The spore suspension was centrifuged at 10,000 rpm for 10 min. The pellet was re-suspended in the same volume of autoclaved 1.5% CMC (carboxy methyl cellulose) (Jain et al., 2012). The tomato seeds (S-22 variety) susceptible (83.67%) to the Fol pathogen (Chopada et al., 2014) were used in this experiment. For seed bio-priming with spore suspension of T. erinaceum the fresh and healthy seeds of tomato were surface sterilized with 0.01% aqueous solution of mercuric chloride followed by repeated washing with double-distilled water and further dried under laminar air flow on autoclaved blotting paper (Jain et al., 2012). The surface sterilized and dried seeds were treated by soaking in the spore suspensions of T. erinaceum. The control seeds were treated with only CMC without suspension. Further, all the seeds were placed in the moist chamber at 98 % relative humidity and 28–30°C and maintained for 24 h (Jensen et al., 2004).
Pot Trials
The T. erinaceum bioprimed and control seeds were further sowed in the fresh plastic pots (having 08 cm diameter) containing the sterilized soil mixed with vermiculite (2:1). A total of 4 seeds per pot were sown for each treatment and a control set was maintained. The pots were irrigated manually on every alternate day. A total of five replicates for each treatment were prepared and maintained at 16 h light/8 h dark in greenhouse conditions with temperature 28–29°C and relative humidity in the range of 50–70% following the protocol (Zehra et al., 2017). All the seeds were allowed to grow in greenhouse conditions for 5–6 weeks. The 5–6 weeks old plants following the seed germination (height 15 cm) were treated with the Fol suspension following the protocol (Zehra et al., 2017). The root and leaf tissues from all the four treatments including control, Fol challenged, T. erinaceum bioprimed and the T. erinaceum bioprimed +Fol challenged were collected at the different time interval 0 h (control), 24 and 48 h for qRT-PCR analysis. Further, the biochemical assessment was done using the leaf tissues from all the samples collected at different time intervals.
Morphological Growth Characteristic
The monitoring of the bioprimed plant and control (unprimed) plants was done regularly. The plants were first observed at 15 days and later on after 45 days interval for recording the characteristic changes observed in morphological growth parameters and other attributes such as increased plant height, root and shoot length, number of leaves, and thickness of the stem. The data were compared with the same day untreated control samples.
RNA Extraction and cDNA Synthesis
The relative expression of distinctly upregulated WRKY transcripts under all the treated conditions were measured both quantitatively and semi-quantitatively in root and leaf tissues at different time intervals (0, 24, and 48 h), respectively. The total RNA was extracted using TRIZOL reagent (Invitrogen) following the manufacturer’s protocol. The 1.0% agarose gel (prepared in DEPC treated water) was used to check the quality of the extracted RNA. Further, the quantification, purity, and integrity of the extracted RNA were evaluated using Nanophotometer (Implen, CA, United States) at absorption ratio of 230/260/280 nm. The first strand of cDNA was synthesized through the iscriptTM cDNA synthesis kit (Bio-Rad Laboratories, United States) using 1.0 μg of the extracted RNA as per the given recommendation.
Real-Time Quantitative PCR Analysis
The quantitative and semi quantitative studies were done for evaluating the spatial and temporal expression of accumulated WRKY transcripts as well as other defense related genes in all the four treatment conditions. Real-time quantitative PCR (qRT-PCR) reactions were performed using SsoFastTM EvaGreen® Supermix detection chemistry (Bio-Rad) with an iQ5 thermocycler (BioRad Laboratories, United States). The qPCR was performed in three independent biological replicates with each biological replicate performed in triplicates using the SYBR Green fluorescence dye (Qiagen, United States) and analyzed using iQ-SYBR Green Supermix (Bio-Rad, CA, United States) on iQ5 thermocycler (Bio-Rad, CA, United States) with iQ5 Optical System Software version 2.0 (Bio-Rad, CA, United States) following the protocols as mentioned. The PCR reactions were performed in a 20 μl final volume reaction mixture that contains 2 μl of the template cDNA (20 ng), 1 μl of each gene-specific primer (0.2 μM) and 10 μl of 2 × SsoFastTM EvaGreen® Supermix. The WRKY gene-specific primer was designed through the Primer 3 http://primer3.ut.ee/ (Untergasser et al., 2012) (Table 1). The protein sequences of glutathione peroxidase (SlGPX1; NP_001234567) and PR proteins including both PR2 (NP_001234158) and PR3 (XP_004237833.1) were used for designing gene specific primers. Further, sequences of all the primers were validated using Primer-Blast at https://www.ncbi.nlm.nih.gov/tools/primer-blast/ (Ye et al., 2012). The qRT PCR reaction program was set as an initial denaturation at 95°C for 10 min followed by 45 cycles of denaturation at 95°C for 15 s, annealing at 60°C for the 30 s and extension at 72°C for 30 s. The heat map was generated using the replicated count data Bio-conductor R1 obtained from expression values for both root and leaf tissues. The tomato ACTIN gene was used as a reference gene due to its constitutive and stable expression (Vergne et al., 2007). The ΔCt value was calculated from the difference observed between the Ct values given for our target WRKY gene and the housekeeping ACTIN gene (that act as the constitutive control). The relative quantification was analyzed by using the 2-ΔΔCT method given by Livak and Schmittgen (2001) and then normalized to the Ct data about the transcript level of the ACTIN gene as an internal control because of its constitutive expression. The heat map was generated using Bioconductor R (see footnote 1) software tool.
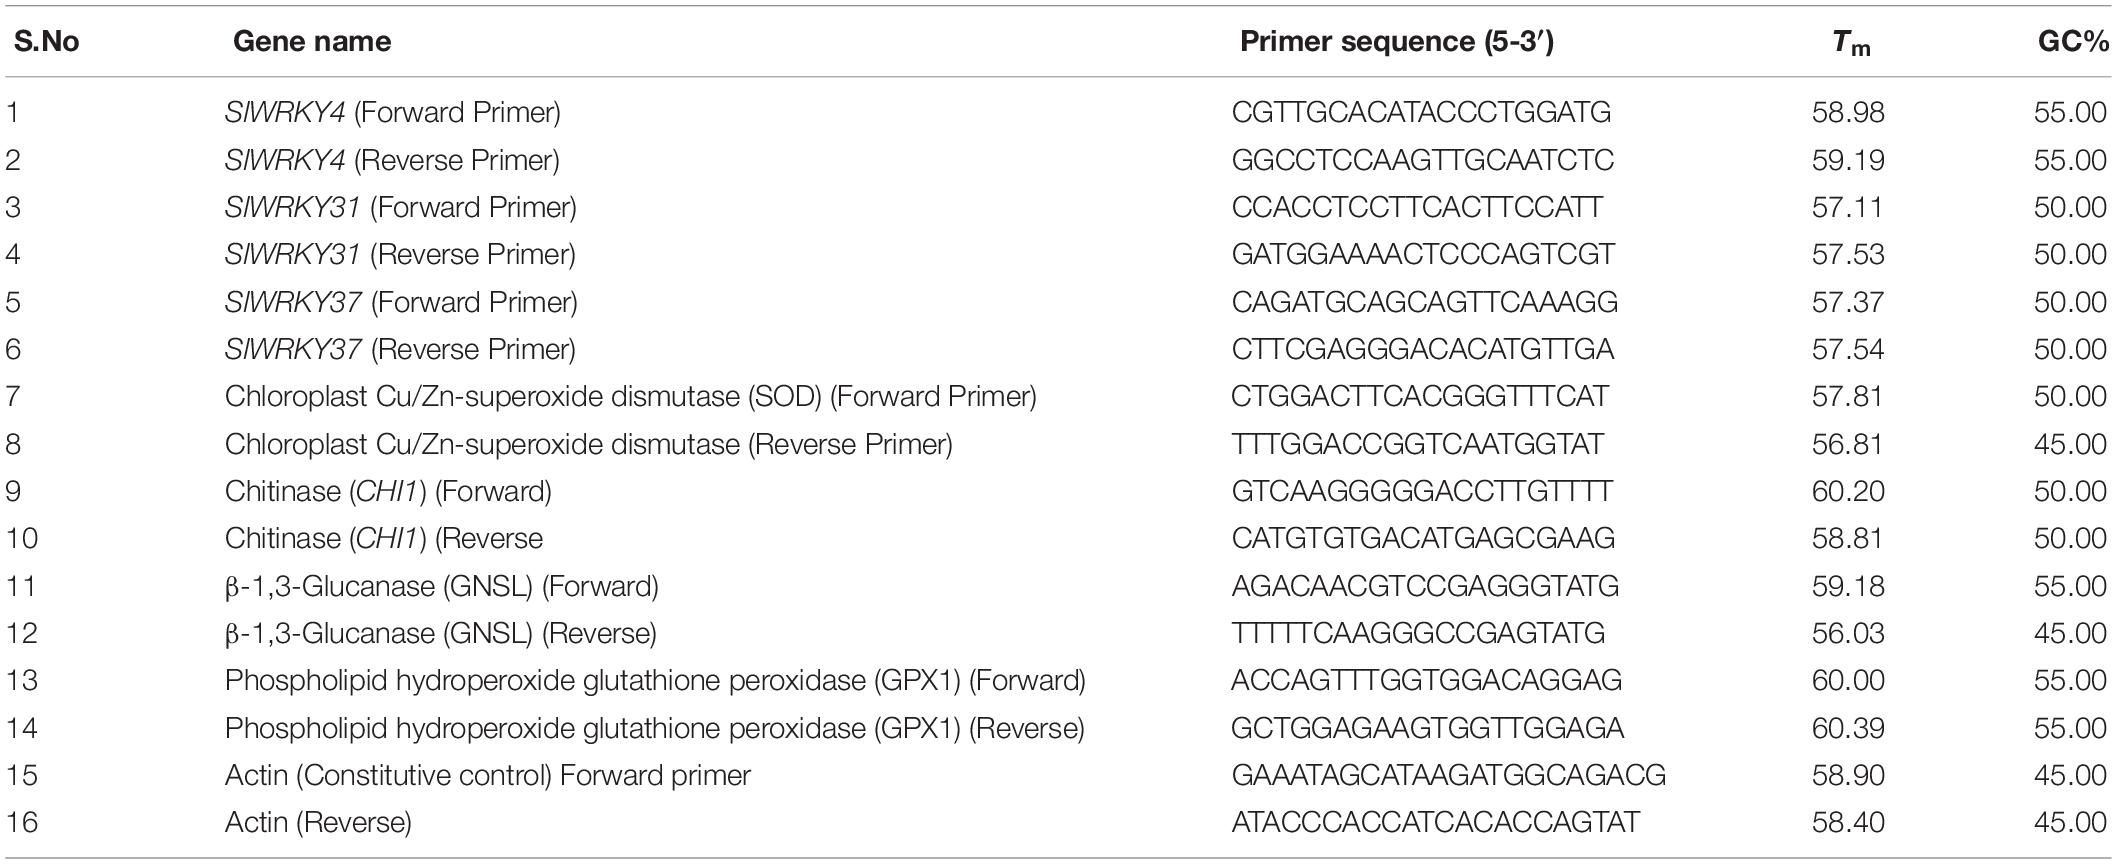
Table 1. List of gene specific primers used for quantitative and semi-quantitative real time PCR studies.
Gene Prediction, Chromosomal Map, and Cis-Acting DNA Regulatory Element Analysis
We have predicted the location of three characterized WRKY genes (including SlWRKY4, SlWRKY31, and SlWRKY37) having clear-cut upregulation in all the Fol challenged tissues through the gene prediction tool. Further, the chromosomal location of each WRKY gene in the tomato genome was searched and a promoter scan was done to identify the putative cis-acting DNA regulatory elements including the position of the W-box DNA. For gene prediction, the topmost hit identifiers for each respective SlWRKY member having maximum query cover and percent identity values were selected (based on Blast-p annotation). The protein sequences of SlWRKY4 (XP_004235494.1), SlWRKY31 (NP_001306910.1; previously renamed as SlWRKY33A) and SlWRKY37 (NP_001308885.1) were collected from the NCBI. The CDS sequences were analyzed using BLASTx tool to check the full-length protein sequence. Further, the full-length protein sequences were searched using tBLASTn program of NCBI and was searched across the whole genome shotgun contigs (wgs) database with selecting organism name (Solanum lycopersicum taxid: 4081). The promoter region prior to translational start site was searched for each SlWRKY gene and was confirmed through Blastx tool [where TSS; represent the position of transcription start site (TATA-box position)] and polyadenylation (Poly A; Poly A represents the 3′ polyadenylation site) tail. The orientation of each SlWRKY gene in positive frame was determined through the Fgenesh2 server. The Gene display server (GSDS 2.0)3 (Hu et al., 2015) was used to map the position of promoter, coding sequences, intronic region along the length of each SlWRKY gene. Further, to locate the position of each characterized SlWRKY gene on tomato chromosome, the respective protein sequences were annotated using tBLASTn tool across the wgs contigs database. Further, the chromosomal location of each WRKY gene was retrieved from Ensembl-Blast tool. The Plant CARE promoter database http://bioinformatics.psb.ugent.be/webtools/plantcare/html/ (Lescot et al., 2002) was used for finding the cis-acting DNA regulatory elements that bind to the promoter region of the characterized WRKY genes.
Biochemical Assessment of Plant Defense Response
H2O2 Quantification
The amounts of H2O2 produced and accumulated in leaf tissues collected from all the treated samples (control, the Fol challenged, T. erinaceum bioprimed and the Fol+ T. erinaceum) were quantified following the method as suggested by Jana and Choudhuri (1981). The leaves at different time intervals (0, 24, 48, and 72 h) were collected from all the treated samples. 200 mg of leaf tissue from each sample was crushed in 50 mM sodium phosphate (NaH2PO4) buffer (pH 6.5). The sample was then centrifuged at 8000 rpm for 20 min. The supernatant thus obtained was amended with 0.1% titanium sulfate (TiS2O8). The sample was again centrifuged and the intensity of the yellow colored solution was measured spectrophotometrically at 410 nm. The amount of H2O2 produced was calculated with an extinction coefficient of 0.28 μM–1cm–1 and was expressed as μmol g–1 fresh weight (FW).
Assessment of Antioxidative Enzyme Activities
SOD Activity
The superoxide dismutase (SOD; EC 1.15.1.1) activity was measured following the method as suggested by Beauchamp and Fridovich (1971). 200 mg leaf tissues from all the treated leaf samples were crushed in a 5 mL extraction buffer that contained 0.1 M phosphate buffer (pH 7.5) and 0.5 mM EDTA. The samples were then centrifuged at 15,000 rpm for 15 minutes. The final assay mixture was prepared with a 50 mM phosphate buffer (pH 7.8), 13 mM methionine, 75 μM NBT, 60 μM riboflavin, 0.1 mM EDTA, 200 μl enzyme extract and 2 μM riboflavin was used for spectrophotometric calculations recorded at 560 nm.
CAT Activity
Catalase (CAT; EC: 1.11.1.6) activity was measured following the protocol as suggested by McKersie et al. (1990). The leaf tissues 200 mg from each of the treated samples was homogenized in a 5 ml of 50 mM Tris NaOH buffer (pH 8.0) that comprised of 0.5 mM EDTA, 2 % (w/v) PVP, 0.5% (v/v) Triton X-100. The absorption of the final assay mixture having 200 μL enzymic extract, 50 mM H2O2 and 100 mM phosphate buffer (pH 7.0) was recorded for 5 min at 240 nm and the activity was expressed as μmol of H2O2 oxidized min–1 mg–1 protein (extinction coefficient of 0.036 mM–1 cm–1).
Histochemical Staining for Assessment of Lignification
The histochemical analysis for detection of the lignified tissue was done following the protocol as suggested by Guo et al. (2001). The transverse section (TS) of stem tissues from the second internode region was cut with Leica VT1000 Semiautomatic Vibrating Blade Microtome used for cutting the thin sections with thickness of 150 micron collected from all the treated tissues, and further, mounted in 1% phloroglucinol solution made with 95% alcohol. The mounted samples were covered with 0.1 mL concentrated HCl and was placed on a clean glass slide covered with the coverslip (Guo et al., 2001). The stained samples were visualized under a compound light microscope (Nikon, Japan). The lignified tissues were identified as intense pink coloration of deposited lignified material.
Statistical Analysis
Statistical analysis was done using the statistical package SPSS (SPSS Inc., Version 16.0). All the experiments were performed in three independent biological replicates with each replicate performed in triplicates, and for statistical analysis, the mean value of each replication was used, one-way analysis of variance (ANOVA) performed for significance difference, while the mean separations were compared with Duncan’s multiple range test at the P ≤ 0.05 significance level.
Results
Pathogenicity Tests
The symptoms of vascular wilt disease were initially observed 15–20 days post inoculating the Fol pathogen. The earlier symptom developed was yellowing of the big and lower leaves followed by their drooping at later stages. At later stages, it was found that the upper aerial leaves had shown the loss of turgidity with dried lower leaves. On the basis of root-dip inoculation test (Nirmaladevi et al., 2016) pathogen was able to cause the vascular wilt disease, and was also recovered from the diseased wilted plants. In contrast, the uninoculated tomato seedlings did not develop any diseased symptoms, and therefore, validated the Koch’s postulates. The recovered Fol pathogen was grown in a fresh Petri-plate on PDA medium. The microscopic study was done to observe the structure of pathogenic hyphal filaments and conidial structure. The structure of fungal mycelium with oval or kidney shaped microconidia, and sickle shaped macroconidia has been shown (Figure 1).
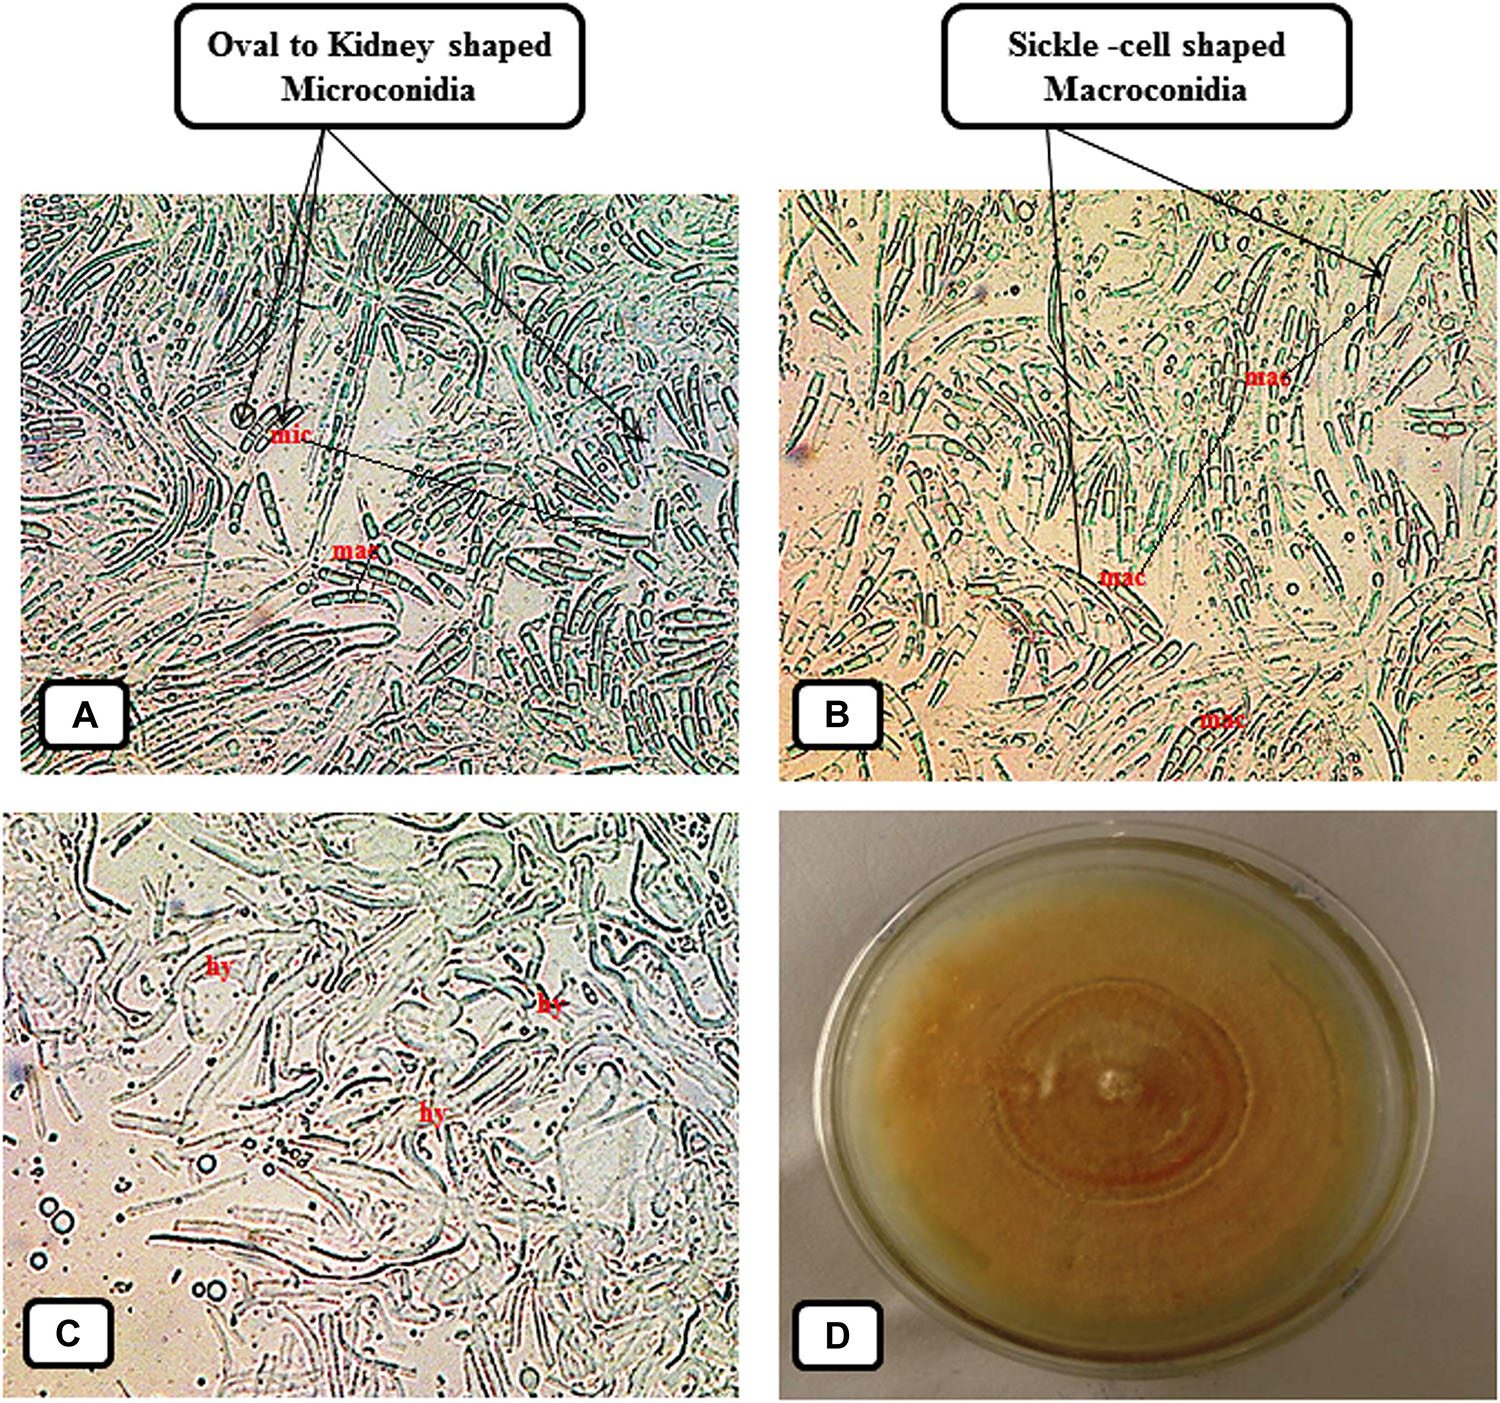
Figure 1. Photograph showing morphological and cultural characteristic of the vascular wilt pathogen Fusarium oxysporum f. sp. lycopersici (Fol) maintained on Potato Dextrose Agar (PDA) medium. (A) Microscopic observation of the small, oval or kidney shaped, and one or two celled, Microconidia (Abbreviation: mic) present in between the larger sickle shaped Macroconidia. (B) Microscopic view of the sickle-shaped, thin walled and delicate Macroconidia (Abbreviation: mac). (C) Structure of the fungal mycelium composed of interwoven hyphal filaments (Abbreviation: hy). (D) Photograph showing cultural characteristic and growth pattern of the Fol pathogen grown on Petri-plate.
In vitro Antagonistic Assay
It was found that all the isolates (T1–T10) of Trichoderma were found to be significantly effective in inhibiting the mycelial growth of the Fol pathogen over their respective control. However, T. erinaceum (T7) (Figure 2I) showed the best antagonistic activity against the Fol pathogen followed by T. longibranchiatum (T9) and T. asperellum (T6). Therefore, the T. erinaceum (T7) isolate was selected for seed bio-priming and greenhouse experiments. The dual culture assay showing the mycoparasitic interaction of T. asperellum with the Fol pathogen has been shown in Figure 2II.
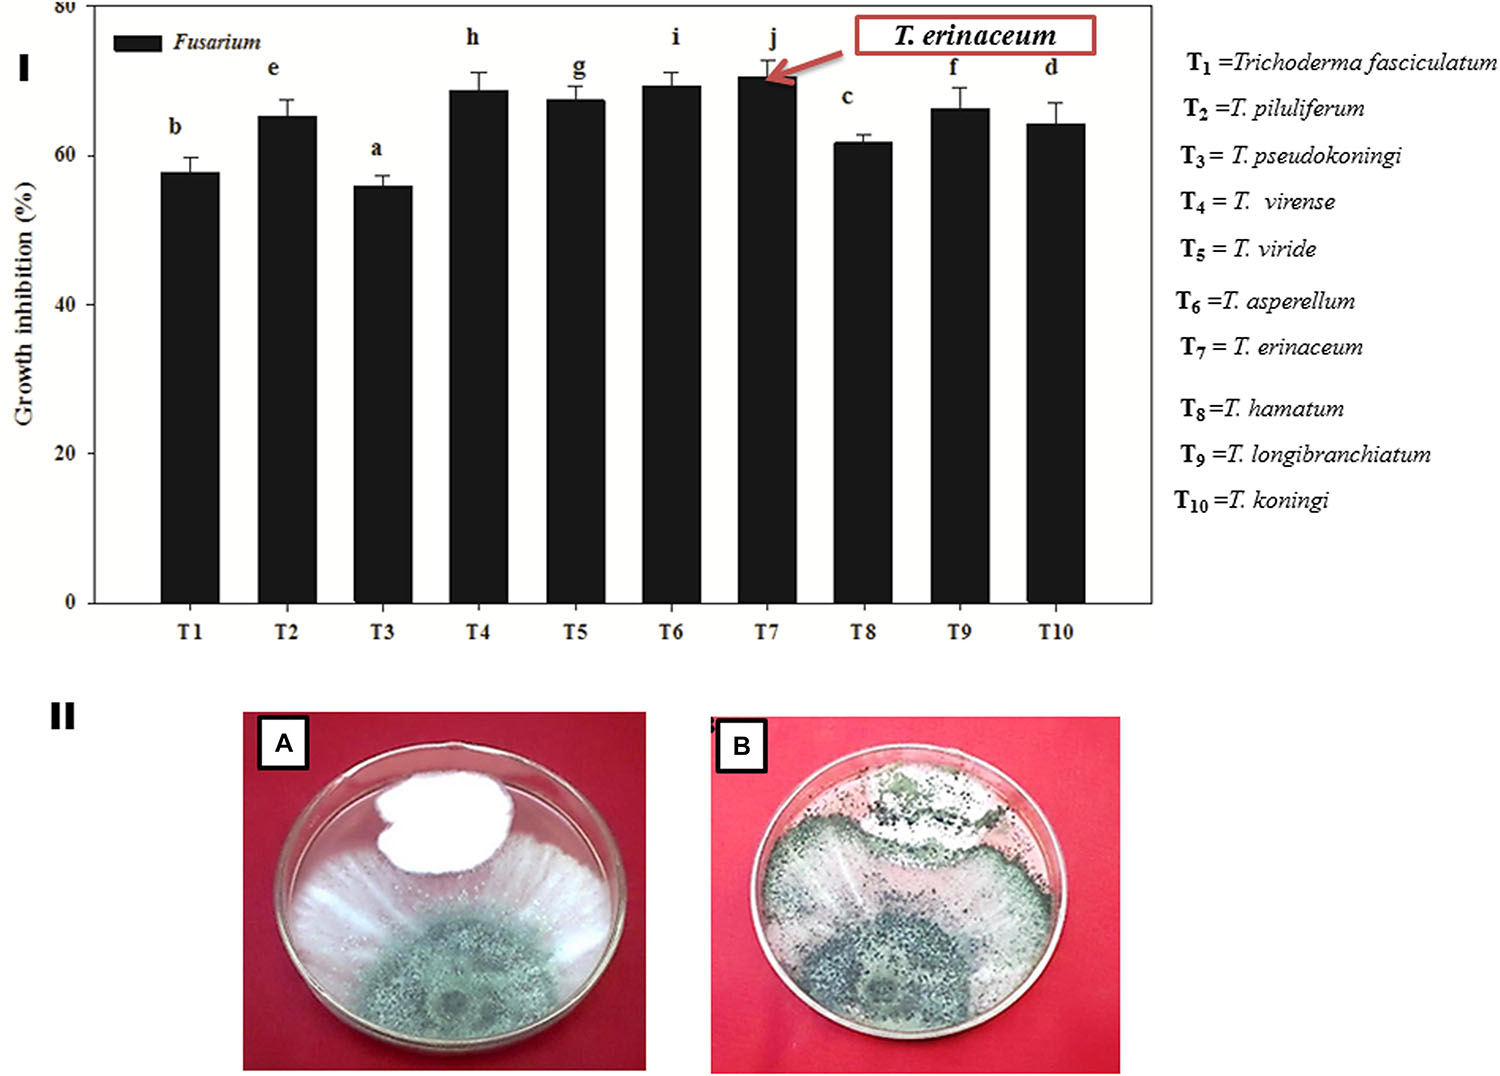
Figure 2. (I) Bar graph showing the efficacy of different species of biocontrol agent Trichoderma spp. in inhibiting the mycelial growth of the Fol pathogen. The figure represents the in vitro mycoparasitic interaction of different isolates of Trichoderma spp. (T1–T10) against the Fol pathogen through dual culture assay. The bar graphs represent the percentage growth inhibition of the pathogenic hyphae (Fol) by different species of Trichoderma employed in the study. The T. erinaceum (T7) showed the maximum inhibitory action against the Fol pathogen. (II) The Dual culture Assay showing the in vitro mycoparasitic and antagonistic activity of Trichoderma spp. against the pathogen Fusarium oxysporum f. sp. lycopersici. (A) Culture plate showing the mycoparasitic behavior of Trichoderma spp. and the Fol pathogen 5 days post inoculation. (B) The mycoparasitic activity of the Trichoderma showing the growth over the Fol pathogen and the picture was taken 10 days post inoculation of the Trichoderma spp. and the Fol pathogen (inoculated simultaneously). Mean (±SE) was calculated from three replicates for each treatment. Bars with distinct letters are significantly different at P ≤ 0.05 using the DMRT test.
Morphological Growth Characteristic
The bio-priming of tomato plants with T. erinaceum resulted in the profuse growth of the tomato plants, bearing changes in several morphological attributes like an increase in plant height, the thickness of stem, root growth, root length, and number of leaves etc., and the same was compared with an untreated control sample. To observe the changes occurring in the morphological parameters, regular monitoring of the T. erinaceum bioprimed and unprimed (control) plants were done. The stem from T. erinaceum bioprimed and unprimed (control) were sectioned with a razor blade at the junction of root and stem to observe the morphological changes, particularly, measured in terms of root growth, and thickness of the stem collected at 15 and 45 day intervals and the same was compared with an unprimed (control) of the same day. The morphological changes in the root growth and the thickness of the stem in control plants compared with bioprimed plants collected at 15 days (Figure 3I-A) and 45 days (Figure 3I-B) have been shown. The photograph was taken to show the effect of the priming response of T. erinaceum on the morphological growth parameters of tomato plants (Figure 3II-A) and the unprimed plants (Figure 3II-B) has been shown.
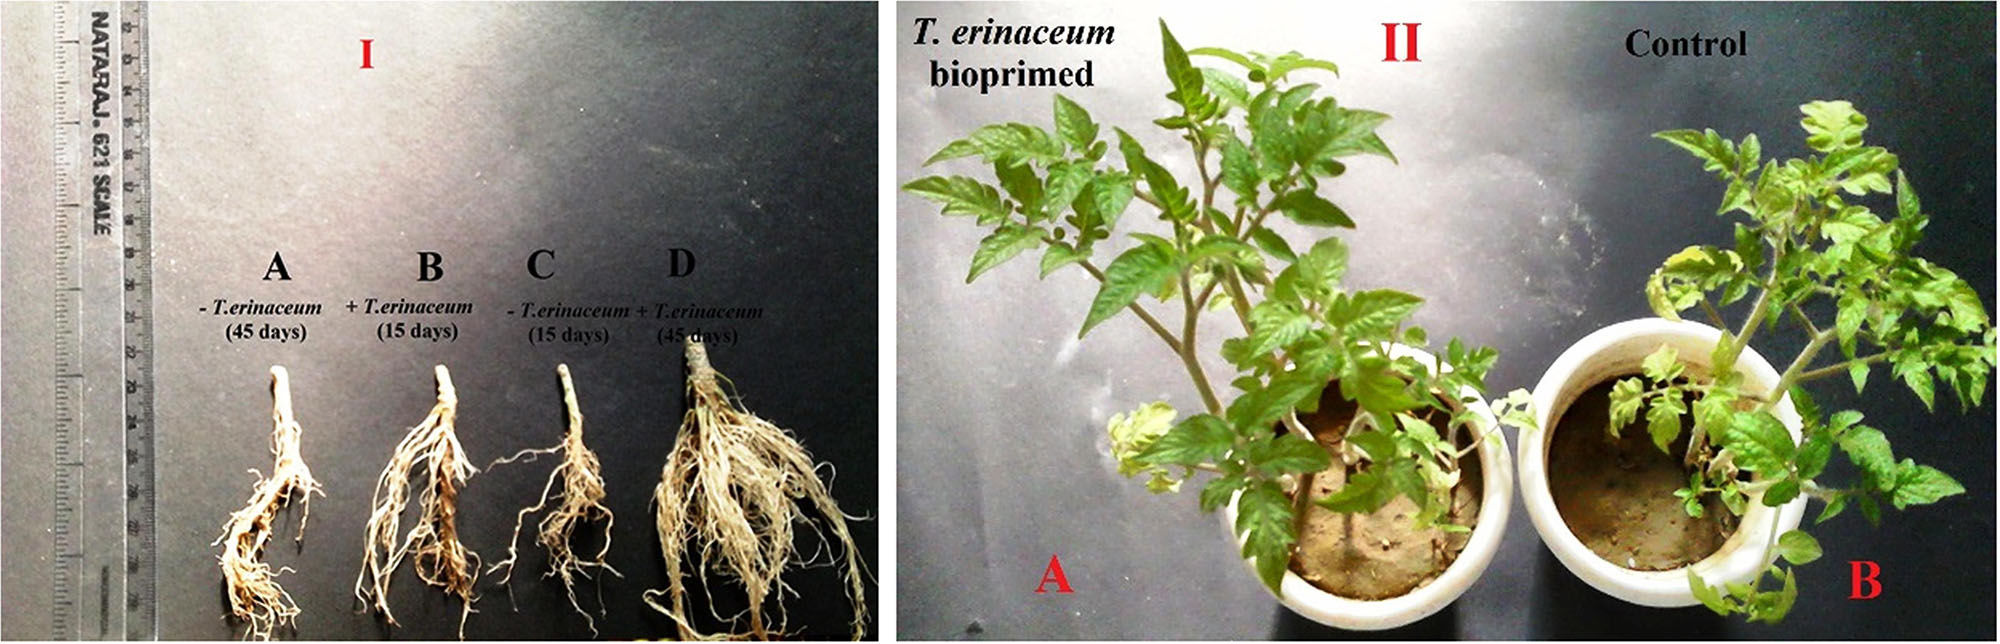
Figure 3. (I) Morphological growth characteristic of the T. erinaceum bioprimed and unprimed plants at two different intervals 15 and 45 days. The T. erinaceum bioprimed samples were found to have had profuse growth with increased plant height, root growth, stem diameter and number of leaves compared to control plants. (A) Picture showing root growth and thickness of stem at root-shoot junction after 45 days in the unprimed plants (B) T. erinaceum bioprimed plants after 15 days (C) T. erinaceum unprimed plants after 15 days (D) T. erinaceum bioprimed plants after 45 days. (II) (A) Pots showing the growth pattern and morphological parameters of unprimed (control) and T. erinaceum bioprimed plants.
Gene Prediction, Chromosomal Map and Cis-Acting DNA Regulatory Element Analysis
Based on Blast annotation results we predicted the genomic position of each characterized SlWRKY gene that comprised of “TSS”, exonic coding sequences (both CDSf and CDSl), and the “poly A” tail region across the whole tomato genome. The complete SlWRKY31 gene coding sequence including TSS and poly A tail have been represented (Supplementary Figure S1A). The presence of TSS and poly A in the entire coding sequence, and particularly, the TSS before the poly A region revealed that our gene of interest is present in a positive frame, and the gene prediction result is accurate. The promoter region lying upstream of the translational start site of the SlWRKY31 gene has been shown in Supplementary Figure S1B. The position of CDS encoding SlWRKY4 including TSS and poly A tail has been shown (Supplementary Figures S2A,C). Further, the upstream sequences lying SlWRKY4 and SlWRKY37 have been shown in Supplementary Figures S2B,D. We identified a genomic locus of 8606 bp that contains the SlWRKY4 gene, which is unambiguously mapped to a position on Chromosome (Chr) 3. Similarly, the genomic locus of 4065 and 3674 bp accommodated the SlWRKY31 and SlWRKY37 genes and were mapped on “Chr 6” and “Chr 1,” respectively. We found that besides W-box and other defense related elements, the promoter region of our characterized SlWRKY genes was flanked frequently with other abiotic stress-responsive elements like HSE, ABRE and MBS which clearly indicates their possible biological role in the management of abiotic stresses as well. The promoter region of tomato SlWRKY4 and SlWRKY37 genes have LTR, ABRE, ERE, MYB core elements. In contrast, the promoter region of tomato SlWRKY31 gene was characterized by the presence of TGA motifs, TCA element, and TATC box along with other common motifs. The different promoters with their sequences and relevant functions have been shown in Supplementary Table S2.
Gene Expression Analysis
The qRT-PCR studies unraveled the distinct temporal and the tissue-specific expression of tomato defense-related WRKY transcripts. In our previous study, we reported that during the Fol challenged conditions in tomato, a total of 16 different SlWRKY genes were involved in plant defense, of which only three WRKYs (SlWRKY4, SlWRKY31, and SlWRKY37) were shown to have had clear-cut differential expression (Aamir et al., 2018). In the present study, we have measured the tissue-specific and time-dependent response, measured in the form of gene expression profile changes (Figure 4). The quantitative and semiquantitative expression of WRKYs were measured in terms of relative fold change in expression values compared to control tissues under the defined condition Fol treated (Aamir et al., 2018); T. erinaceum (bioprimed) and co-inoculated with both Fol + T. erinaceum challenged tissues, and the results were compared with unprimed (control) tissues. In the qPCR analysis, we found negative regulation (down regulation) of SlWRKY4 in all the treatments in both root (Figure 4A) and leaf tissue samples (Figure 4D). However, the highest repression of the SlWRKY4 was observed in root (24 h) and leaf (48 h) tissues with 0.03 and 0.08 fold decrease in T. erinaceum primed plants followed by Fol+ T. erinaceum treatments. In contrast, we found increased expression of SlWRKY31 gene in T. erinaceum bioprimed plants (14.83 fold) in root tissues (at 48 h) followed by Fol + T. erinaceum treatments (Figure 4B). In leaf tissues, a similar trend of expression was recorded, however; upregulation in both genes was comparatively less than root tissues (Figure 4E). Interestingly, our results showed Fol + T. erinaceum bioprimed plants had an aggravated defense response as measured from the upregulated transcript profile of SlWRKY31 and SlWRKY37. At early stages of treatments (0–24 h), we found increased expression of SlWRKY31 and SlWRKY37 in root tissues (Figure 4C). However, the expression of SlWRKY31 in leaf tissues (at 0–24 h) was recorded to be comparatively less than roots. Further, one major contrasting difference recorded was that the expression of SlWRKY37 in root tissue was less (0–24 h) than the leaf tissue of the same duration in T. erinaceum primed treatments. However, the expression in bioprimed samples further increases sharply in root tissues and decreases abruptly in leaf tissues (24–48 h). The Fol+T. erinaceum challenged samples showed the greatest change at 48 h in root tissue whereas a more or less similar expression trend was observed in leaf tissues (Figure 4F). However, in leaf tissues, the highest upregulation was observed in the transcript profile of SlWRKY31 and SlWRKY37 in T. erinaceum bioprimed tissues, explicitly, with 21.19 fold (SlWRKY31) and 14.07 fold (SlWRKY37) respectively. In this way, the results suggested that SlWRKY31 and SlWRKY37 function as a positive regulator and SlWRKY4 as a negative regulator of plant defense programmed against the Fol challenged condition with a more aggressive defense response in Trichoderma pre-primed plants compared to non-primed plants.
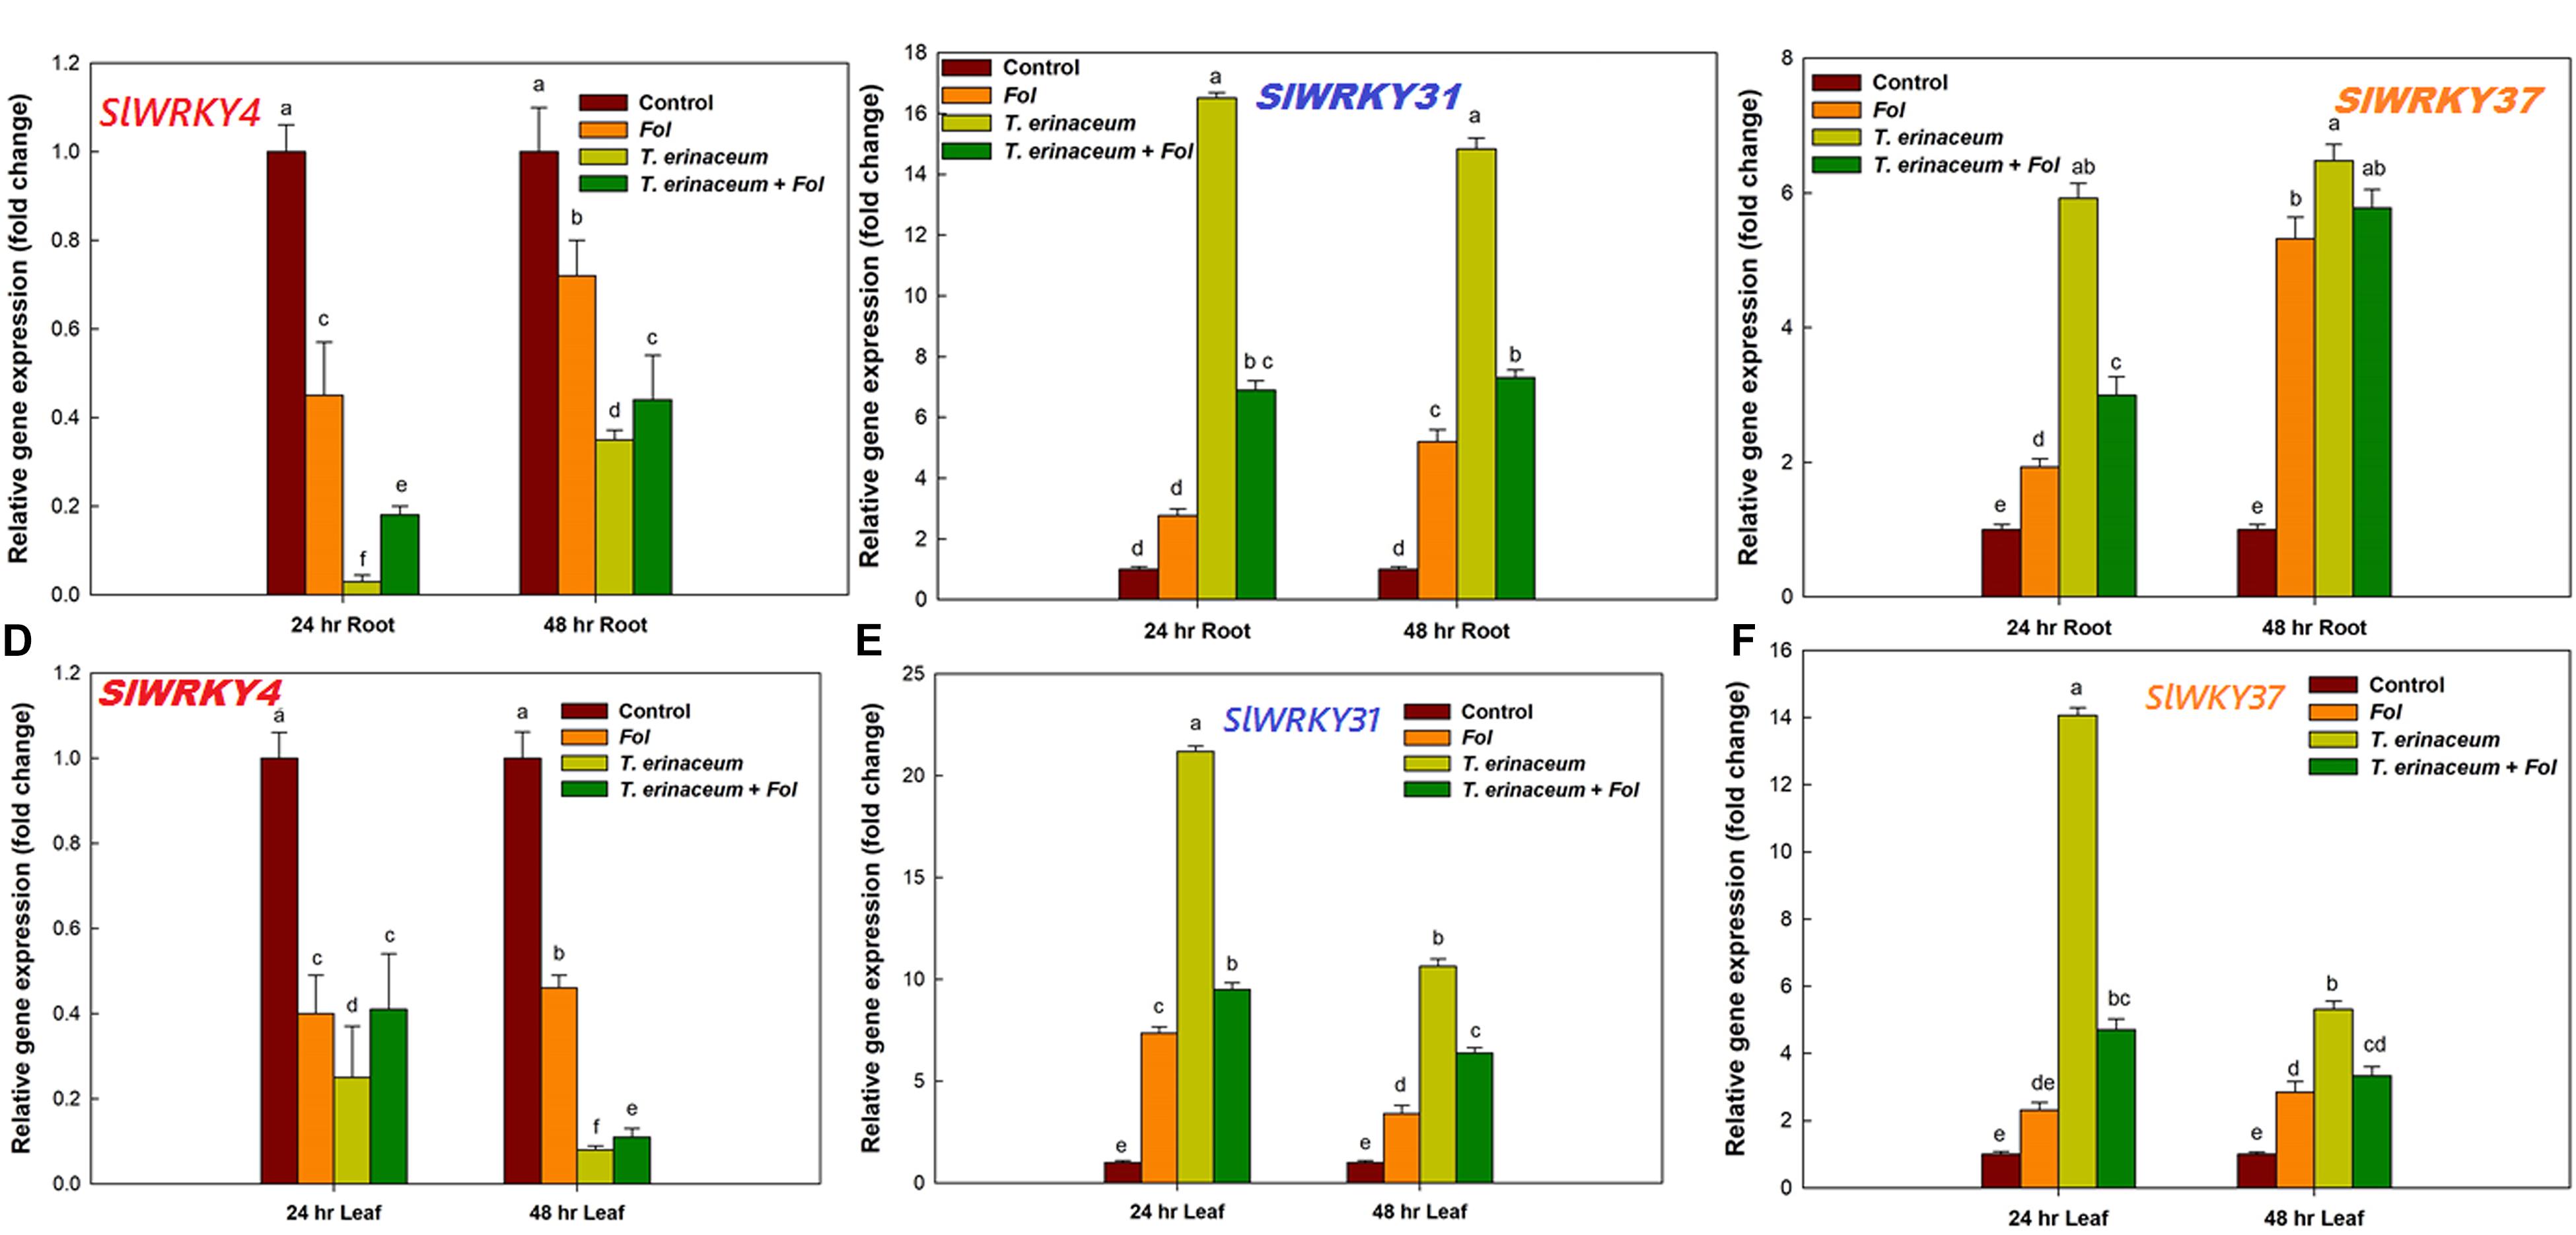
Figure 4. Quantitative PCR results showing the tissue specific and time bound differential expression of tomato WRKY genes in all the four defined conditions measured at different time intervals (0, 24, and 48 h). (A) The quantitative expression of SlWRKY4 gene in root tissues data showing the relative change in expression values (fold change). (B) The relative fold change in expression value for SlWRKY31 (previously named as SlWRKY33A; SlDRW1) expressed in tomato roots. (C) The relative fold change in expression value for SlWRKY37 gene expressed in root tissues. (D) Relative fold change in expression values for SlWRKY4 expressed in tomato leaves. (E) The expression data for SlWRKY31 in leaves. (F) The expression data for SlWRKY37 in leaf tissues. The SlWRKY4 genes were found to be downregulated in both root and leaf tissues. Bars with distinct alphabetical letters are significantly different at P ≤ 0.05 applying the DMRT test.
We also checked the expression profile changes of the genes encoding transcripts involved in the cellular anti-oxidative defense mechanism. It was found that an upregulated expression of the SOD gene was recorded in Fol + T. erinaceum challenged root tissues (Figure 5A) compared to leaf tissues of the same time interval (Figure 5C). However, the expression of the SOD gene was more pronounced in Fol+ T. erinaceum treated plants, and highest expression with 6.84 fold (leaves) and 5.88 fold (root) increase was recorded in Fol +T. erinaceum challenged samples analyzed at 48 h. We found upregulated transcripts of SlGPX1 in all treatments in root tissues measured at a different time interval (0, 24, and 48 h). However, the highest expression of SlGPX1 was reported in the Fol+ T. erinaceum treated root tissues (Figure 5B) and to some extent in leaf tissues. Comparatively, T. erinaceum bioprimed leaf tissues were found to have more or less similar expression profiles at 24–48 h (Figure 5D). Further, the increased expression of PR-3 protein (chitinases) was found at initial hours (0–24 h) in T. erinaceum bioprimed followed by Fol+ T. erinaceum challenged root tissues (Figure 6A). In contrast, the highest upregulation transcript profile of chitinases in leaf tissues was recorded in T. erinaceum bioprimed samples with 16.39 and 27.57 fold increase at 24 and 48 h, respectively (Figure 6C). Further, an increasing trend similar to chitinases in expression profile of PR-2 (glucanases) was reported in T. erinaceum and Fol+T. erinaceum bioprimed root tissues (Figure 6B). In the case of leaf tissues, decreased expression of glucanases was recorded in all the tissue samples analyzed except T. erinaceum bioprimed leaf tissues (Figure 6D).
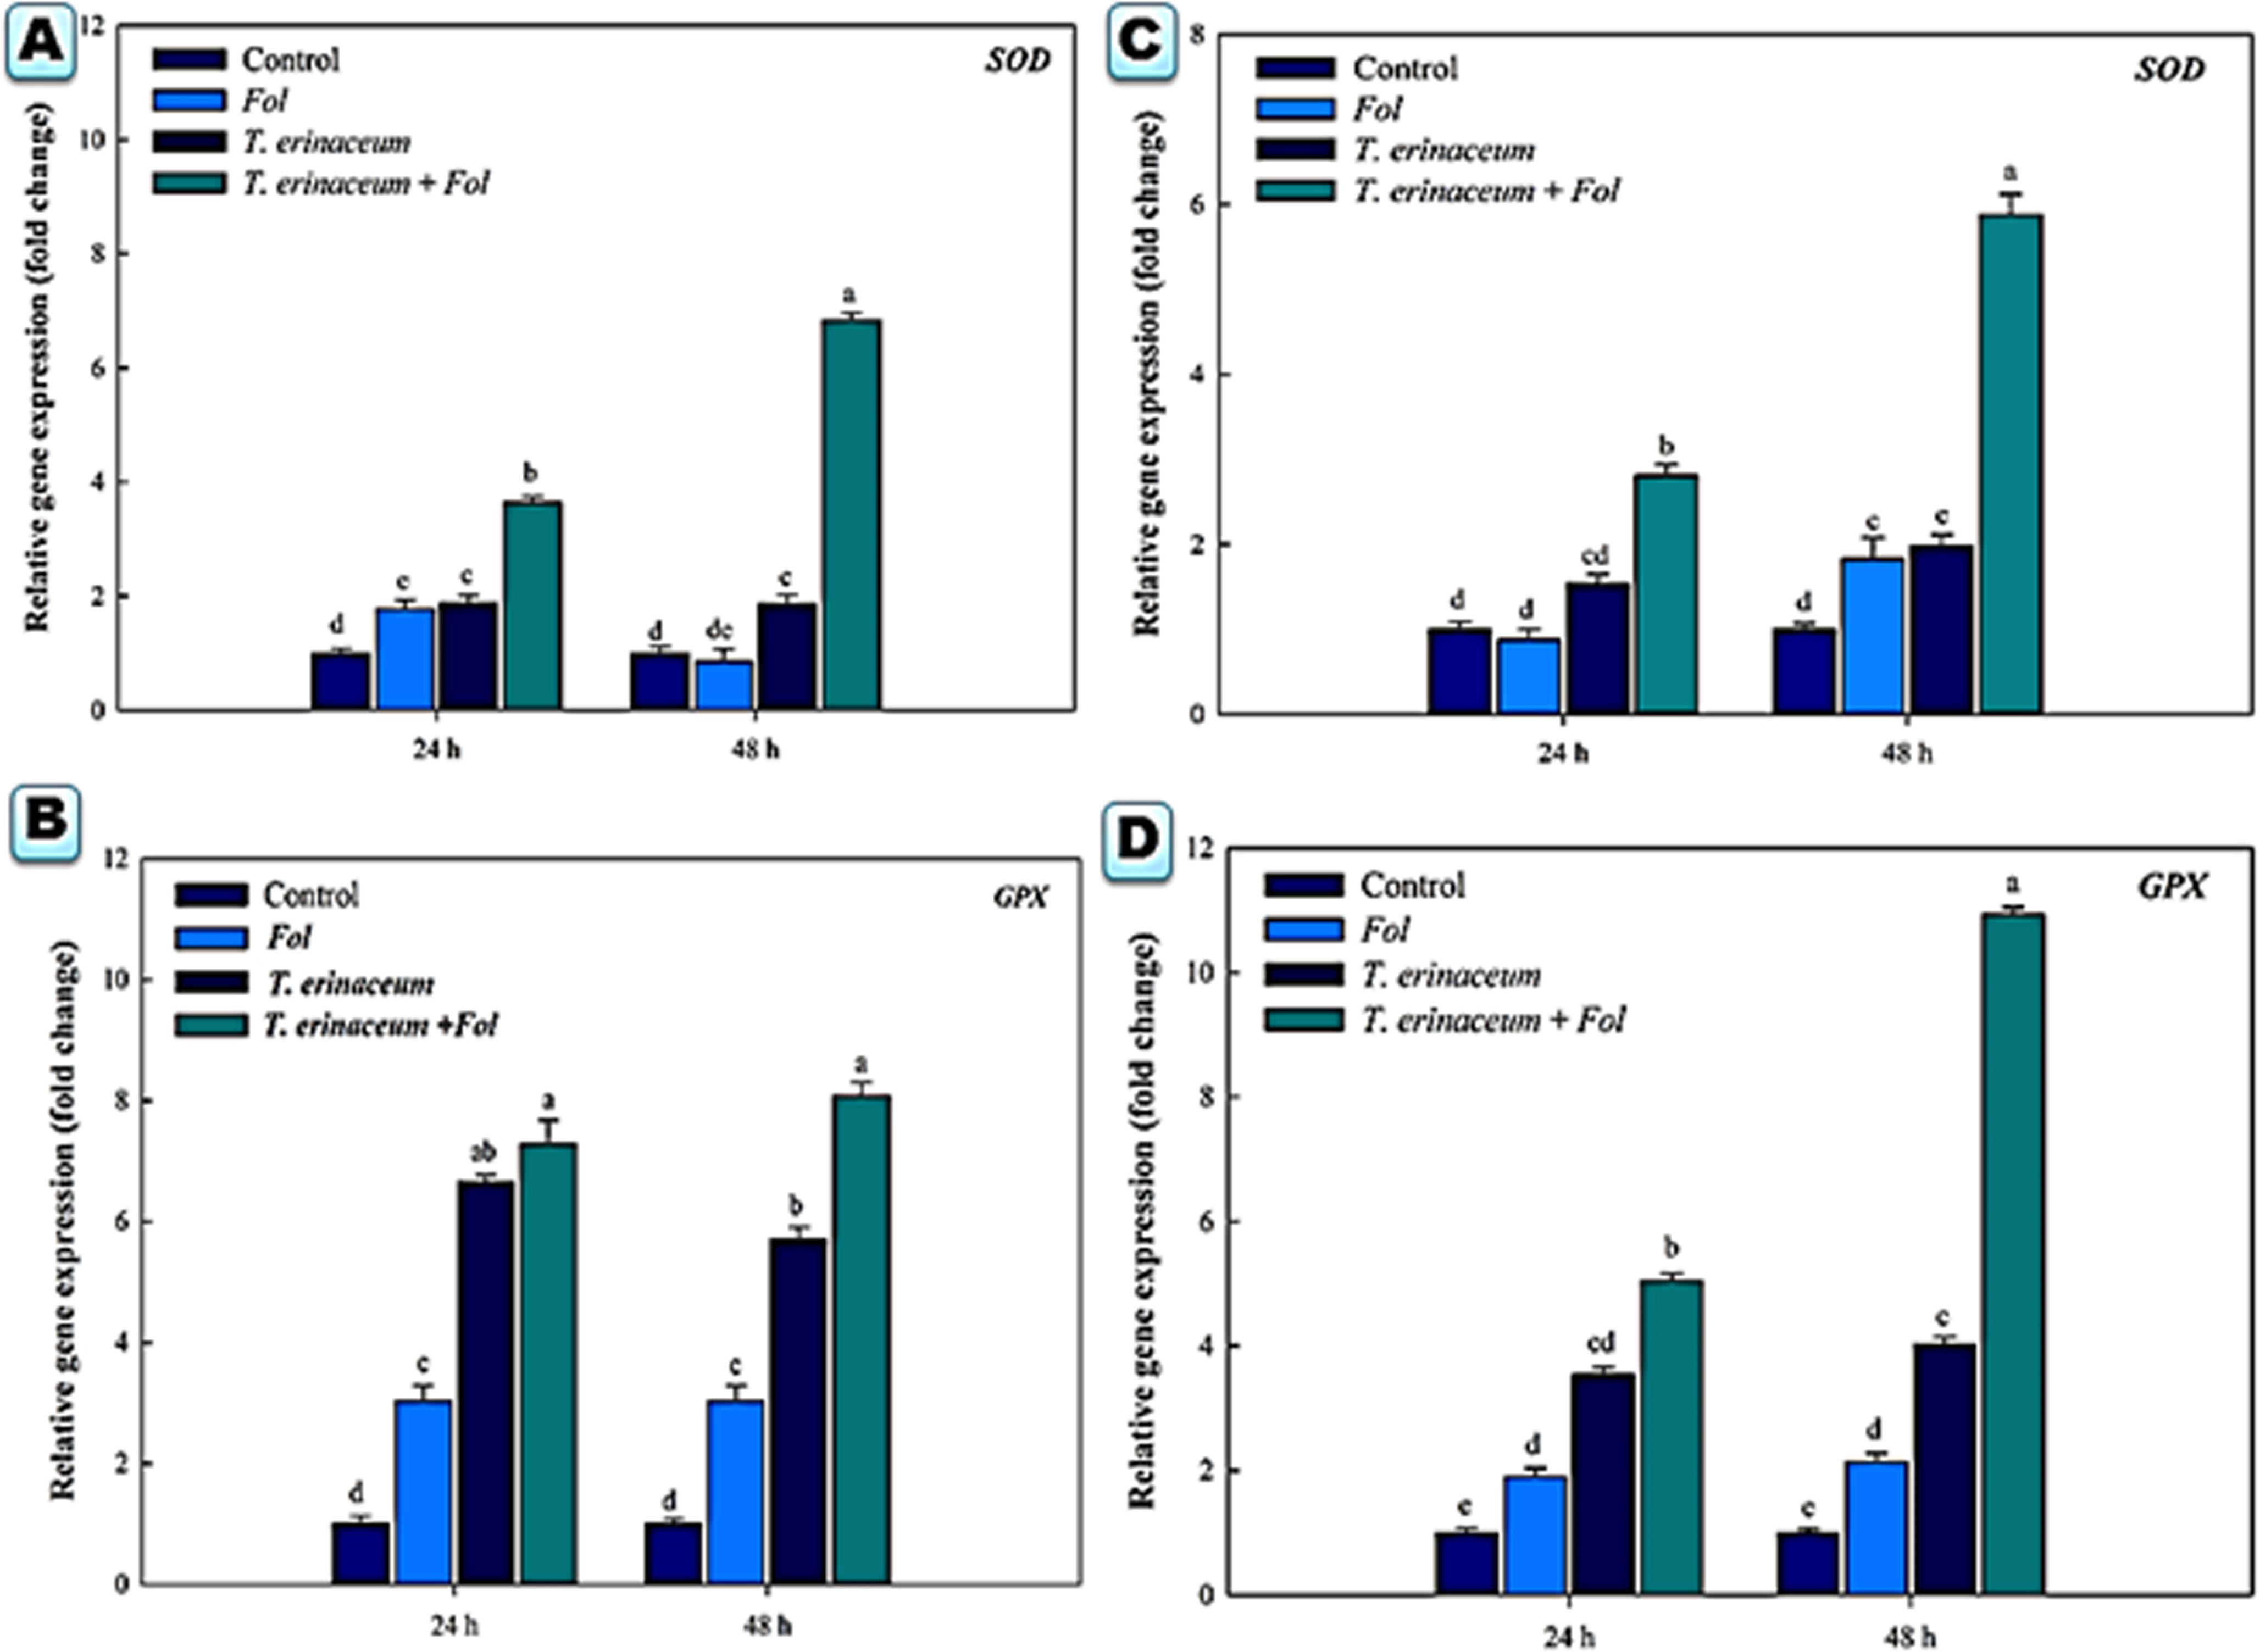
Figure 5. Quantitative PCR results showing the tissue specific differential expression profile changes of the Cu-Zn SOD and glutathione peroxidase encoding gene SlGPX1 genes expressed in the root and leaf tissues and were measured at time intervals (0, 24, and 48 h) in each of the four different treatments. The data represents the relative fold changes in the expression values for the four different treatments. (A) The expression profile of the SOD gene in the root tissues. (B) The expression profile of the SlGPX1 gene in the root tissues. (C) The gene expression profile of the SOD gene in leaf tissues. (D) The expression profile of the SlGPX1 gene in leaf tissues. Bars with distinct alphabetical letters are significantly different at P ≤ 0.05 using the DMRT test.
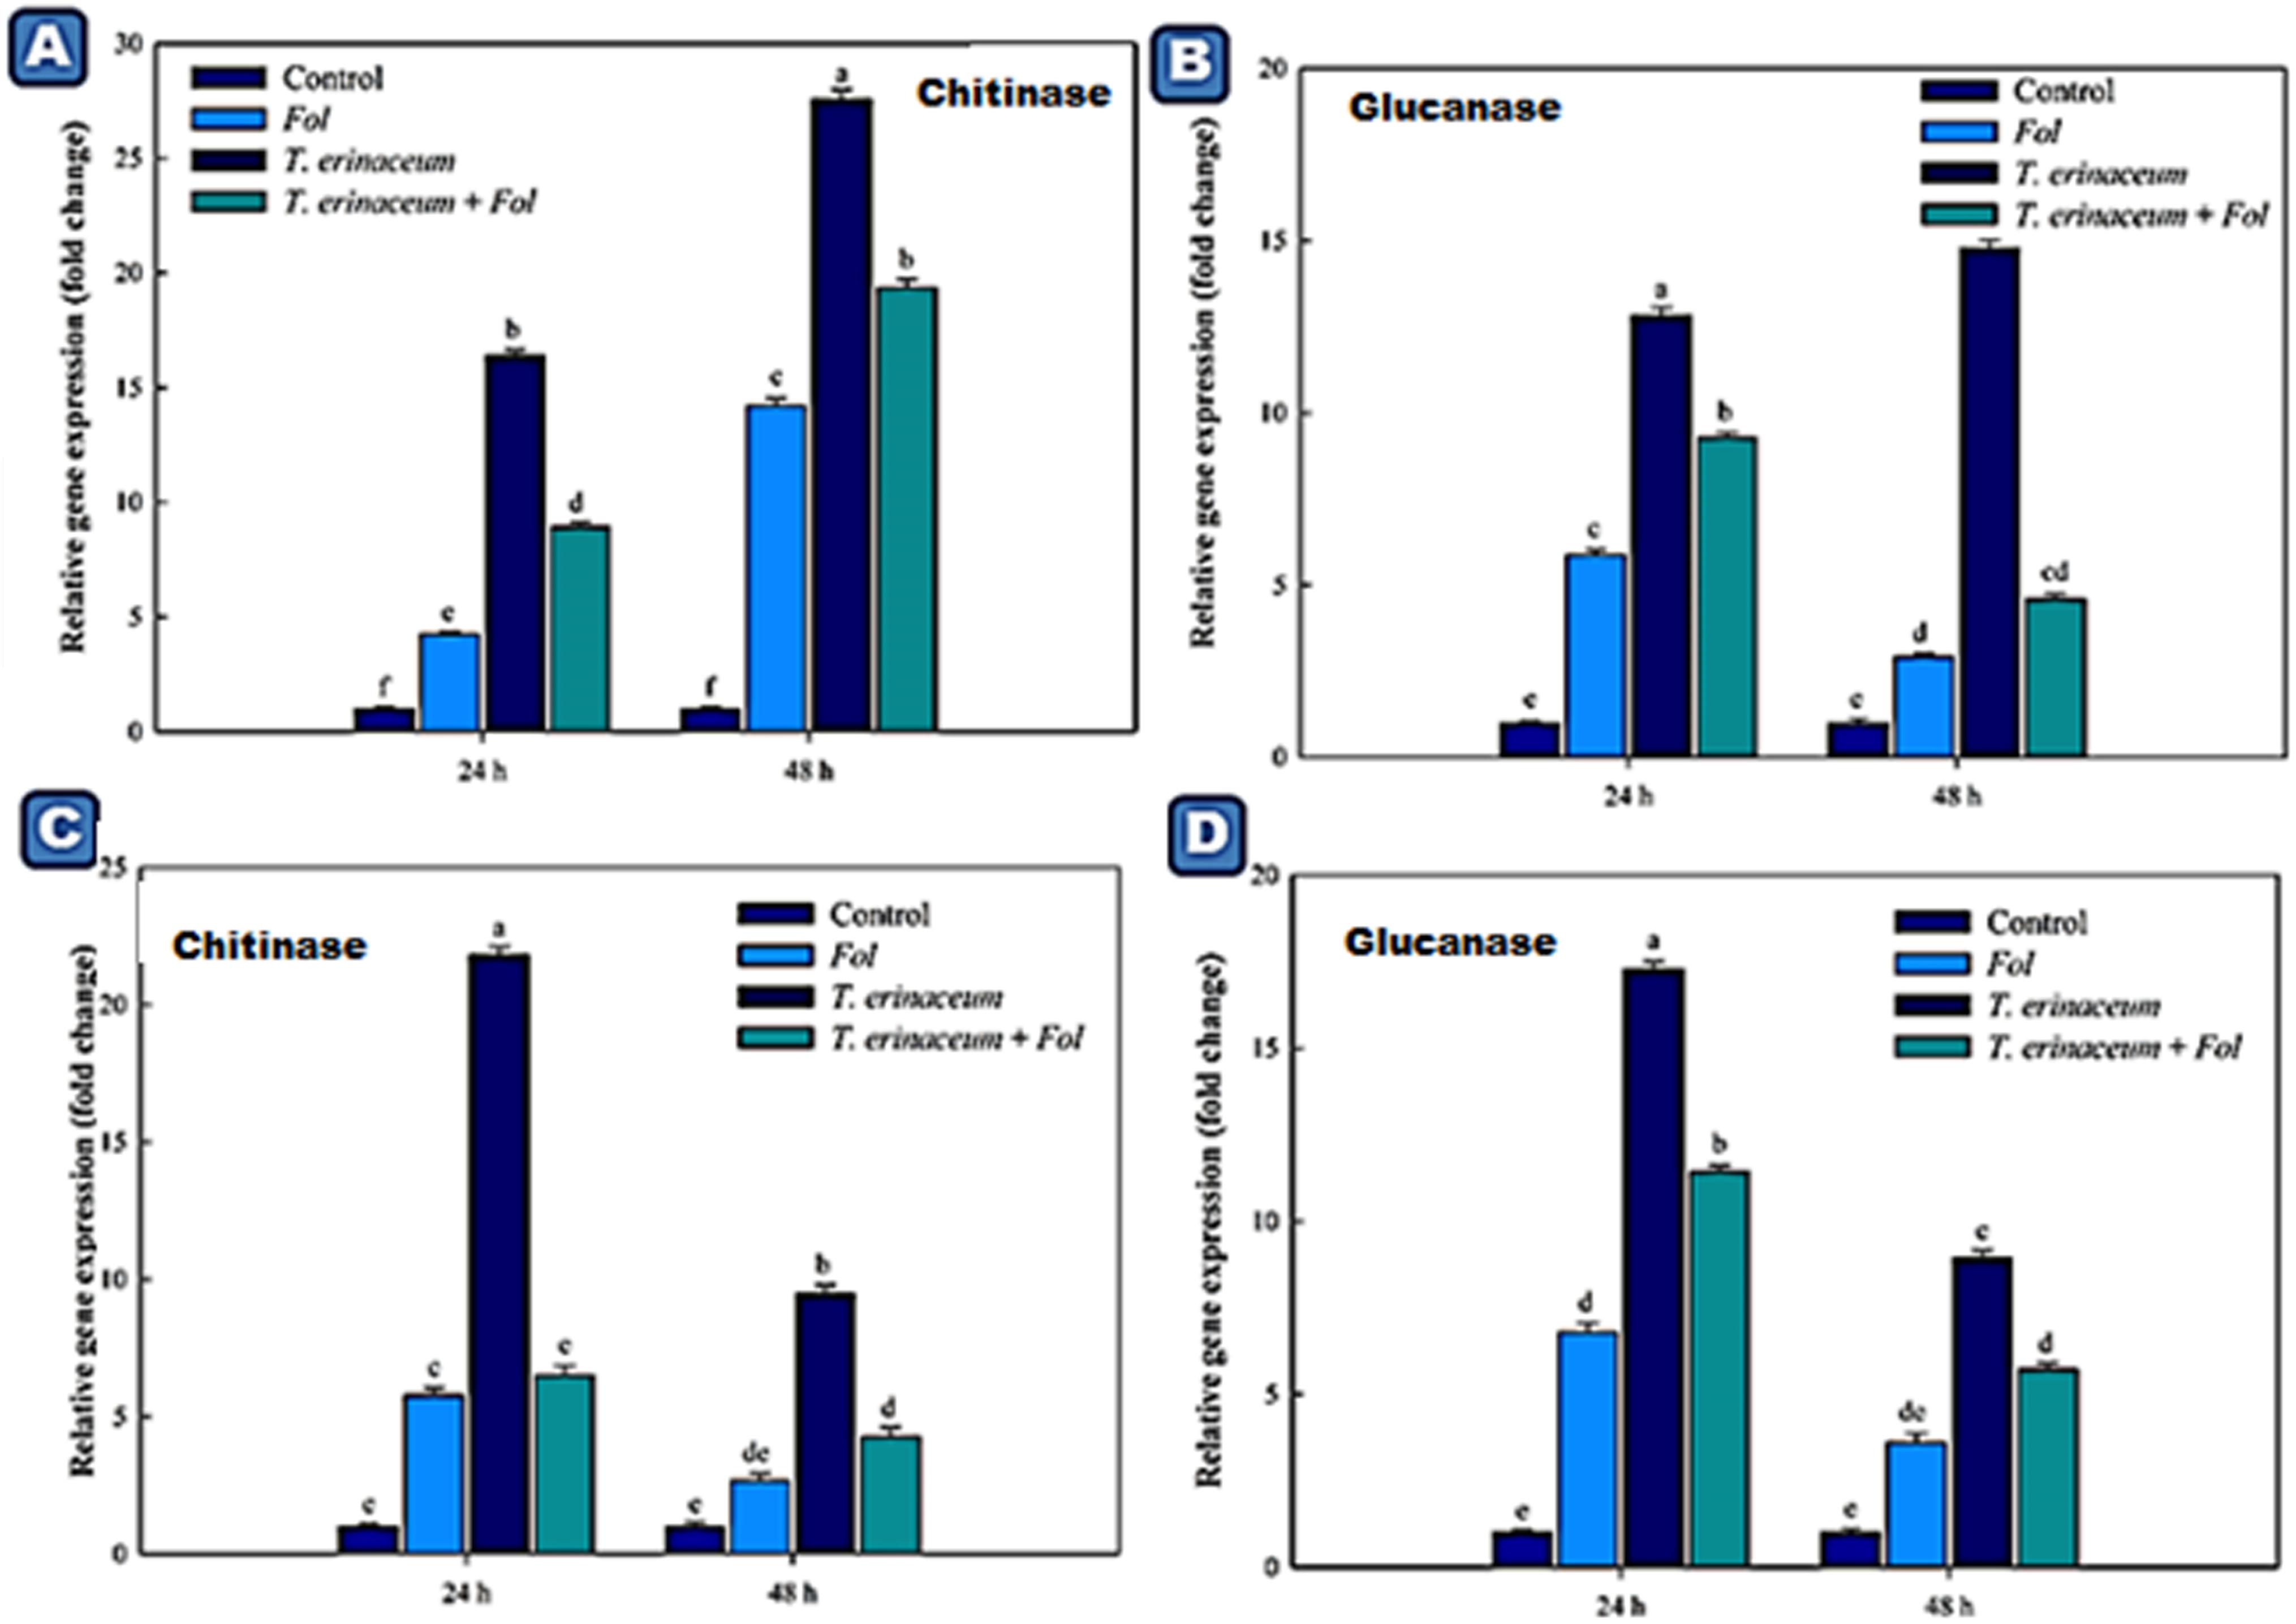
Figure 6. Quantitative PCR results showing the tissue specific differential expression of the genes encoding PR proteins (Chitinases and Glucanases) expressed in the root and leaf tissues and were measured at different time intervals (0, 24, and 48 h). The data represents the relative fold changes in the expression values for the four different treatments. (A) The expression profile of chitinase encoding gene (CHI1) expressed in the leaf tissues. (B) The expression profile of the glucanases encoding gene expressed in the leaf tissues. (C) The expression profile of the chitinase encoding gene in the root tissues. (D) The expression profile of the glucanase encoding gene in the root tissues and were measured at different time intervals. Bars with distinct alphabetical letters are significantly different at P ≤ 0.05 using the DMRT test.
The semi-quantitative expression of each WRKY gene at different time intervals and in different tissue has been shown (Supplementary Figures S3A–D). The semi-quantitative expression of Cu/Zn-superoxide dismutase has been shown in Supplementary Figure S3E. The semi-quantitative expression of SlGPX1, Chitinase and β-1, 3 glucanases with respect to internal constitutive ACTIN gene have been shown (Supplementary Figures S4A–C). We have further analyzed the replicative count data for leaf tissue samples at 48 h through Bioconductor R for the Fol challenged, T. erinaceum bioprimed, Fol+ T. erinaceum bioprimed and unprimed control samples. The differential expression of the replicated count data was analyzed using the fold change expression values through Bioconductor R and have been represented in the form of heat map diagramme. The heat map diagramme for WRKYs expression profile changes in root tissue at different time intervals (0–48 h) has been shown (Figures 7A–D). The heat map diagramme for showing the relative expression values for SOD, SlGPX1, Chitinase and β-1, 3 glucanases in both root and leaf tissues for all the four defined conditions at different time intervals (24 and 48 h) has been shown in Figures 8A,B.
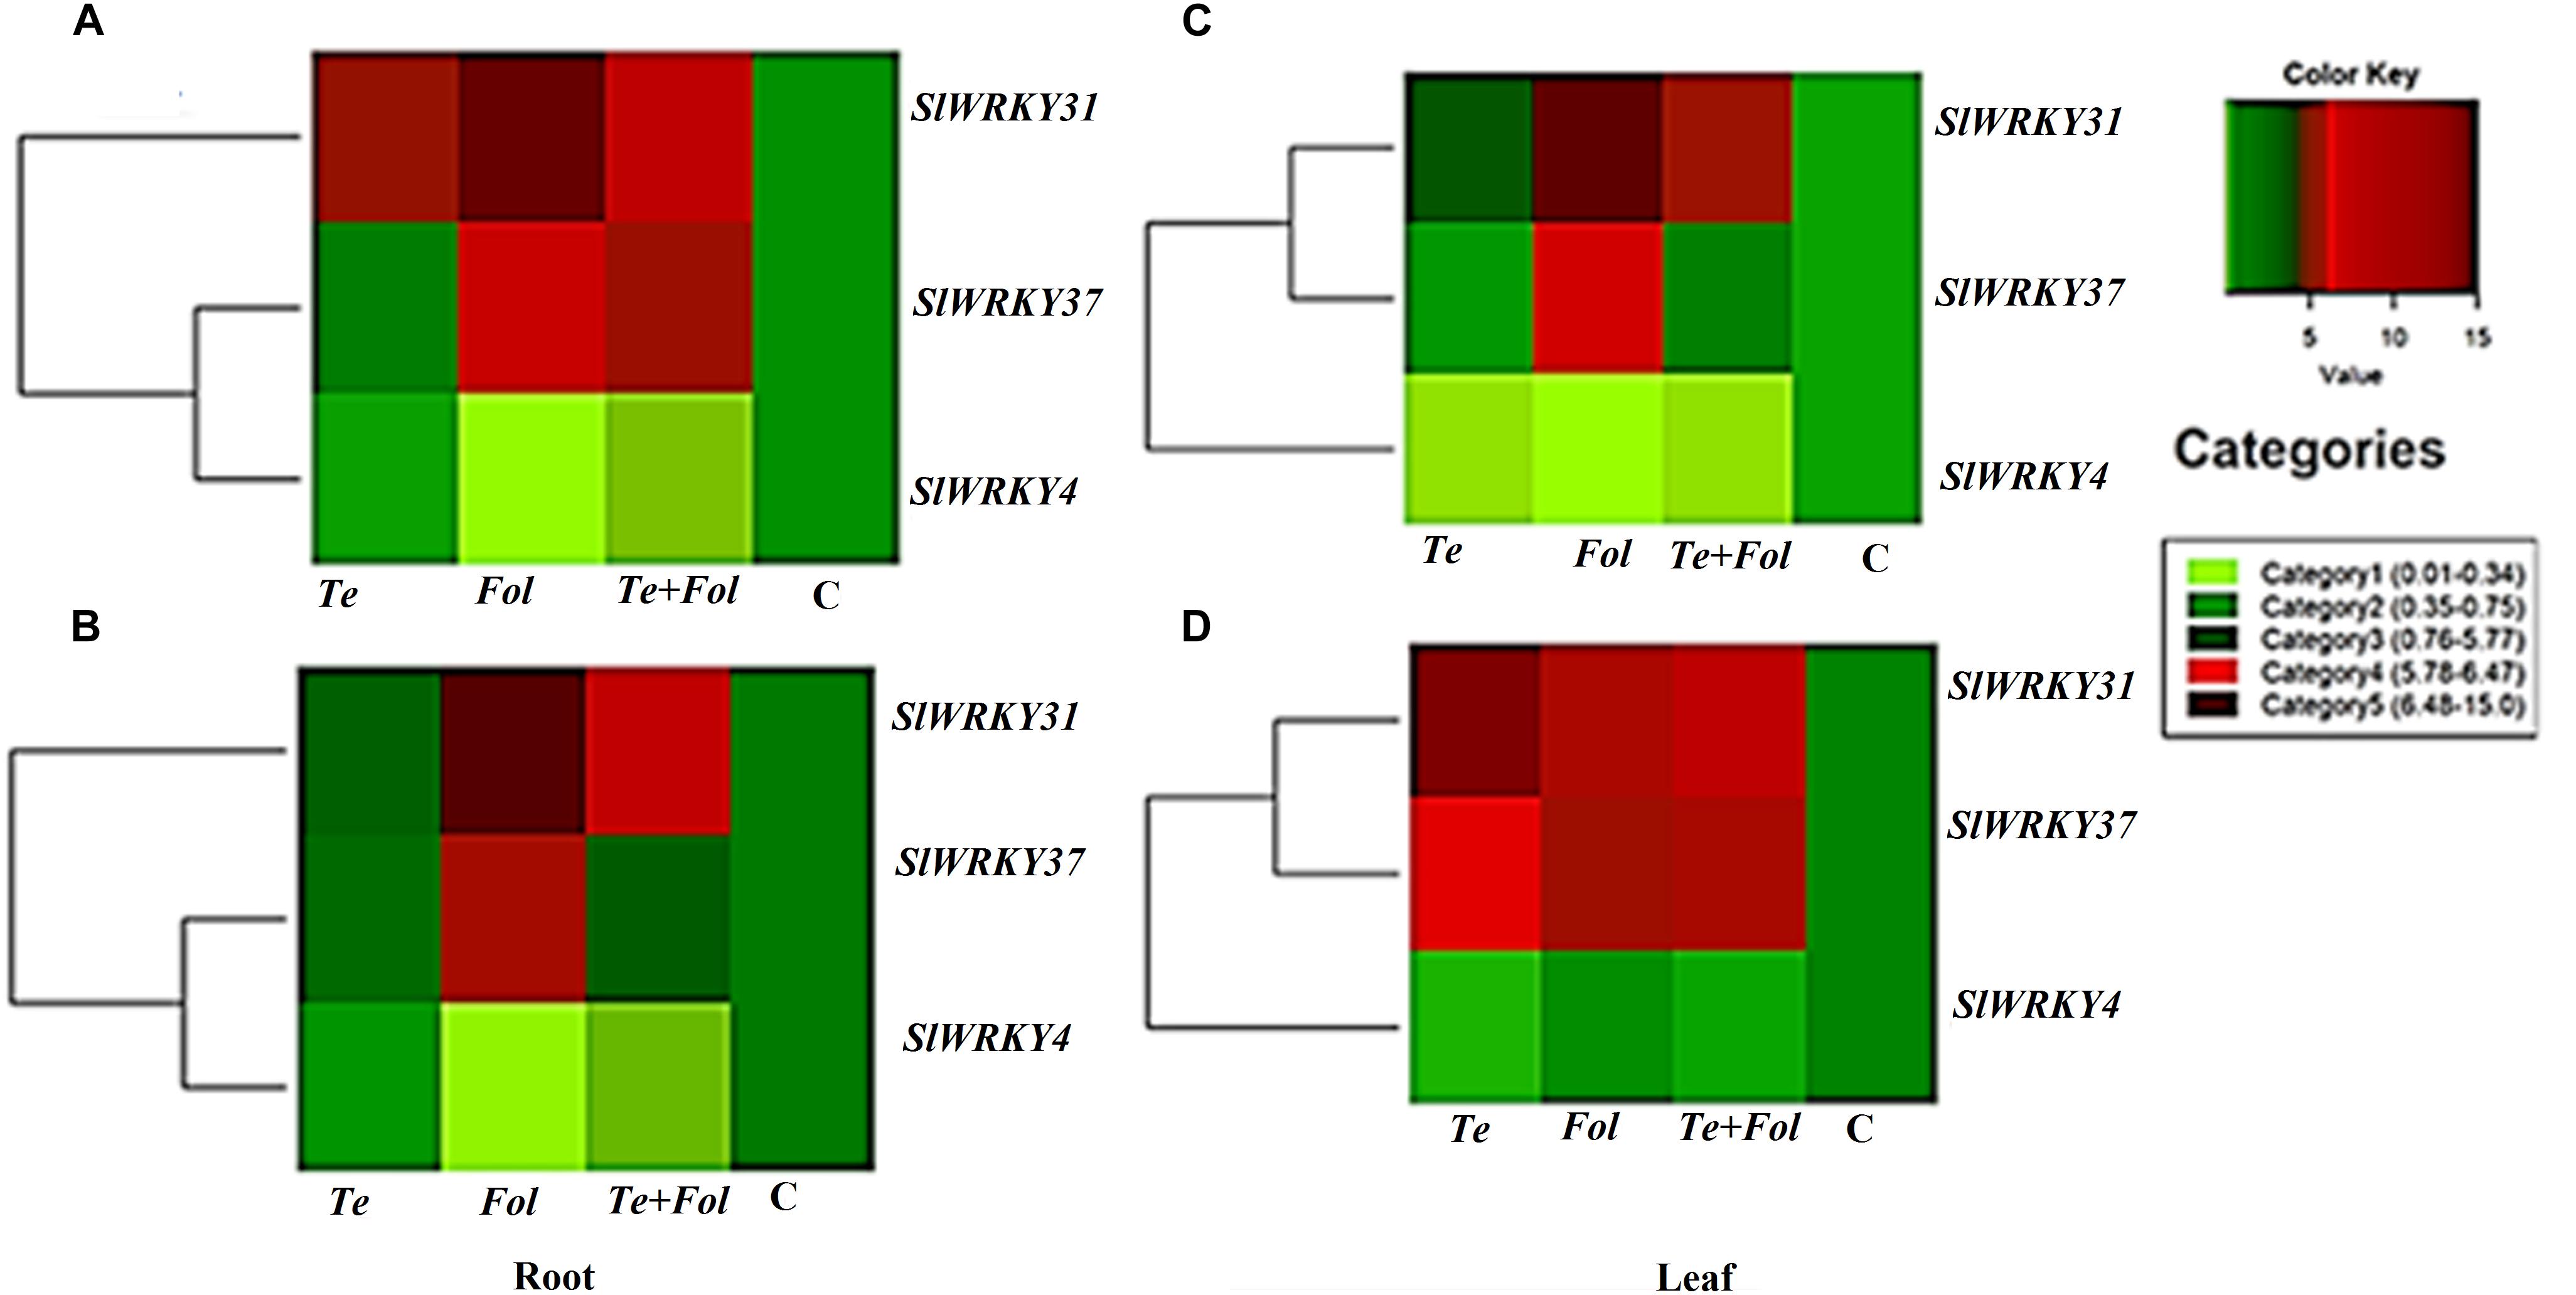
Figure 7. Heat map and clustering analysis of tomato WRKY genes expressed under the four different treatment conditions. The figure includes a “heat map” which is the part of the figure having different colors (red, green, and maroon) along with dendrogram. The rows represent genes while the treatments are shown as columns. The row dendrogram represents the gene clusters with similar pattern. The expression levels are mapped on the color scale provided at the right top of the figure along with the categories scale on the right. (A) The heat map showing the expression profile changes of the SlWRKY4, SlWRKY31, and the SlWRKY37 genes in each of the four different treatments at 24 h in root tissues. (B) The heat map showing the expression profile changes of the SlWRKY4, SlWRKY31, and the SlWRKY37 genes root tissues at 48 h. (C) The heat map showing the expression profile changes of the SlWRKY4, SlWRKY31, and the SlWRKY37 genes in the leaf tissues at 24 h. (D) The heat map showing the expression profile changes of the SlWRKY4, SlWRKY31, and SlWRKY37 genes in the leaf tissues at 48 h.
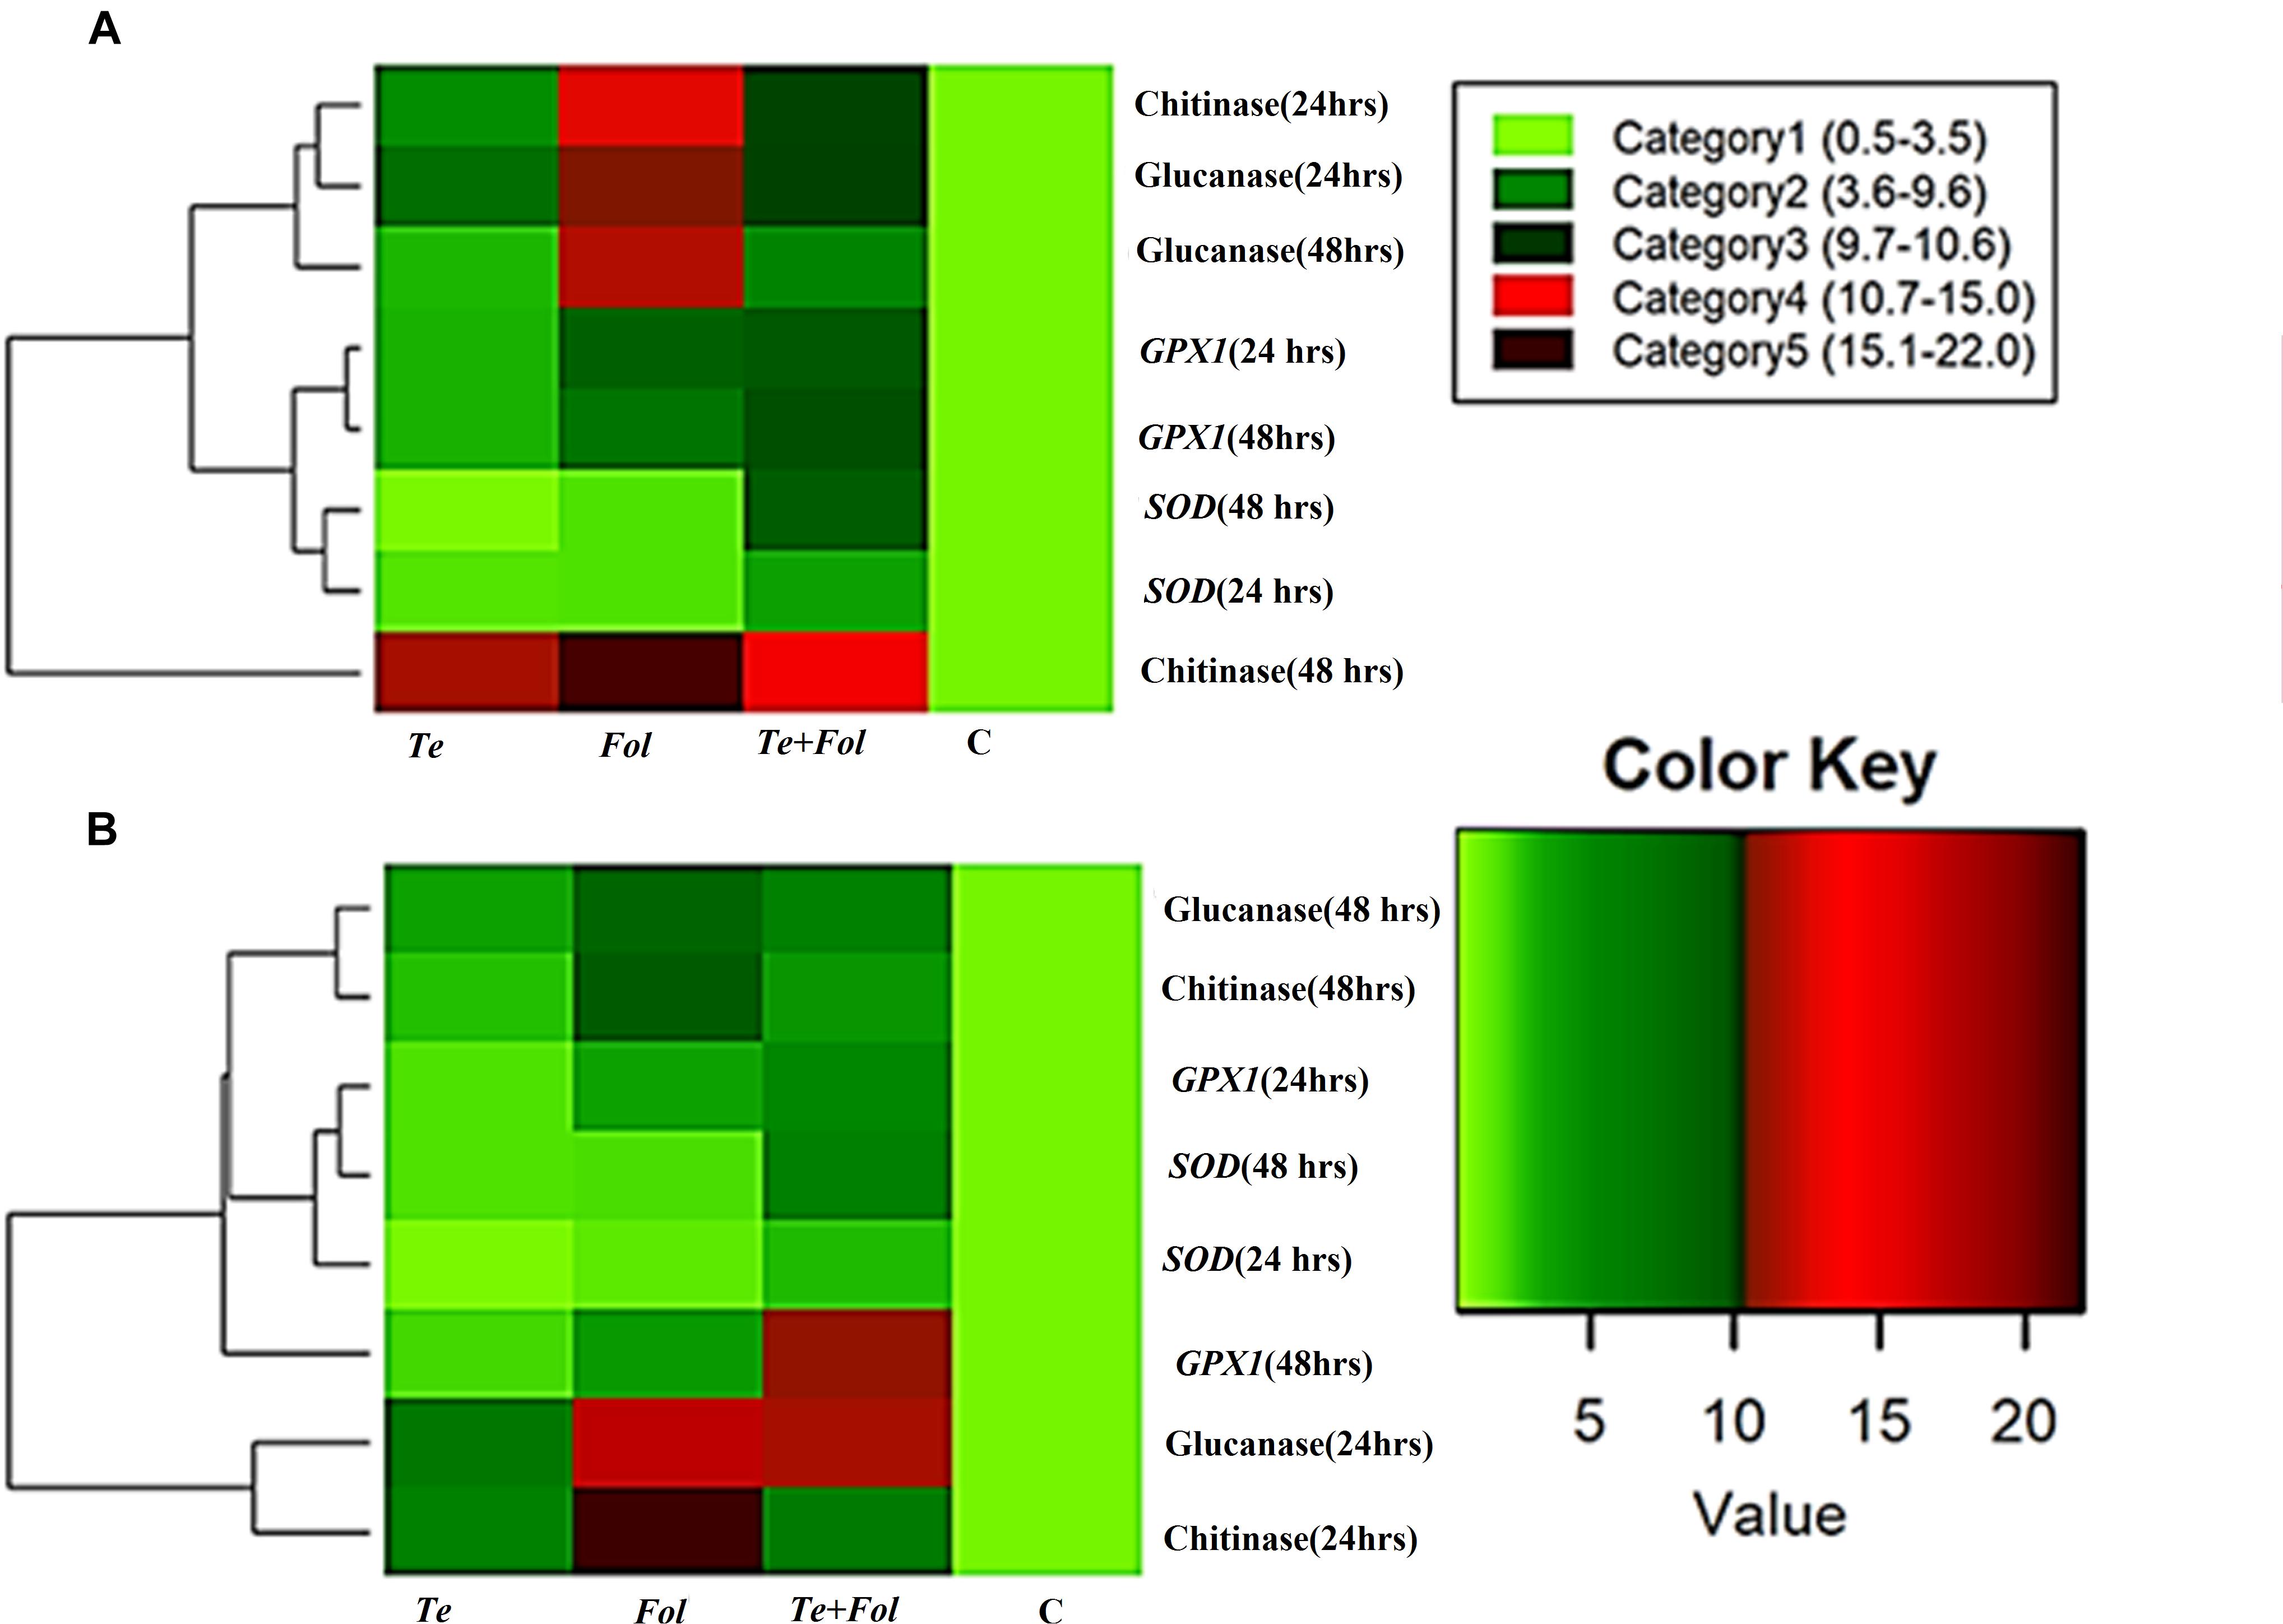
Figure 8. Heat map and clustering analysis of PR proteins and antioxidative defense genes in tomato. The rows represent the expression profile of defense related antioxidative genes and those encoding for PR proteins (chitinase and glucanase) that were expressed in a time-dependent and tissue-specific manner while the treatments are shown as columns. The row dendrogram represents the gene clusters with similar pattern. (A) The heat map showing the expression profile changes of the genes encoding for the PR proteins (chitinases and the glucanases) and antioxidative enzymes including SOD and SlGPX1 in each of the four different treatments at 0, 24, and 48 h in the root tissues. (B) The heat map showing the expression profile changes at 0, 24, and 48 h in leaf tissues.
Quantitative Estimation of H2O2
The amount of H2O2 produced and accumulated was significantly higher in Fol challenged plants and was greatly reduced in the plants pretreated with T. erinaceum as compared to Fol+T. erinaceum treated samples. It was found that the amount of H2O2 produced was significantly higher at 48 h than recorded at early phases (0–24 h) of Fol inoculation. After 48 h post inoculation we did not find any further increase in the amount of H2O2 which confirmed the role of antioxidative defense enzymes under Fol challenged conditions. However, the amount of H2O2 generated and accumulated increased slowly in the leaves of all treatments but this rise was comparatively less than that observed in Fol + T. erinaceum treated samples (Figure 9A). Furthermore, it was found that the amount of H2O2 produced increased gradually from 0 to 24 h, was highest at 48 h and then declined successively in all the treatments. H2O2 content was 23.60% less in the Fol + T. erinaceum treated plants at 48 h when compared with Fol challenged plants. In T. erinaceum treated plants, it was 32.06% lesser than the Fol challenged plants.
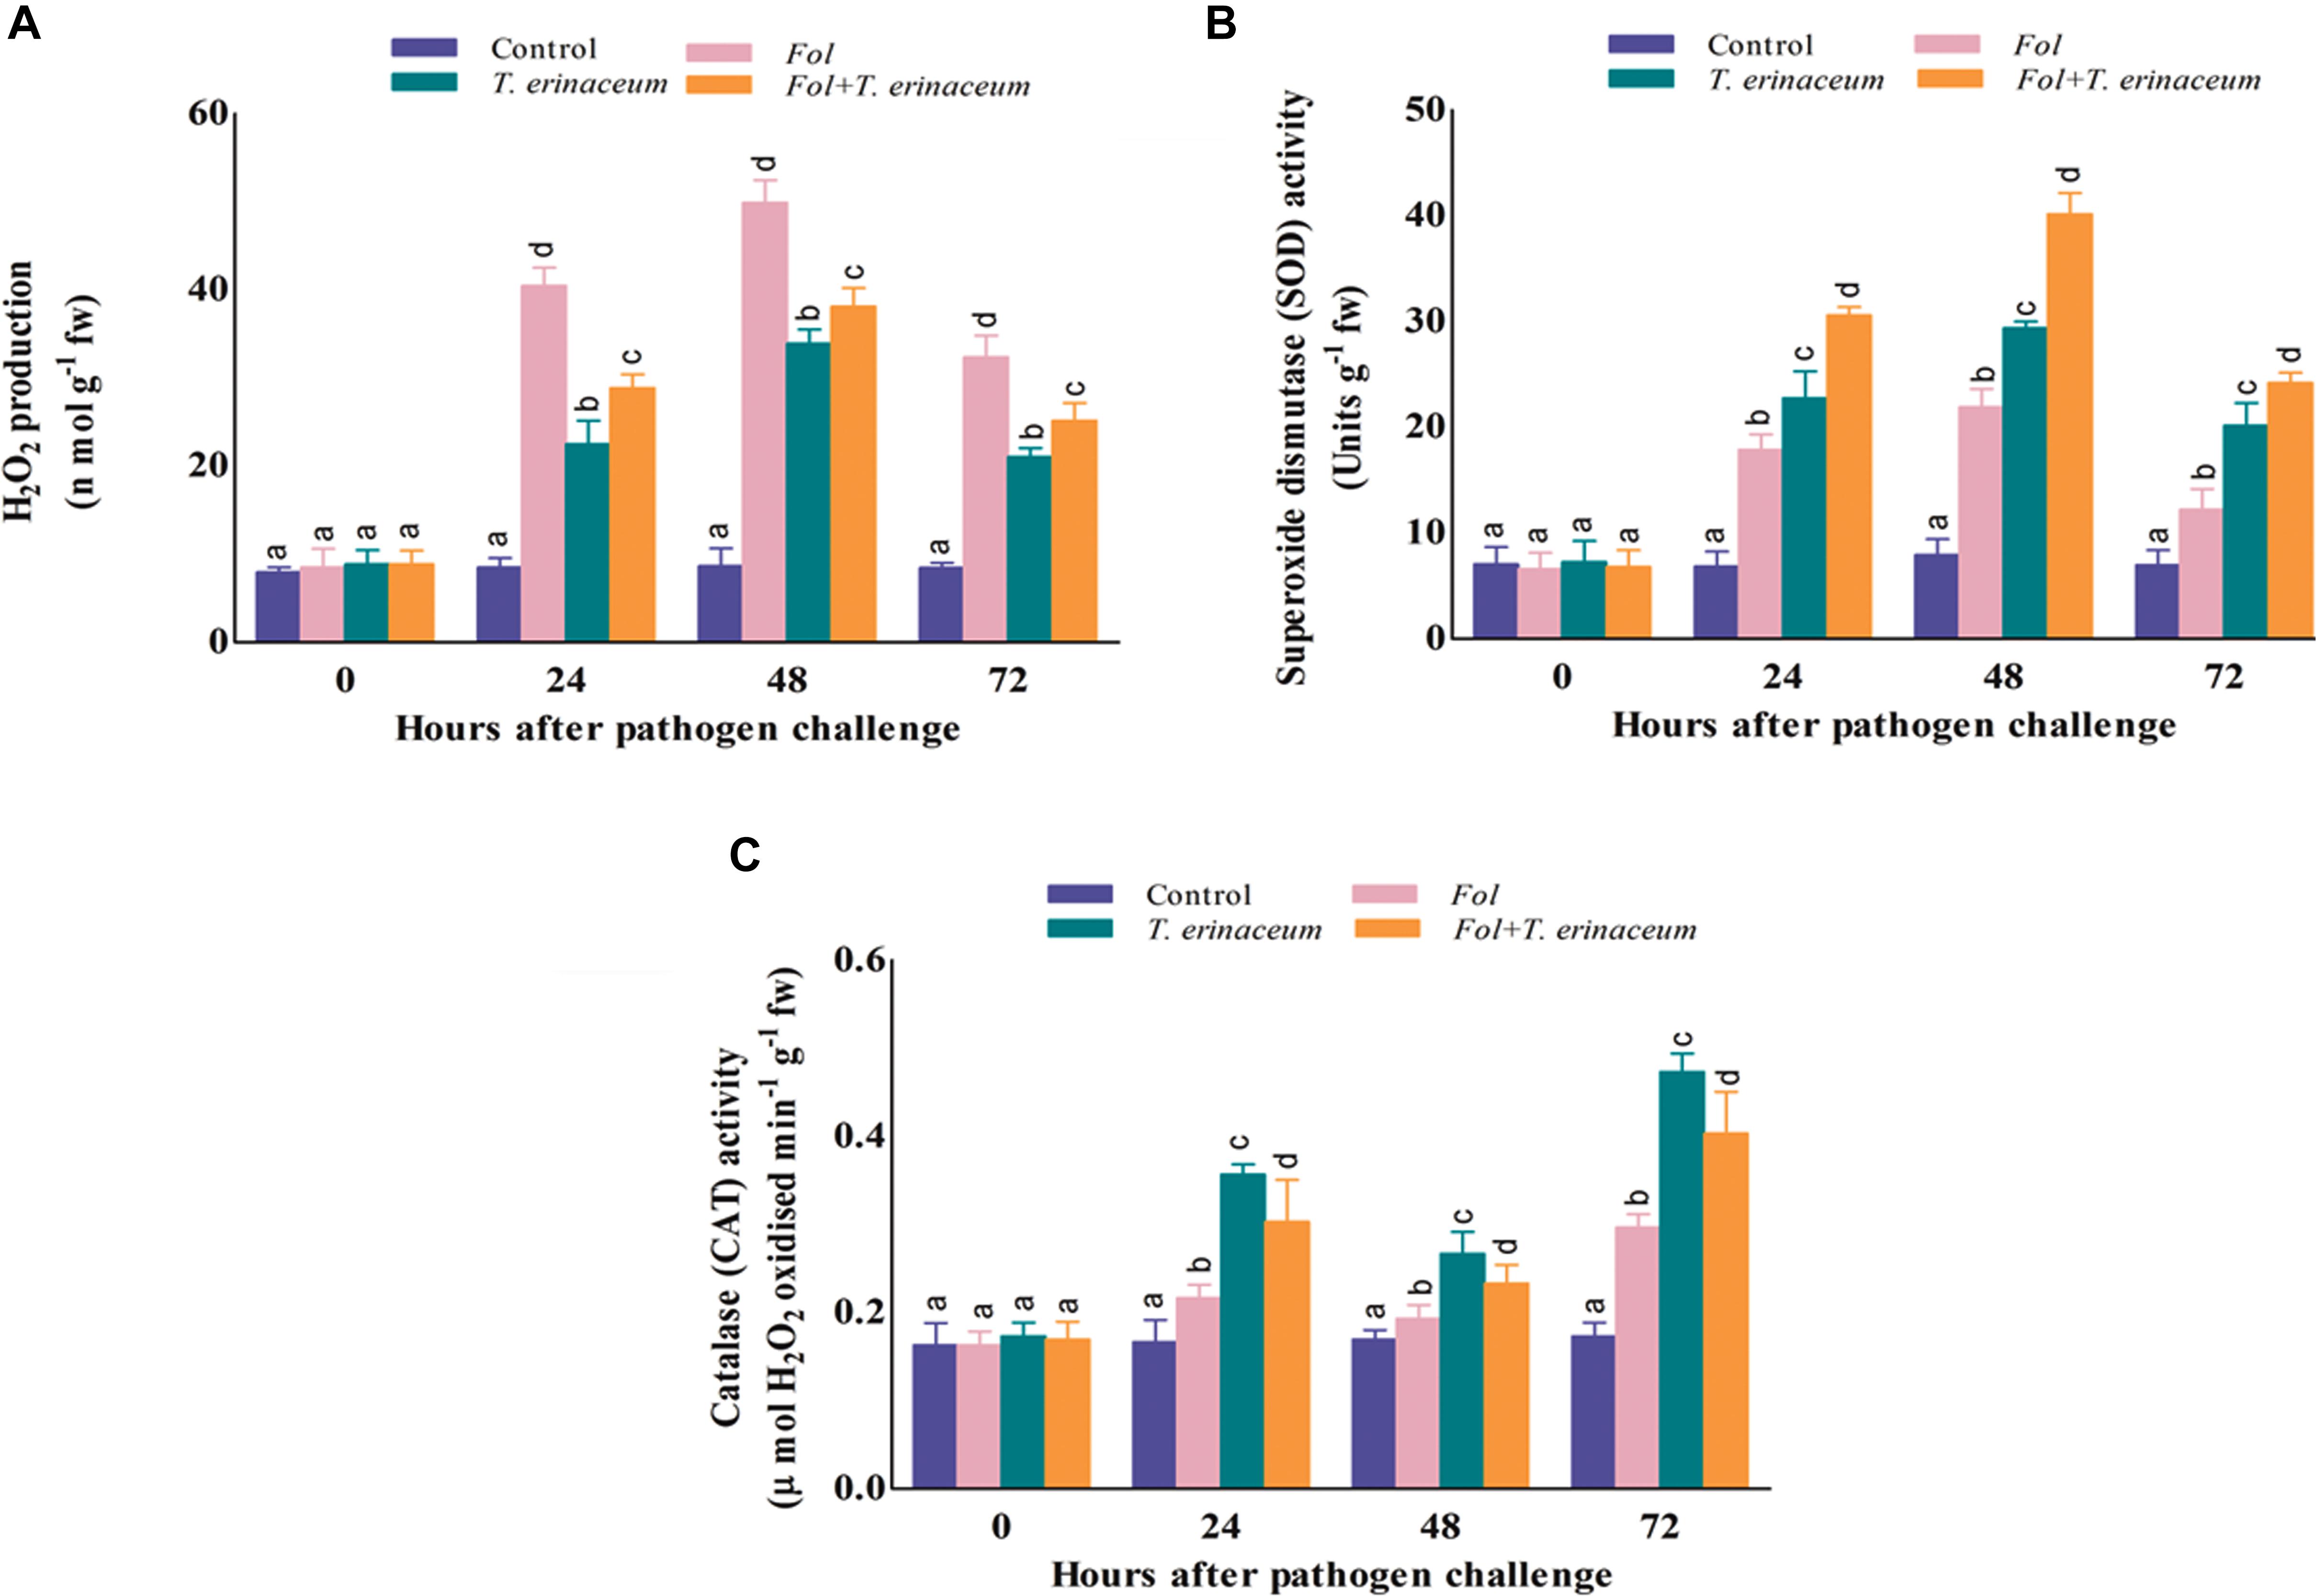
Figure 9. The comparative evaluation of biochemical activities of T. erinaceum bioprimed and unprimed samples under the Fol challenged conditions. (A) The H2O2 accumulated at different time intervals (0–72 h) in all the four different treatments. (B) Measurement of the SOD activity. (C) The CAT activity. Mean (±SE) was calculated from three replicates for each treatment. Bars with distinct alphabetical letters are significantly different at P ≤ 0.05 using the DMRT test.
Assessment of Antioxidative Enzymes
SOD Activity
The SOD activity was found to increase successively on increasing time interval up to 0–72 h which declined thereafter. However, the SOD activity was reported to be maximum in case of the Fol+T. erinaceum samples at each time interval followed by the T. erinaceum bioprimed samples. The SOD activity was reported to be higher at 48 h post inoculation in all the pre-treated samples but found with maximum increase for the Fol + T. erinaceum bioprimed samples, followed by T. erinaceum and the Fol challenged condition, respectively (Figure 9B). Overall, the reported SOD activity calculated for the Fol+T. erinaceum challenged samples were 183.05% more than the Fol challenged leaf tissues, whereas in the case of T. erinaceum bioprimed tissues the calculated percentage increase in SOD activity was 133.94% higher than the Fol challenged leaf tissue samples.
CAT Activity
In our results, the CAT activity was found to be increased in the Fol challenged leaf tissues at the initial hour of Fol inoculation (0–24 h) compared to control (unprimed) samples. However, the CAT activity was at it’s maximum in T. erinaceum bioprimed samples in all the treatments followed by the Fol + T. erinaceum treated leaf tissues. One more interesting observation found that the CAT activity showed a fluctuating type pattern where it raised in the initial hour (0–24 h), decreased further, and then increased at 72 h post inoculation in all the treatments (Figure 9C). Furthermore, the rise in the CAT activity at later stages of treatment (48–72 h) was much more than those recorded for initial hour increment. In all the pre-treated tissues we found that the maximum rise in the CAT activity for T. erinaceum challenged plants 159.79% greater than the Fol challenged samples, followed by the Fol + T. erinaceum challenged samples. The CAT activity was comparatively 136.14% greater for the Fol+ T. erinaceum challenged (compared to the Fol treated leaf tissues). It has been well demonstrated that pre-treatment of biocontrol Trichoderma causes transcriptional reprogramming of the oxidative stress response, and accumulation of ROS gene network (SOD, CAT, GPx, APx) (Singh et al., 2011; Brotman et al., 2013) which results in increased activities of the antioxidant enzymatic pool.
Histochemical Analysis for Lignin Assessment
The amount of lignified tissues was found to be greater in T. erinaceum plants co-inoculated with Fol (Fol + T. erinaceum) followed by T. erinaceum bioprimed samples. We have measured the deposited lignified tissues at two different time intervals i.e., on 15 days and later on, 45 days post inoculating the pathogen in both bioprimed and unprimed plants. The pink colored staining of Phloroglucinol-HCl stained lignified tissues, was more pronounced and was shown to have intense coloration. The Fol challenged sample had a comparatively higher amount of lignified tissue than uninoculated control as visualized under the compound microscope. The lignified tissue in the Fol challenged stem on 15 days (Figure 10C) showed less lignified tissues compared to stem tissues observed on 45 days (Figure 10D) whereas the control plant observed at 15 days (Figure 10A) and 45 days (Figure 10B) was found to have a comparatively lesser amount of lignified tissues. However, in all the histochemical tissue sections analyzed the deposited lignin was quantitatively more in T. erinaceum bio-primed tissue sections. The histochemical tissue sections from the T. erinaceum bioprimed plants at 15 days (Figure 10E) and 45 days (Figure 10F), respectively. The Fol+ T. erinaceum tissues were found to have comparatively more lignified tissues on 15 and 45 days, respectively (Figures 10G,H) which confirmed that the defense programming of the host was more pronounced in the presence of T. erinaceum induced microbial bio-priming under the Fol challenged conditions. Moreover, T. erinaceum pretreated plants co-inoculated with pathogen Fol+ T. erinaceum had the maximum amount of deposited lignified tissues which confirmed that the defense response in the presence of beneficial microbe (T. erinaceum) become more robust when plants further encounter the pathogen.
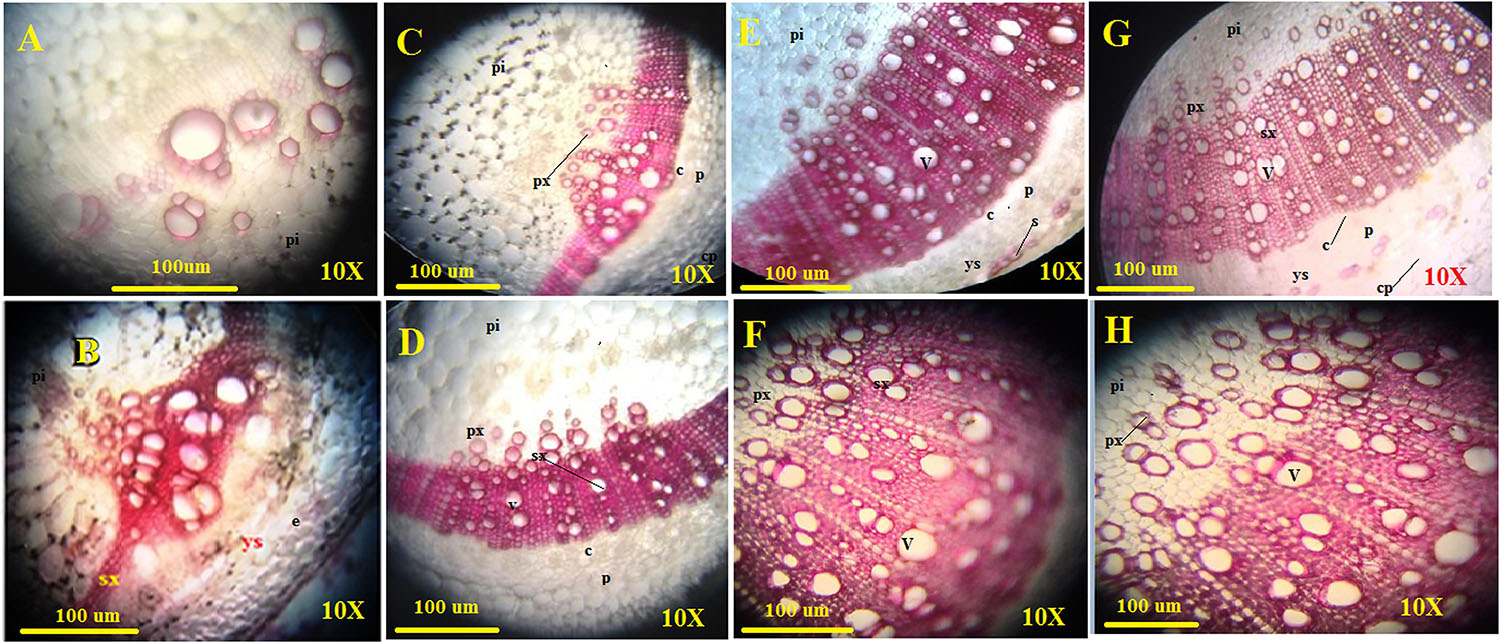
Figure 10. Assessment of the plant defense response in the form of lignification. The figure shows the transverse sections of stem tissues with lignin deposition in the walls of interfascicular fibers and xylem cells collected from four different transverse section of control, Fol challenged, T. erinaceum bioprimed, and T. erinaceum bioprimed + Fol challenged and were collected at two different intervals 15 and 45 days. The stem tissue sections from 2nd internode region were dissected through Vibratome, stained with Phloroglucinol-HCl (pink or fuchsia color). The intensity of the pink color represents higher deposition of lignin. Vascular bundles with lignified primary xylem; sclerenchyma starting to differentiate with no lignified cell walls. (A) Microscopic view of the histochemical section (transverse) of the control stem tissue taken from an unprimed plant (control) at 15 days interval. (B) The control stem tissue analyzed at 45 days interval. (C) The shoot tissue sections from the Fol challenged plant observed at 15 days interval. (D) The Fol challenged shoot tissues at 45 days interval. (E) The shoot tissues were taken from a T. erinaceum bioprimed plant at 15 days interval. (F) T. erinaceum bioprimed tissues at 45 days interval. (G) The shoot tissues taken from Fol challenged sample co-inoculated with T. erinaceum analyzed at 15 days interval. (H) The Fol challenged + T. erinaceum shoot tissues analyzed after 45 days interval. All the images were observed at 10× magnification. Bar = 100 μM. px, primary xylem; sx, secondary xylem; f, xylem; pi, pith; p, phloem; c, cambium; v, vessel; cp, cortical parenchyma. The amount of lignin deposition was maximum in tissues that were Fol challenged and co-inoculated with Trichoderma.
Discussion
In their natural habitat, plants are continuously exposed to various abiotic and biotic stresses. However, plants adapt to such changes by acquiring a great degree of phenotypic plasticity that is mainly determined by the plant’s genome (Aamir et al., 2017). The integration of a multitude of partly synergistic and/or partly antagonistic signals enables plants to respond well against such extreme conditions (Pandey and Somssich, 2009). In many studies, it has been reported that members of the WRKY gene family contribute multiple biological processes involved in plant growth and development. Apart from this, the role of WRKY genes in the regulation of the stress response against the abiotic and biotic damages has also been demonstrated (Huang et al., 2012; Shankar et al., 2013; Bakshi and Oelmüller, 2014; Bai et al., 2018). Moreover, it has been reported that some WRKY Tfs function in combined stresses (both abiotic and biotic), and have been found active at crossroads of plant responses to both biotic and abiotic stresses (Qiu and Yu, 2009; Gao et al., 2011; Huang et al., 2012). For example, the tomato homologs (SlWRKY31 and SlWRKY33) of AtWRKY33 are activators of plant defense against several pathogens (Lippok et al., 2007; Liu et al., 2015; Li et al., 2016). In addition, the role of SlWRKY31 and its homolog SlWRKY33 was found to be involved in plant defense against drought and/or salt stresses (Huang et al., 2012). In tomato, many WRKY members have been demonstrated to act as a positive regulator of plant defense response against biotic stresses. Interestingly, different researchers redundantly annotated the tomato WRKY genes, and it is hard to follow the identical genes through different publications. For example, SlWRKY33 was published as SlWRKY33B and SlWRKY33A (Zhou et al., 2015) and SlWRKY31 was described as SlDRW1 (Liu et al., 2015). Likewise, Arabidopsis WRKY33 protein homolog in tomato SlWRKY31 (previously named as SlWRKY33A and SlWRKY33B; Zhou et al., 2015) was found to complement the function of the atwrky33 mutant that was unable to provide tolerance against B. cinerea (Zheng et al., 2006). Overexpression of S. pimpinellifolium (closest wild relative of domestic tomato; The Tomato Genome Consortium, 2012) allele of SlWRKY33 was found to provide resistance against hemi-biotrophic oomycetes Phytophthora infestans in tomato and Phytophthora nicotianae in tobacco. Similarly, in Group I, the closest homologs of AtWRKY33 including SlWRKY31 and SlWRKY33 have been reported to provide defense against several soil-borne pathogens (Zheng et al., 2006; Lippok et al., 2007; Liu et al., 2015; Li et al., 2016). In contrast, the induction of SlWRKY31 and SlWRKY33 was observed under drought and/or salt stresses (Huang et al., 2012). In our previous report, we analyzed the Gene Expression Omnibus (GEO) datasets (GEO accession: GSE52336) to analyze the transcriptional profile of tomato defense-related WRKY genes. The bioinformatics analysis revealed that during Fol pathogenesis in tomato, a total 16 EST transcripts belonging to the WRKY gene family (based on Blast-x results and the presence of functional domain analysis) were found to be differentially expressed (Aamir et al., 2018). However, of these totally expressed transcripts, only three transcripts i.e., SlWRKY4, SlWRKY31, and SlWRKY37 were found to have a clear-cut upregulated expression profile in all the Fol challenged samples (compared to control samples). The in-silico results were further confirmed through real time PCR and qRT-PCR studies. Apart from WRKYs role in plant-microbe interaction, Wenke et al. (2012) reported the role of the WRKY gene-mediated regulatory network in plant-biotic interaction, influenced through secretory volatile compounds (without having direct surface−to−surface contact) and that played, a significant role in plant’s fitness and vitality. De Palma et al. (2019) investigated the transcriptional response of tomato roots when colonized with endophytic T. harzianum T22. The root transcriptomes collected at different time intervals (0, 24, 48, and 72 h) post inoculation with beneficial fungus revealed the epigenetic and post-transcriptional regulation mechanisms (De Palma et al., 2019). Arabidopsis shares the highest evolutionary conservation with tomatoes (Yue et al., 2016) and the close phylogenetic relationship between tomato and Arabidopsis genes is well supported and exemplified by the fact that both species partially employ similar proteins for their developmental programming such as epidermal cell differentiation, development of root hairs, initiation of trichomes and accumulation of anthocyanins (Tominaga-Wada et al., 2013; Wada et al., 2014, 2015). The differential expression of tomato SlWRKY2, SlWRKY3, SlWRKY4, SlWRKY6, SlWRKY7, SlWRKY23, SlWRKY51, SlWRKY53, SlWRKY80, and SlWRKY71 has been reported following the attack of Cladosporium fulvum in tomato plants (van Esse et al., 2009). In our results, we found that increased expression of the tomato WRKY31 and WRKY37 genes in the Fol challenged root and leaf tissues at increased time intervals (compared to control). Birkenbihl et al. (2012) demonstrated the role of AtWRKY33 in the plant defense against the necrotrophic fungi Alternaria brassicicola and Botrytis cinerea through mutant studies. Later on, it was reported that AtWRKY33 work as a global transcriptional regulator of metabolic and hormonal responses toward the necrotrophic pathogen, Botrytis cinerea (Birkenbihl et al., 2012). In a recent study, the time-dependent fluctuation in WRKYs gene expression was recorded following the attack of two pathogens F. oxysporum f. sp. conglutinans and Pectobacterium carotovorum sub. sp. carotovorum (Kayum et al., 2015). It was found that Brassica rapa WRKY4 showed the highest expression on the 6th day post inoculation of the pathogen. However, P. carotovorum subs. sp. carotovorum infection revealed fluctuation in WRKYs expression at different time intervals (Kayum et al., 2015).
We found the highest expression (compared to the Fol challenged samples) of SlWRKY genes in T. erinaceum pre-treated tissues followed by Fol+ T. erinaceum bioprimed tissue samples. In this context, Bakshi and Oelmüller (2014) reported that bio-priming with Trichoderma affects the expression of many defense-related genes involved in regulating ROS homeostasis and plant defense against stress response, particularly, WRKY genes. We found similar trends in our qPCR results, the highest upregulation was observed in the transcript profile of SlWRKY31 with 16.53 fold (root) and 21.19 fold (leaves) increase in T. erinaceum bioprimed tissues at an initial hour (0–24 h) of treatments. These observations suggest that Trichoderma primed tissues reprogrammed the host defense machinery with respect to an elevated alarm state within tomato plants enrolling numerous WRKYs and other defense-related transcripts. In one report, the quantitative PCR (qRT-PCR) experiment when combined with in-silico results revealed the expression of defense-related genes in beans following the interaction of T. velutinum with R. solani or without R. solani (Mayo et al., 2016). It was found that of totally, expressed 48 genes, only WRKY33, CH5b (endochitinase precursor) and hGS (encoding for homoglutathione synthetase) showed upregulation in presence of T. velutinum. Further, it was found that treatment of T. velutinum resulted into downregulation of other genes or had no effect (OSM34) at all (Mayo et al., 2016). In contrast, R. solani infection caused downregulation of most of the genes analyzed, except OSM34, CNGC2, and PR1 that were not affected. However, the presence of both R. solani and T. velutinum, showed downregulation of most of the genes analyzed, except upregulation of hGS, while other CH5b was not significantly affected (Mayo et al., 2016). In our study, we found downregulation of the SlWRKY4 in both root and leaf tissues compared to upregulated SlWRKY31 and SlWRKY37 transcripts. However, the expression profile change for SlWRKY4 was more conspicuous in root tissues at 24 h, which further decreased at 48 h.
The WRKY Tfs play an important role in the alleviation of both abiotic and biotic stresses (Bakshi and Oelmüller, 2014; Phukan et al., 2016; Bai et al., 2018). For example, SlWRKY31 has been reported to offer defense against necrotrophic pathogens (Zheng et al., 2006) and also play a crucial role in drought and salt stress signaling (Huang et al., 2012). SlWRKY3 provides resistance against salt stress and functions as a positive regulator against the root-knot nematode Meloidogyne javanica (Hichri et al., 2017; Chinnapandi et al., 2019). Similarly, downregulation of SlWRKY4 has been reported in both abiotic (drought) and biotic stress (Fol pathogen) response (Aamir et al., 2018; Karkute et al., 2018). Therefore, identification and characterization of WRKY members that play dual function (managing both abiotic and biotic stresses) is an interesting approach and could be useful in crop improvement through plant breeding and/or transgenic technology. In addition, the functional relevance of WRKY proteins (having the dual function) and molecular mechanism of WRKY gene-mediated signaling at the point of multiple stresses is fully unexplored. Notably, SlWRKY23 play a crucial role in the defense response against the powdery mildew fungus Oidium neolycopersici. However, SlWRKY23 function under the saline stress condition when simultaneously challenged with pathogen was compromised rather than showing an additive effect (Kissoudis, 2016). With this view, we have analyzed cis-acting DNA regulatory element at the promoter region of characterized SlWRKY genes for finding their putative functions based on the presence of functional promoter elements. In a recent study, it was found that nine different WRKY genes in tomato showed upregulated expression under drought stress condition (Karkute et al., 2018). Further, in silico cis-acting DNA regulatory element analysis revealed that the promoter region of the characterized stress-responsive WRKY genes was flanked by various abiotic stress responsive elements like ABRE, HSE, MBS and Py-rich stretch, and were reported to promote high transcription levels (Karkute et al., 2018). We demonstrated the role of SlWRKY31, SlWRKY37 and SlWRKY4 in tomato defense response against the Fol challenged condition. However, promoter analysis results revealed the presence of different abiotic stress-responsive elements in SlWRKY33 and SlWRKY37 which showed their possible biological role in heat stress, drought stress response and hormonal response. In contrast, SlWRKY4 could have a possible functional role in SA signaling and low-temperature response. In one report, Karkute et al. (2018) found that the promoter region of the drought stress-responsive SlWRKY genes were flanked by abiotic stress-responsive elements including ABRE, HSE, and MBS. 5’ UTR Py-rich stretch which supports our promoter search results. In our results, we found the same cis acting elements at the promoter region of SlWRKY4, SlWRKY31 and SlWRKY37 (encoding SlWRKY37 isoform I). It has been suggested that expression of the gene is governed by Tfs which binds to specific protein binding sites in the promoter region of the respective gene and therefore, characterization of the promoter element could provide critical knowledge about gene function and regulation (Karkute et al., 2018). The presence of W-box sequences recognized by WRKY proteins in the promoter region of heat tolerance related genes like HSP and HSF genes (HSFA2, HSFB1, HSP101, and MBF1c) further explains the function of HSE elements (Li et al., 2011). In this context, Fragkostefanakis et al. (2016) identified and characterized some heat stress-responsive genes in tomato male reproductive tissues that lack the functional HSE element in their promoter region and are regulated directly by WRKY Tfs which further confirms WRKYs role in the alleviation of heat stress response. Zhou et al. (2014) characterized tomato SlWRKY33, homologous to AtWRKY33 in heat induced autophagy along with tomato autophagy-related (ATG) genes as it was found that silencing of SlWRKY33 genes compromised tomato heat tolerance and reduced heat-induced ATG gene expression (Zhou et al., 2014). Overall, promoter analysis results revealed that our characterized WRKYs could have a possible biological role in managing both biotic and abiotic stress response.
The molecular mechanism underlying the manipulation of plant defense by beneficial symbiosis with Trichoderma spp. is still unknown. However, Trichoderma, promotes plant growth and development through several mechanisms including, root growth, increased nutrient uptake, and expression of plant defense-related genes (Mayo et al., 2016). Fungal interaction with plant roots could result in large-scale transcriptional re-programming events, in host tissues as well as fungus, and leads to transcriptional changes, therefore allowing the successful colonization of fungus to host tissues through transient repression of host immune responses (Morán-Diez et al., 2012; Brotman et al., 2013). In this context, Brotman et al. (2013) reported the increased expression of AtWRKY40 and AtWRKY18 after the colonization of T. asperelloides 203 to Arabidopsis root. Sáenz-Mata et al. (2014) reported the quantitative expression of 8 WRKY genes during its interaction with beneficial fungus T. atroviridae. The study concluded the existence of complex signaling route during Trichoderma-plant interaction involving both JA and SA signaling cascades and regulated by differential WRKY gene expression in Arabidopsis at the molecular level. Similarly, T. harzianum T34 colonization with Arabidopsis roots resulted into downregulation of defense-related genes and other Tfs including pathogenesis-related protein 1 (PR-1), AtWRKY54, flavin monooxygenase1 (FMO1), and glutathione transferases (Morán-Diez et al., 2012). Since Trichoderma, elicits induced systemic resistance (ISR) by the JA/ET-dependent pathway, and triggers a priming response in the plant (Korolev et al., 2008) the induced resistance provoked after a pathogen attack in unprimed tissues regulates through SA dependent signaling. Further, SA mediated signaling activates several jasmonate ZIM-domain genes and leads into downregulation of JA mediated responses. The final response of the signaling cascades results in the encoding of the JA responsive repressors along with other SA dependent WRKY Tfs, which causes susceptibility of mutant plants toward necrotrophic pathogens (Birkenbihl et al., 2012). This concludes into that WRKY33, a positive regulator of JA-related genes is a repressor of the SA pathway (Bakshi and Oelmüller, 2014).
The molecular mechanism that results in the modulation of defense transcriptome of plant tissues during Trichoderma-plant interaction is not fully explored. However, Trichoderma colonization to plant roots results into the secretion of secondary metabolites, proteins or other structural components that function as microbe associated molecular patterns (MAMPs). Further, plant-specific receptors use certain molecules (hydrolytic enzymes that may function on both pathogens and plant cell wall) could be employed as damage-associated molecular patterns (DAMPs) (Hermosa et al., 2013). These MAMPs and DAMPs stimulate the various signaling cascades, required for plant defense responses against phytopathogens, and mediated through multiple hormonal responses in cross-communication signaling pathways (Hermosa et al., 2013). In addition, plants have developed a plethora of defense strategies to combat pathogenic challenges. The most common mechanisms include the accumulation of ROS, the synthesis of PR proteins and phytoalexins, alteration in cell walls and enhanced activities of plant defense-related enzymes (Jothi and Babu, 2002; Bindschedler et al., 2006). Furthermore, the role of plant peroxidases (POs) has been well reported in defense responses including lignification, hypersensitive response, phenolics cross-linking and production of phytoalexins (Wojtaszek, 1997). The SAR regulated through SA signaling could result in direct activation and expression of the genes encoding PR proteins and in low dosages do not activate the defense genes in a direct way, but prime the tissues for potentiated defense-gene expression upon next Fol infection (Zehra et al., 2017). The Fol induced oxidative stress could be regulated by antioxidative defense enzymes including SOD and CAT that function along with other antioxidative enzymes to promote the oxidative damage by scavenging ROS (Saed-Moucheshi et al., 2014; Zehra et al., 2017). Moreover, SOD gene upregulation could result in diminished ROS activity and therefore higher accumulation of H2O2, and lead into the activation of the phenylpropanoid signaling. Additionally, the ROS intermediates play an important role in plant defense activation through cell-wall reinforcement, lignin biosynthesis, synthesis of secondary metabolites toxic to pathogen, activation of genes involved in plant defense, development of SAR against the targeted pathogen and/or exposure of the hypersensitive response (De Palma et al., 2016; Zehra et al., 2017).
In our results, root tissues had more expression of SOD gene compared to leaf tissues after the Fol infection at increasing time interval (0–48 h). Further, T. erinaceum bioprimed root tissues (0–48 h) were found to have an increased SOD expression compared to leaf tissues (24–48 h). In contrast, Fol + T. erinaceum treated leaf tissues showed a drastic change in SOD expression followed by the root tissues at later stages (24–48 h). Comparatively, it was found that in root tissues SlGPX1 expression was more pronounced, and the Fol+ T. erinaceum treated root tissues showed the highest expression of SlGPX1 than the leaf tissues of the same duration. In this context, Mastouri et al. (2012) reported an increased expression of the SOD gene after the tomato root colonization by T. harzianum T22, with a drastic rise in the relative expression of chloroplastic F-SODp and CZ-SODp but not cytosolic SODc. Furthermore, it was found that roots maintained a relatively higher SOD activity under stress compared to control (declined SOD levels at later stages). The study concluded that T22 root colonization induced the SOD expression in chloroplasts and appreciably up-regulated the tomato SOD gene (Mastouri et al., 2012).
The biosynthesis of the lignin and other phenolic compounds are due to activation of the phenylpropanoid pathway (Patel et al., 2017; Zhou et al., 2018). Phloroglucinol-HCl staining (pink or fuchsia color) is a common method for lignin determination, and it is not a true lignin stain as it stains only cinnamaldehyde end-groups (Mitra and Loqué, 2014). Staining with Phloroglucinol-HCl yields a characteristic cherry pink or fuchsia color in the xylem and interfascicular fibers where these aldehyde groups are present. In our study, we found better illustrations of the lignified cellular layers at their early stages of development than at late stages because at late stages the clear-cut demarcation between the cells having actual lignified cellular layer might not be possible due to tissue differentiation. Lignin estimation through phloroglucinol staining specifically stains metaxylem and not sclerenchymatous tissues (Stafford, 1962). The tissue sectioning with Vibratome allows thin sectioning of equal thickness that assists in generating sharp images and reduces much the risk of producing inaccuracies observed due to differences in thickness. The core concept behind the thickness differences and image generation is that tissues having unequal thicknesses would transmit different intensities of light, and therefore, producing blurred images that generally occurred due to bad sample preparation. Although clear-cut demarcation of the observed differences between the lignified tissues are harder to visualize (Mitra and Loqué, 2014) even differences could be determined based on intake of pink coloration determining the amount of lignin deposited (variation in lignin content) by various tissue types.
Conclusion
Microbial priming with Trichoderma spp. results into transcriptional regulation of defense-related genes with altered expression level. The modulated plant defense under primed condition is characterized by accumulation of defense-related transcripts and ROS molecules, activation of phenylpropanoid metabolism and accumulation of specific isoforms of hydrolytic enzymes such as chitinases and glucanases.
The differential tissue-specific and temporal expression of WRKY genes provided the evidence of diverse and complex signaling and transcriptional networks of plant response to beneficial interaction establishment. The highest expression of accumulated WRKY transcripts in T. erinaceum bioprimed tissues predicted a distinct signaling mechanism of the host (tomato) with WRKY genes, in the pre-stage bioprimed condition. Since the defense priming is clearly expressed at transcriptional level, research on mechanisms underlying the primed state has focussed on expression on signaling intermediates in transcriptional networks. Further, enhanced accumulation of SlWRKY transcripts in both bioprimed and T. erinaceum primed and co-inoculated with Fol pathogen plants revealed the transcriptional reprogramming of host defense during its colonization with T. erinaceum and during its antagonism/interaction made with the Fol pathogen. The data from our study provide sufficient evidence for the existence of a complex signaling network involving WRKY genes along with other signaling cascades during T. erinaceum induced bioprimed conditions. Further, bio-priming with T. erinaceum resulted into robust antioxidative enzyme profile changes, strong biochemical (accumulation of defense-related compounds) and structural changes (lignification).
Author Contributions
MA conceived the idea, planned the experiments, performed all the experiments, did computational analysis of the results, and finally prepared and wrote the manuscript. VS assisted in computational analysis of the results. SK performed the quantitative and semi-quantitative PCR work. MD and AZ helped in some experimental sections, and also helped in writing, reviewing, and editing the manuscript. WA assisted in performing statistical calculations. RU and SS supervised the whole work. All authors read and approved the final version of manuscript for publication.
Conflict of Interest Statement
The authors declare that the research was conducted in the absence of any commercial or financial relationships that could be construed as a potential conflict of interest.
Acknowledgments
MA is thankful to the Indian Council of Medical Research (ICMR), New Delhi for research facilities in the form of ICMR-JRF and further as ICMR-SRT. MA is highly grateful to Prof. Madhoolika Agarwal, Coordinator, Interdisciplinary School of Life Sciences (ISLS), Banaras Hindu University, for providing microtome and vibratome facilities. We also acknowledge Centre for Bioinformatics, School of Biotechnology, Banaras Hindu University (BHU) for in silico work. All the authors are thankful to the Head, Department of Botany, Institute of Science, Banaras Hindu University for providing infrastructure facilities, and also acknowledge DST-FIST for instrumentation facilities for this work.
Supplementary Material
The Supplementary Material for this article can be found online at: https://www.frontiersin.org/articles/10.3389/fpls.2019.00911/full#supplementary-material
FIGURE S1 | (A) The position of CDS encoding WRKY31 gene including the TSS and Poly A tail region as predicted through Fgenesh gene prediction tool. We have selected 1500 bp nucleotide upstream from the translational start site for promoter search for each WRKY gene. The CDSf represent the first type or First (Starting with Start codon), CDSi - internal (internal exon), CDSl - last coding segment, (ending with stop codon); TSS- represent the position of transcription start site (TATA-box position); Poly A represent the 3′ polyadenylation site. The presence of TSS before the first coding sequence CDSf and the Poly A tail after the last coding sequence (CDSl) predicted the complete coding sequence of SlWRKY31 gene. Further, presence of TSS and Poly A in the entire coding sequence revealed that the gene of interest is in positive frame. (B) The structural organization of the WRKY31gene showing the intron-exon boundary and the upstream region with the position of CDS region that encodes each of the SlWRKY31 transcription factor. The figure also show the other cis-regulatory element surrounding the promoter region of tomato WRKY31 including the TGA and TCA element.
FIGURE S2 | (A) The position of CDS encoded by SlWRKY4 gene along with the TSS and the Poly A tail region. (B) The identified cis-acting regulatory elements (ABRE, ERE, MYB, and LTR elements) in the promoter region of the SlWRKY4 gene with intron-exon boundaries including TSS (position of transcriptional start site; TATA box and poly A tail). (C) Position of the CDS encoded by the SlWRKY37 including the TSS and the Poly A tail. (D) The location of different cis-regulatory elements surrounding the promoter region of the SlWRKY37 gene.
FIGURE S3 | (A) The semi-quantitative expression profile changes in SlWRKY4, SlWRKY31, and SlWRKY37 genes in four different treatments in both root and leaf tissues measured at different time intervals, and revealed through semi-quantitative PCR experiments. The expression of each gene was compared with a housekeeping ACTIN gene, having constitutive and stable expression pattern. (A) The expression of SlWRKY4, SlWRKY31, and SlWRKY37 genes at 48 h interval in the leaf tissues. (B) The expression of SlWRKY4, SlWRKY31 and SlWRKY37 at 48 h interval in the root tissues. (C) The expression of the SlWRKY4, SlWRKY31, and SlWRKY37 in the leaf tissues at 24 h. (D) The expression of the SlWRKY4, SlWRKY33, and SlWRKY37 in the root tissues at 24 h. (E) The expression of the CZn SOD gene in both root and leaf tissues measured at different time intervals (0, 24, and 48 h).
FIGURE S4 | The expression profile changes in genes that encodes for the tomato Glutathione peroxidase (SlGPX1), Chitinase and Glucanases in both root and leaf tissues at different time intervals, and revealed through the semi-quantitative PCR experiments. (A) The expression of the genes that encodes for GPX1 at 0, 24, and 48 h intervals in both root and leaf tissues. (B) The expression of the Chitinases in both leaf and root tissues at different time intervals. (C) The expression of the Glucanases in root and leaf tissues at 0, 24, and 48 h.
TABLE S1 | List of different species of Trichoderma spp. used in this study along with their isolation source, isolate code and gene accession identity.
TABLE S2 | List of different cis regulatory DNA elements that were present in the promoter region of WRKY genes in tomato along with their sequence and assigned functions.
Footnotes
References
Aamir, M., Singh, V. K., Dubey, M. K., Kashyap, S. P., Zehra, A., Upadhyay, R. S., et al. (2018). Structural and functional dissection of differentially expressed tomato WRKY transcripts in host defense response against the vascular wilt pathogen (Fusarium oxysporum f. sp. Lycopersici). PLoS One 13:e0193922. doi: 10.1371/journal.pone.0193922
Aamir, M., Singh, V. K., Meena, M., Upadhyay, R. S., Gupta, V. K., and Singh, S. (2017). Structural and functional insights into WRKY3 and WRKY4 transcription factors to unravel the WRKY–DNA (W-Box) complex interaction in tomato (Solanum lycopersicum L.). A computational approach. Front. Plant Sci. 8:819. doi: 10.3389/fpls.2017.00819
Ahmad, P., Hashem, A., Abd-Allah, E. F., Alqarawi, A. A., John, R., Egamberdieva, D., et al. (2015). Role of Trichoderma harzianum in mitigating NaCl stress in indian mustard (Brassica juncea L) through antioxidative defense system. Front. Plant Sci. 6:868. doi: 10.3389/fpls.2015.00868
Bai, Y., Sunarti, S., Kissoudis, C., Visser, R. G. F., and van der Linden, C. G. (2018). The role of tomato WRKY genes in plant responses to combined abiotic and biotic stresses. Front. Plant Sci. 9:801. doi: 10.3389/fpls.2018.00801
Bakshi, M., and Oelmüller, R. (2014). WRKY transcription factors: jack of many trades in plants. Plant Signal. Behav. 9:e27700. doi: 10.4161/psb.27700
Balasubramanian, V., Vashisht, D., Cletus, J., and Sakthivel, N. (2012). Plant β-1, 3-glucanases: their biological functions and transgenic expression against phytopathogenic fungi. Biotechnol. Lett. 4, 1983–1990. doi: 10.1007/s10529-012-1012-6
Beauchamp, C., and Fridovich, I. (1971). Superoxide dismutase: improved assays and an assay applicable to acrylamide gels. Anal. Biochem. 4, 276–287. doi: 10.1016/0003-2697(71)90370-8
Bindschedler, L. V., Dewdney, J., Blee, K. A., Stone, J. M., Asai, T., Plotnikov, J., et al. (2006). Peroxidase-dependent apoplastic oxidative burst in Arabidopsis required for pathogen resistance. Plant J. 47, 851–863. doi: 10.1111/j.1365-313x.2006.02837.x
Birkenbihl, R. P., Diezel, C., and Somssich, I. E. (2012). Arabidopsis WRKY33 is a key transcriptional regulator of hormonal and metabolic responses toward Botrytis cinerea infection. Plant Physiol. 159, 266–285. doi: 10.1104/pp.111.192641
Brand, L. H., Fischer, N. M., Harter, K., Kohlbacher, O., and Wanke, D. (2013). Elucidating the evolutionary conserved DNA-binding specificities of wrky transcription factors by molecular dynamics and in vitro binding assays. Nucleic Acids Res. 41, 9764–9778. doi: 10.1093/nar/gkt732
Brand, L. H., Kirchler, T., Hummel, S., Chaban, C., and Wanke, D. (2010). DPI-ELISA: a fast and versatile method to specify the binding of plant transcription factors to DNA in vitro. Plant Methods 6:25. doi: 10.1186/1746-4811-6-25
Brotman, Y., Landau, U., Cuadros-Inostroza, A., Takayuki, T., Fernie, A. R., Chet, I., et al. (2013). Trichoderma-plant root colonization: escaping early plant defense responses and activation of the antioxidant machinery for saline stress tolerance. PLoS Pathog. 9:e1003221. doi: 10.1371/journal.ppat.1003221
Chen, L., Song, Y., Li, S., Zhang, L., Zou, C., and Yu, D. (2012). The role of WRKY transcription factors in plant abiotic stresses. Biochim. Biophys. Acta 1819, 120–128. doi: 10.1016/j.bbagrm.2011.09.002
Chi, Y., Yang, Y., Zhou, Y., Zhou, J., Fan, B., Yu, J. Q., et al. (2013). Protein–protein interactions in the regulation of WRKY transcription factors. Mol. Plant 6, 287–300. doi: 10.1093/mp/sst026
Chinnapandi, B., Bucki, P., Fitoussi, N., Kolomiets, M., Borrego, E., and Braun Miyara, S. (2019). Tomato SlWRKY3 acts as a positive regulator for resistance against the root-knot nematode Meloidogyne javanica by activating lipids and hormone-mediated defense-signaling pathways. Plant Signal Behav. 14:1601951. doi: 10.1080/15592324.2019.1601951
Chopada, G. B., Singh, P., and Korat, C. (2014). Pathogenic variation among Fusarium oxysporum f. sp. lycopersici isolates and varietal screening of tomato against wilt under South Gujarat. Bioscan 9, 351–354.
Ciolkowski, I., Wanke, D., Birkenbihl, R., and Somssich, I. (2008). Studies on DNA-binding selectivity of WRKY transcription factors lend structural clues into WRKY-domain function. Plant Mol. Biol. 68, 81–92. doi: 10.1007/s11103-008-9353-1
De Palma, M., D’Agostino, N., Proietti, S., Bertini, L., Lorito, M., Ruocco, M., et al. (2016). Suppression subtractive hybridization analysis provides new insights into the tomato (Solanum lycopersicum L.) response to the plant probiotic microorganism Trichoderma longibrachiatum MK1. J. Plant Physiol. 190, 79–94. doi: 10.1016/j.jplph.2015.11.005
De Palma, M., Salzano, M., Villano, C., Aversano, R., Lorito, M., Ruocco, M., et al. (2019). Transcriptome reprogramming, epigenetic modifications and alternative splicing orchestrate the tomato root response to the beneficial fungus Trichoderma harzianum. Hortic. Res. 6:5. doi: 10.1038/s41438-018-0079-1
de Pater, S., Greco, V., Pham, K., Memelink, J., and Kijne, J. (1996). Characterization of a zinc-dependent transcriptional activator from Arabidopsis. Nucleic Acids Res. 24, 4624–4631. doi: 10.1093/nar/24.23.4624
Ebrahim, S., Usha, K., and Singh, B. (2011). Pathogenesis related (PR) proteins in plant defense mechanism. Sci. Against Microb. Pathog. 2, 1043–1054.
Eulgem, T., Rushton, P. J., Robatzek, S., and Somssich, I. E. (2000). The WRKY superfamily of plant transcription factors. Trends Plant Sci. 5, 199–206. doi: 10.1016/S1360-1385(00)01600-9
Fragkostefanakis, S., Mesihovic, A., Simm, S., Paupière, M. J., Hu, Y., Paul, P., et al. (2016). HsfA2 controls the activity of developmentally and stress-regulated heat stress protection mechanisms in tomato male reproductive tissues. Plant Physiol. 170, 2461–2477. doi: 10.1104/pp.15.01913
Fu, J., Liu, Z., Li, Z., Wang, Y., and Yang, K. (2017). Alleviation of the effects of saline- alkaline stress on maize seedlings by regulation of active oxygen metabolism by Trichoderma asperellum. PLoS One 12:e0179617. doi: 10.1371/journal.pone.0179617
Gao, Q. M., Venugopal, S., Navarre, D., and Kachroo, A. (2011). Low oleic acid-derived repression of jasmonic acid-inducible defense responses requires the WRKY50 and WRKY51 proteins. Plant Physiol. 155, 464–476. doi: 10.1104/pp.110.166876
Gharbi, Y., Barkallah, M., Bouazizi, E., Gdoura, R., and Triki, M. A. (2017). Differential biochemical and physiological responses of two olive cultivars differing by their susceptibility to the hemibiotrophic pathogen Verticillium dahliae. Physiol. Mol. Plant Pathol. 97, 30–39. doi: 10.1016/j.pmpp.2016.12.001
Guo, D., Chen, F., Inoue, K., Blount, J. W., and Dixon, R. A. (2001). Downregulation of caffeic acid 3-O-methyltransferase and caffeoyl CoA 3-O-methyltransferase in transgenic alfalfa: impacts on lignin structure and implications for the biosynthesis of G and S lignin. Plant Cell 13, 73–88. doi: 10.1105/tpc.13.1.73
Hermosa, R., Rubio, M. B., Cardoza, R. E., Nicolás, C., Monte, E., and Gutiérrez, S. (2013). The contribution of Trichoderma to balancing the costs of plant growth and defense. Int. Microbiol. 16, 69–80.
Hermosa, R., Viterbo, A., Chet, I., and Monte, E. (2012). Plant-beneficial effects of Trichoderma and of its genes. Microbiology 158, 17–25. doi: 10.1099/mic.0.052274-0
Hichri, I., Muhovski, Y., Žižková, E., Dobrev, P. I., Gharbi, E., Franco-Zorrilla, J. M., et al. (2017). The Solanum lycopersicum WRKY3 transcription factor SlWRKY3 is involved in salt stress tolerance in tomato. Front. Plant Sci. 8:1343. doi: 10.3389/fpls.2017.01343
Hu, B., Jin, J., Guo, A. Y., Zhang, H., Luo, J., and Gao, G. (2015). GSDS 2.0: an upgraded gene feature visualization server. Bioinformatics 31, 1296–1297. doi: 10.1093/bioinformatics/btu817
Huang, S., Gao, Y., Liu, J., Peng, X., Niu, X., Fei, Z., et al. (2012). Genome-wide analysis of WRKY transcription factors in Solanum lycopersicum. Mol. Genet. Genomics 287, 495–513. doi: 10.1007/s00438-012-0696-6
Jain, A., Singh, S., Kumar Sarma, B., and Bahadur Singh, H. (2012). Microbial consortium–mediated reprogramming of defence network in pea to enhance tolerance against Sclerotinia sclerotiorum. J. Appl. Microbiol. 112, 537–550. doi: 10.1111/j.1365-2672.2011.05220.x
Jana, S., and Choudhuri, M. A. (1981). Glycolate metabolism of three submersed aquatic angiosperms: effect of heavy metals. Aquat. Bot. 11, 67–77. doi: 10.1016/0304-3770(81)90047-4
Jaskiewicz, M., Conrath, U., and Peterhänsel, C. (2011). Chromatin modification acts as a memory for systemic acquired resistance in the plant stress response. EMBO Rep. 12, 50–55. doi: 10.1038/embor.2010.186
Jensen, B., Knudsen, I. M., Madsen, M., and Jensen, D. F. (2004). Biopriming of infected carrot seed with an antagonist, Clonostachys rosea, selected for control of seed borne Alternaria spp. Phytopathology 94, 551–560. doi: 10.1094/PHYTO.2004.94.6.551
Jothi, G., and Babu, R. S. (2002). Peroxidase and chitinase activities in brinjal inoculated with Meloidogyne incognita (Kofoid & White) chitwood and endomycorrhiza. J. Biol. Control. 16, 161–164.
Karkute, S. G., Gujjar, R. S., Rai, A., Akhtar, M., and Singh, M. (2018). Genome wide expression analysis of WRKY genes in tomato (Solanum lycopersicum) under drought stress. Plant Gene 13, 8–17. doi: 10.1016/j.plgene.2017.11.002
Kayum, M. A., Jung, H. J., Park, J. I., Ahmed, N. U., Saha, G., Yang, T. J., et al. (2015). Identification and expression analysis of WRKY family genes under biotic and abiotic stresses in Brassica rapa. Mol. Genet. Genomics 290, 79–95. doi: 10.1007/s00438-014-0898-1
Kiranmai, K., Lokanadha Rao, G., Pandurangaiah, M., Nareshkumar, A., Amaranatha Reddy, V., Lokesh, U., et al. (2018). A novel WRKY transcription factor, MuWRKY3 (Macrotyloma uniflorum Lam. Verdc.) enhances drought stress tolerance in transgenic groundnut (Arachis hypogaea L.) plants. Front. Plant Sci. 9:346. doi: 10.3389/fpls.2018.00346
Kissoudis, C. (2016). Genetics and Regulation of Combined Abiotic and Biotic Stress Tolerance in Tomato. Doctoral dissertation, Wageningen University.
Korolev, N., David, D. R., and Elad, Y. (2008). The role of phytohormones in basal resistance and trichoderma-induced systemic resistance to Botrytis cinerea in Arabidopsis thaliana. Biocontrol 53, 667–683. doi: 10.1007/s10526-007-9103-3
Lai, Z. B., Vinod, K. M., Zheng, Z. Y., Fan, B. F., and Chen, Z. X. (2008). Roles of Arabidopsis WRKY3 and WRKY4 transcription factors in plant responses to pathogens. BMC Plant Biol. 8:68. doi: 10.1186/1471-2229-8-68
Lescot, M., Déhais, P., Thijs, G., Marchal, K., Moreau, Y., Van de Peer, Y., et al. (2002). Plant CARE, a database of plant cis-acting regulatory elements and a portal to tools for in silico analysis of promoter sequences. Nucleic Acids Res. 30, 325–327. doi: 10.1093/nar/30.1.325
Li, S., Fu, Q., Chen, L., Huang, W., and Yu, D. (2011). Arabidopsis thaliana WRKY25, WRKY26, and WRKY33 coordinate induction of plant thermotolerance. Planta, 233, 1237–1252. doi: 10.1007/s00425-011-1375-2
Li, B., Meng, X., Shan, L., and He, P. (2016). Transcriptional regulation of pattern-triggered immunity in plants. Cell Host Microbe 19, 641–650. doi: 10.1016/j.chom.2016.04.011
Lippok, B., Birkenbihl, R. P., Rivory, G., Brümmer, J., Schmelzer, E., Logemann, E., et al. (2007). Expression of AtWRKY33 encoding a pathogen-or PAMP-responsive WRKY transcription factor is regulated by a composite DNA motif containing W box elements. Mol. Plant Microbe Interact. 20, 420–429. doi: 10.1094/mpmi-20-4-0420
Liu, S., Kracher, B., Ziegler, J., Birkenbihl, R. P., and Somssich, I. E. (2015). Negative regulation of ABA signaling by WRKY33 is critical for Arabidopsis immunity towards Botrytis cinerea 2100. eLife 4:e07295. doi: 10.7554/eLife.07295
Livak, K. J., and Schmittgen, T. D. (2001). Analysis of relative gene expression data using real-time quantitative PCR and the 2- ΔΔCT method. Methods 25, 402–408. doi: 10.1006/meth.2001.1262
Mangelsen, E., Kilian, J., Berendzen, K. W., Kolukisaoglu, ÜH., Harter, K., Jansson, C., et al. (2008). Phylogenetic and comparative gene expression analysis of barley (Hordeum vulgare) WRKY transcription factor family reveals putatively retained functions between monocots and dicots. BMC Genomics 9:194. doi: 10.1186/1471-2164-9-194
Martínez-Medina, A., Fernández, I., Sánchez-Guzmán, M. J., Jung, S. C., Pascual, J. A., and Pozo, M. J. (2013). Deciphering the hormonal signalling network behind the systemic resistance induced by Trichoderma harzianum in tomato. Front. Plant Sci. 4:206. doi: 10.3389/fpls.2013.00206
Martínez-Medina, A., Fernandez, I., Lok, G. B., Pozo, M. J., Pieterse, C. M., and Van Wees, S. (2017). Shifting from priming of salicylic acid-to jasmonic acid-regulated defences by Trichoderma protects tomato against the root knot nematode Meloidogyne incognita. New Phytol. 213, 1363–1377. doi: 10.1111/nph.14251
Mastouri, F., Björkman, T., and Harman, G. E. (2012). Trichoderma harzianum enhances antioxidant defense of tomato seedlings and resistance to water deficit. Mol. Plant Microbe Interact. 25, 1264–1271. doi: 10.1094/MPMI-09-11-0240
Mayo, S., Cominelli, E., Sparvoli, F., González-López, O., Rodríguez-González, A., Gutiérrez, S., et al. (2016). Development of a qPCR strategy to select bean genes involved in plant defense response and regulated by the Trichoderma velutinum Rhizoctonia solani interaction. Front. Plant Sci. 7:1109. doi: 10.3389/fpls.2016.01109
McKersie, B. D., Hoekstra, F., and Krieg, L. (1990). Differences in the susceptibility of plant membrane lipids to peroxidation. Biochim. Biophys. Acta 1030, 119–126. doi: 10.1016/0005-2736(90)90246-k
Meshram, S., Patel, J. S., Yadav, S. K., Kumar, G., Singh, D. P., Singh, H. B., et al. (2019). Trichoderma mediate early and enhanced lignifications in chickpea during Fusarium oxysporum f. sp. ciceris infection. J. Basic Microbiol. 59, 74–86. doi: 10.1002/jobm.201800212
Mitra, P. P., and Loqué, D. (2014). Histochemical staining of Arabidopsis thaliana secondary cell wall elements. J. Vis. Exp. 87:e51381. doi: 10.3791/51381
Morán-Diez, E., Rubio, M. B., Domínguez, S., Hermosa, R., Monte, E., and Nicolás, C. (2012). Transcriptomic response of Arabidopsis thaliana after root colonization by Trichoderma harzianum. J. Plant Physiol. 169, 614–620. doi: 10.1016/j.jplph.2011.12.016
Nirmaladevi, D., Venkataramana, M., Srivastava, R. K., Uppalapati, S. R., Gupta, V. K., Yli-Mattila, T., et al. (2016). Molecular phylogeny, pathogenicity and toxigenicity of Fusarium oxysporum f. sp. lycopersici. Sci. Rep. 6:21367. doi: 10.1038/srep21367
Pandey, S. P., and Somssich, I. E. (2009). The role of WRKY transcription factors in plant immunity. Plant Physiol. 150, 1648–1655. doi: 10.1104/pp.109.138990
Patel, J. S., Kharwar, R. N., Singh, H. B., Upadhyay, R. S., and Sarma, B. K. (2017). Trichoderma asperellum (T42) and Pseudomonas fluorescens (OKC)-enhances resistance of pea against Erysiphe pisi through enhanced ROS generation and lignifications. Front. Microbiol. 8:306. doi: 10.3389/fmicb.2017.00306
Phukan, U. J., Jeena, G. S., and Shukla, R. K. (2016). WRKY transcription factors: molecular regulation and stress responses in plants. Front. Plant Sci. 7:760. doi: 10.3389/fpls.2016.00760
Pieterse, C. M., Van der Does, D., Zamioudis, C., Leon-Reyes, A., and Van Wees, S. C. (2012). Hormonal modulation of plant immunity. Annu. Rev. Cell Dev. Biol. 28, 489–521. doi: 10.1146/annurev-cellbio-092910-154055
Pieterse, C. M., Zamioudis, C., Berendsen, R. L., Weller, D. M., Van Wees, S. C., and Bakker, P. A. (2014). Induced systemic resistance by beneficial microbes. Annu. Rev. Phytopathol. 52, 347–375. doi: 10.1146/annurev-phyto-082712-102340
Pusztahelyi, T., Holb, I. J., and Pócsi, I. (2015). Secondary metabolites in fungus-plant interactions. Front. Plant. Sci. 6:573. doi: 10.3389/fpls.2015.00573
Qiu, Y., and Yu, D. (2009). Over-expression of the stress-induced OsWRKY45 enhances disease resistance and drought tolerance in Arabidopsis. Environ. Exp. Bot. 65, 35–47. doi: 10.1016/j.envexpbot.2008.07.002
Robert-Seilaniantz, A., Grant, M., and Jones, J. D. (2011). Hormone crosstalk in plant disease and defense: more than just jasmonate-salicylate antagonism. Annu. Rev. Phytopathol. 49, 317–343. doi: 10.1146/annurev-phyto-073009-114447
Ruocco, M., Lanzuise, S., Lombardi, N., Woo, S. L., Vinale, F., Marra, R., et al. (2015). Multiple roles and effects of a novel Trichoderma hydrophobin. Mol. Plant Microbe Interact. 28, 167–179. doi: 10.1094/MPMI-07-14-0194-R
Rushton, P. J., Torres, J. T., Parniske, M., Wernert, P., Hahlbrock, K., and Somssich, I. E. (1996). Interaction of elicitor-inducing DNA-binding proteins with elicitor response elements in the promoters of parsley PR1 genes. EMBO J. 15, 5690–5700. doi: 10.1002/j.1460-2075.1996.tb00953.x
Saed-Moucheshi, A., Shekoofa, A., and Pessarakli, M. (2014). Reactive oxygen species (ROS) generation and detoxifying in plants. J. Plant Nutr. 37, 1573–1585. doi: 10.1080/01904167.2013.868483
Sáenz-Mata, J., Salazar-Badillo, F. B., and Jiménez-Bremont, J. F. (2014). Transcriptional regulation of Arabidopsis thaliana WRKY genes under interaction with beneficial fungus Trichoderma atroviride. Acta Physiol. Plant 36, 1085–1093. doi: 10.1007/s11738-013-1483-7
Shankar, A., Pandey, A., and Pandey, G. K. (2013). WRKY transcription factor: role in abiotic and biotic stress. Plant Stress 7, 26–34.
Shaw, S., Le Cocq, K., Paszkiewicz, K., Moore, K., Winsbury, R., de Torres Zabala, M., et al. (2016). Transcriptional reprogramming underpins enhanced plant growth promotion by the biocontrol fungus Trichoderma hamatum GD12 during antagonistic interactions with Sclerotinia sclerotiorum in soil. Mol. Plant Pathol. 17, 1425–1441. doi: 10.1111/mpp.12429
Shen, Q.-H., Saijo, Y., Mauch, S., Biskup, C., Bieri, S., Keller, B., et al. (2007). Nuclear activity of MLA immune receptors links isolate-specific and basal disease-resistance responses. Science 315, 1098–1103. doi: 10.1126/science.1136372
Singh, B. N., Singh, A., Singh, S. P., and Singh, H. B. (2011). Trichoderma harzianum-mediated reprogramming of oxidative stress response in root apoplast of sunflower enhances defence against Rhizoctonia solani. Eur. J. Plant Pathol. 131, 121–134. doi: 10.1007/s10658-011-9792-4
Singh, P., Shekhar, S., Rustagi, A., Sharma, V., and Kumar, D. (2018). “Insights into the role of WRKY superfamily of protein transcription factor in defense response” in Molecular Aspects of Plant-Pathogen Interaction, eds A. Singh, I. K. Singh (Singapore: Springer), 185–202. doi: 10.1007/978-981-10-7371-7_8
Spence, C., Alff, E., Johnson, C., Ramos, C., Donofrio, N., Sundaresan, V., et al. (2014). Natural rice rhizospheric microbes suppress rice blast infections. BMC Plant Biol. 14:130. doi: 10.1186/1471-2229-14-130
Stafford, H. A. (1962). Histochemical & biochemical differences between lignin-like materials in Phleum pratense L. Plant Physiol. 37:643.
Sun, C., Palmqvist, S., Olsson, H., Borén, M., Ahlandsberg, S., and Jansson, C. (2003). A novel WRKY transcription factor, SUSIBA2, participates in sugar signaling in barley by binding to the sugar-responsive elements of the iso1 promoter. Plant Cell 15, 2076–2092. doi: 10.1105/tpc.014597
Taylor, A., Vagany, V., Barbara, D. J., Thomas, B., Pink, D. A. C., Jones, J. E., et al. (2013). Identification of differential resistance to six Fusarium oxysporum f. sp. cepae isolates in commercial onion cultivars through the development of a rapid seedling assay. Plant Pathol. 62, 103–111. doi: 10.1111/j.1365-3059.2012.02624.x
Tomato Genome Consortium. (2012). The tomato genome sequence provides insights into fleshy fruit evolution. Nature 485:635. doi: 10.1038/nature11119
Tominaga-Wada, R., Nukumizu, Y., and Wada, T. (2013). Tomato (Solanum lycopersicum) homologs of TRIPTYCHON (SlTRY) and GLABRA3 (SlGL3) are involved in anthocyanin accumulation. Plant Signal. Behav. 8:e24575. doi: 10.4161/psb.24575
Tucci, M., Ruocco, M., De Masi, L., De Palma, M., and Lorito, M. (2011). The beneficial effect of Trichoderma spp. on tomato is modulated by the plant genotype. Mol. Plant Pathol. 12, 341–354. doi: 10.1111/j.1364-3703.2010.00674.x
Untergasser, A., Cutcutache, I., Koressaar, T., Ye, J., Faircloth, B. C., Remm, M., et al. (2012). Primer3—new capabilities and interfaces. Nucleic Acids Res. 40:e115. doi: 10.1093/nar/gks596
van Esse, H. P., Fradin, E. F., de Groot, P. J., de Wit, P. J., and Thomma, B. P. (2009). Tomato transcriptional responses to a foliar and a vascular fungal pathogen are distinct. Mol. Plant Microbe Interact. 22, 245–258. doi: 10.1094/MPMI-22-3-0245
Vergne, E., Ballini, E., Marques, S., Sidi Mammar, B., Droc, G., Gaillard, S., et al. (2007). Early and specific gene expression triggered by rice resistance gene Pi33 in response to infection by ACE1 avirulent blast fungus. New Phytol. 174, 159–171. doi: 10.1111/j.1469-8137.2007.01971.x
Vives-Peris, V., Marmaneu, D., Gómez-Cadenas, A., and Pérez-Clemente, R. M. (2018). Characterization of Citrus WRKY transcription factors and their responses to phytohormones and abiotic stresses. Biol. Plant. 62, 33–44. doi: 10.1007/s10535-017-0737-4
Wada, T., Kunihiro, A., and Tominaga-Wada, R. (2014). Arabidopsis CAPRICE (MYB) and GLABRA3 (bHLH) control tomato (Solanum lycopersicum) anthocyanin biosynthesis. PLoS One 9:e109093. doi: 10.1371/journal.pone.0109093
Wada, T., Onishi, M., Kunihiro, A., and Tominaga-Wada, R. (2015). Overexpressing CAPRICE and GLABRA3 did not change the anthocyanin content of tomato (Solanum lycopersicum) fruit peel. Plant Signal. Behav. 10:e1000131. doi: 10.1080/15592324.2014.1000131
Wenke, K., Wanke, D., Kilian, J., Berendzen, K., Harter, K., and Piechulla, B. (2012). Volatiles of two growth-inhibiting rhizobacteria commonly engage AtWRKY18 function. Plant J. 70, 445–459. doi: 10.1111/j.1365-313X.2011.04891.x
Wojtaszek, P. (1997). Oxidative burst: an early plant response to pathogen infection. Biochem. J. 322, 681–692. doi: 10.1042/bj3220681
Ye, J., Coulouris, G., Zaretskaya, I., Cutcutache, I., Rozen, S., and Madden, T. L. (2012). Primer-BLAST: a tool to design target-specific primers for polymerase chain reaction. BMC Bioinformatics 13:134. doi: 10.1186/1471-2105-13-134
Yedidia, I., Benhamou, N., Kapulnik, Y., and Chet, I. (2000). Induction and accumulation of PR proteins activityduring early stages of root colonizationby the mycoparasite Trichoderma harzianum strain T-203. Plant Physiol. Biochem. 38, 863–873. doi: 10.1016/s0981-9428(00)01198-0
Yoshioka, Y., Ichikawa, H., Naznin, H. A., Kogure, A., and Hyakumachi, M. (2012). Systemic resistance induced in Arabidopsis thaliana by Trichoderma asperellum SKT-1, a microbial pesticide of seedborne diseases of rice. Pest Manag. Sci. 68, 60–66. doi: 10.1002/ps.2220
Yue, J., Xu, W., Ban, R., Hunag, S., Miao, M., Tang, X., et al. (2016). PTIR: predicted tomato interactome resource. Sci. Rep. 6:25047. doi: 10.1038/srep25047
Zehra, A., Meena, M., Dubey, M. K., Aamir, M., and Upadhyay, R. S. (2017). Synergistic effects of plant defense elicitors and Trichoderma harzianum on enhanced induction of antioxidant defense system in tomato against Fusarium wilt disease. Bot. Stud. 58:44. doi: 10.1186/s40529-017-0198-2
Zhang, S., Gan, Y., and Xu, B. (2016). Application of plant-growth-promoting fungi Trichoderma longibrachiatum T6 enhances tolerance of wheat to salt stress through improvement of antioxidative defense system and gene expression. Front. Plant Sci. 7:1405. doi: 10.3389/fpls.2016.01405
Zheng, Z., Qamar, S. A., Chen, Z., and Mengiste, T. (2006). Arabidopsis WRKY33 transcription factor is required for resistance to necrotrophic fungal pathogens. Plant J. 48, 592–605. doi: 10.1111/j.1365-313x.2006.02901.x
Zhou, J., Wang, J., Yu, J. Q., and Chen, Z. (2014). Role and regulation of autophagy in heat stress responses of tomato plants. Front. Plant Sci. 5:174. doi: 10.3389/fpls.2014.00174
Zhou, J., Wang, J., Zheng, Z., Fan, B., Yu, J. Q., and Chen, Z. (2015). Characterization of the promoter and extended C-terminal domain of Arabidopsis WRKY33 and functional analysis of tomato WRKY33 homologues in plant stress responses. J. Exp. Bot. 66, 4567–4583. doi: 10.1093/jxb/erv221
Zhou, Y., Ma, J., Xie, J., Deng, L., Yao, S., and Zeng, K. (2018). Transcriptomic and biochemical analysis of highlighted induction of phenylpropanoid pathway metabolism of citrus fruit in response to salicylic acid, Pichia membranaefaciens and oligochitosan. Postharvest Biol. Technol. 142, 81–92. doi: 10.1016/j.postharvbio.2018.01.021
Keywords: bio-priming, defense transcriptome, WRKY genes, lignification, gene expression
Citation: Aamir M, Kashyap SP, Zehra A, Dubey MK, Singh VK, Ansari WA, Upadhyay RS and Singh S (2019) Trichoderma erinaceum Bio-Priming Modulates the WRKYs Defense Programming in Tomato Against the Fusarium oxysporum f. sp. lycopersici (Fol) Challenged Condition. Front. Plant Sci. 10:911. doi: 10.3389/fpls.2019.00911
Received: 02 August 2018; Accepted: 27 June 2019;
Published: 30 July 2019.
Edited by:
Youssef Rouphael, University of Naples Federico II, ItalyReviewed by:
Dierk Wanke, University of Tübingen, GermanyDhananjaya Pratap Singh, National Bureau of Agriculturally Important Microorganisms (ICAR), India
Copyright © 2019 Aamir, Kashyap, Zehra, Dubey, Singh, Ansari, Upadhyay and Singh. This is an open-access article distributed under the terms of the Creative Commons Attribution License (CC BY). The use, distribution or reproduction in other forums is permitted, provided the original author(s) and the copyright owner(s) are credited and that the original publication in this journal is cited, in accordance with accepted academic practice. No use, distribution or reproduction is permitted which does not comply with these terms.
*Correspondence: Mohd Aamir, khan.aamir18@gmail.com