 Jianhua Zhao1*†
 Yuhui Xu2†
 Haoxia Li3Yue Yin1Wei An1Yanlong Li1Yajun Wang1Yunfang Fan1Ru Wan1Xin Guo2Youlong Cao1*
- 1National Wolfberry Engineering Research Center, Ningxia Academy of Agriculture and Forestry Sciences, Yinchuan, China
- 2Biomarker Technology Corporation, Beijing, China
- 3Desertification Control Research Institute, Ningxia Academy of Agriculture and Forestry Sciences, Yinchuan, China
Wolfberry (Lycium Linn. 2n = 24) fruit, Gouqizi, is a perennial shrub, traditional food and medicinal plant resource in China. Leaf and fruit related characteristics are economically important traits that are the focus for genetic improvement, but few studies into the molecular genetics of this crop have been reported to date. Here, an F1 population (302 individuals) derived from a cross between “NO.1 Ningqi” (Lycium barbarum L.) and “Chinese gouqi” (Lycium chinese Mill.) was constructed. We recorded fruit weight, longitude, diameter and index along with leaf length, width and index for three consecutive years from 2015 to 2017. Based on this population and these phenotypic data, we constructed the first high-density genetic map of Lycium using specific length amplified fragment sequencing (SLAF-seq) and analyzed quantitative trait loci (QTLs). The map contains 6733 single nucleotide polymorphisms and 12 linkage groups (LG) with a total map distance of 1702.45 cM and an average map distance of 0.253 cM. A total of 55 QTLs were mapped for more than 2 years, of which 18 stable QTLs for fruit index on LG 11, spanning an interval of 73.492–90.945 cM, were detected. qFI11-15 for fruit index was an impressive QTL with logarithm of odds (LOD) and proportion of variance explained (PEV) values reaching 11.07 and 19.7%, respectively. The QTLs on LG 11 were gathered tightly, having an average interval of less than 1 cM per QTL, suggesting that there might be a cluster region controlling fruit index. Remarkably, qLI10-2 and qLI11-2 for leaf index were detectable for 3 years. These results give novel insight into the genetic control of leaf and fruit related traits in Lycium and provide robust support for undertaking further positional cloning studies and implementing marker-assisted selection in seedlings.
Introduction
Wolfberry (Lycium Linn. 2n = 24) is an important plant resource for both food and medicine in China and has been cultivated for more than 500 years in Ningxia (Yao et al., 2018a). The shrub is a perennial, deciduous member of the Solanaceae family. Dried wolfberry fruit, Gouqizi, has been used for centuries in traditional herbal medicines and nourishing tonics (National Pharmacopoeia Committee, 2015; Chen et al., 2018). This valuable fruit is exported world-wide to consumers who have become increasingly accustomed to its taste and efficacy (Li and Jiang, 2014). Recently, Gouqizi consumption has risen steadily following the publication of medical research into the health benefits of ingesting wolfberry fruit (Amagase et al., 2009; Hsu et al., 2017; Yao et al., 2018b; Tian et al., 2019). The leaves of wolfberry can be used in cooking and dried to produce tea (Dong et al., 2009). Wolfberry shrubs are fast-growing with well-developed deep root systems and extensive adaptability to drought and cold. It is a pioneer species mainly planted in salty and alkaline areas in Northwest China (Liu Y. et al., 2018; Zhao et al., 2018).
Developing cultivars that bear fruit with characteristics that appeal to consumers will help to strengthen the wolfberry production industry. However, there has been a lack of genetic studies into the yield and quality of this crop. Current research is, in the main, limited to phenotypic research. A basic system for evaluating wolfberry fruit was established by An et al. (2007). Since then, a more comprehensive assessment system for fresh fruit has been developed and this was updated in 2017. Additionally, a useful collection of germplasm has been obtained (Shu et al., 2017; Zhao et al., 2018). Physiological research into the accumulation of sugars and acids in the plants and the response to salt stress in the shrub has also been carried out (Zhao et al., 2015, 2017). Recently, the identification of microRNAs present during anther development has provided valuable information about the molecular mechanism of male sterility in Lycium barbarum L. (Shi et al., 2018). Currently, there remains a large gap between research into the molecular biology of wolfberry and that for other plants, particularly model species. Moreover, it usually takes 2 years from germination to flowering for wolfberry, hybridization or backcrossing plus multiple rounds of phenotypic selection usually takes about 10 years. Therefore, improving the breeding efficiency of wolfberry is a huge challenge.
Genetic map based on F1 population for perennial fruit crops is a robust tool to identify the linkage between horticultural traits and molecular markers (Harel-Beja et al., 2015; Zhu et al., 2015). Moreover, with the rapid popularization of next-generation sequencing (NGS) technology, genome-wide single nucleotide polymorphisms (SNPs) have been used extensively to identify quantitative trait loci (QTLs) through creation of high density genetic maps or by means of bulk segregation analysis (Wang et al., 2012). For species that don’t have a reference genome, restriction enzyme digestion-based methods are effective for finding genome-wide SNPs. These techniques typically include restriction site-associated sequencing (RAD-seq), genotyping-by–sequencing and specific length amplified fragment sequencing (SLAF-seq) (Sun et al., 2013). Among these methods, SLAF-seq has proven to be an efficient technique for large-scale de novo SNP discovery and genotyping using high-throughput sequencing platforms. Moreover, it provides a high-resolution strategy for large-scale genotyping and genetic map generation that is applicable to a wide range of species and populations. Specifically, SLAF-based genetic maps have been reported in different perennial woody plants through the study of F1 populations (Zhu et al., 2015; Luo et al., 2016; Zhao et al., 2016; Fang et al., 2018; Lu et al., 2018).
Leaf shape is vital to yield performance in plants (Vlad et al., 2014; Teichmann and Muhr, 2015; Liu et al., 2016; Runions et al., 2017). Leaves and fruits are important components of the source-sink system in plants; the coordination of leaf and fruit shape is important to improving yield (Sonnewald and Fernie, 2018). In wolfberry, leaves and fruits differ amongst diverse germplasm resources. The leaves of wolfberry are needle-shaped, but bred cultivars have longer leaves and bear larger fruits, while the leaves of wild-type plants are predominantly narrow and the fruits are smaller (Chen et al., 2018; Zhao et al., 2018).
The purpose of this study was to construct a high density genetic map and determine the genetic characteristics of leaf- and fruit-related traits using NGS technology and population genetics methods, and next to enable the identification of the corresponding QTLs and potential molecular markers tightly linked with good traits.
Materials and Methods
Mapping Population Construction and Planting
A hybrid wolfberry population derived from a cross between “Ningqi NO.1” (Lycium barbarum L.) and “Chinese gouqi” (Lycium chinese Mill.) was generated in August 2014. The female parent “Ningqi NO.1” is an artificial breeding cultivar and the major wolfberry cultivar in north-west China. Its fruit is bright red and elliptical, while the leaf is lanceolate. The male parent “Chinese gouqi” is wild-type wolfberry. Its fruit is dark red, smaller and oblate; it is very tolerant to drought (Figure 1). The seeds of the hybrid F1 and the two parents were collected and sown in the Ningxia Academy of Agriculture and Forestry Sciences, National Wolfberry Germplasm Resources Garden (38° 380′ N, 106°9′ E), Yinchuan City, Hui Autonomous Region, Ningxia, China, in May of 2015. A total of 500 F1 individuals were produced, of which 302 randomly selected individuals were adopted for the mapping population. Water and fertilizer management was the same as that for the production field. Weeds were managed manually.
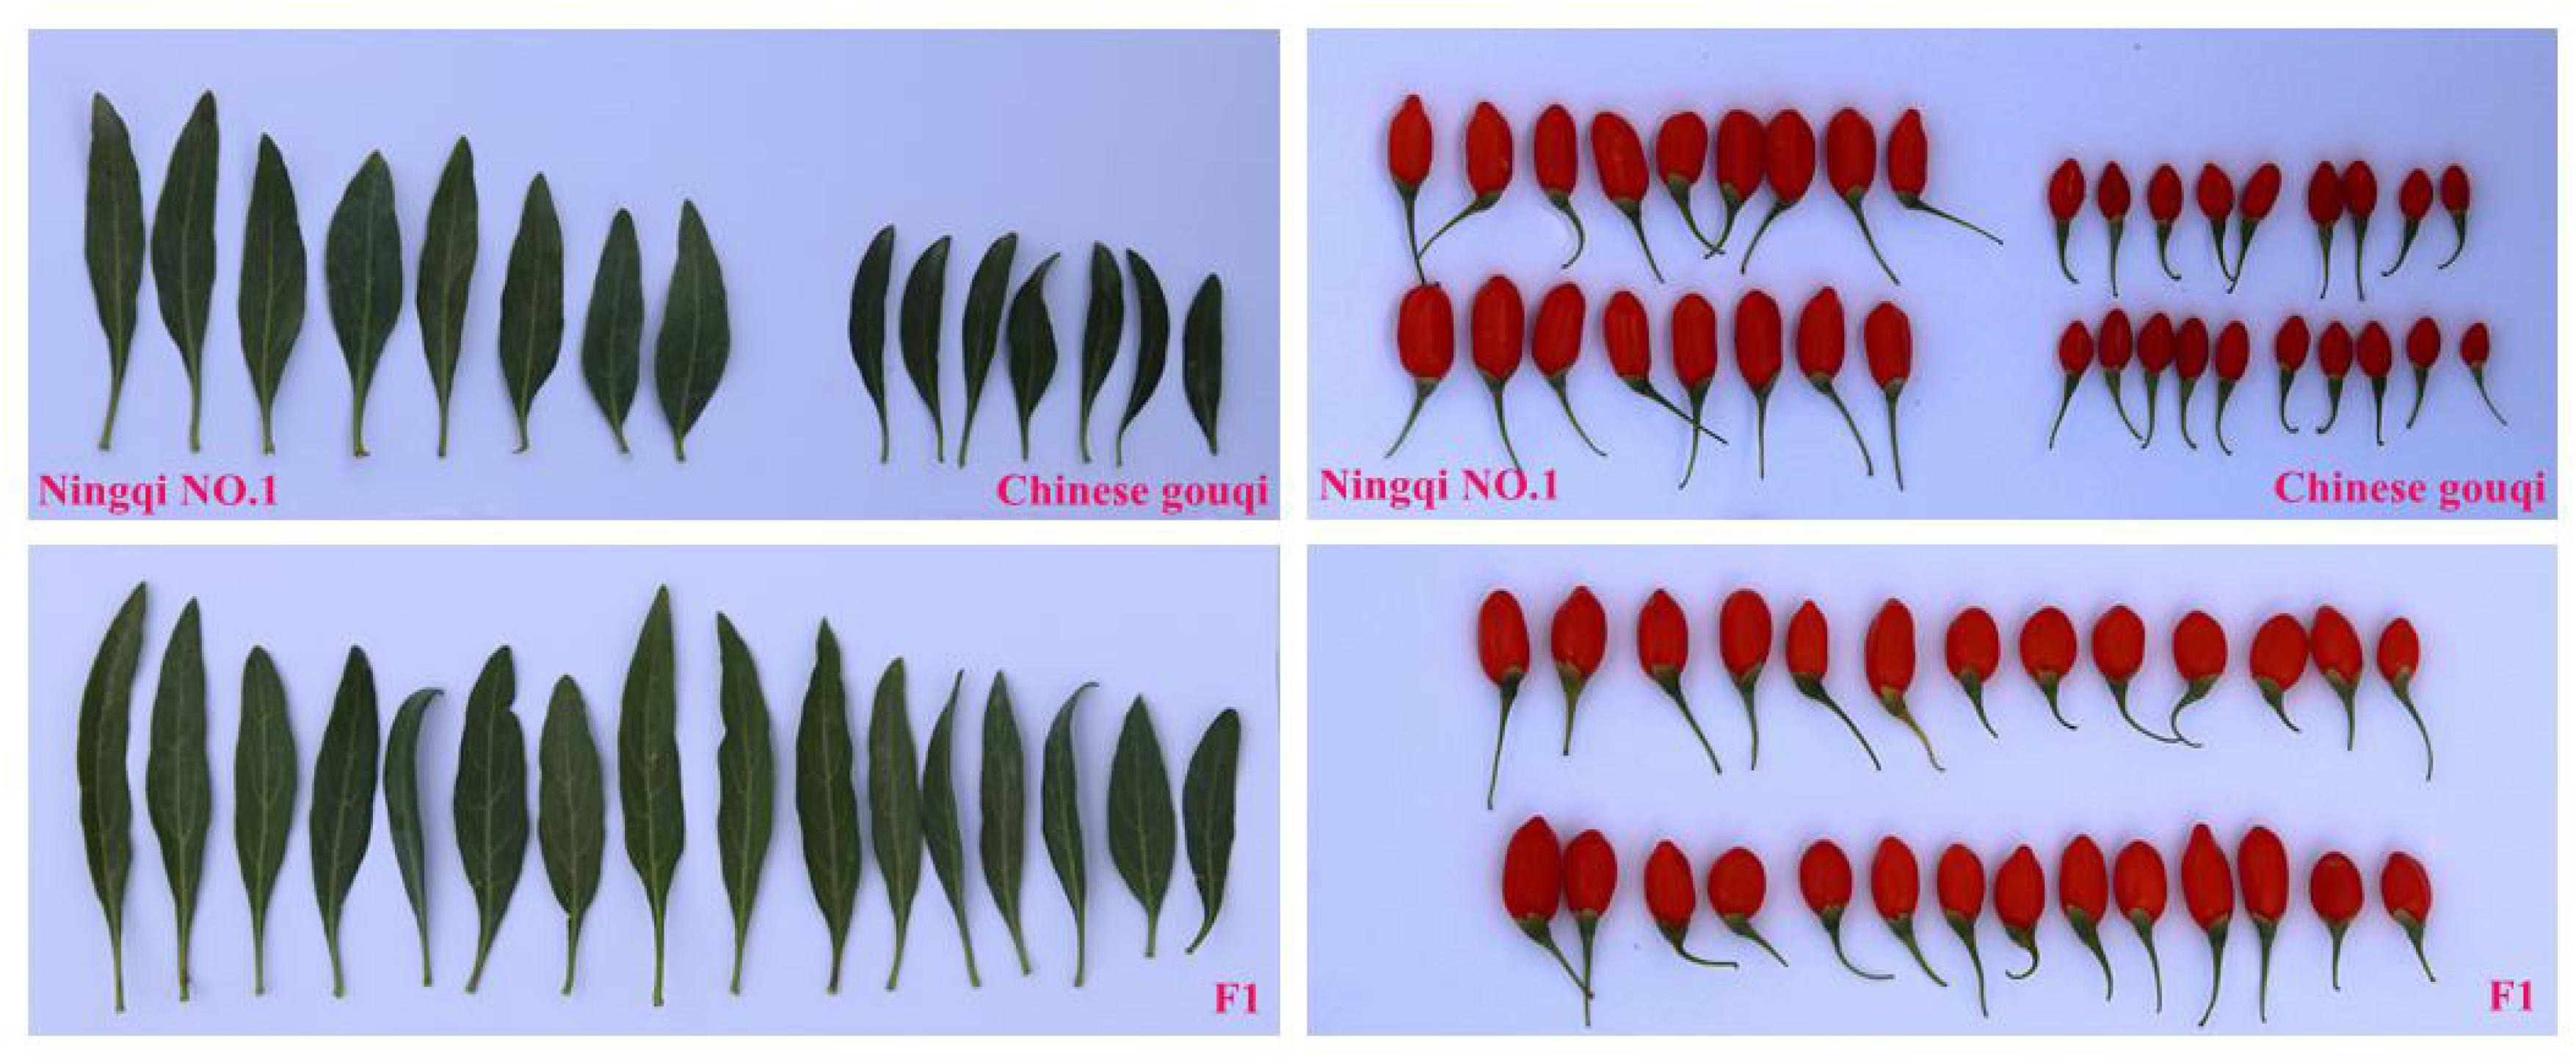
Figure 1. Leaf and fruit growth performance of Ningqi NO.1, Chinese gouqi and F1 individuals.
Phenotyping
For three consecutive years, the phenotypes of leaf and fruit related traits were recorded. Leaf length (LL) is the maximum distance between the leaf base and tip, leaf width (LW) is the widest distance across the leaf, single fruit weight (FW) is the weight of one mature fruit, fruit longitude (FL) is the maximum distance between fruits top to bottom, and fruit diameter (FD) is the widest distance across a fruit. LL, LW, FW, FL, and FD were measured according to the methods of Shi et al. (2012). LL, LW, FL, and FD were measured using vernier calipers, and FW was acquired using an electronic balance (SE602F, Ohaus, NJ, United States). LI and FI were calculated according to the following formulas: (i) LI = LL/LW; and (ii) FI = FL/FD. LL, LW and LI were recorded for three consecutive years from 2015 to 2017. FW, FL, FD and FI were recorded from 2016 to 2017. Phenotyping assays were conducted each July when summer fruits were ripe.
Since the growth of individual shrubs varied year on year, traits were measured in replicate. In 2015, 15 randomly selected leaves were evaluated for the four leaf-related traits. In 2016 and 2017, 20–30 replicate measurements were made of all seven traits. To establish more precise results, we ranked all measured values for each trait and individual and removed the maximum and the minimum values, leaving nine valid repeated measurements for 2015 and ten for both 2016 and 2017. Complex variance analysis, variance analysis and correlation analysis were carried out using the SPSS V17.0 software package (SPSS Inc., Chicago, IL, United States). Healthy young leaves (–2 g) were harvested separately from both parents and each F1 plant in July 2015, immediately soaked in liquid nitrogen and stored at −80°C in a freezer (Thermo Scientific, Waltham, MA, United States). Genomic DNA was extracted using a Trizol Kit (Tiangen Biotech, Beijing, China). DNA concentration was measured using a NanoDrop spectrophotometer (ND2000, Thermo Fisher Scientific) and DNA quality was monitored by electrophoresis on 0.85% agarose gels.
Specific Length Amplified Fragment Library Generation High-Throughput Sequencing
The prepared genomic DNA samples from all the F1 individuals, “Ningqi NO.1” and “Chinese gouqi” were digested using a combination of RsaI and HinCII (New England Biolabs, NEB, United States). Nucleotide (A) and duplex tag-labeled sequencing adapters were added to the digested products according to the method established by Luo et al. (2016). Eight cycles of traditional polymerase chain reaction (PCR) were performed with forward primer: 5′-AATGATACGGCGACCACCGA-3′ and reverse primer: 5′-CAAGCAGAAGACGGCATACG-3′) (Life Technologies, Gaithersburg, MD, United States), restriction ligation DNA samples, dNTPs and Q5R High-Fidelity DNA polymerase. Restriction-ligation-PCR products (364–411 bp) were then excised and purified using a QIAquick gel extraction kit (Qiagen, Hilden, Germany). Gel-purified products from each sample were pooled, loaded on three lanes and subjected to cBot cluster generation and sequencing using an Illumina HiSeq platform for 125 pair-end sequencing (Illumina, Inc., San Diego, CA, United States) according to the manufacturer’s instructions.
Single Nucleotide Polymorphism Development and Genotyping
Raw sequencing data were quality controlled by an in-house Perl script developed by Biomarker Technologies Co., Ltd., (Beijing, China). According to quality control criteria, reads for which >50% of bases had Q values ≤ 10 or ambiguous sequence content (“N”) of >10% were removed. The remaining reads were sorted by individual using duplex barcode sequences before trimming the barcodes. The subsequent clean sequence reads were uploaded onto the sequence read archive of the NCBI database (Accession number: PRJNA513212). BLAT software was used to group SLAF reads with parameter similarity = 90% and mean scores = 45 (Kent, 2002). A slightly modified SNP calling pipeline developed by Sun et al. (2013) was used. SLAF-tags with more than three SNPs were filtered out and individual loci with more than four genotypes were excluded because, for a diploid species, a single SLAF locus cannot capture more than four genotypes. SNPs with sequencing depths of more than fourfold in each parent were reserved and classified into eight segregation patterns (aa × bb, ab × cd, ef × eg, hk × hk, lm × ll, nn × np, ab × cc and cc × ab). All patterns except aa × bb were selected to construct a high-density genetic map for a cross pollinator population.
Genetic Linkage Map Construction and QTL Mapping
First, we carried out two-step SNP marker filtering to ensure that all eligible SNP markers were reserved for subsequent genetic map construction. Filtering was based on integrity (≤75%) and highly significant segregation distortion (SD; P < 0.01) as calculated using the Chi-square test. Secondly, SNP markers were arranged in linkage groups (LGs) based on the values of pairwise modified logarithm of odds (MLOD). Markers with MLOD scores >9 and recombination rate <0.4 were grouped into a single LG. SMOOTH algorithms (Van Ooijen, 2004) were used to correct genotypes and imputation. HighMap software was applied to order the SLAF markers within LGs (Liu et al., 2014). Map distances were estimated using the Kosambi mapping function (Kosambi, 1943).
The mean values for each trait and individual for each year were used as the final phenotypes for QTL mapping. MapQTL V5.0 was used to conduct QTL analyses (Van Ooijen, 2004) using the interval mapping model. The threshold LOD value for significance was 2.5. The percentage of phenotype variance explained by its corresponding QTL (Expl. %) was calculated based on the population variance within the segregating population. QTL naming was carried out according to McCouch et al. (1997).
Results
Leaf and Fruit Trait Variation Analyses
All leaf related agronomic traits were evaluated for three continuous years from 2015 to 2017 and fruit related traits were evaluated for two continuous years from 2016 to 2017. Complex variance analysis demonstrated that significant differences (P < 0.05 or P < 0.01) existed in all seven traits (LL, LW, LI, FW, FL, FD, and FI) in different years and F1 offspring, indicating that these traits can easily be affected by changing environmental conditions and abundant variation exists (Table 1). As shown in Table 2 and Supplementary Figure S1, the seven traits showed diverse variation in 302 offspring with coefficient of variation values ranging from 9 for FL in 2016 to 30 for FW in 2017. Values from Kolmogorov-Smirnov tests ranged from 0.8945 to 0.9022, indicating that all traits belonged to a positively normal distribution. Correlation analysis (Table 3) showed that significant or extreme positive correlations (P < 0.05 or P < 0.01) existed in coupled comparisons between FL and FW, FD and FW, FD and FL, LL and FI, LW and FW, LW and FL, LI and FI, and LI and LL, while FI and LW, LI and FW, and LI and LW pairs showed significant or extreme negative association (P < 0.05 or P < 0.01).
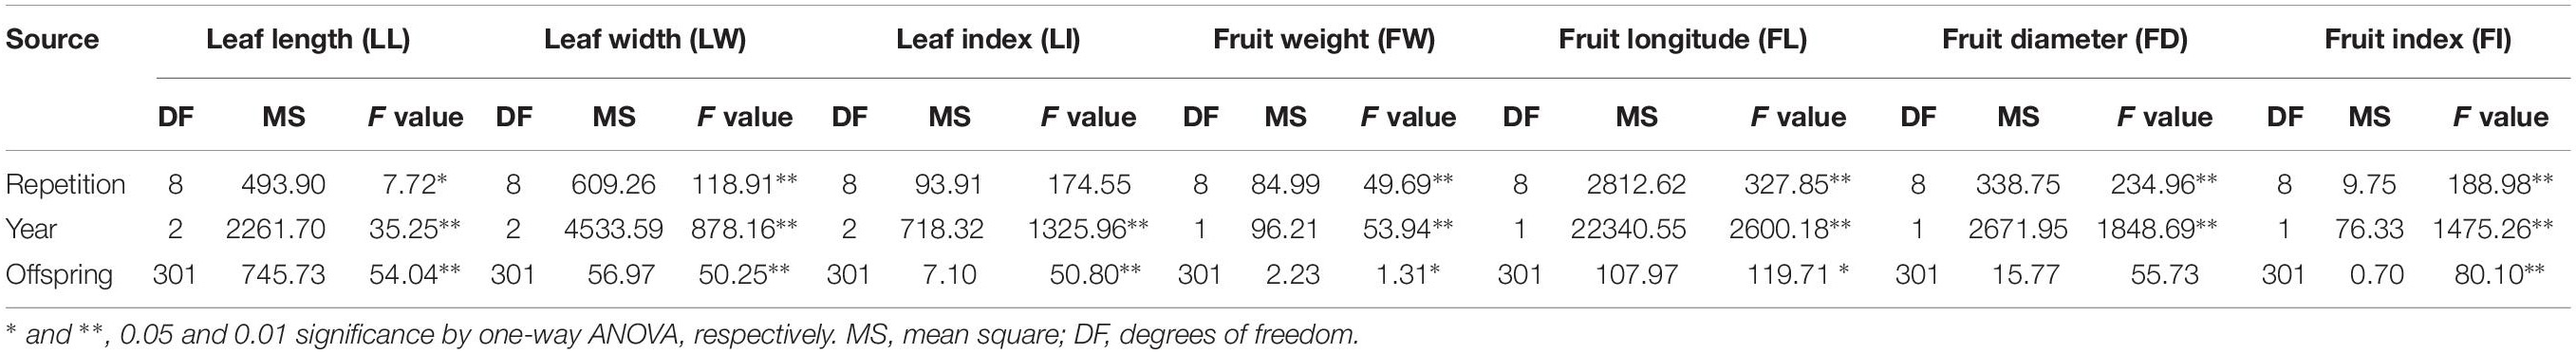
Table 1. Complex variance analysis of leaf- and fruit-related traits.
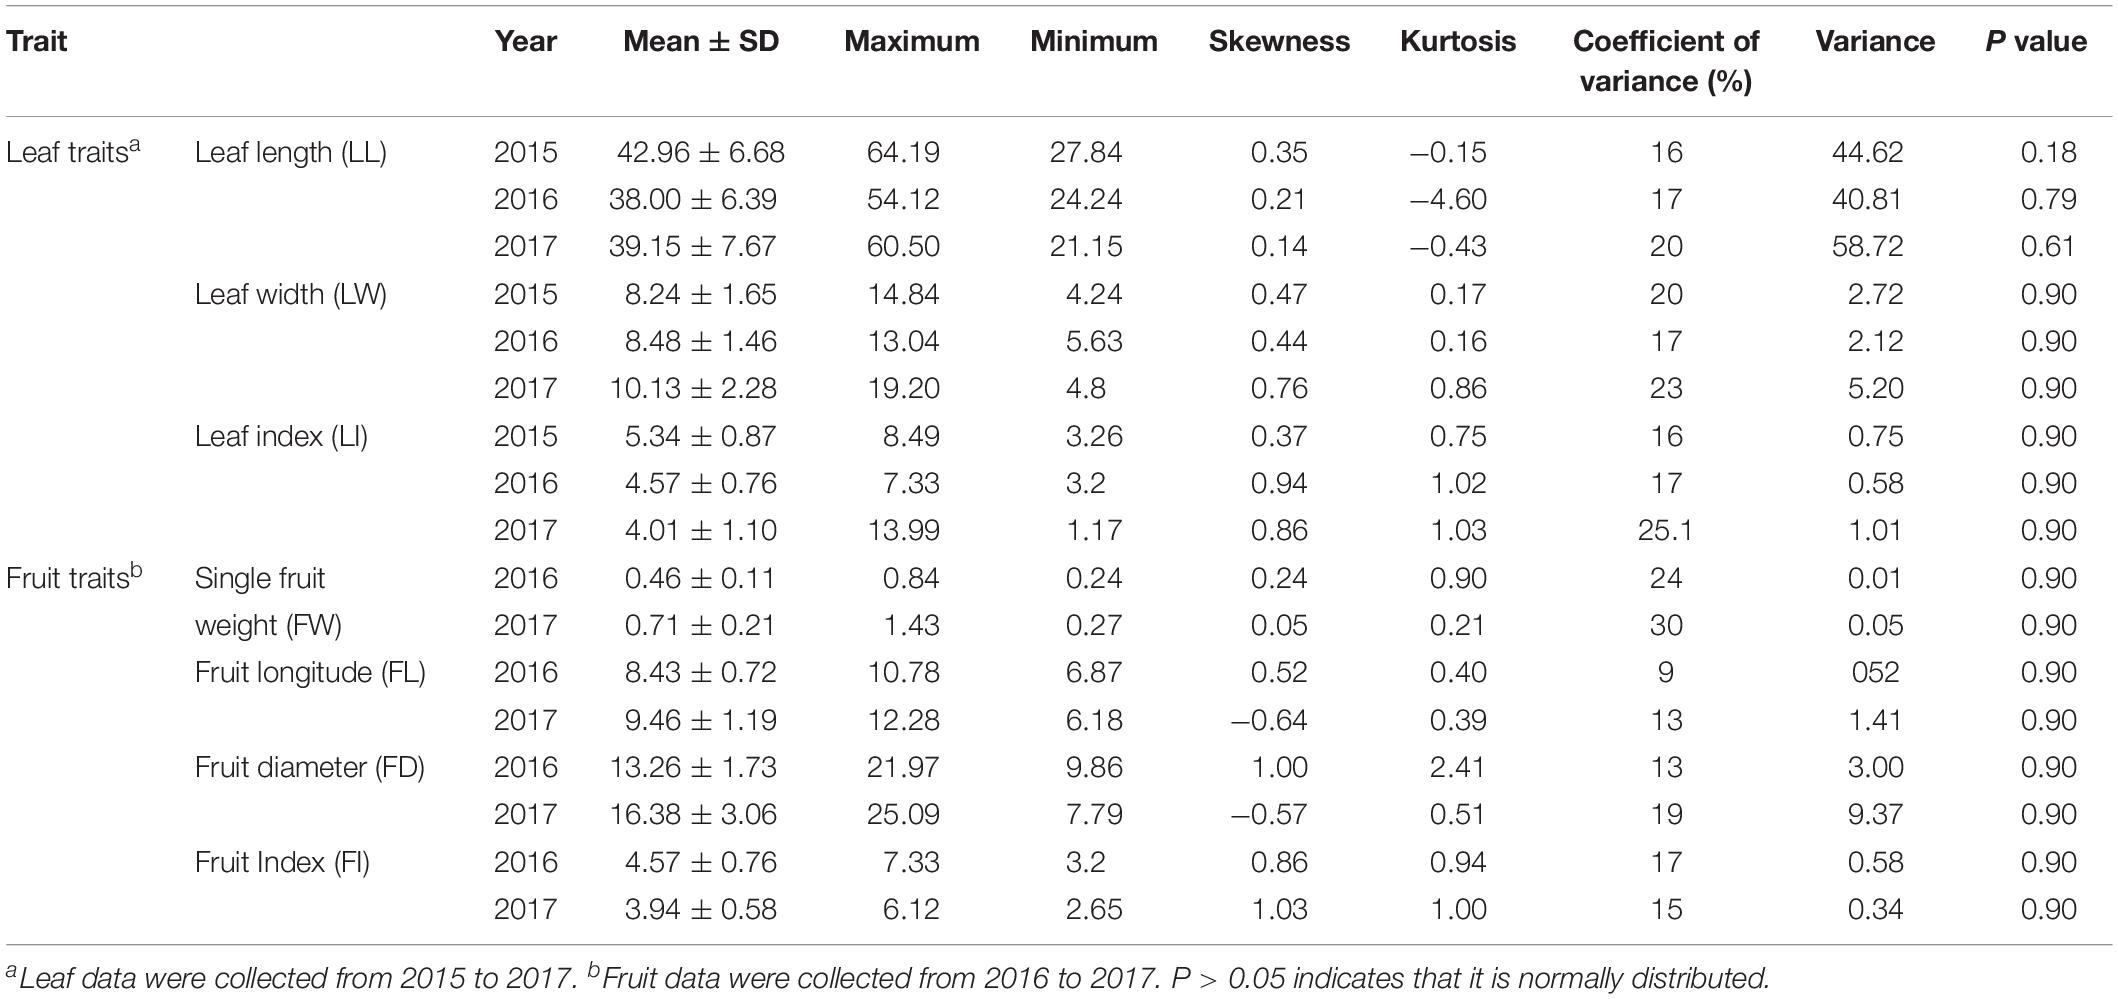
Table 2. The characteristics of leaf- and fruit-related traits of F1 individuals from 2015 to 2017.
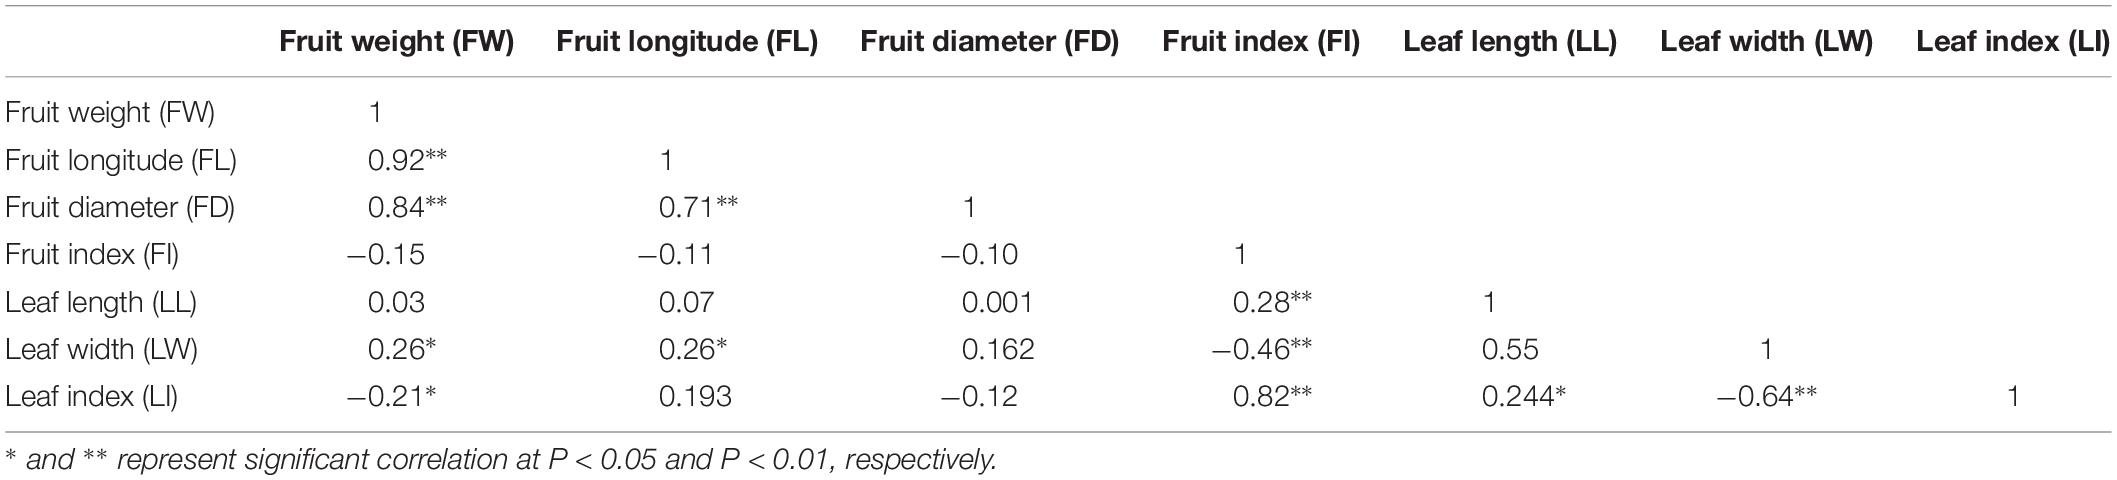
Table 3. The correlation between leaf- and fruit-related traits.
Specific Length Amplified Fragment Sequencing and Genotyping
High-throughput SLAF sequencing generated a total of 1,670 million clean pair-end reads with 24.43 and 14.34 million in the female and male parents, respectively. Approximately 5.40 million reads per individual were generated, of which the average Q30 was 95.15%, indicating that high-quality source data was generated. The average guanine-cytosine content was 39.67% and the fluctuation was less than 1.5% among offspring and parents. Correspondingly, a total of 1,078,383 SLAFs were detected with 377,632 in the female parent and 342,348 in the male parent, respectively. The average depths were 51.17-fold and 30.61-fold in the female parent and male parent, respectively. The average number of SLAFs for all 302 offspring was 201,073 with an average depth of 21.77-fold (Table 4 and Supplementary Table S1).
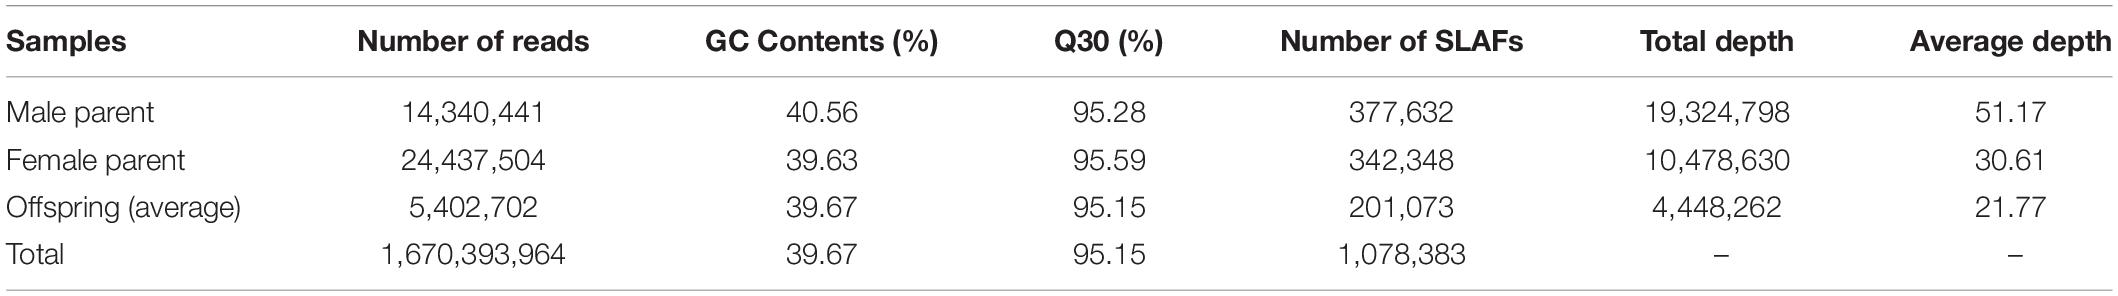
Table 4. Data generated during sequencing of the SLAF library.
Based on these high-quality data, we identified 672,790 SNPs in total. The numbers of SNPs detected in both the parents and offspring were 167,501 and 102,920 where a parental sequence depth of greater than four was used for segregation pattern classification. Detailed SNP classification information is shown in Table 5. As we had sufficient numbers of SNPs and fewer were classified into patterns ab × cc, cc × ab and ef × eg, SNPs in patterns hk × hk, lm × ll and nn × np were employed for pre-genetic map construction. To ensure the quality of the genetic map, markers with integrity ≤75% and highly significant SD (P < 0.01) were filtered out. Finally, a set of 6962 SNPs was used to construct the first high-density genetic map of wolfberry.
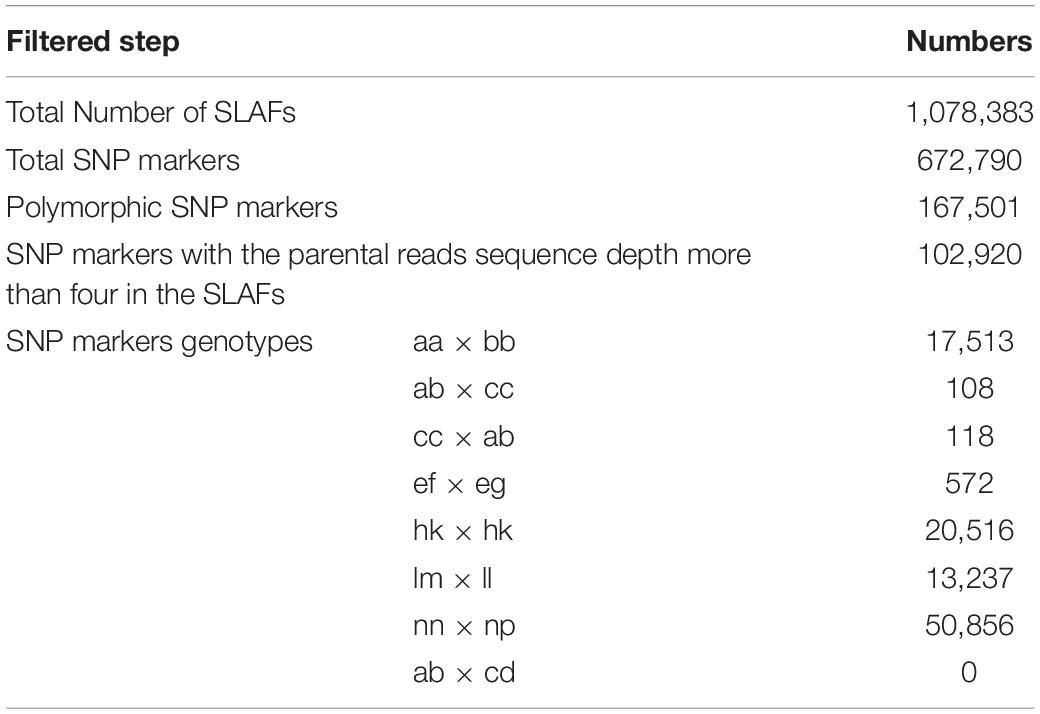
Table 5. Segregation patterns of SLAF markers.
Characteristics of the High-Density Genetic Map
From the final number of 6962 SNP markers, 6,733 were successfully integrated into female and male maps containing 4946 and 2455 SNPs, respectively. The integrated genetic map includes 12 LGs with a total genetic distance of 1702.45 cM and an average map distance of 0.25 cM (Figure 2). The highest number of markers (949) were located in LG11 with an average distance of 0.16 cM and a total genetic distance of 155.25 cM. The lowest number of markers (204) was in LG05 spanning 137.92 cM with an average distance of 0.68 cM. The largest gap stretched across 11.70 cM on LG03. The ratios of genetic distance between adjacent markers less than 5 cM ranged from 97.04 to 100% on LG10 and LG03, respectively. More detailed information, including total marker numbers, total distance, average distance, gaps below 5 cM and the maximum gap, is shown in Supplementary Table S2.
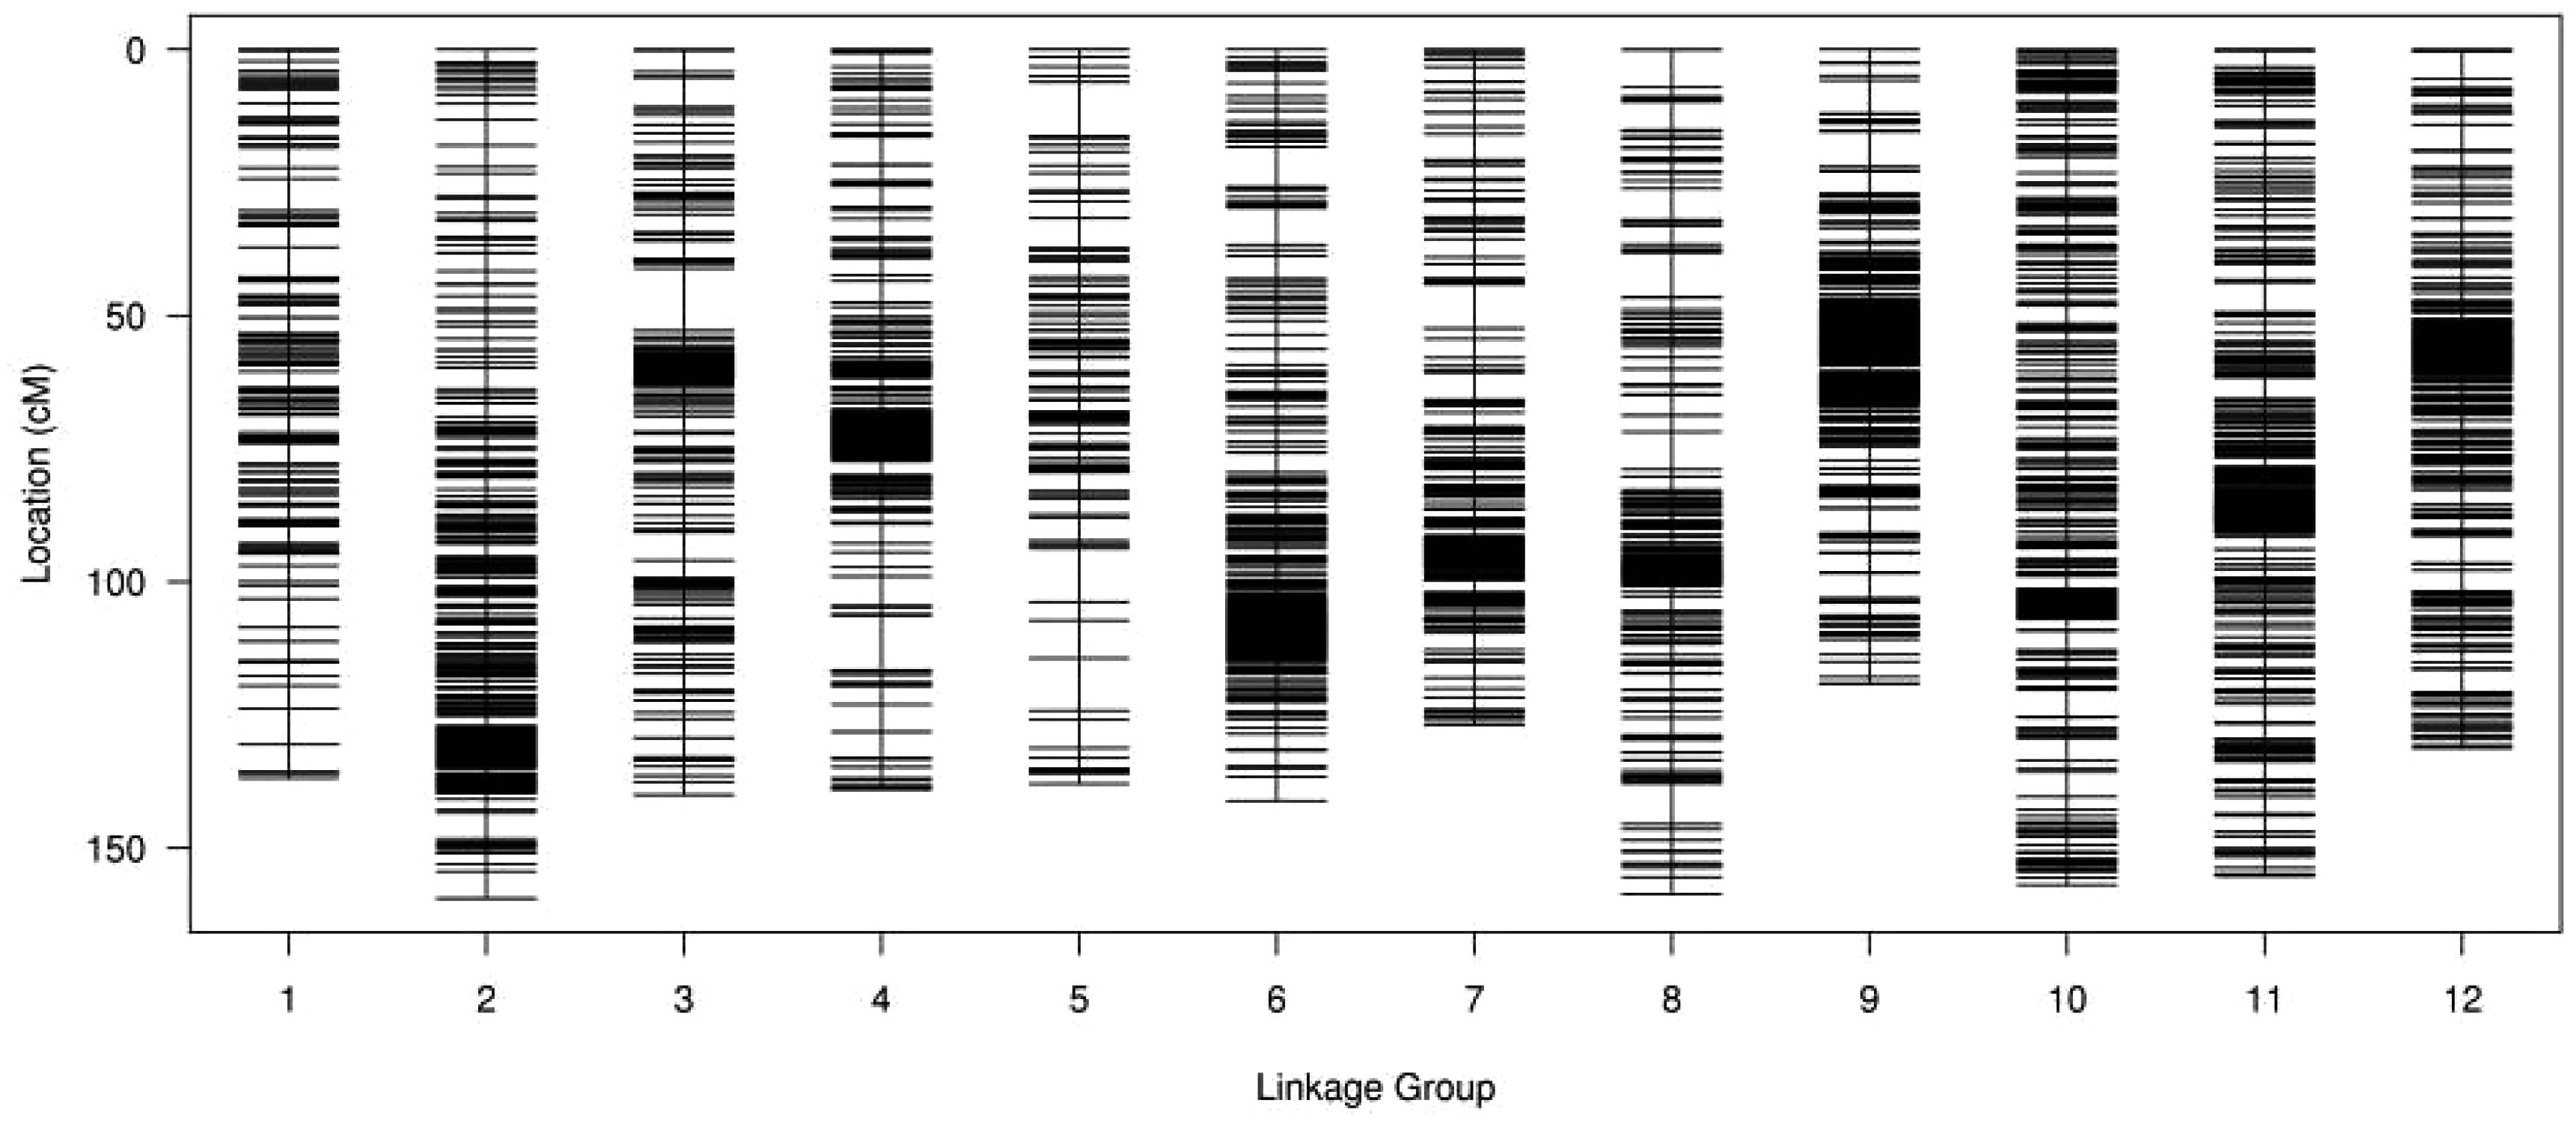
Figure 2. Distribution of SNP markers on 12 LGs of Lycium. A black bar indicates a SNP marker, x-axis indicates LG and y-axis represents genetic distance (cM).
Quantitative Trait Loci Mapping of Leaf and Fruit Related Traits
Using the interval mapping model in MapQTL V5.0, we mapped a large number of QTLs responsible for the seven traits (data not shown). In this paper, we measured traits for 3 years and found that significant or highly significant differences existed in all seven traits for different years, so we set the LOD threshold = 2.5 and focused our attention on QTLs that were detected steadily, meaning QTLs mapped in more than 2 years. Table 6 and Supplementary Figure S2 show all QTLs that were detected in more than 2 years.
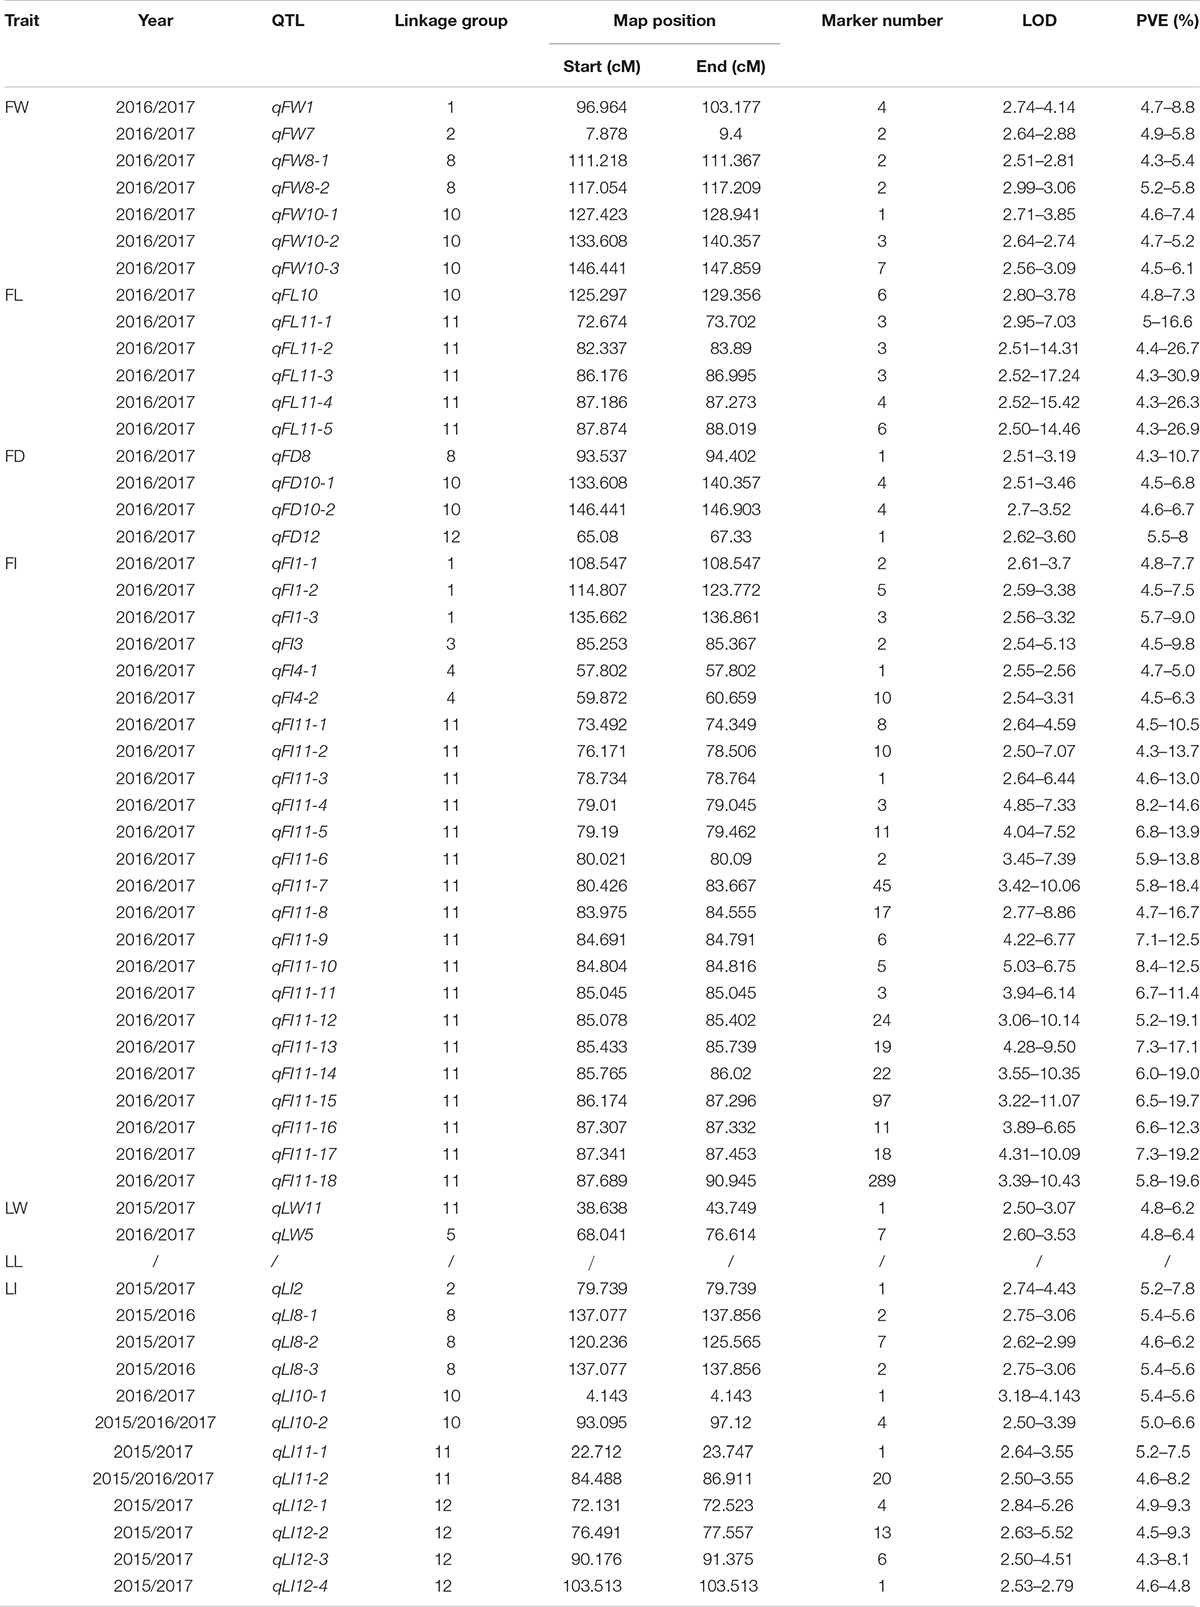
Table 6. Stable QTLs.
QTLs responsible for all traits except LL were detected and distributed on LG 1, 2, 3, 4, 5, 8, 10,11, and 12. Most QTLs were located on LG11, responsible for FL, FI, LW, and LI. The number of markers supporting corresponding QTLs was between 1 and 289, accounting for 4.3∼30.9% of the variation in their corresponding traits. The minimum LOD value of all QTLs was 2.5, while the maximum was 17.24.
Specifically, among the fruit-related traits, we detected seven QTLs for FW traits distributed on LG1, 2, 8 and 10. All proportion of variance explained (PVE) values were less than 10% and the QTL with the largest number of supporting markers (seven) was qFW10-3. QTLs controlling FL were mapped to LG10 and 11. The region of qFL10 coincided with qFW10-1, indicating they were the same QTL. The remaining QTLs were located on LG11, of which the LOD value of qFL11-3 was up to 17.24 with three supporting markers, and the corresponding PVE value was as high as 30.9%. There were four QTLs corresponding to FD, which spanned LG8, 10 and 12. On LG10, there were two QTLs (qFD1-1 and qFD1-2) with a total of eight supporting markers. The PVE of qFD8 on LG8 exceeded 10% (10.7%). Among all leaf and fruit related traits, FI was associated with the largest number of QTLs with a total of 24 distributed on LG1, 3, 4 and 11. Most QTLs (18) for FI were located on LG11 spanning the interval 73.492–90.945 cM (17.45 cM). The number of supporting markers was up to 289. The highest LOD and PVE value belonged to qFI11-15, reaching 11.07 and 19.7, respectively. These QTLs on LG11 were gathered tightly with an average interval of less than 1 cM per QTL, suggesting that it might be a cluster region controlling FI collectively.
As for leaf related traits, two stable QTLs were detected for LW, distributed on LG5 and 11, of which five markers supported qLW5 and the LOD value was up to 3.53. A total of 13 stable QTLs for LI were distributed on LG2, 8, 10, 11, and 12. Of particular note, amongst all 55 QTLs, qLI10-2 and qLI11-2 were detectable for 3 years and the interval was 93.095–97.120 cM with four supporting markers and 84.490–86.911 cM with 20 supporting markers, respectively. The PVE of all leaf related traits was within 10%, suggesting their minor-polygene genetic mechanism.
Discussion
For species without a reference genome, restriction enzyme digestion-based sequencing (Matsumura et al., 2014; Pootakham et al., 2015; Liu L. et al., 2018) or transcriptome sequencing (Li and Jiang, 2014; Zhou et al., 2016; Li et al., 2019) have become commonly used techniques for genome-wide de novo SNP discovery. SLAF-seq is an effective restriction enzyme digestion-based sequencing method for developing SNP markers and has been used in many different organisms (Luo et al., 2016; Chang et al., 2018; Fang et al., 2018). In this paper, we used SLAF-seq sequencing to develop a large number of SNP markers for two wolfberry accessions. At the same time, in order to guarantee the quality of the markers, we employed stricter filtering criteria (integrity ≥75%, SD ≥ 0.01) than other researchers (Wang et al., 2012; Zhang et al., 2016; Zhao et al., 2016; Zheng et al., 2018) and successfully generated a high-density genetic map harboring 6,733 SNP markers. This is the first high-density genetic map of wolfberry, which will lay a robust foundation for subsequent QTL mapping studies in order to shed light on the molecular biology of this crop. The map will be a useful tool for the comparative genomics (Swaminathan et al., 2012) and will assist with assembling a chromosome-scale reference genome for wolfberry.
Unlike densely planted crops that are easy to phenotype, F1 populations are normally developed for forest trees or shrubs with difficult field-management requirements. In general, the numbers of F1 individuals tend to be between 100 and 200 (Wang et al., 2012; Zhu et al., 2015; ıpek et al., 2016; Luo et al., 2016; Zhang et al., 2016; Lu et al., 2018; Zheng et al., 2018). In the present paper, 302 F1 individuals were used and the average genetic distance on the integrated genetic map was 0.253 cM, which is a higher resolution than previously reported (0.32–1.16 cM) using fewer individuals (Wang et al., 2012; Zhu et al., 2015; ıpek et al., 2016; Luo et al., 2016; Zhang et al., 2016; Lu et al., 2018; Zheng et al., 2018). This comparison supports the idea that more individuals can bring more recombination exchanges (De Massy, 2013), thus enabling higher resolution, which can improve the accuracy of QTL positioning and accelerate the fine positioning process (Pan et al., 2017; Zhang et al., 2018). Therefore, within an acceptable range, we encourage a population with more offspring to construct genetic maps and map QTLs for woody plants.
We identified a large number of QTLs, of which 55 could be stably detected (Table 6 and Supplementary Figure S2). Among these stable QTLs, qFL11-3 was detected in samples from 2016 and 2017 with LOD and PVE values up to 17.24 and 30.9%, respectively. qLI10-2 and qLI11-2 were mapped from 2015 to 2017 with four and 20 supporting SNPs, respectively, indicating their high reliability. In future research, these SNPs can be developed into KASP or HRM markers (Chang et al., 2018; Liu et al., 2019) to be used for molecular marker-assisted selection after the linkage states between SNP markers and their corresponding traits are verified in additional populations. Moreover, we can further fine map the QTLs by narrowing the region. Backcrossing is a traditional fine mapping strategy for introducing more recombination (Guo et al., 2018). In 2017, we selected F1 individuals with appropriate traits and crossed them with the parent Chinese gouqi. From this cross, we have obtained BC1 populations and will conduct phenotyping in 2018. In order to save time, we can generate two or more populations simultaneously by choosing an accession containing valuable QTLs that we want to isolate and two other accessions with relative characteristics to hybridize. The populations are used to perform traditional QTL positioning, then develop markers within QTLs and continue to narrow the interval. Grape VviAGL11 gene mapping was carried out using this method initially locating QTLs to a 1.70 Mb interval and then continuing to shrink the region to 323 Kb, achieving fine positioning of traits for seedlessness (Royo et al., 2018). At the same time, a transcriptome analysis study on the expression patterns among the developmental stages of leaves and fruit will accelerate the candidate gene mining progress (Wang et al., 2017).
QTLs for leaf and grain traits have been mapped or fine mapped in a number of crops (Digel et al., 2016; Tang et al., 2018; Zhai et al., 2018). In wolfberry, we wanted to assess the possibility of finding potential candidate genes through analysis of genome synteny with other species. It has been reported that eggplant, tomato and pepper show a high level of genome synteny (Rinaldi et al., 2016). These species, along with wolfberry, are all members of the Solanaceae and have genomes of 12 chromosomes. Therefore, recent reports of QTLs for leaf size and FW in tomato and pepper enabled us to go forward with the study of genome synteny with wolfberry (Illa-Berenguer et al., 2015; Chunthawodtiporn et al., 2018). We selected qLI10-2 and qLI11-2 for leaf related traits and qFL11-2, qFL11-3, qFL11-4, qFL11-5, qFI11-2 and qFI11-7 for fruit related traits, before extracting the corresponding SNP markers to map with the reference genomes of tomato1 and pepper2 using a BLAST search3 with identity = 90% (Supplementary Table S3). The mapping results showed that almost all SNP markers could be mapped onto the reference genomes of pepper or tomato, suggesting that broad genome fragments were shared between these Solanaceae species. However, we observed that most of the SNP markers in the same QTL region of wolfberry were scattered across different chromosomes, whether comparing with the pepper or tomato reference genomes indicating that a high degree of genome differentiation existed between wolfberry and these two species (Supplementary Table S3). Therefore, we believe that further evaluation is needed to explore candidate genes and underlying QTLs for wolfberry leaf and fruit morphological traits using genome synteny.
In the absence of a reference genome, it usually takes a considerable length of time to clone a gene by map-based cloning (Frary et al., 2000), Chromosome landing is a traditional paradigm to clone QTLs, although polymorphic markers are sometimes not easy to obtain (Tanksley et al., 1995). The MYB114 gene controlling red skin in pear was identified by anchoring the QTL region of two LOD peak markers to a physical map (Yao et al., 2017) and this method could be used for wolfberry, if a suitable reference genome were available. In recent years, especially with the development of long-read sequencing technologies such as Pacific Biosciences and Oxford Nanopore Technology, de novo assembly of a high-quality genome has become easier to realize (http://www.plabipd.de/index.ep). A reference genome of wolfberry will greatly accelerate the cloning of our stably expressed QTLs.
Conclusion
Our results indicate that SLAF-seq was an effective method to develop high quality SNPs that can be used to construct an ultra-dense genetic map for wolfberry (Lycium Linn.) without available reference genome sequences. The genetic map, including 6733 high-quality SNP markers, was constructed using an F1 population derived from a cross between “Ningqi NO.1” and “Chinese gouqi”. On account of this high-density genetic map and a set of three continuous years’ phenotyping data, 55 reproducible QTLs were detected as being responsible for leaf- and fruit-related traits. The SNPs containing favorable alleles within the QTL regions could offer promising selective markers for marker-assisted breeding at seedling stage. Our results provide a new pathway to the study of wolfberry molecular genetics and MAS breeding.
Author Contributions
JZ and YC conceived and designed the experiments. HL, YY, WA, YL, YW, YF, and RW performed the experiments and collected the data. JZ, YX, and XG analyzed and uploaded the data. JZ wrote the manuscript. YX revised the manuscript and edited the language. All authors revised the final submission of the manuscript.
Funding
This work was sponsored by the National Natural Science Foundation of China (31360191); Ningxia Hui Autonomous Region Science and Technology Innovation Leading Talents Project (KJT2017004); Ningxia Hui Autonomous Region Independent Innovation in Agricultural Science and Technology (NKYJ-18-16, NKYZ-16-0402, YES-16-0402, and QCYL-2018-0402); and Special Foundation for Agricultural Breeding of the Ningxia Hui Autonomous Region (2013NYYZ0101).
Conflict of Interest Statement
YX and XG were employed by the company Biomarker Technology Corporation.
The remaining authors declare that the research was conducted in the absence of any commercial or financial relationships that could be constructed as a potential conflict of interest.
Supplementary Material
The Supplementary Material for this article can be found online at: https://www.frontiersin.org/articles/10.3389/fpls.2019.00977/full#supplementary-material
FIGURE S1 | The frequency distribution histograms of traits in year 2015, 2016, and 2017.
FIGURE S2 | Integrated QTLs in the genetic maps.
TABLE S1 | Basic sequencing information statistics of all materials.
TABLE S2 | Detail information of the integrated map.
TABLE S3 | The BLAST results of SNP makers in QTLs for leaf and fruit traits of wolfberry.
Footnotes
- ^ ftp://ftp.solgenomics.net/tomato_genome/assembly/build_2.50/
- ^ www.pnas.org/lookup/suppl/doi:10.1073/pnas.1400975111/-/DCSupplemental
- ^ https://blast.ncbi.nlm.nih.gov/Blast.cgi
References
Amagase, H., Sun, B., and Borek, C. (2009). Lycium barbarum (goji) juice improves in vivo antioxidant biomarkers in serum of healthy adults. Nutr. Res. 29, 19–25. doi: 10.1016/j.nutres.2008.11.005
An, W., Zhao, J. H., Shi, Z. G., and Jiao, E. N. (2007). Evaluation criteria of some fruit quantitative characteristics of wolfberry (Lycium Linn.) genetic resources. J. Fruit Sci. 24, 172–175.
Chang, Y., Ding, J., Xu, Y., Li, D., Zhang, W., Li, L., et al. (2018). SLAF-based high-density genetic map construction and QTL mapping for major economic traits in sea urchin Strongylocentrotus intermedius. Sci. Rep. 8:820. doi: 10.1038/s41598-017-18768-y
Chen, J., Chao, C. T., and Wei, X. (2018). “Gojiberry breeding: Current Status and Future Prospects, Breeding and Health Benefits of Fruit and Nut Crops,” in Soneji and Madhugiri Nageswara-Rao, ed. R. Jaya (Rijeka: IntechOpen), doi: 10.5772/intechopen.76388
Chunthawodtiporn, J., Hill, T., Stoffel, K., and Van Deynze, A. (2018). Quantitative trait loci controlling fruit size and other horticultural traits in bell pepper (Capsicum annuum). Plant Genome 11:160125. doi: 10.3835/plantgenome2016.12.0125
De Massy, B. (2013). Initiation of meiotic recombination: how and where? Conservation and specificities among eukaryotes. Annu. Rev. Genet. 47, 563–599. doi: 10.1146/annurev-genet-110711-155423
Digel, B., Tavakol, E., Verderio, G., Tondelli, A., Xu, X., Cattivelli, L., et al. (2016). Photoperiod-H1 (Ppd-H1) controls leaf size. Plant Physiol. 172, 405–415. doi: 10.1104/pp.16.00977
Dong, J. Z., Lu, D. Y., and Wang, Y. (2009). Analysis of flavonoids from leaves of cultivated Lycium barbarum L. Plant Foods Hum. Nutr. 64, 199–204. doi: 10.1007/s11130-009-0128-x
Fang, L., Liu, H., Wei, S., Keefover-Ring, K., and Yin, T. (2018). High-density genetic map of Populus deltoides constructed by using specific length amplified fragment sequencing. Tree Genet. Genomes 14:79. doi: 10.1007/s11295-018-1290-9
Frary, A., Nesbitt, T. C., Frary, A., Grandillo, S., van der Knaap, E., Cong, B., et al. (2000). fw2.2: a quantitative trait locus key to the evolution of tomato fruit size. Science 289, 85–88. doi: 10.1126/science.289.5476.85
Guo, J., Xu, C., Wu, D., Zhao, Y., Qiu, Y., Wang, X., et al. (2018). Bph6 encodes an exocyst-localized protein and confers broad resistance to planthoppers in rice. Nat. Genet. 50, 297–306. doi: 10.1038/s41588-018-0039-36
Harel-Beja, R., Sherman, A., Rubinstein, M., Eshed, R., Bar-Ya’akov, I., Trainin, T., et al. (2015). A novel genetic map of pomegranate based on transcript markers enriched with QTLs for fruit quality traits. Tree Genet. Genomes 11, 1–18. doi: 10.1007/s11295-015-0936-0
Hsu, H. J., Huang, R. F., Kao, T. H., Inbaraj, B. S., and Chen, B. N. (2017). Preparation of carotenoid extracts and nanoemulsions from Lycium barbarum L. and their effects on growth of HT-29 colon cancer cells. Nanotechnology 28:135103. doi: 10.1088/1361-6528/aa5e86
Illa-Berenguer, E., Van Houten, J., Huang, Z., and van der Knapp, E. (2015). Rapid and reliable identification of tomato fruit weight and locule number loci by QTL-seq. Theor. Appl. Genet. 128, 1329–1342. doi: 10.1007/s00122-015-2509-x
ıpek, A., Yılmaz, K., Sıkıcı, P., Tangu, N. A., Öz, A. T., Bayraktar, M., et al. (2016). SNP discovery by GBS in olive and the construction of a high-density genetic linkage map. Biochem. Genet. 54, 313–325. doi: 10.1007/s10528-016-9721-5
Kent, W. J. (2002). BLAT-the BLAST-like alignment tool. Genome Res. 12, 656–664. doi: 10.1101/gr.229202
Kosambi, D. D. (1943). The estimation of map distances from recombination values. Ann. Hum. Genet. 12, 172–175.
Li, J., Xu, Y., and Wang, Z. (2019). Construction of a high-density genetic map by RNA sequencing and eQTL analysis for stem length and diameter in Dendrobium (Dendrobium nobile× Dendrobium wardianum). Indus. Crops Prod. 128, 48–54. doi: 10.1016/j.indcrop.2018.10.073
Liu, D., Ma, C., Hong, W., Huang, L., Liu, M., Liu, H., et al. (2014). Construction and analysis of high-density linkage map using high-throughput sequencing data. PLoS One 9:e98855. doi: 10.1371/journal.pone.0098855
Liu, G., Zhao, T., You, X., Jiang, J., Li, J., and Xu, X. (2019). Molecular mapping of the Cf-10 gene by combining SNP/InDel-index and linkage analysis in tomato (Solanum lycopersicum). BMC Plant Biol. 19:15. doi: 10.1186/s12870-018-1616-7
Liu, L., Luo, Q., Teng, W., Li, B., Li, H., Li, Y., et al. (2018). Development of Thinopyrum ponticum-specific molecular markers and FISH probes based on SLAF-seq technology. Planta 247, 1099–1108. doi: 10.1007/s00425-018-2845-6
Liu, X., Li, M., Liu, K., Tang, D., Sun, M., Li, Y., et al. (2016). Semi-Rolled Leaf2 modulates rice leaf rolling by regulating abaxial side cell differentiation. J. Exp. Bot. 67, 2139–2150. doi: 10.1093/jxb/erw029
Liu, Y., Song, Y., Zeng, S., Patra, B., Yuan, L., and Wang, Y. (2018). Isolation and characterization of a salt stress-responsive betaine aldehyde dehydrogenase in Lycium ruthenicum Murr. Physiol. Plant. 163, 73–87. doi: 10.1111/ppl.12669
Lu, J., Liu, Y., Xu, J., Xu, J., Mei, Z., Shi, Y., et al. (2018). High-density genetic map construction and stem total polysaccharide content-related QTL exploration for Chinese endemic Dendrobium (Orchidaceae). Front. Plant Sci. 9:398. doi: 10.3389/fpls.2018.00398
Luo, C., Shu, B., Yao, Q., Wu, H., Xu, W., and Wang, S. (2016). Construction of a high-density genetic map based on large-scale marker development in mango using specific-locus amplified fragment sequencing (SLAF-seq). Front. Plant Sci. 7:1310. doi: 10.3389/fpls.2016.01310
Matsumura, H., Miyagi, N., Taniai, N., Fukushima, M., Tarora, K., Shudo, A., et al. (2014). Mapping of the gynoecy in bitter gourd (Momordica charantia) using RAD-seq analysis. PLoS One 9:e87138. doi: 10.1371/journal.pone.0087138
McCouch, S. R., Cho, Y. G., Yano, M., Paul, E., and Blinstrub, M. (1997). Report on QTL nomenclature. Rice Genet. Newslett. 14, 11–13.
National Pharmacopoeia Committee (2015). Pharmacopoeia of People Republic of China. Beijing: Chemical Industry Press.
Pan, Q., Xu, Y., Li, K., Peng, Y., Zhan, W., Li, W., et al. (2017). The genetic basis of plant architecture in 10 maize recombinant inbred line populations. Plant Physiol. 175, 858–873. doi: 10.1104/pp.17.00709
Pootakham, W., Ruang-Areerate, P., Jomchai, N., Sonthirod, C., Sangsrakru, D., Yoocha, T., et al. (2015). Construction of a high-density integrated genetic linkage map of rubber tree (Hevea brasiliensis) using genotyping-by-sequencing (GBS). Front. Plant Sci. 6:367. doi: 10.3389/fpls.2015.00367
Rinaldi, R., Van Deynze, A., Portis, E., Rotino, G. L., Toppino, L., Hill, T., et al. (2016). New insights on eggplant/tomato/pepper synteny and identification of eggplant and pepper orthologous QTL. Front. Plant Sci. 7:1031. doi: 10.3389/fpls.2016.01031
Royo, C., Torres-Pérez, R., Mauri, N., Diestro, N., Cabezas, J. A., Marchal, C., et al. (2018). The major origin of seedless grapes is associated with a missense mutation in the MADS-box gene VviAGL11. Plant Physiol. 177, 1234–1253. doi: 10.1104/pp.18.00259
Runions, A., Tsiantis, M., and Prusinkiewicz, P. (2017). A common developmental program can produce diverse leaf shapes. New Phytol. 216, 401–418. doi: 10.1111/nph.14449
Shi, J., Chen, L., Zheng, R., Guan, C., Wang, Y., Liang, W., et al. (2018). Comparative phenotype and microRNAome in developing anthers of wild-type and male-sterile Lycium barbarum Linn. Plant Sci. 274, 349–359. doi: 10.1016/j.plantsci.2018.06.019
Shi, Z., Du, H., and Men, H. (2012). Goji Germplasm Resource Description Standardization and Data Standards. Beijing: China Forestry Publishing House, 50–56.
Shu, X., Yin, Y., An, W., Li, Y., Zhao, J., and Wang, J. (2017). Comparative analysis of functional and nutritional ingredients of wolfberry fruit in different varieties. J. Northwest For. Univ. 32, 157–164. doi: 10.3969/j.issn.1001-7461.2017.01.25
Sonnewald, U., and Fernie, A. R. (2018). Next-generation strategies for understanding and influencing source-sink relations in crop plants. Curr. Opin. Plant Biol. 43, 63–70. doi: 10.1016/j.pbi.2018.01.004
Sun, X., Liu, D., Zhang, X., Li, W., Liu, H., Hong, W., et al. (2013). SLAF-seq: an efficient method of large-scale de novo SNP discovery and genotyping using high-throughput sequencing. PLoS One 8:e58700. doi: 10.1371/journal.pone.0058700
Swaminathan, K., Chae, W. B., Mitros, T., Varala, K., Xie, L., Barling, A., et al. (2012). A framework genetic map for Miscanthus sinensis from RNAseq-based markers shows recent tetraploidy. BMC Genomics 13:142. doi: 10.1186/1471-2164-13-142
Tang, X., Gong, R., Sun, W., Zhang, C., and Yu, S. (2018). Genetic dissection and validation of candidate genes for flag leaf size in rice (Oryza sativa L.). Theor. Appl. Genet. 131, 801–815. doi: 10.1007/s00122-017-3036-8
Tanksley, S. D., Ganal, M. W., and Martin, G. B. (1995). Chromosome landing: a paradigm for map-based gene cloning in plants with large genomes. Trends Genet. 11, 63–68. doi: 10.1016/S0168-9525(00)88999-4
Teichmann, T., and Muhr, M. (2015). Shaping plant architecture. Front. Plant Sci. 6:233. doi: 10.3389/fpls.2015.00233
Tian, B., Zhao, J., An, W., Zhang, J., Cao, X., Mi, J., et al. (2019). Lycium ruthenicum diet alters the gut microbiota and partially enhances gut barrier function in male C57BL/6 mice. J. Funct. Foods 52, 516–528. doi: 10.1016/j.jff.2018.11.034
Van Ooijen, J. W. (2004). MapQTL® 5, Software for the Mapping of Quantitative Trait Loci in Experimental Populations, ed. B.V. Kyazma (Wageningen).
Vlad, D., Kierzkowski, D., Rast, M. I., Vuolo, F., Loio, R. D., Galinha, C., et al. (2014). Leaf shape evolution through duplication, regulatory diversification, and loss of a homeobox gene. Science 343, 780–783. doi: 10.1126/science.1248384
Wang, N., Fang, L., Xin, H., Wang, L., and Li, S. (2012). Construction of a high-density genetic map for grape using next generation restriction-site associated DNA sequencing. BMC Plant Biol. 12:148. doi: 10.1186/1471-2229-12-148
Wang, S. S., Cao, M., Ma, X., Chen, W., Zhao, J., Sun, C., et al. (2017). Integrated RNA sequencing and QTL mapping to identify candidate genes from Oryza rufipogon associated with salt tolerance at the seedling stage. Front Plant Sci. 8:1427. doi: 10.3389/fpls.2017.01427
Yao, G., Ming, M., Allan, A. C., Gu, C., Li, L., Wu, X., et al. (2017). Map-based cloning of the pear gene MYB114 identifies an interaction with other transcription factors to coordinately regulate fruit anthocyanin biosynthesis. Plant J. 92, 437–451. doi: 10.1111/tpj.13666
Yao, R., Heinrich, M., and Weckerle, C. S. (2018a). The genus Lycium as food and medicine: a botanical, ethnobotanical and historical review. J. Ethnopharmacol. 212, 50–66. doi: 10.1016/j.jep.2017.10.010
Yao, R., Huang, C., Chen, X., Yin, Z., Fu, Y., Li, L., et al. (2018b). Two complement fixing pectic polysaccharides from pedicel of Lycium barbarum L. Promote cellular antioxidant defense. Int. J. Biol. Macromol. 112, 356–363. doi: 10.1016/j.ijbiomac.2018.01.207
Zhai, H., Feng, Z., Du, X., Song, Y., Liu, X., Qi, Z., et al. (2018). A novel allele of TaGW2-A1 is located in a finely mapped QTL that increases grain weight but decreases grain number in wheat (Triticum aestivum L.). Theor. Appl. Genet. 131, 539–553. doi: 10.1007/s00122-017-3017-y
Zhang, D., Sun, L., Li, S., Wang, W., Ding, Y., Swarm, S. A., et al. (2018). Elevation of soybean seed oil content through selection for seed coat shininess. Nat. Plants 4, 30–35. doi: 10.1038/s41477-017-0084-7
Zhang, Z., Wei, T., Zhong, Y., Li, X., and Huang, J. (2016). Construction of a high-density genetic map of Ziziphus jujuba Mill. Using genotyping by sequencing technology. Tree Genet. Genomes 12:76.
Zhao, J., Li, H., Xi, W., An, W., Niu, L., Cao, Y., et al. (2015). Changes in sugars and organic acids in wolfberry (Lycium barbarum L.) fruit during development and maturation. Food Chem. 173, 718–724. doi: 10.1016/j.foodchem.2014.10.082
Zhao, J., Li, H., Zhang, C., An, W., Yin, Y., Wang, Y., et al. (2018). Physiological response of four wolfberry (Lycium Linn.) species under drought stress. J. Integr. Agric. 17, 603–612. doi: 10.1016/S2095-3119(17)61754-4
Zhao, J. H., Shu, X. Y., Li, H. X., Zheng, H. W., Yin, Y., An, W., et al. (2017). Analysis and comprehensive evaluation of the quality of wolfberry (Lycium L.) fresh fruits with different fruit colors. Sci. Agric. Sin. 50, 2338–2348. doi: 10.3864/j.issn.0578-1752.2017.12.014
Zhao, X., Huang, L., Zhang, X., Wang, J., Yan, D., Li, J., et al. (2016). Construction of high-density genetic linkage map and identification of flowering-time QTLs in orchard grass using SSRs and SLAF-seq. Sci. Rep. 6:29345. doi: 10.1038/srep29345
Zheng, X., Tang, Y., Yem, J., Pan, Z., Tan, M., Xie, Z., et al. (2018). SLAF-based construction of a high-density genetic map and its application in QTL mapping of carotenoids content in citrus fruit. J. Agric. Food Chem. 67, 994–1002. doi: 10.1021/acs.jafc.8b05176
Zhou, X., Wang, H., Cui, J., Qiu, X., Chang, Y., and Wang, X. (2016). Transcriptome analysis of tube foot and large scale marker discovery in sea cucumber, Apostichopus japonicus. Comp. Biochem. Physiol. Part D Genomics Proteomics 20, 41–49. doi: 10.1016/j.cbd.2016.07.005
Zhu, Y., Yin, Y., Yang, K., Li, J., Sang, Y., Huang, L., et al. (2015). Construction of a high-density genetic map using specific length amplified fragment markers and identification of a quantitative trait locus for anthracnose resistance in walnut (Juglans regia L.). BMC Genomics 16:614. doi: 10.1186/s12864-015-1822-8
Keywords: Lycium L., SLAF-seq, genetic map, leaf and fruit related traits, quantitative trait locus
Citation: Zhao J, Xu Y, Li H, Yin Y, An W, Li Y, Wang Y, Fan Y, Wan R, Guo X and Cao Y (2019) A SNP-Based High-Density Genetic Map of Leaf and Fruit Related Quantitative Trait Loci in Wolfberry (Lycium Linn.). Front. Plant Sci. 10:977. doi: 10.3389/fpls.2019.00977
Received: 09 February 2019; Accepted: 11 July 2019;
Published: 07 August 2019.
Edited by:
Jianjun Chen, University of Florida, United StatesReviewed by:
Pedro Martinez-Gomez, Spanish National Research Council (CSIC), SpainJinjin Jiang, Yangzhou University, China
Copyright © 2019 Zhao, Xu, Li, Yin, An, Li, Wang, Fan, Wan, Guo and Cao. This is an open-access article distributed under the terms of the Creative Commons Attribution License (CC BY). The use, distribution or reproduction in other forums is permitted, provided the original author(s) and the copyright owner(s) are credited and that the original publication in this journal is cited, in accordance with accepted academic practice. No use, distribution or reproduction is permitted which does not comply with these terms.
*Correspondence: Jianhua Zhao, zhaojianhua0943@163.com; Youlong Cao, caoyonglong@nwberc.com.cn
†These authors have contributed equally to this work