 Venkata Ravi Prakash Reddy1
 Shouvik Das1
 Harsh Kumar Dikshit1*
 Gyan Prakash Mishra1
 Muraleedhar Aski1
 Surendra Kumar Meena2,3
 Akanksha Singh1,4
 Renu Pandey2
 Madan Pal Singh2
 Kuldeep Tripathi5
 Padmavati Ganpat Gore6
 Priti1Twinkle Kumari Bhagat1
 Shiv Kumar7
 Ramakrishnan Nair8Tilak Raj Sharma9
- 1Division of Genetics, ICAR-Indian Agricultural Research Institute, New Delhi, India
- 2Division of Plant Physiology, ICAR-Indian Agricultural Research Institute, New Delhi, India
- 3Division of Basic Science, ICAR-Indian Institute of Pulses Research, Kanpur, India
- 4Amity Institute of Organic Agriculture, Amity University, Noida, India
- 5Division of Germplasm Evaluation, ICAR-National Bureau of Plant Genetic Resources, New Delhi, India
- 6Division of Germplasm Conservation, ICAR-National Bureau of Plant Genetic Resources, New Delhi, India
- 7Biodiversity and Integrated Gene Management Program, International Center for Agricultural Research in the Dry Areas, Rabat, Morocco
- 8South and Central Asia, World Vegetable Center, Patancheru, India
- 9Division of Crop Science, Indian Council of Agricultural Research, New Delhi, India
Mungbean (Vigna radiata L. Wilczek) is an annual grain legume crop affected by low availability of phosphorus. Phosphorus deficiency mainly affects the growth and development of plants along with changes in root morphology and increase in root-to-shoot ratio. Deciphering the genetic basis of phosphorus use efficiency (PUE) traits can benefit our understanding of mungbean tolerance to low-phosphorus condition. To address this issue, 144 diverse mungbean genotypes were evaluated for 12 PUE traits under hydroponics with optimum- and low-phosphorus levels. The broad sense heritability of traits ranged from 0.63 to 0.92 and 0.58 to 0.92 under optimum- and low-phosphorus conditions, respectively. This study, reports for the first time such a large number of genome wide Single nucleotide polymorphisms (SNPs) (76,160) in mungbean. Further, genome wide association study was conducted using 55,634 SNPs obtained by genotyping-by-sequencing method. The results indicated that total 136 SNPs shared by both GLM and MLM models were associated with tested PUE traits under different phosphorus regimes. We have identified SNPs with highest p value (–log10(p)) for some traits like, TLA and RDW with p value (–log10(p)) of more than 6.0 at LP/OP and OP condition. We have identified nine SNPs (three for TLA and six for RDW trait) which was found to be present in chromosomes 8, 4, and 7. One SNP present in Vradi07g06230 gene contains zinc finger CCCH domain. In total, 71 protein coding genes were identified, of which 13 genes were found to be putative candidate genes controlling PUE by regulating nutrient uptake and root architectural development pathways in mungbean. Moreover, we identified three potential candidate genes VRADI11G08340, VRADI01G05520, and VRADI04G10750 with missense SNPs in coding sequence region, which results in significant variation in protein structure at tertiary level. The identified SNPs and candidate genes provide the essential information for genetic studies and marker-assisted breeding program for improving low-phosphorus tolerance in mungbean.
Introduction
The genus Vigna includes about 100 species dispersed in subtropical and tropical region globally (Tomooka et al., 2002; Maxted et al., 2004). Among these green gram, black gram (Vigna mungo), cowpea (Vigna unguiculata), adzuki bean (Vigna angularis), moth bean (Vigna aconitifolia), creole bean (Vigna glabrescens), and tuber cowpea (Vigna vexillata) have been domesticated (Takahashi et al., 2016). The wild species are adapted to acid soils, deserts, limestone rocks, sandy beaches, and wetlands (Tomooka et al., 2011). Mungbean is native of India and Central Asia. The closest relative of mungbean is Vigna radiata var. sublobata (Roxb.) Verdc., occurring in wild state in Western Ghats and Sub-Himalayan tract. From India, mungbean spread to Southeast Asia and through silk road (Tomooka et al., 1992). Mungbean is cultivated in over 7 mha with production of about 5 mt in the world (Nair et al., 2019). The crop is generally grown in East, South, and Southeast Asia. Mungbean is a rich source of protein, minerals, and vitamins (Mubarak, 2005). Mungbean is consumed as dhal (whole grain or split) in South Asia and as sprouts, noodles, and paste in East Asia.
Phosphorus (P) is required for photosynthesis, redox reactions, energy production, and phosphorylation/dephosphorylation. The uptake of inorganic P by plants ranges from 10 to 25% (Johnston et al., 2014). Despite being abundant in agricultural soils, the majority of P occurs in an insoluble form (Menzies and Lucia, 2009). P is fixed in acidic soils by metal oxides and by carbonate compounds in alkaline soil or it exists as organic P (Heuer et al., 2017). Low bioavailability of P in soil is due to slow diffusion and high fixation. It is reported that 50% of the world’s arable land is P deficient (Lynch, 2011). Sedimentary deposits are main source of P reserves and account for 80–90% P production. The phosphate rocks are generally located in China, Western Sahara, Morocco, and Russia (Kauwenbergh et al., 2013). These non-renewable, irreplaceable, and finite global phosphate reserves are depleting and are expected to exhaust by the end of this century (Manschadi et al., 2014). The demand for P is increasing to meet the food security of growing population. Environmental problems like water eutrophication and soil degradation result from overuse of phosphorus.
The natural P fertilizer is a limited resource. It is imperative to enhance P fertilizer use efficiency to develop plants with higher uptake and utilization of phosphorous. Phosphorus use efficiency (PUE) measures ability of plant for phosphorus uptake and its use for production of biomass or yield (Wiel et al., 2016). Under P starvation condition, plants activate a range of mechanisms which results in higher uptake of P from soil (Ramaekers et al., 2010). Plant traits increasing P uptake ability includes change in root architecture such as increased lateral root number, root hair length and density, and high root-to-shoot ratio (Lin et al., 2009; Peret et al., 2011). The modification of root architecture along with the exudation of P mobilizing organic acids which results in enhancement of P uptake by plants (Lambers et al., 2006). It is established that vigorous root system with increased nutrient acquisition ability can lead to yield increase under optimized nutrient management system (Vinod and Heuer, 2012). The Pup1-specific protein kinase gene and phosphorus-starvation tolerance 1 is reported to be enhancer of early root growth which leads to more acquisition of P in plants (Gamuyao et al., 2012).
The quantitative trait loci (QTLs) for PUE traits in response to P starvation have been reported in crop plants such as wheat (Su et al., 2009; Yuan et al., 2017), rice (Luo et al., 2017; Mahender et al., 2018), corn (Zhu et al., 2005; Chen et al., 2008), common beans (Yan et al., 2004), and soybean (Liang et al., 2010). Conventional linkage mapping utilizes bi-parental mapping populations developed through controlled crosses. Identification of QTLs with small effect requires large population size in bi-parental mapping (Collard et al., 2005). QTL mapping covers small portion of the genetic architecture for a trait as only the allele differing between the parents segregate. Furthermore, bi-parental mapping has less generation and offspring to extensive shuffling of genome and QTLs are localized to a large part of chromosomal regions (10 to 20 cM) (Flint-Garcia et al., 2003).
The association mapping (AM) utilizes panel of diverse genotypes for genome-wide association studies for identification of trait-linked molecular tags. QTLs are identified based on association of marker with trait elucidated by LD between makers and polymorphisms across the AM panel. AM has advantage of the populations undergoing many generations of recombination. Thus, AM provides much finer resolution than genetic mapping. Genome-wide association study (GWAS) have evolved over the last few years into a powerful tool which exploits hundreds of markers across all chromosomes to find genetic variations associated with particular trait (Hirschhorn and Daly, 2005). GWAS and high-throughput next-generation sequencing (NGS) platform make AM as best approach for QTL mapping in plants (Atwell et al., 2010). The genotyping by sequencing (GBS) is a simple and attractive high-throughput multiplexed sequencing method that involves discovery and genotyping of marker (Poland and Rife, 2012). The robustness and low cost of GBS makes this as an outstanding tool for many applications in plants. Since its inception, GBS assay has been successfully applied to develop genetic linkage maps, GWAS, and fine mapping/map-based cloning of QTLs in diverse crops, including soybean (Bastien et al., 2014; Jarquin et al., 2014) and chickpea (Kujur et al., 2015; Upadhyaya et al., 2016).
Single nucleotide polymorphism (SNP) markers are highly desirable for marker-assisted selection (MAS) due to their abundance, locus specificity, codominant inheritance, and high-throughput genotyping (Terakami et al., 2011). Significant SNPs associated with PUE-related traits have been reported in rice (Wissuwa et al., 2015), maize (Wang et al., 2019), cowpea (Ravelombola et al., 2017), oilseed rape (Wang et al., 2017), and soybean (Ning et al., 2016). To our knowledge, to date, a SNP marker associated with PUE traits in mungbean has not been reported. Keeping the importance of P uptake and utilization efficiency traits in mind, the present study aimed to decipher the complex genetic architecture of PUE in mungbean. The study will also lead to advancement of mungbean genomics by enriching the mungbean genome with the development of SNP markers.
Materials and Methods
Constitution of Association Mapping Panel and Growing Condition in Hydroponics System
The AM panel for GWAS comprised 144 mungbean genotypes including 40 released varieties, 42 advanced breeding lines (ABL), and 62 exotic germplasm lines (Supplementary Table S1). The experiment was conducted under controlled environment facility at the Indian Agricultural Research Institute, New Delhi, India using hydroponics approach. The seedlings were evaluated in completely randomized design with three replications. In each replication, eight plants per genotype were evaluated. Air temperature in the greenhouse was maintained at 30/18°C (day/night), photoperiod for 12 h, and the relative humidity at 90%. In order to screen genotypes, surfaces of seeds were sterilized with 0.1% (w/v) HgCl2 for 3 min and washed thrice with distilled water to remove detergent. The seeds were kept for germination in germination paper. After emergence of cotyledonary leaves, uniformly germinated seedlings were transferred to modified Hoagland solution with two levels of P. Two P levels were balanced using KH2PO4 as optimum P (250 μM) and low P (3 μM). The composition comprised CaCl2⋅2H2O (0.75 mM), K2SO4 (0.92 mM), Fe-EDTA (0.04 mM), urea (5 mM), MgSO4 (1 mM), and micronutrients [H3BO3 (2.4 μM), ZnSO4 (0.6 μM), MnSO4 (0.9 μM), CuSO4 (0.62 μM), and Na2MoO4 (0.6 μM)] (Sivasakthi et al., 2017). Nutrient solution was renewed at 2 days interval, and pH was maintained around 6.0 using 1 M HCL or 1 M KOH.
Phenotypic Evaluation for Phosphorous Use Efficiency Trait in Mungbean
Twenty-one-day-old seedlings grown under optimum- and low-P conditions were carefully separated into leaf, stem, and root to record observations on PUE traits. Isolated complete root system of each plant was placed on a tray with no overlapping of roots for recording observations on root traits. Root traits recorded include total root volume (TRV), total root length (TRL), root average diameter (RAD), total root surface area (TSA), total root tips (TRT), and root forks (RF). These were measured using a root scanner (EPSON XL 1000) with WinRhizo software (Pro version 2016a; Regent Instrument Inc., Quebec, QC, Canada). Primary root length (PRL) was determined manually using meter scale. Chlorophyll concentration (CHL) was measured by using MC-100 chlorophyll concentration meter (Apogee Instruments, Inc., United States). Total leaf area (TLA) was measured using leaf area meter (LI-COR 3000, Lincoln, NE, United States). Separated shoots and roots were dried at 60°C until constant mass of root dry weight (RDW) and shoot dry weight (SDW) was obtained and then root-to-shoot ration (RSR) was calculated. All the traits have been measured in three replications. The PRL and TRL have been measured in centimeters per plant. TSA, TRV, and RAD have been measured in square centimeters per plant, cubic centimeters per plant, and centimeters, respectively. CHL and LA have been measured in micromoles per square meter and square meters per plant, respectively. RDW and SDW have been measured in grams per plant (Table 1). Descriptive statistics, Pearson correlation coefficients, and analysis of variance were performed using the Statistical Tool for Agricultural Research (STAR) 2.1.0 software (Gulles et al., 2014). The broad sense heritability is defined by the formula Vg/Vg + Ve, where Vg and Ve are the genotype and environmental variances, respectively.
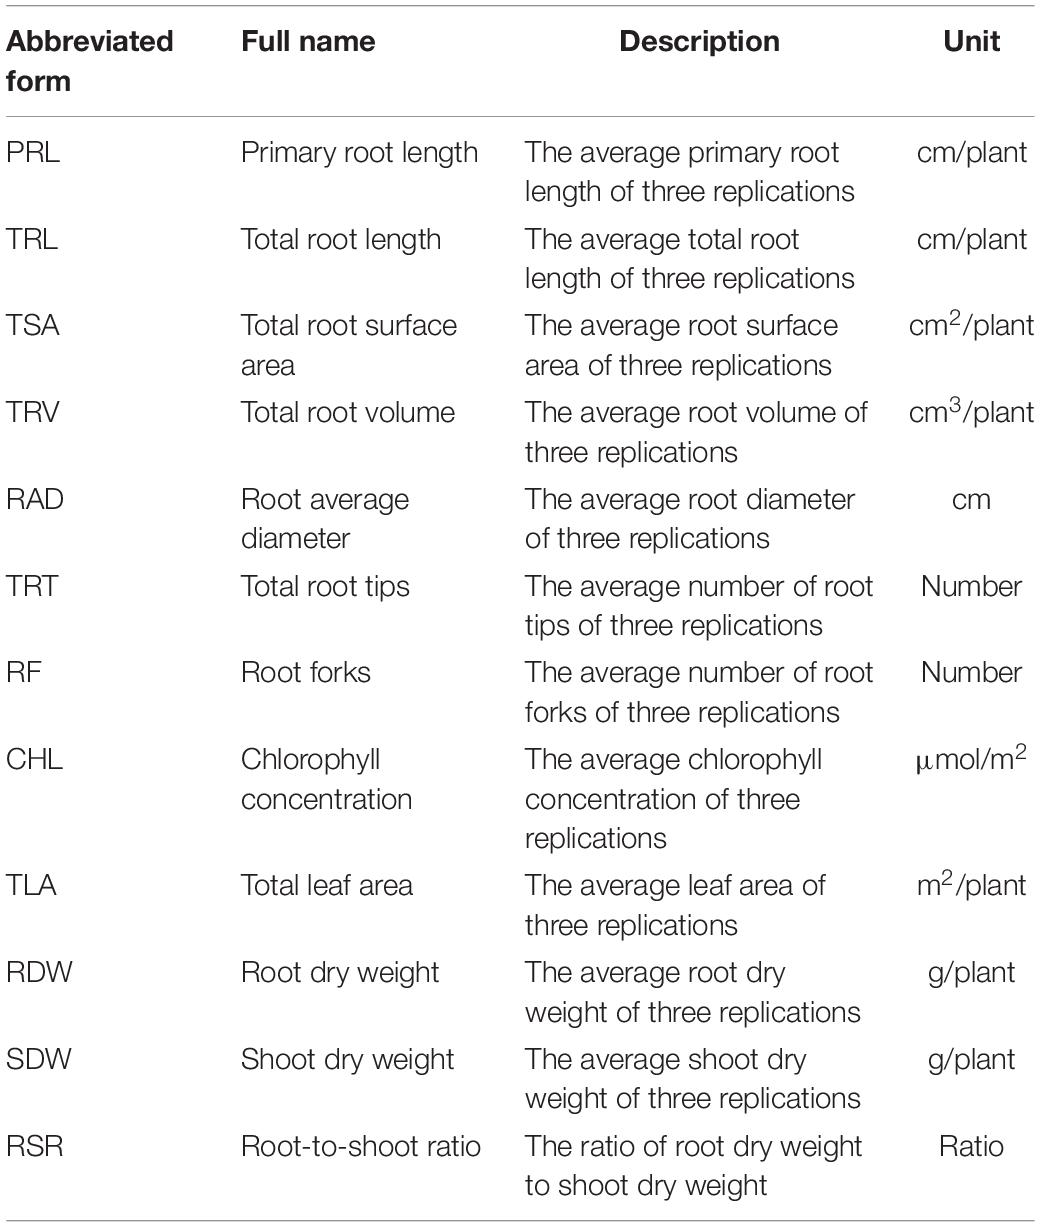
Table 1. Description of the tested traits in the study.
Discovery, Genotyping, Structural, and Functional Annotation of GBS-Based SNPs
The genomic DNA was isolated from the AM panel genotypes. The isolated genotypes were used to constitute two 144-plex GBS library and sequenced (2 × 150-bp single end) using Illumina HiSeq 4000 NGS platform according to Liu et al. (2012) and Bastien et al. (2014). Three accessions were taken as biological replicates. The demultiplexing and mapping of FASTQ reads onto the reference mungbean genome (Kang et al., 2014) had been carried out. The high-quality SNPs were detected using Bowtie v2.1.0 (Langmead and Salzberg, 2012) and reference-based GBS pipeline/genotyping approach of STACKS v1.01 according to Kujur et al. (2015). The unmapped sequence reads were analyzed through de novo-based GBS approach of STACKS. Subsequently, the putative SNPs were discovered among genotypes following Kujur et al. (2015). In order to validate SNPs identified through GBS assay, the SNPs present in three candidate genes have been selected. The candidate gene-based SNPs have been validated through Sanger sequencing. Therefore, the primers were designed from 300-bp sequences which were flanking either side of selected SNPs. Next, the PCR amplification carried out using the genomic DNA of 25 mungbean accessions. The 25 mungbean accessions have been selected on the basis of response of root to available phosphorous in soil (Reddy et al., 2020). The purification and sequencing of PCR products were carried out. The alignment of sequences is performed to detect SNPs among accessions according to Kujur et al. (2013).
The reference genome GBS-based SNPs identified in genic and intergenic component of genomes were annotated according to mungbean genome annotation (Kang et al., 2014).
Construction of Phylogenetic Tree, Determination of Population Structure, and LD Patterns
The genotyping data among mungbean genotypes were analyzed with PowerMarker v3.51 (Liu and Muse, 2005) and MEGA v6.0 (Tamura et al., 2013). An unrooted neighbor-joining (NJ)-based phylogenetic tree (with 1000 bootstrap replicates) had been constructed. The population genetic structure among genotypes was determined by a model-based program STRUCTURE v2.3.4 according to Kujur et al. (2015). The genotyping data of chromosome-based SNPs was analyzed by PLINK and the full-matrix approach of TASSELv5.0 (Saxena et al., 2014). The LD patterns (r2) and LD decay (by plotting average r2 against 50 kb uniform physical intervals across chromosomes) had been determined. The LD had been measured as frequency correlation among pair of alleles across a pair of SNP loci.
Marker Trait Association Analysis
The genome-wide SNP genotyping information of mungbean AM panel was integrated with PUE trait phenotyping data, ancestry coefficient (Q matrix), and relative kinship matrix (K) data using general linear model (GLM) (Q model) and mixed linear model (MLM) approach. The quantile–quantile plot had been generated to determine relative distribution of observed and expected log10(p) value for each associated SNP. The adjusted p value threshold of significance was corrected for multiple comparisons according to false-discovery rate (FDR cut-off ≤ 0.05) (Benjamini and Hochberg, 1995). The SNP loci having significant association with PUE trait at highest R2 (degree of associated SNP) and lowest FDR adjusted p values (threshold p < 1 × 10⁻⁵) were identified by integrating all the model-based outputs of TASSELv5.0.
Digital Gene Expression Analysis for the Identified Candidate Gene
The digital gene expression analysis has been performed for the candidate genes which have been identified in our study. We have taken the Arabidopsis ortholog of candidate gene from mungbean genome for analysis. The gene expression pattern has been searched using Expression Angler, an online search tools (Austin et al., 2016). The experiment had been carried out using different developmental stages like root, shoot, xylem etc.
Results
Phenotypic Variation for 12 PUE Traits
Twelve PUE traits were investigated in 144 genotypes of the AM panel under two levels of P conditions. Analysis of variance revealed highly significant variation among 144 genotypes for all tested traits under two P regimes (Supplementary Table S2). We recorded highly significant phenotypic difference between two P regimes (p < 0.01) for all traits except PRL, TRV, and TSA, while RDW showed general significance (p < 0.05) (Table 2). The mean values of TRL, TSA, TRT, RF, TLA, and SDW were significantly higher under optimum-P condition compared with low-P condition. Whereas, mean values of RAD, CHL, RDW, and RSR were significantly higher in low-P compared with optimum-P condition. The coefficient of variation varied from 3.59 to 15.47% and from 3.32 to 24.31% under optimum- and low-P conditions, respectively. This study showed a maximum heritability (0.92) for TLA under optimum-P condition. At low-P condition, the heritability of CHL in leaf was found to be highest (0.92). The variation in all tested traits under optimum-P condition was significantly correlated with the corresponding traits in low-P condition with Pearson correlation coefficients ranging from 0.39 to 0.76. The trait ratios between low-P and optimum-P conditions ranged from 0.58 (TLA) to 1.78 (RSR) with six values being lower than 1.00 (Table 3). The coefficient of variation for trait ratios ranged from 4.72 to 28.22%.
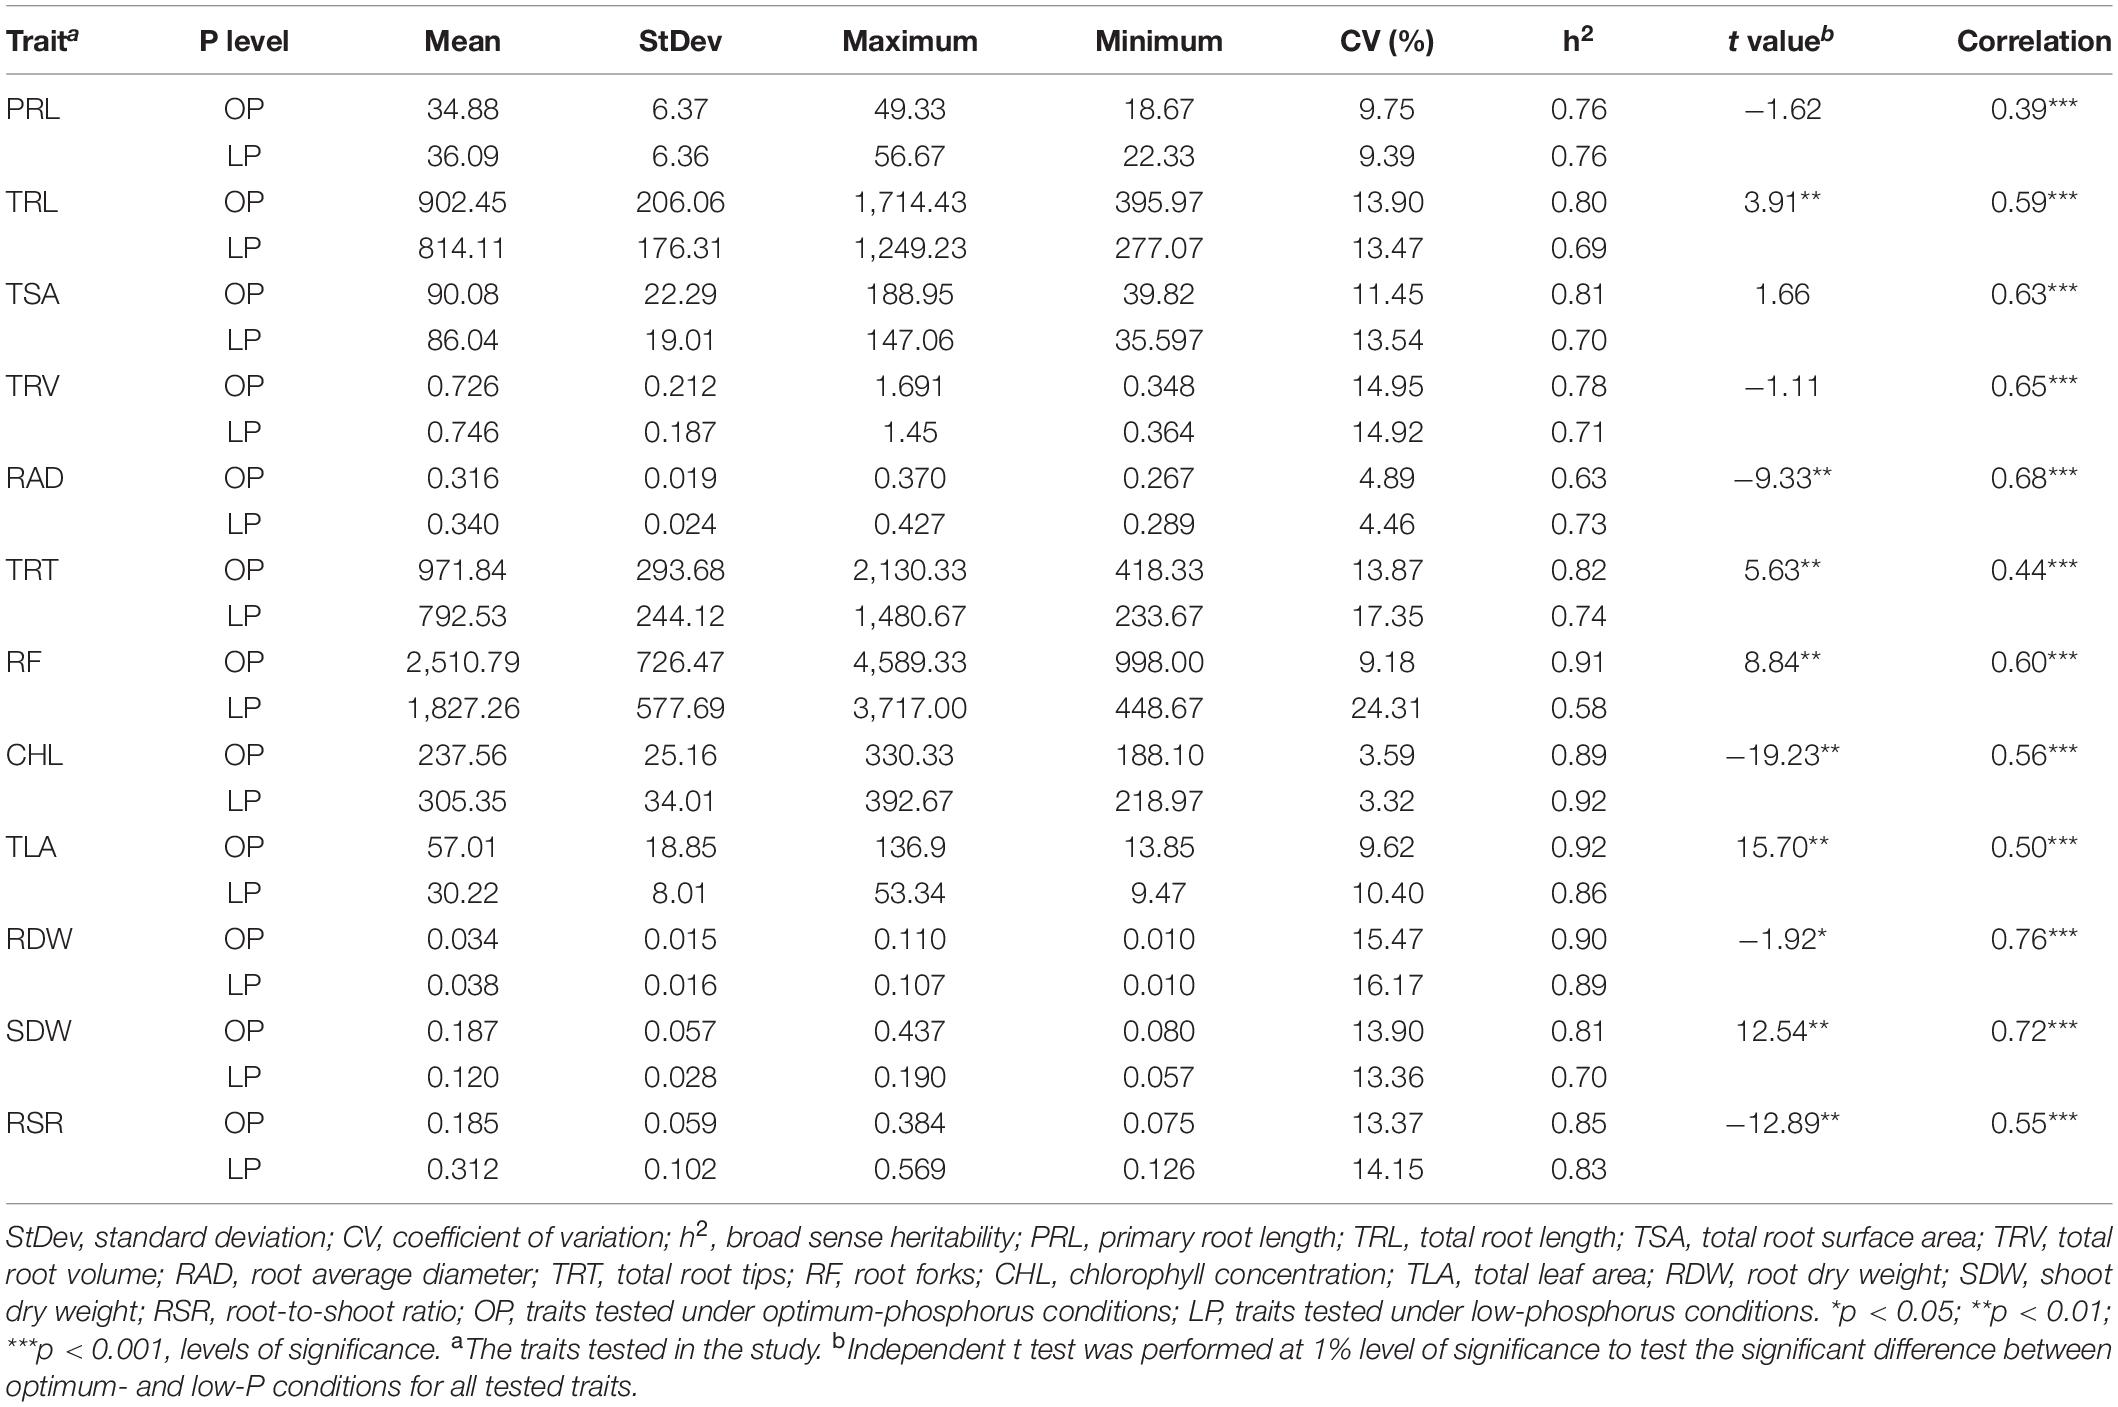
Table 2. Descriptive statistical results of phosphorus use efficiency traits of mungbean under different P conditions.
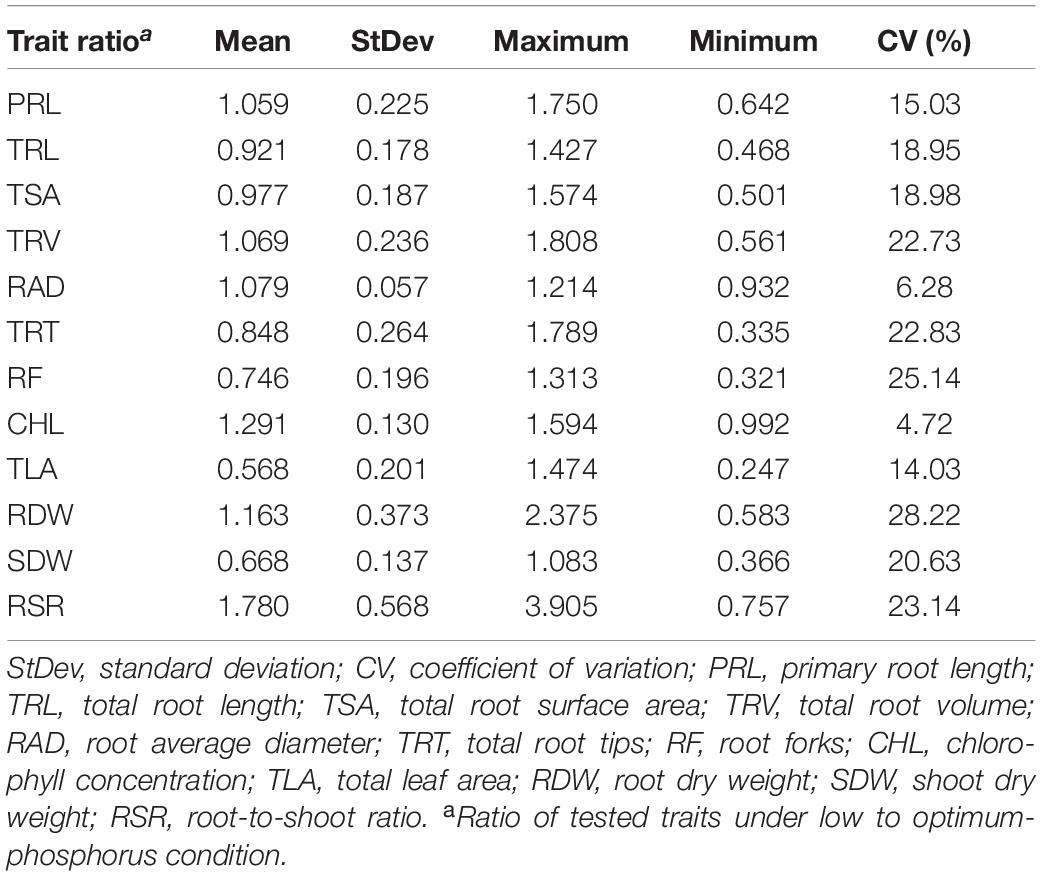
Table 3. Descriptive statistics of trait ratios in 144 diverse mungbean genotypes.
Large-Scale Discovery, High-Throughput Genotyping and Annotation of Genome-Wide GBS- and Candidate Gene-Derived SNPs
A total of 264.40 million high-quality sequence reads had been generated. The reads are evenly distributed (mean, 1.83 million reads) across 144 genotypes of AM panel. Notably, on an average, 75% of these reads were mapped on V. radiata reference genome. In total, 76,160 high-quality SNPs (with read-depth 10, <5% missing data, and 8% minor allelic frequency) differentiating 144 samples were discovered using mungbean reference genome-based GBS assay. The genome-wide GBS-based SNP genotyping overall identified 55,634 chromosome-based SNPs showing polymorphism among mungbean genotypes of AM panel. The distribution of all SNPs was found to be in different components of genome including intergenic (27%), intragenic (23%), regulatory (31%), and scaffold (19%) variants (Figure 1A). A total of 20,526 SNPs identified in unanchored scaffold region (Table 4). A maximum of 8,805 SNPs (15.8%) were mapped on chromosome 1, whereas, a minimum of 2,264 SNPs (4.01%) were mapped on chromosome 3. The SNP density was found to be low on chromosome 10 (1.27 SNPs per 100 bp). The structural annotation of 55,634 SNPs identified a number of 25,663 (46.12%) and 29,923 (53.78%) SNPs in the 11,068 protein coding genes (intragenic region) and intergenic regions of mungbean genome, respectively. The abundance of gene-based SNPs was found in the regulatory region (33,724 SNPs, 60.1%), followed by CDS (13,030 SNPs, 23.4%) and least (10,423 SNPs, 18.73%) in the intron region (Figure 1B). In total, 5,643 (43.4% of coding SNP) and 7,387 (56.6% of coding SNP) missense and synonymous SNPs have been found. The relative distribution of GBS-based SNPs mapped on 11 mungbean chromosomes showing polymorphism among AM panel genotypes are presented in a Circos circular ideogram (Figure 1C). The functional annotation of 55,634 SNP-carrying genes revealed that their correspondence lies to 2,481 growth, 7,741 development, 4,936 metabolism-related proteins followed by 764 signal transduction protein. We performed Sanger sequencing-based validation of SNPs present in three candidate genes. Two SNPs present in two candidate genes have been mined through Sanger sequencing (Supplementary Table S4). The structurally and functionally annotated genome-wide SNPs physically mapped on mungbean genome can be used for genotyping applications for quantitative trait dissection of mungbean.
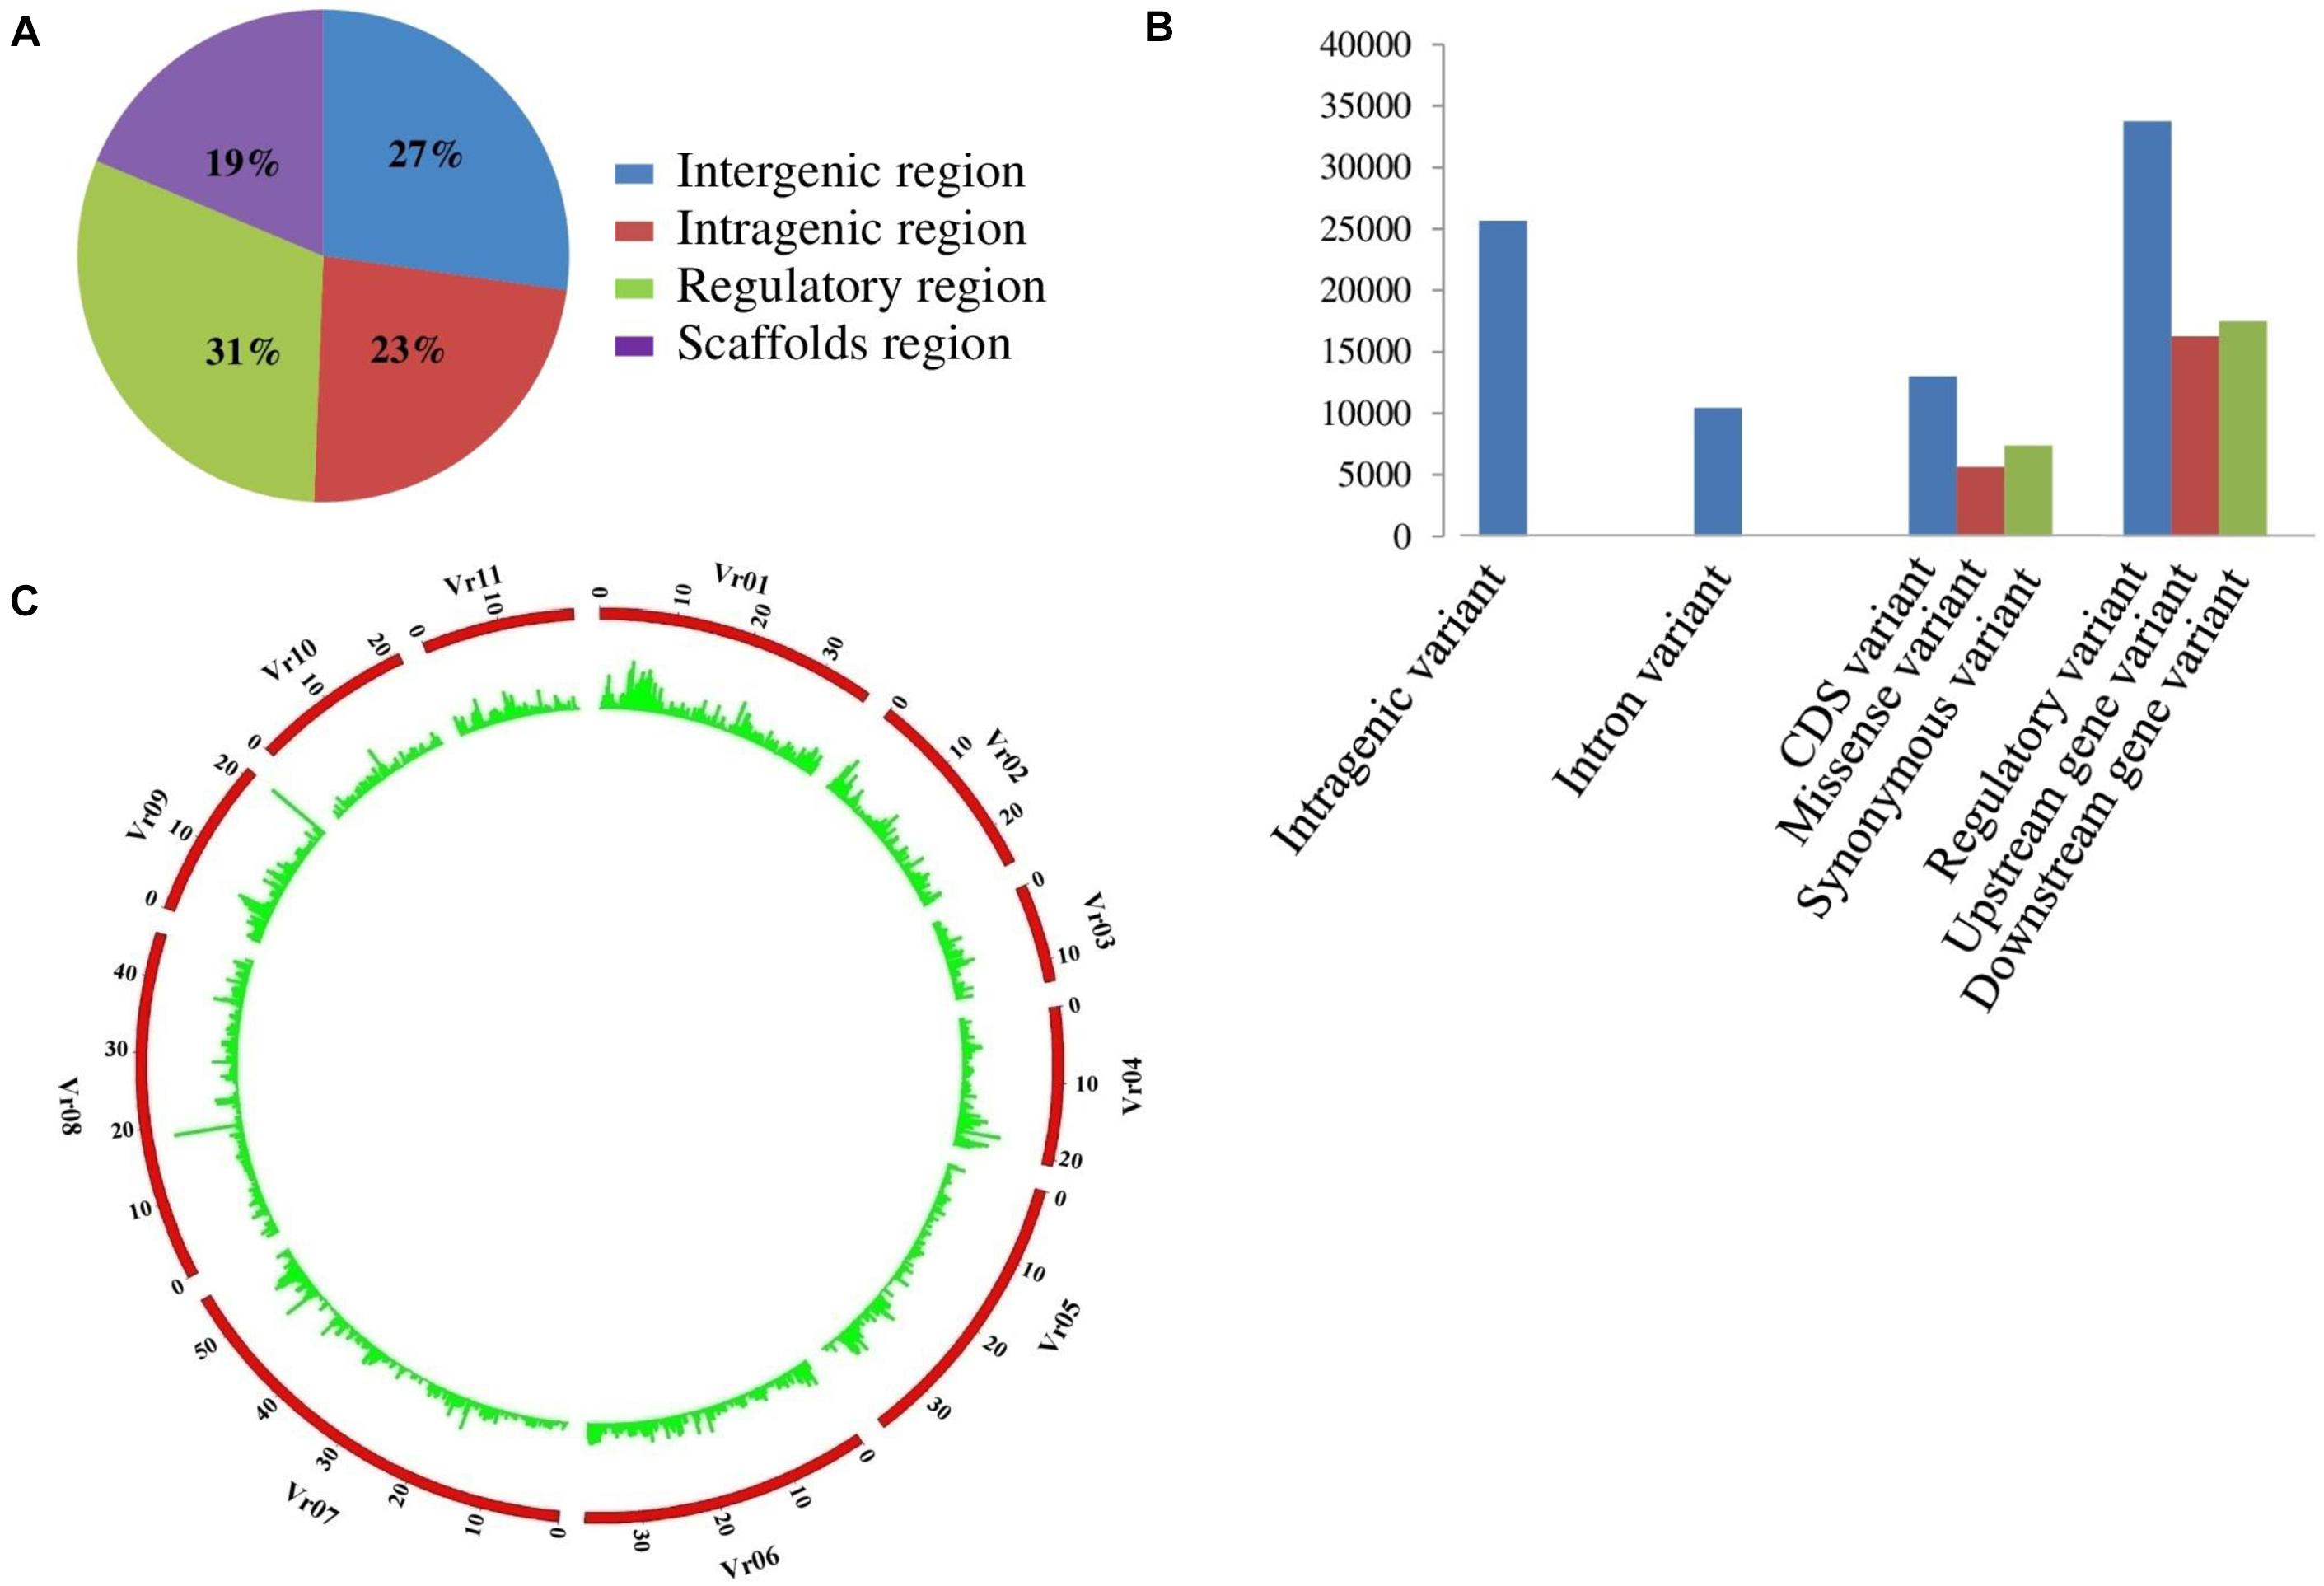
Figure 1. (A) Distribution of SNPs in different genomic regions. (B) Distribution of large effect SNPs in different genie regions. (C) A Circos circular ideogram depicting the genome wide distribution. The outermost circle represents the eleven mungbean chromosomes, while the inner circle represents the relative distribution of SNPs mined from 144 diverse genotypes in mungbean.
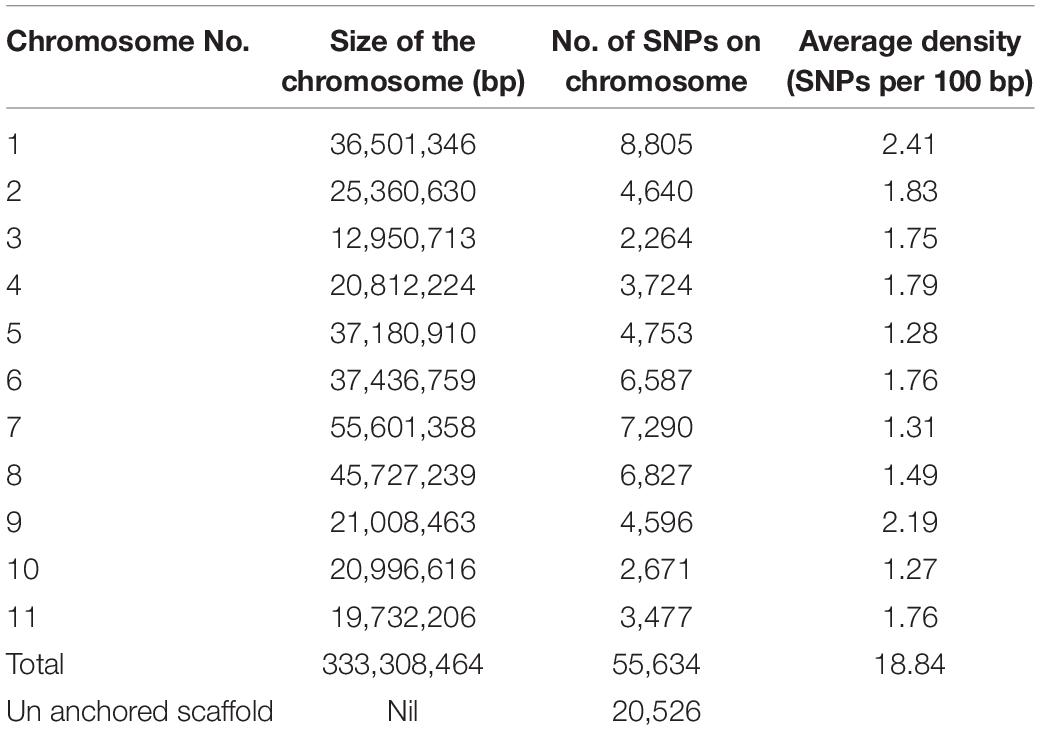
Table 4. SNP distribution on chromosomes and un anchored scaffold.
Molecular Diversity, Linkage Disequilibrium, and Population Structure
The identified 55,634 genome-wide GBS-based SNPs revealed polymorphism among AM panel mungbean genotypes with higher nucleotide diversity (θπ, 0.35547; θω, 0.18039; and Tajima’s D, 3.21848) potential. Any significant difference for nucleotide diversity value have not been found within the different set of genotype group such as, advanced varieties, landrace, etc. However, we have compared the diversity (θπ) value among the related species, like soybean and chickpea. It has been found that the diversity in soybean was θπ: 0.33 which was comparable to mungbean (θπ, 0.35). In chickpea, θπ was found to be 0.99, which is higher as compared with mungbean. The unrooted neighbor-joining phylogenetic tree construction using 55,634 genome-wide SNPs depicted a distinct differentiation among the AM panel of mungbean (Figure 2). These genotypes were clustered into three major groups.
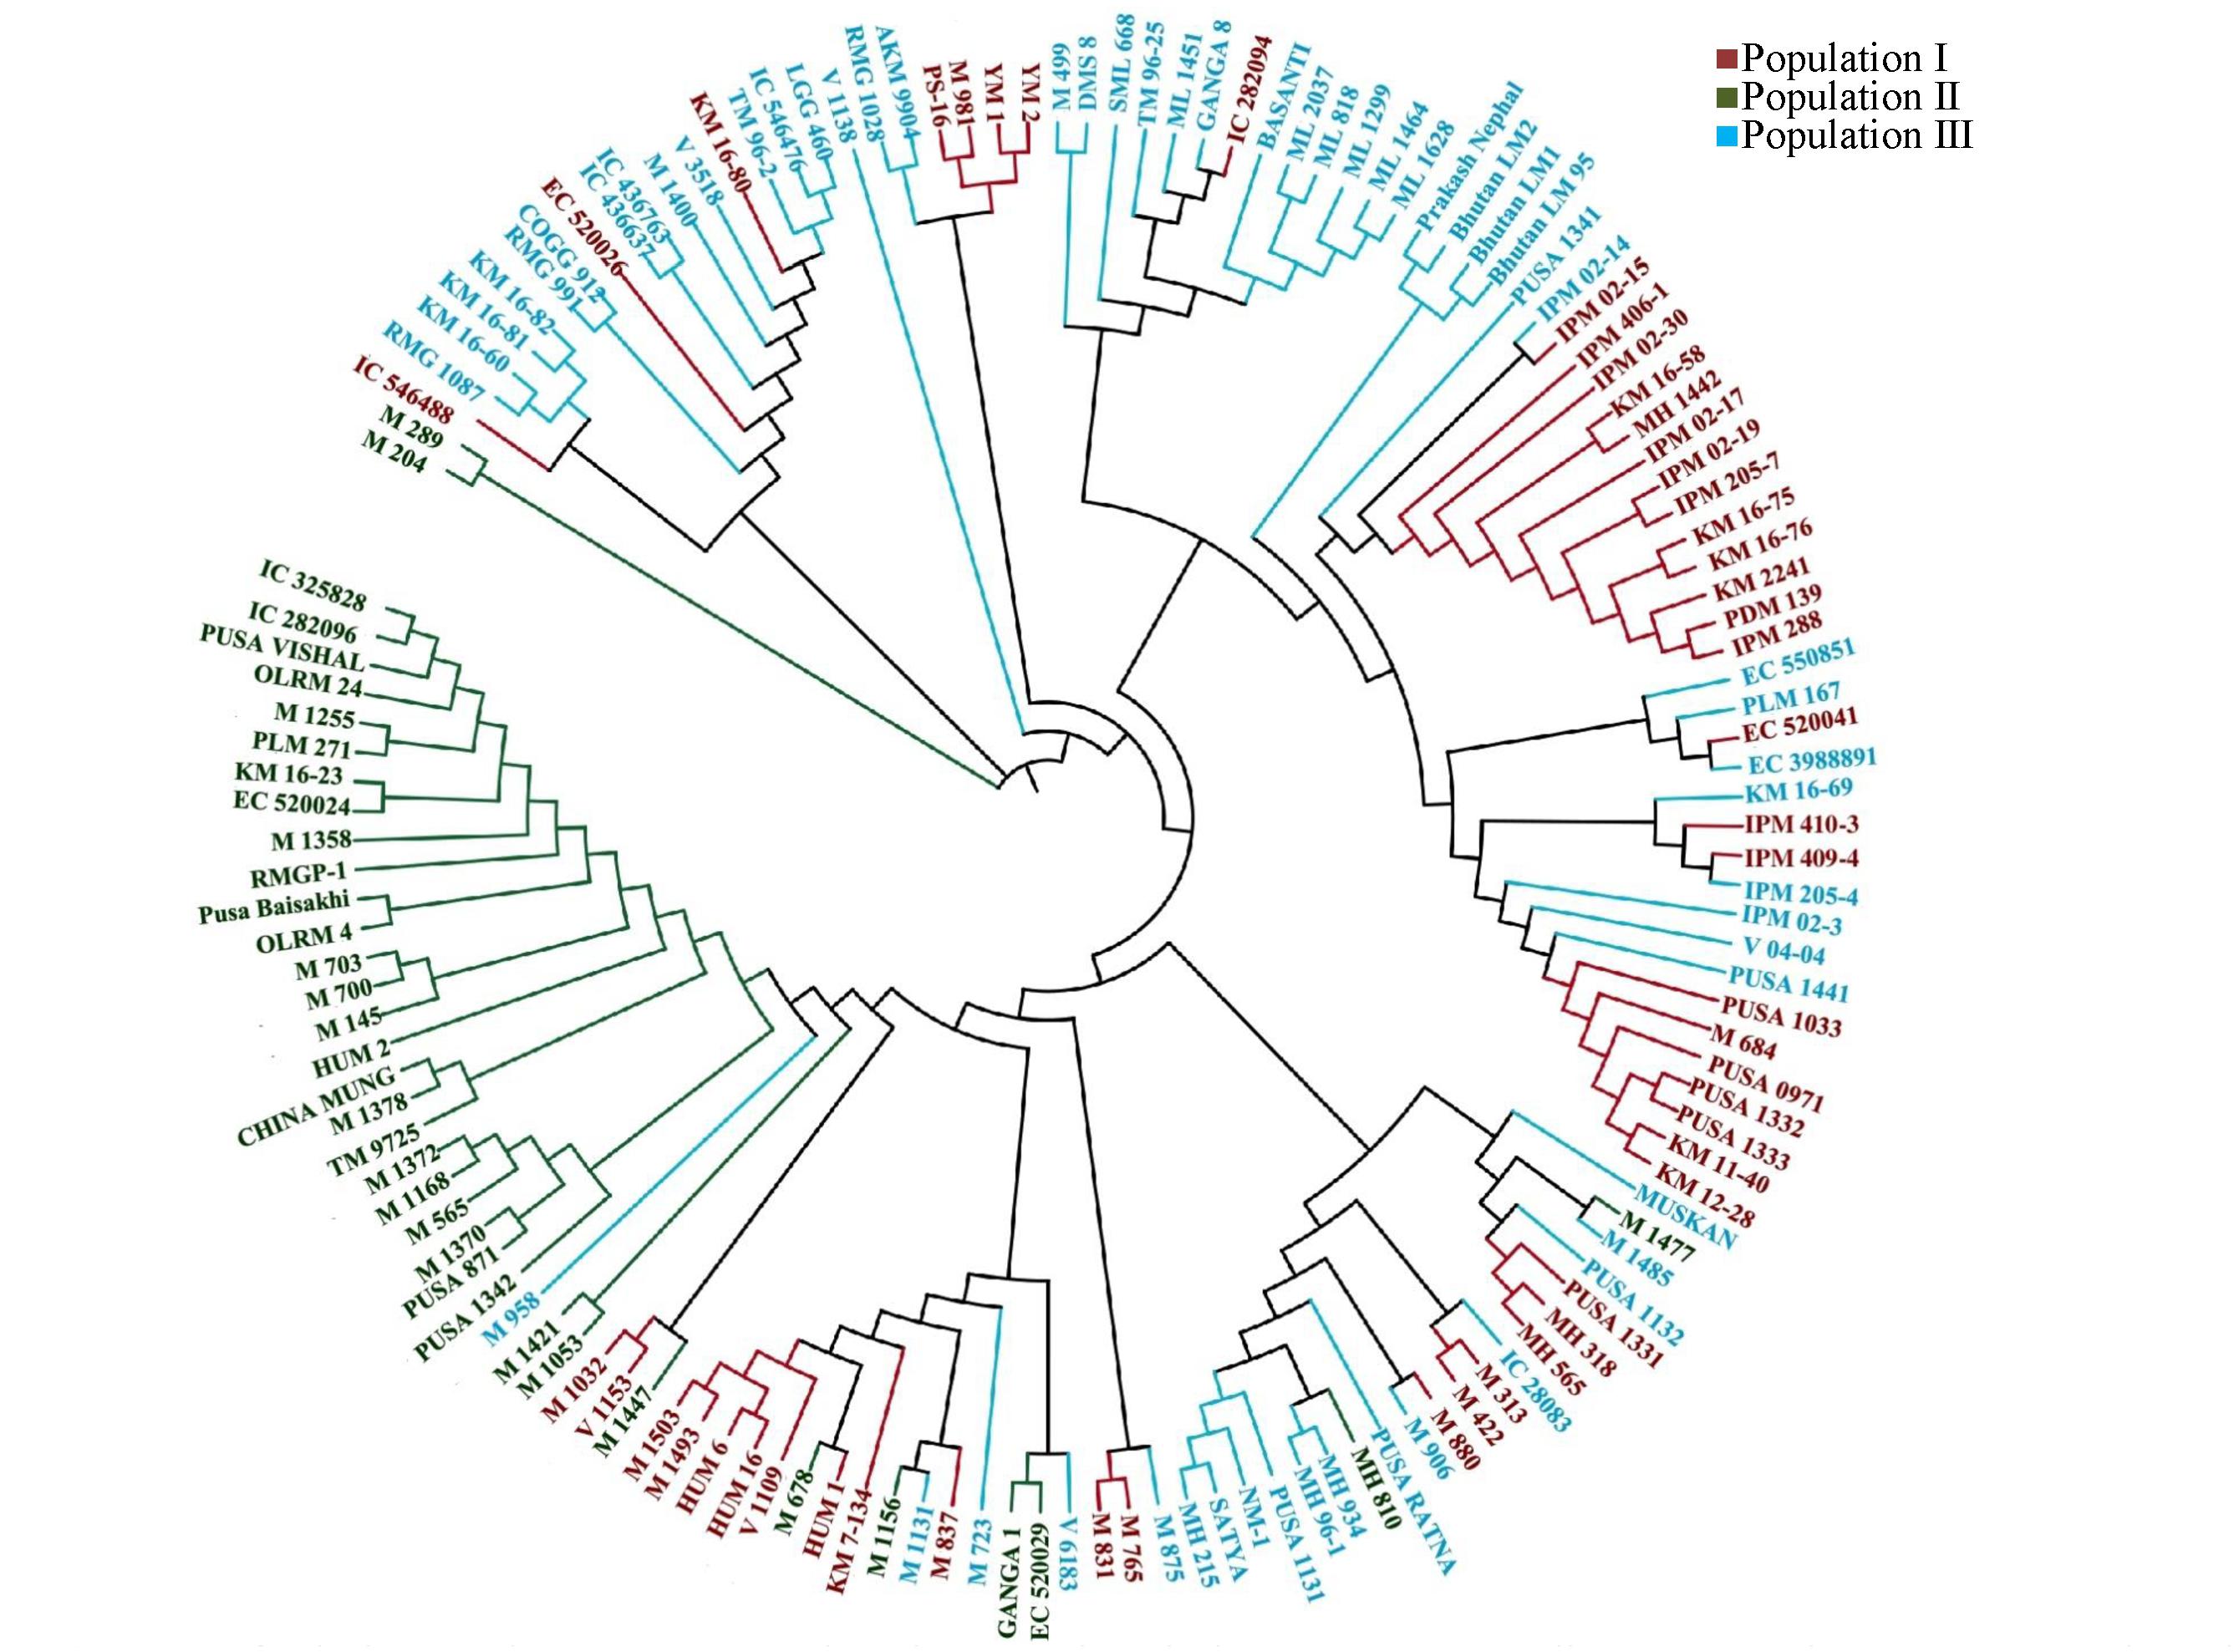
Figure 2. Phylogenetic tree representing the genetic relations among 144 diverse mungbean genotypes based on Nei’s genetic distance using 55,634 high quality GBS based SNPs. Molecular classification differentiated these genotypes into three populations (I, II, and III) based on their origination.
The LD estimates (r2) and extent of LD decay were determined using 55,634 SNPs mapped on 11 mungbean chromosomes. We determined the LD decay of 55,634 SNP pairs by pooling the r2 estimates across 11 chromosomes of mungbean and plotting their average r2 against the 50-kb equal intervals of physical distance (maximum up to 1,000 kb). The determination of LD patterns in a population of AM panel genotypes using 55,634 SNPs (physically mapped across eleven mungbean chromosomes) showed a higher LD estimate (r2, 0.62) and less-extensive LD decay (r2 decreased half of its maximum value) at 50–100 kb physical distance in mungbean chromosomes (Supplementary Figure S3A). A slight increasing and then consistent pattern of LD decay (r2 ≥ 0.3) was observed with increase in the physical distance (cM) of SNP markers mapped on the 11 chromosomes. The population genetic structure among AM panel genotypes was determined using SNPs (mapped on 11 mungbean chromosomes) employing STRUCTUREv2.3.4 software. The admixture model-based STRUCTURE simulations were performed at different levels of possible population numbers (K = 1 to 10) with 20 replications. The population numbers (K) were determined using the second-order statistics of STRUCTUREv2.3.4 by delta K estimation. The results showed a maximum value of delta K at 3 (Supplementary Figure S3B), which confirms the classification of 144 mungbean genotypes into three genetically distinct population groups (POP I–III) with high-resolution population structure (Supplementary Figure S3C). The population I predominantly consists of ABL (23) followed by exotic (17) and released cultivars (9). In population II, exotic (25) genotypes were found to be abundant as compared with ABL (4) and released cultivars (7). In population III, the numbers of released cultivars (24) were found to be higher as compared with exotic (20) and ABL (15). Populations I, II, and III consist of 34, 25, and 41% of total accessions, respectively. In population I, ABL is dominant (47%), population II is dominated by exotic (69%), and population III is found to be dominated by released cultivars (41%). The grouping of all AM panel genotypes into three groups was further confirmed by principal component analysis (PCA) along with phylogenetic tree and population structure analysis (Supplementary Figure S4).
GWAS for Phosphorous Use Efficiency Traits in Mungbean
For GWAS, the genotyping data of 55,634 GBS-SNPs developed from genotypes of AM panel were integrated with phenotyping data, high-resolution population genetic structure, and PCA data. The Bonferroni-corrected threshold (–log(p) = 4.0) was used as a cutoff to identify the significant marker trait associations. A total of 1,171 and 139 significant SNPs were identified by GLM and MLM, respectively. Of these, 136 SNPs were identified by both models (Table 5 and Supplementary Table S3).
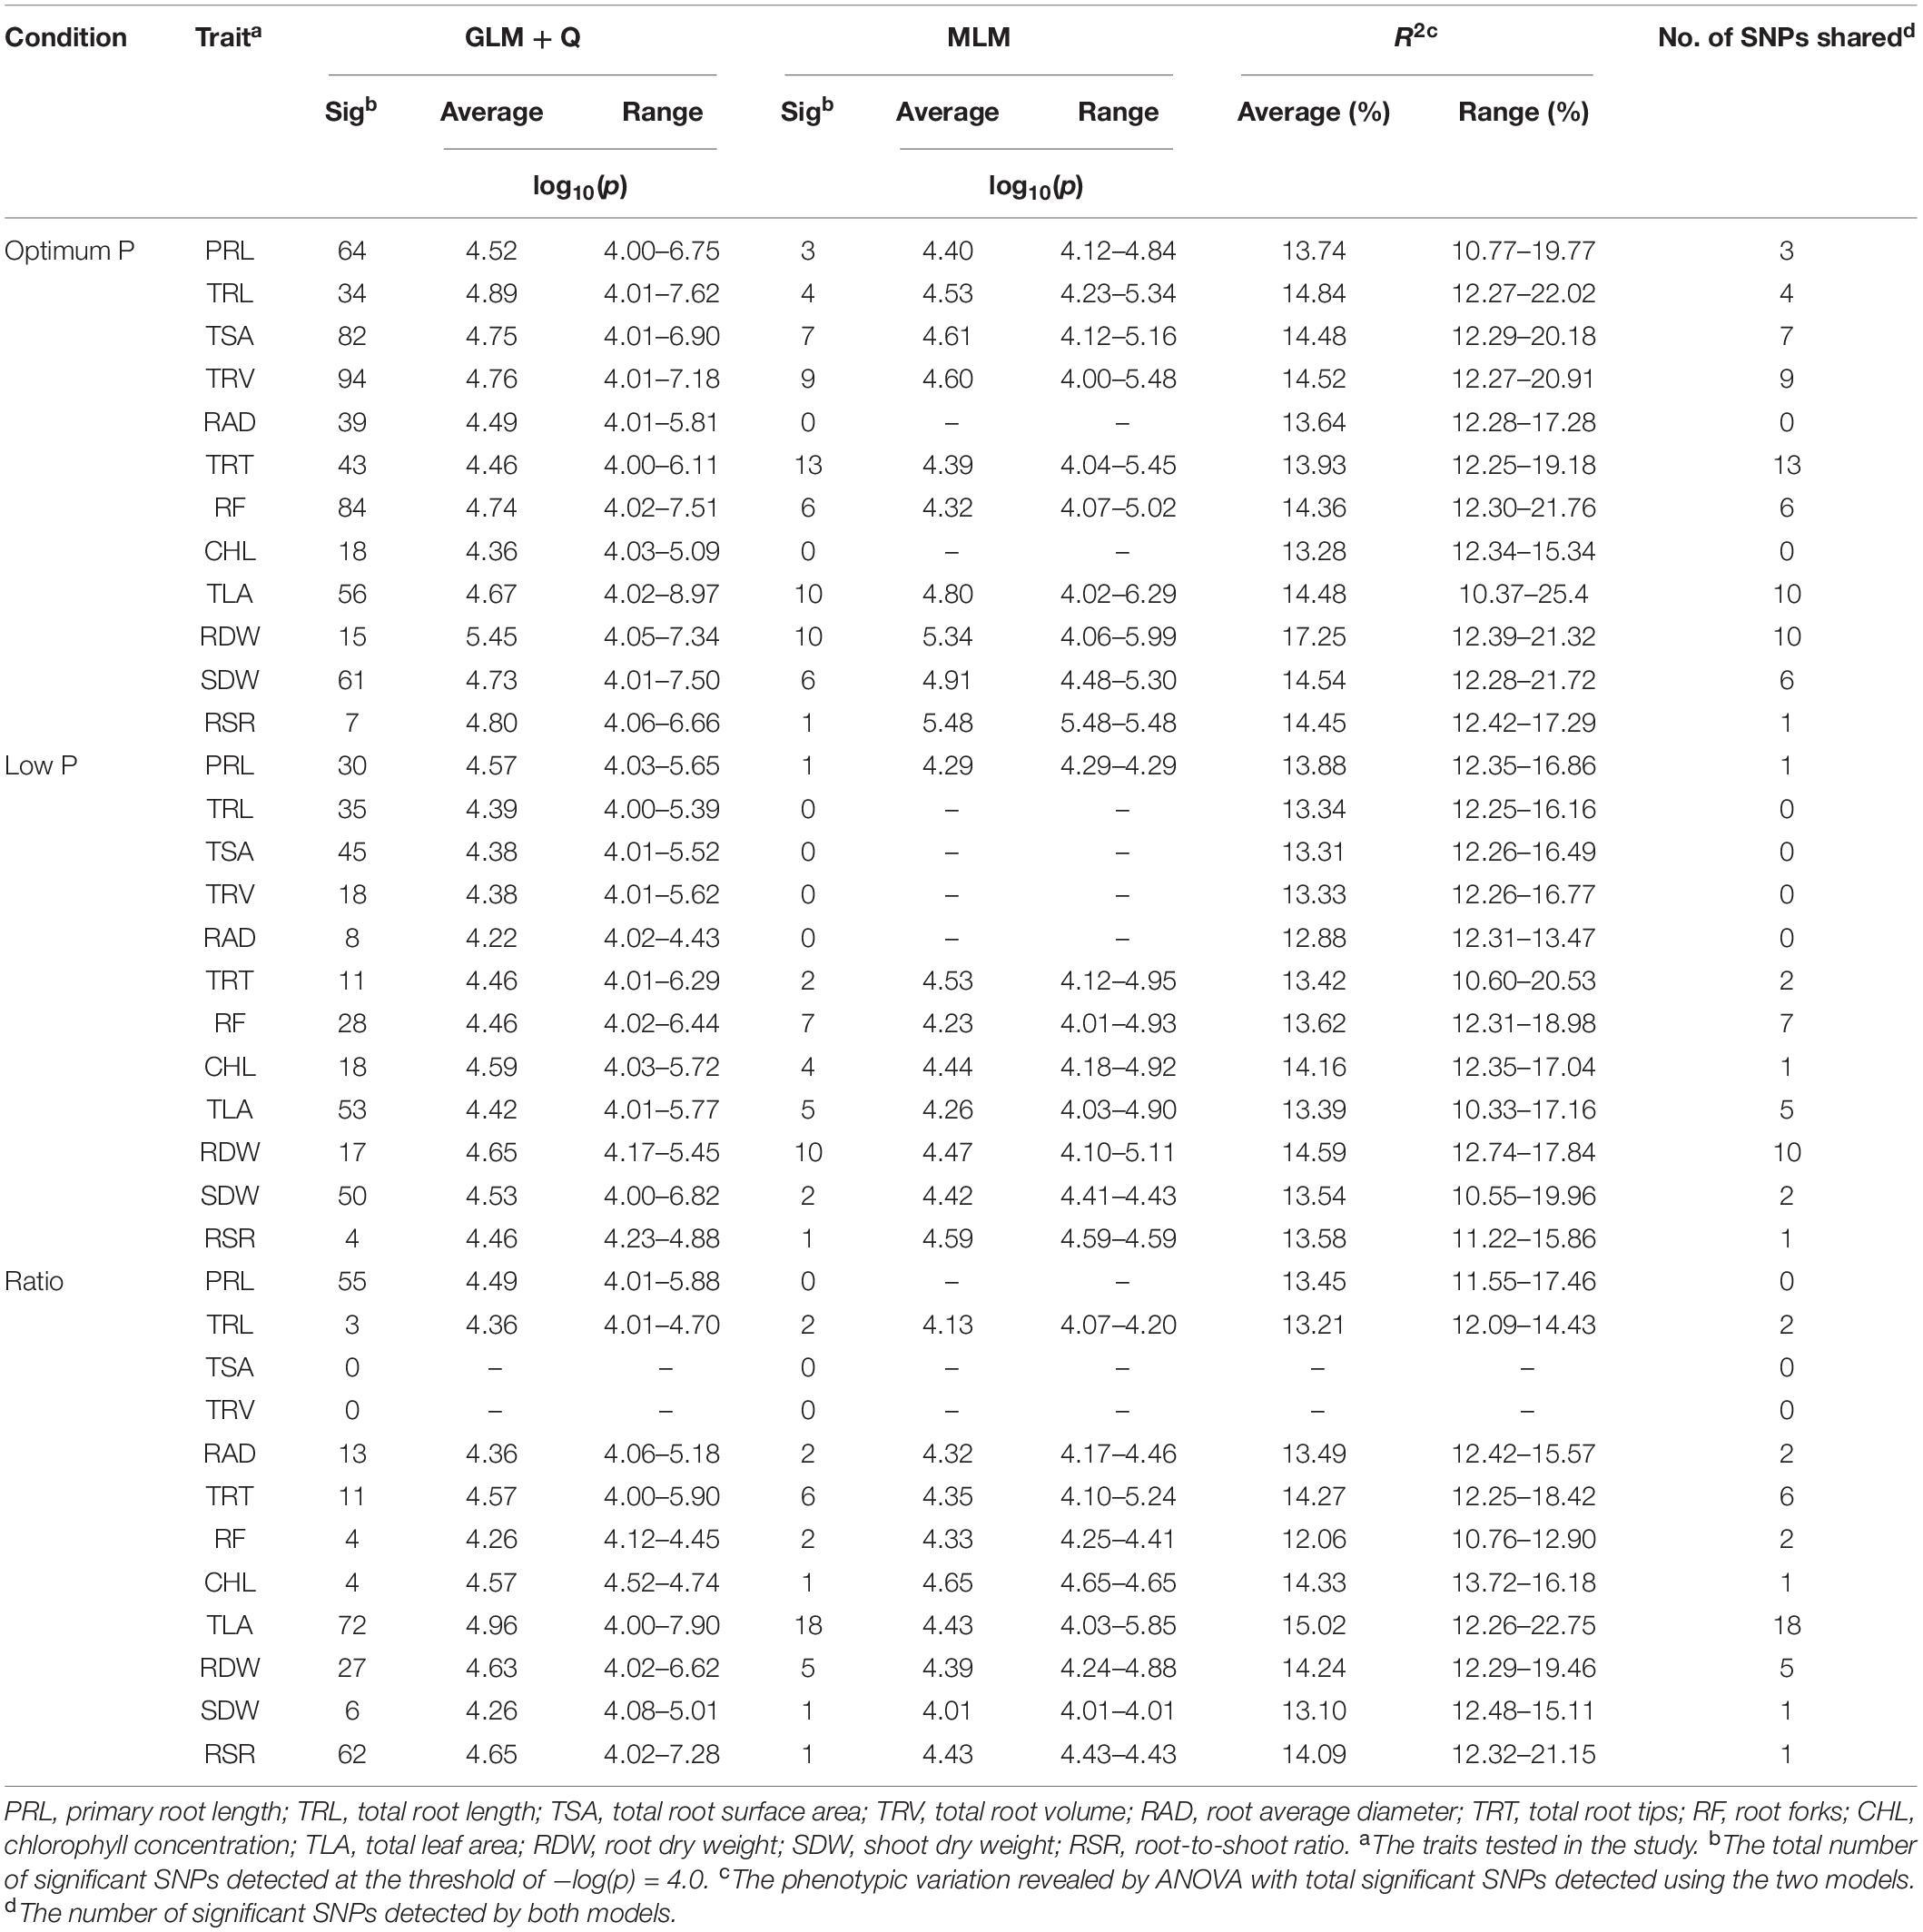
Table 5. Genome-wide association study for 12 phosphorus use efficiency traits studied using two models: the general linear model with Q structure (GLM + Q) and the mixed linear model with Q structure and kinship (MLM).
Under optimum-P condition (OP), a total of 597 SNPs identified by GLM were found to be associated with all tested traits in the study. The GLM detected 39 and 18 significant SNPs for RAD and CHL, respectively; for which no significant SNP was detected by MLM. The MLM-detected maximum number of SNP loci (13) was found to be associated with TRT with 13.93% contribution of phenotypic variation. The MLM detected 3, 4, 7, 9, 6, 10, 10, 6, and 1 significant SNPs for PRL, TRL, TSA, TRV, RF, TLA, RDW, SDW, and RSR, respectively (Figure 3 and Supplementary Figure S1). The phenotypic variation (R2) explained by the SNPs ranged from 13.28 to 17.25%.
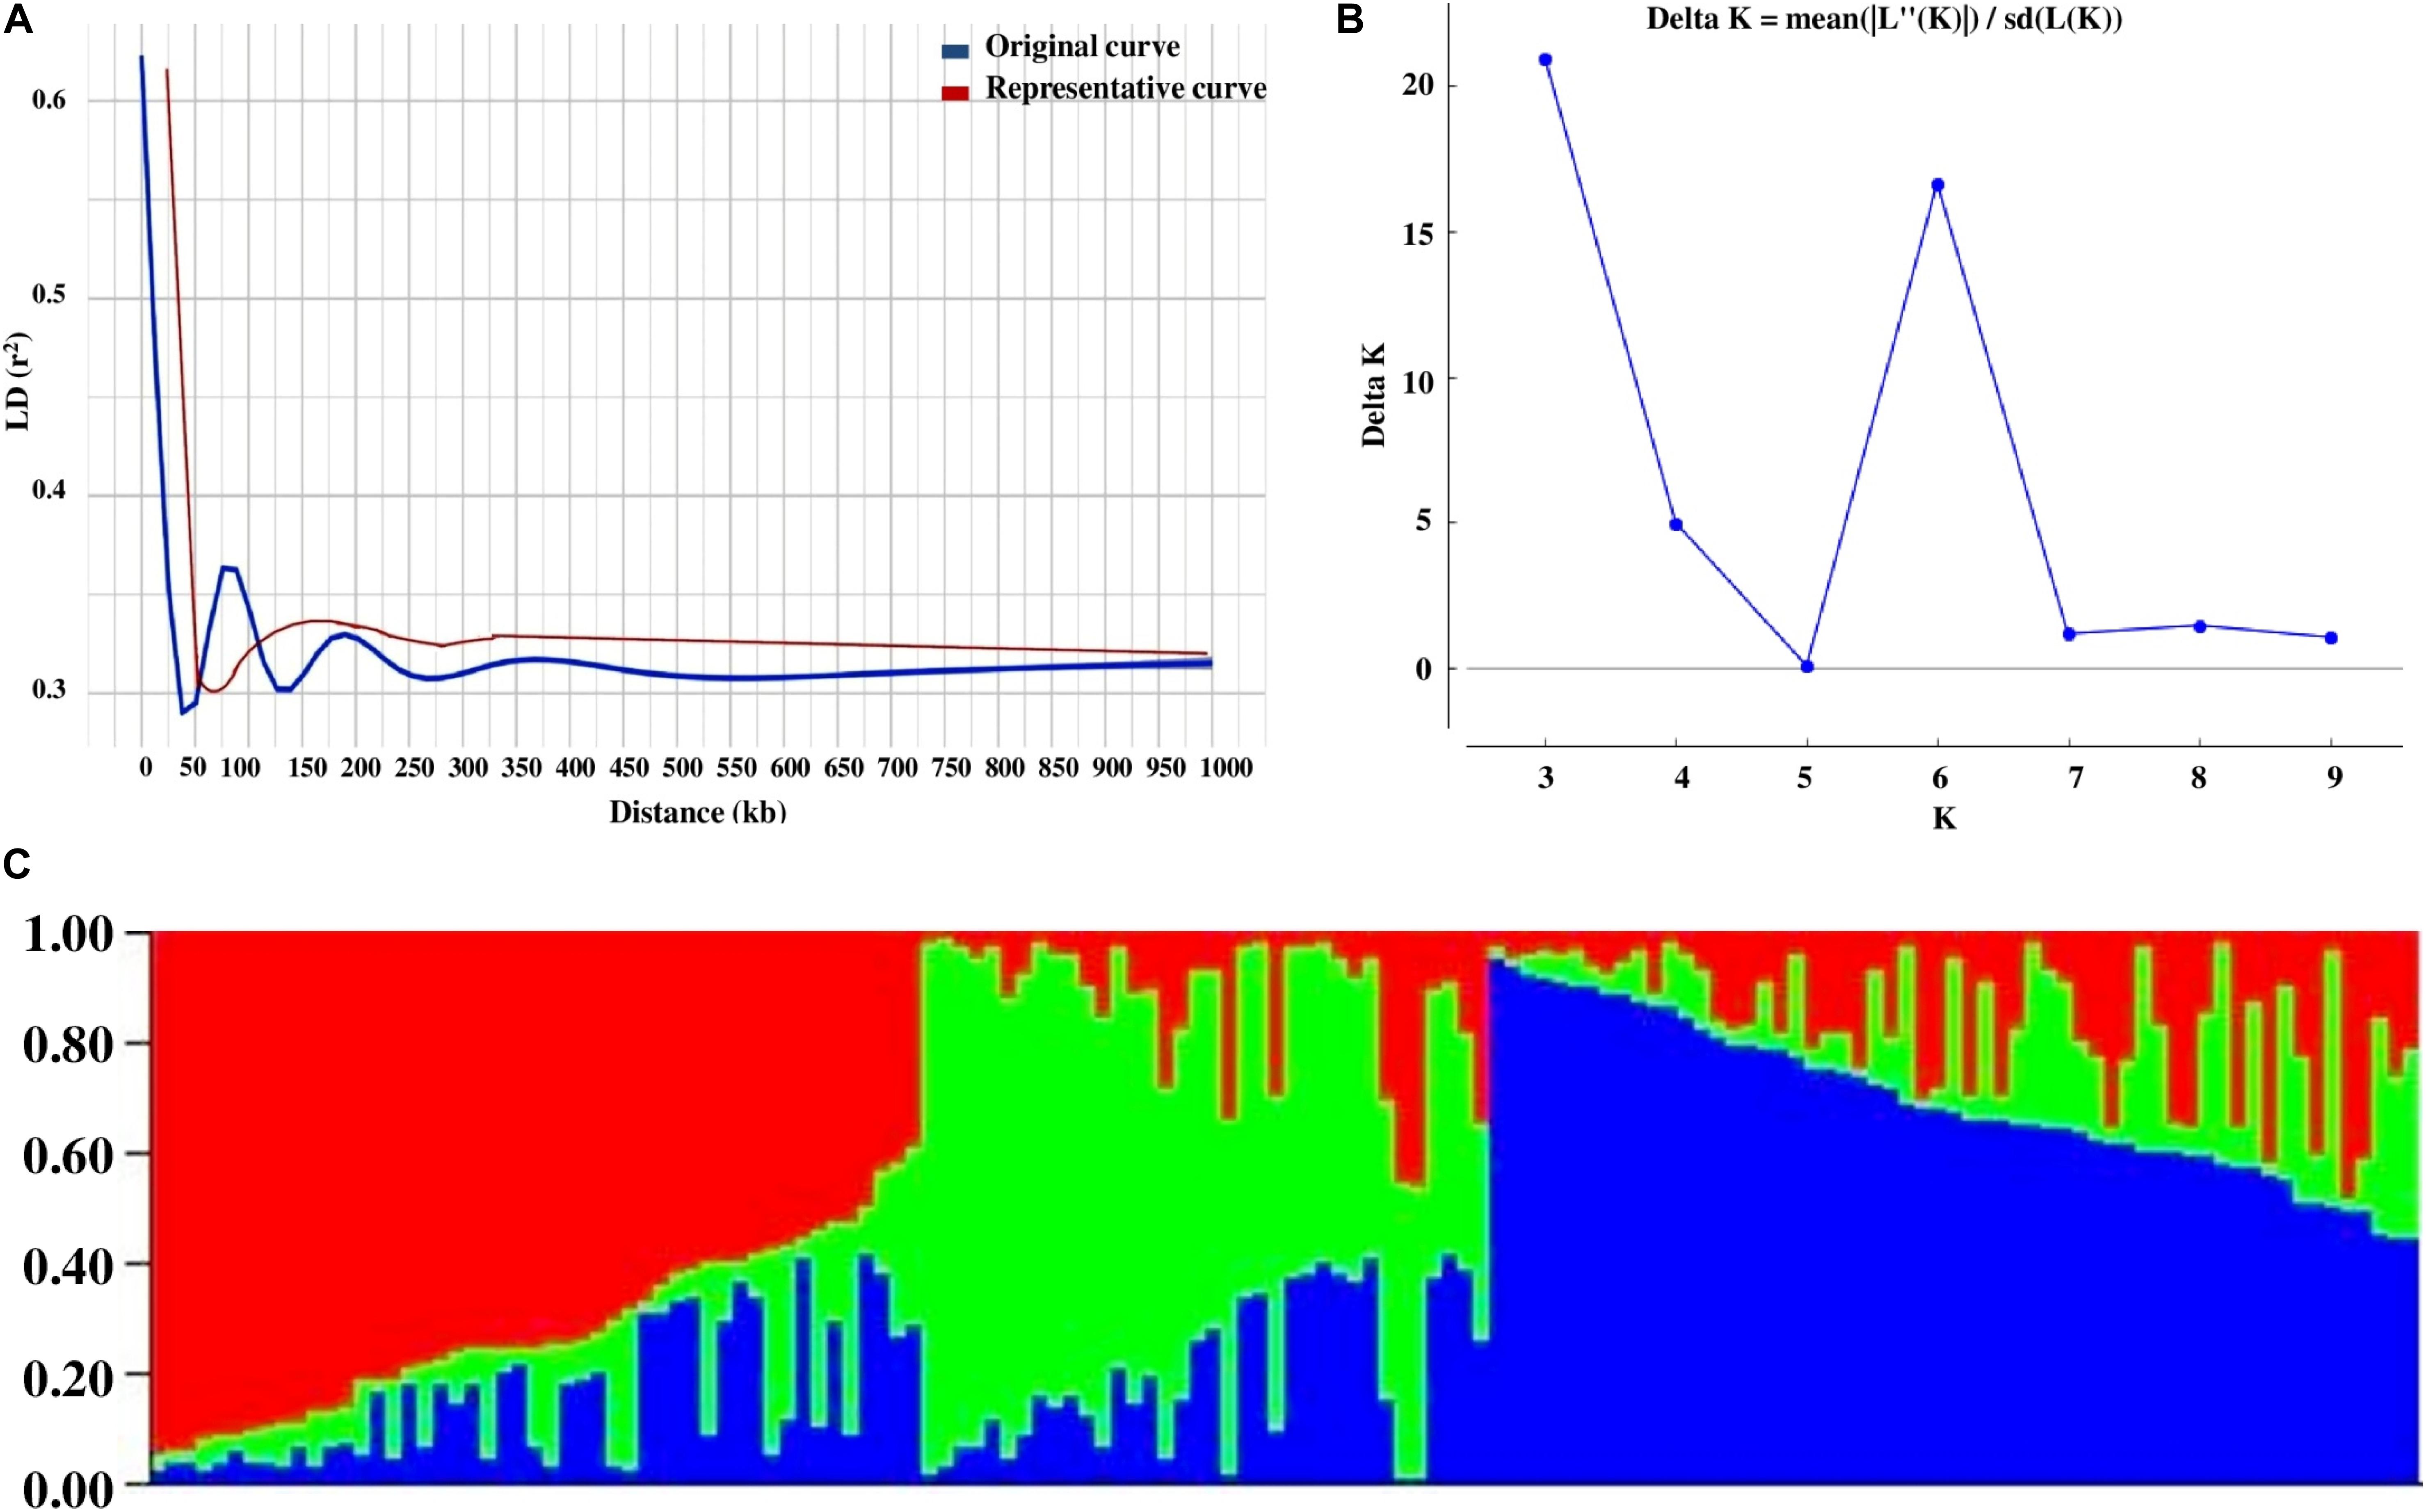
Figure 3. (A) Four LD decay measured in association panel of 144 diverse mungbean genotypes. (B) Delta K plot showing best peak at K = 3. (C) Population genetic structure plot of mungbean association mapping panel (optimal population number K = 3 with three different colors.
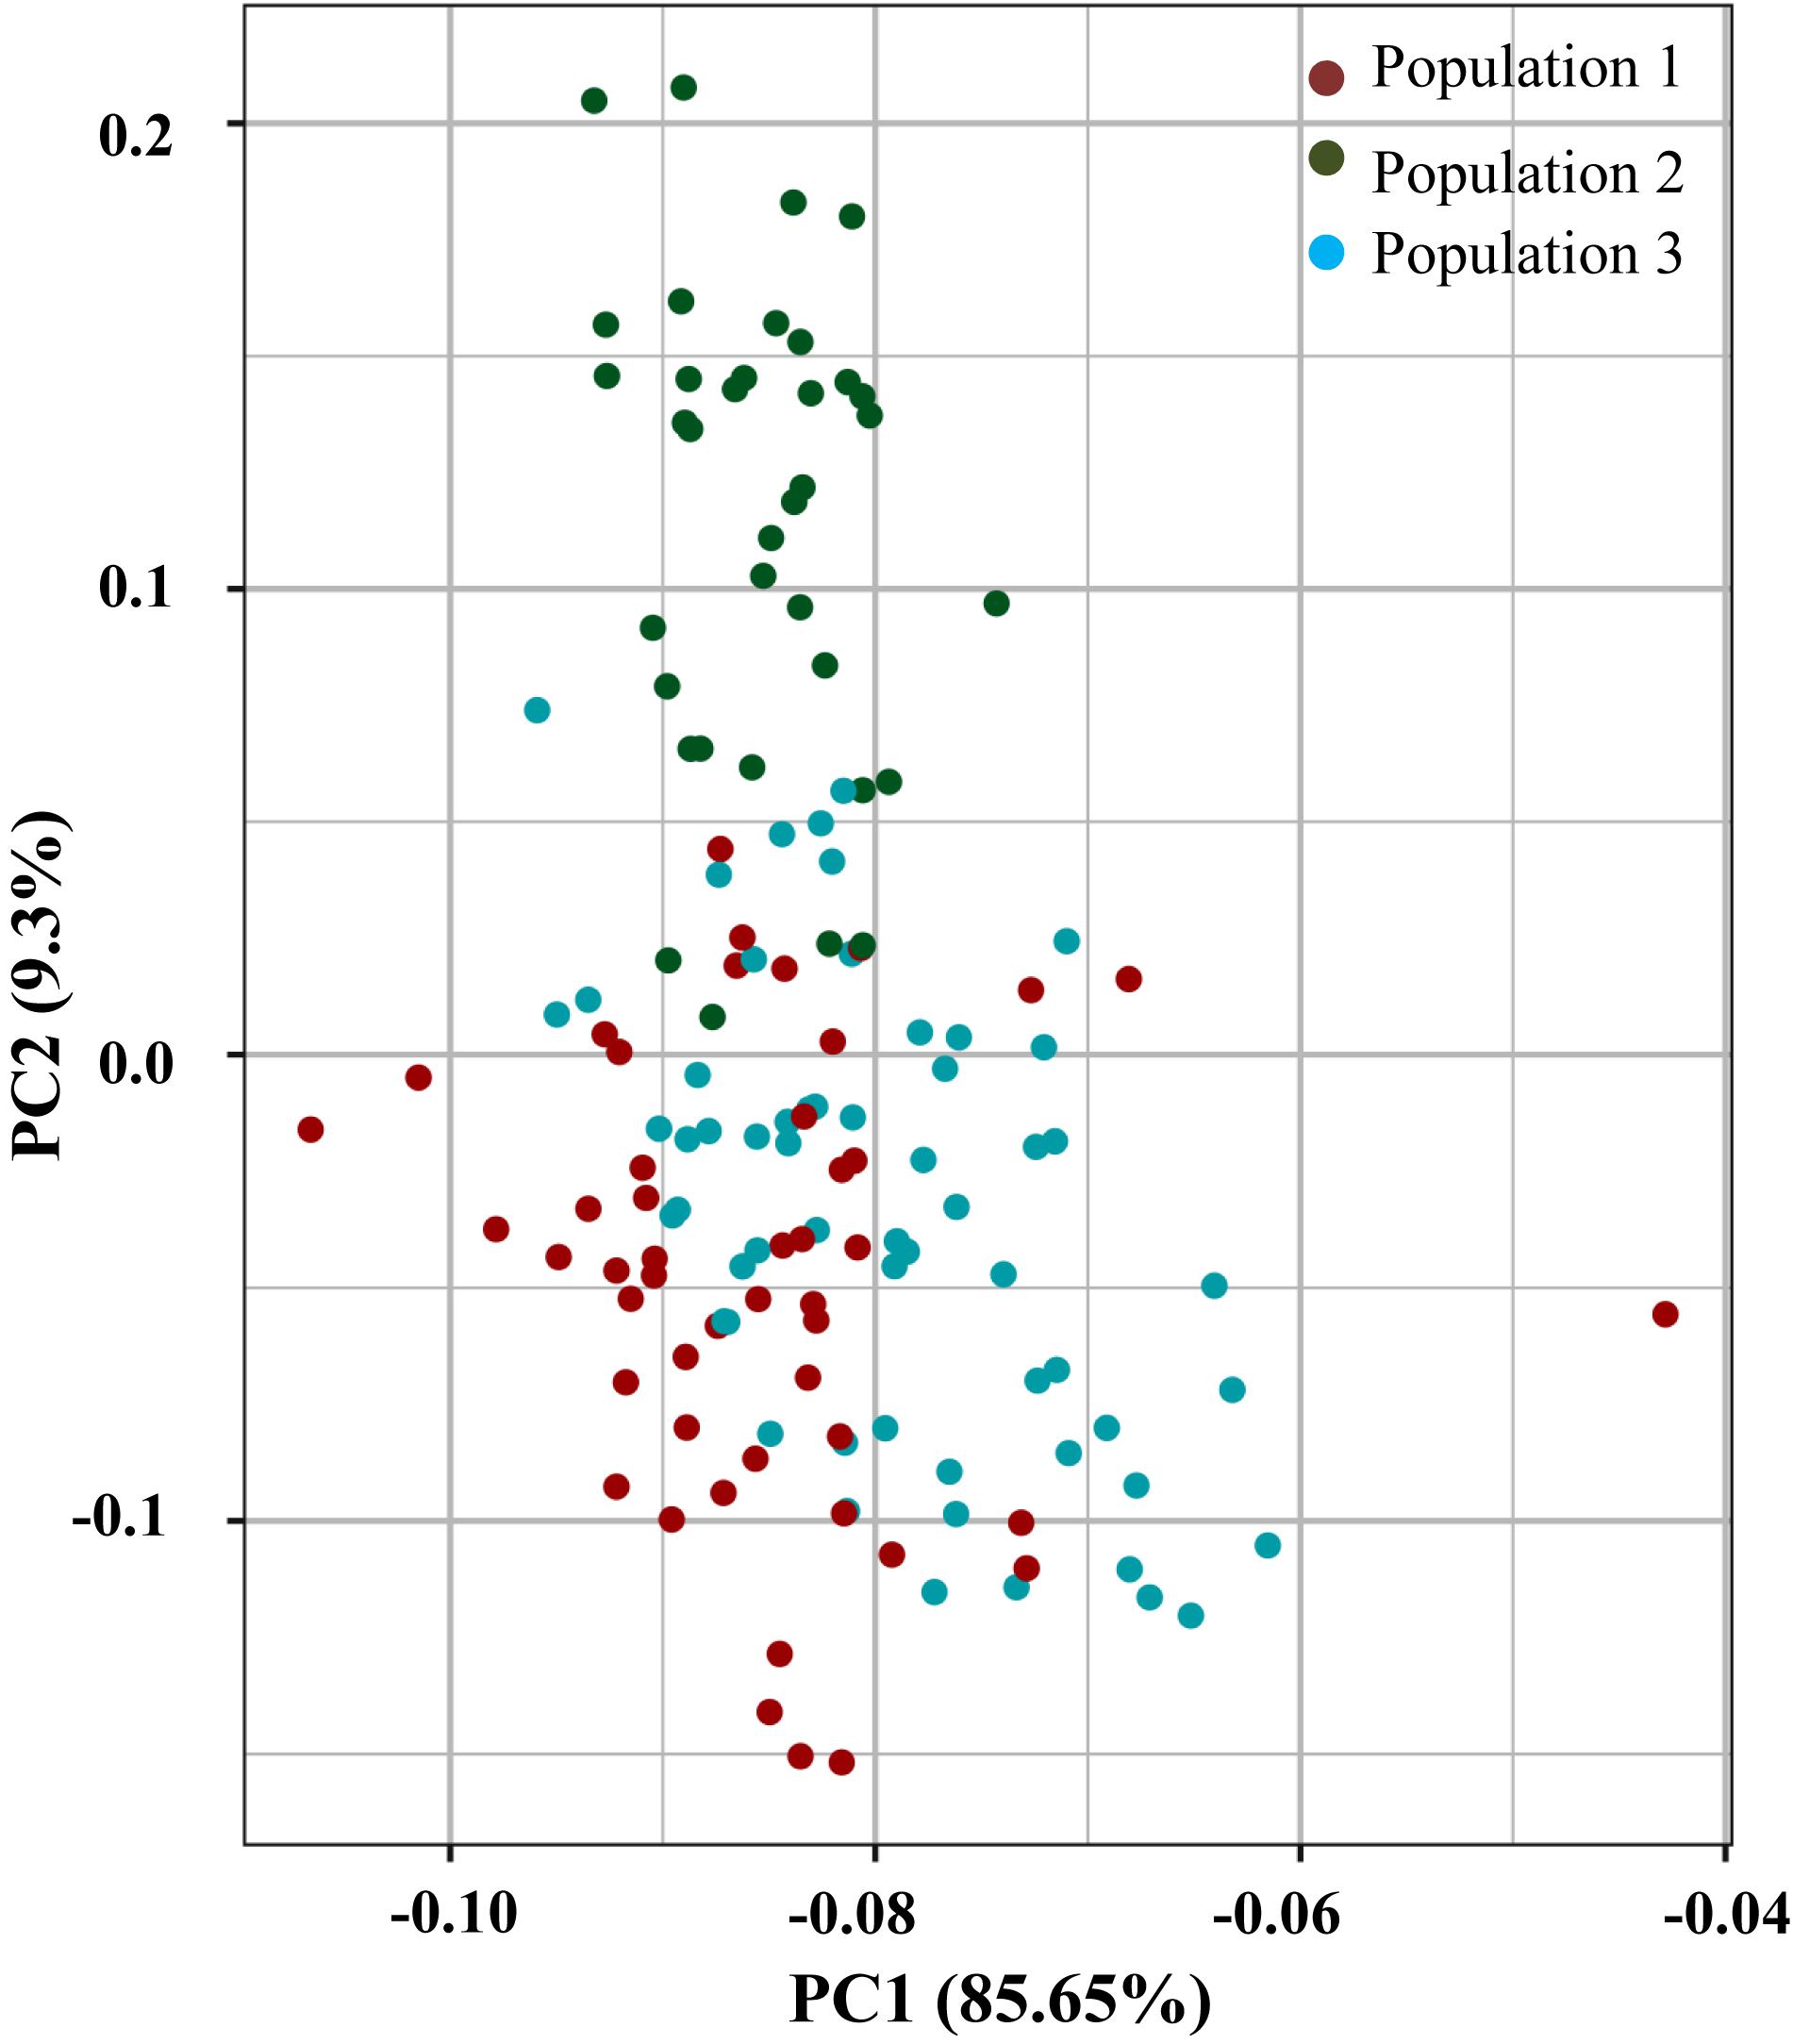
Figure 4. Principal component analysis using 55634 high quality GBS based SNPs assigned to 144 diverse mungbean genotypes into three populations (1, 2, and 3).
Under low-P (LP) condition, a total of 317 significant SNPs associated with tested traits were detected by GLM. GLM detected 35, 45, 18, and 8 SNPs for TRL, TSA, TRV, and RAD, respectively, for which no significant SNP was detected by MLM. MLM detected 1, 2, 7, 4, 5, 10, 2, and 1 significant SNPs for PRL, TRT, RF, CHL, TLA, RDW, SDW, and RSR, respectively. The phenotypic variation explained by SNPs ranged from 12.88 to 14.59%. At LP/OP condition (trait ratios), a total of 257 and 38 significant SNPs associated with tested traits were identified by GLM and MLM, respectively. MLM detected 2, 2, 6, 2, 1, 18, 5, 1, and 1 significant SNPs for TRL, RAD, TRT, RF, CHL, TLA, RDW, SDW, and RSR, respectively. No significant SNPs were identified by both models for trait ratios of TSA and TRV. The phenotypic variation explained by SNPs for trait ratios ranged from 12.06 to 15.02%.
At low-P and optimum-P conditions, MLM detected a maximum number of SNP loci (10) associated with RDW trait with around 14.59 and 17.25% of average phenotypic variation, respectively. Whereas, at LP/OP condition, a number of five SNP loci were found to be associated with RDW trait. At LP/OP conditions, MLM detected a maximum number of SNP loci (18) found to be associated with TLA trait and contributed around 15% of phenotypic variation. Whereas, at OP and LP conditions, a number of 10 and 5 SNP loci were found to be associated with TLA traits, respectively. The association results were further confirmed by analyzing quantile–quantile plot (Supplementary Figure S2). In total, 136 SNP loci were found to be present in a number of 71 protein coding genes. These genes were found to have diverse functions, including in stress, metal ion transport, metabolism, and development. Interestingly, most of the genes identified were found to be involved in nutrient transporting activity. These results suggest the utility of implicating GWAS in mungbean to decipher potential candidate genes for PUE traits in mungbean.
Delineation of Putative Candidate Genes for PUE Traits in Mungbean
In order to delineate the putative candidate genes regulating PUE trait in mungbean, we retrieved the CDS sequences of 71 associated protein coding genes and performed BLAST2 search against Arabidopsis genome database (with default parameter p value ≤ 1.0). The study identified a total of 13 genes with highest similarity and identity (≥80%) to the Arabidopsis genes. These genes were well characterized and found to be involved in different nutrient uptake and root architecture development pathway (Table 6). Therefore, we concluded that these genes may be putative candidate genes regulating PUE traits in mungbean. We reported a total of 1,171 and 139 significant SNPs associated with PUE traits by GLM and MLM models, respectively. Of these, a total of 136 SNP loci shared by both models were found to be associated with 71 protein-coding genes (Figure 5). Most of these genes are found to be involved in diverse role, including nutrient uptake, root architecture development, and abiotic stress in mungbean. The Arabidopsis orthologous genes are found to be involved mostly in root development and nutrient uptake. Among these 71 protein coding genes, a total of 13 genes are found to be strongly involved in root development and nutrient uptake (Figure 5). The Arabidopsis orthologs of these genes are plastidal glycolate/glycerate translocator 1 (PLGG1) (At1G32080), At5PTASE9 (At2G01900), Ca2+-sensor protein kinases-NIN-like protein 7 (CPK-NLP7) (At2G37590), cellulose synthase-like D gene (CSLD3) (At5G16910), K+ channel Arabidopsis thaliana (KAT1) (At4G11480), ubiquitin-conjugating enzyme E2 13 (UBC13) (At3G46460), fibroblast growth factor receptor substrate 3 (FRS3) (At2G27110), GTPase root hair defective 3 (RHD3) (At4G39250), iron-regulated transport er1 (IRT1) (At5G58440), PHO80 (At5G64260), K+ uptake 7 (KUP7) (At5G09400), speechless (SPCH) (At5G53210), and KAN protein (KANADI) (At4G25440). We found that three genes VRADI11G08340, VRADI01G05520, and VRADI04G10750 containing missense SNP at CDS region. These three genes may regulate PUE traits by changing at protein structure level. Therefore, we determined the protein structure by I-TASSER3 for these three genes in order to decipher the functional complexity at protein structure level. However, we were able to predict the protein structure for two genes (VRADI11G08340; VRADI01G05520) (Figure 4). The structural analysis of these genes at protein level revealed a significant variation for native and mutated version of the genes. The missense SNPs present in the CDS of VRADI11G08340, VRADI01G05520, and VRADI04G10750 genes changes the amino acids from A/G; methionine to valine, T/C; tyrosine to histidine and T/C; and leucine to serine, respectively. Therefore, it may be concluded that these genes are potential candidate genes regulating PUE in mungbean by changing protein structure at tertiary level. Furthermore, we found that 20 potential candidate genes tended to have pleiotropic effects (Supplementary Table S3). For example, candidate gene VRADI06G09990 was significantly associated with RDW and RSR under low-P condition, with RDW under optimum-P condition. Similarly, candidate gene VRADI07G06230 was significantly associated with TLA, RDW, SDW, TRV, and TSA under optimum-P condition. These genes may be involved in many metabolic pathways and affect the PUE traits and therefore worthy of future attention.
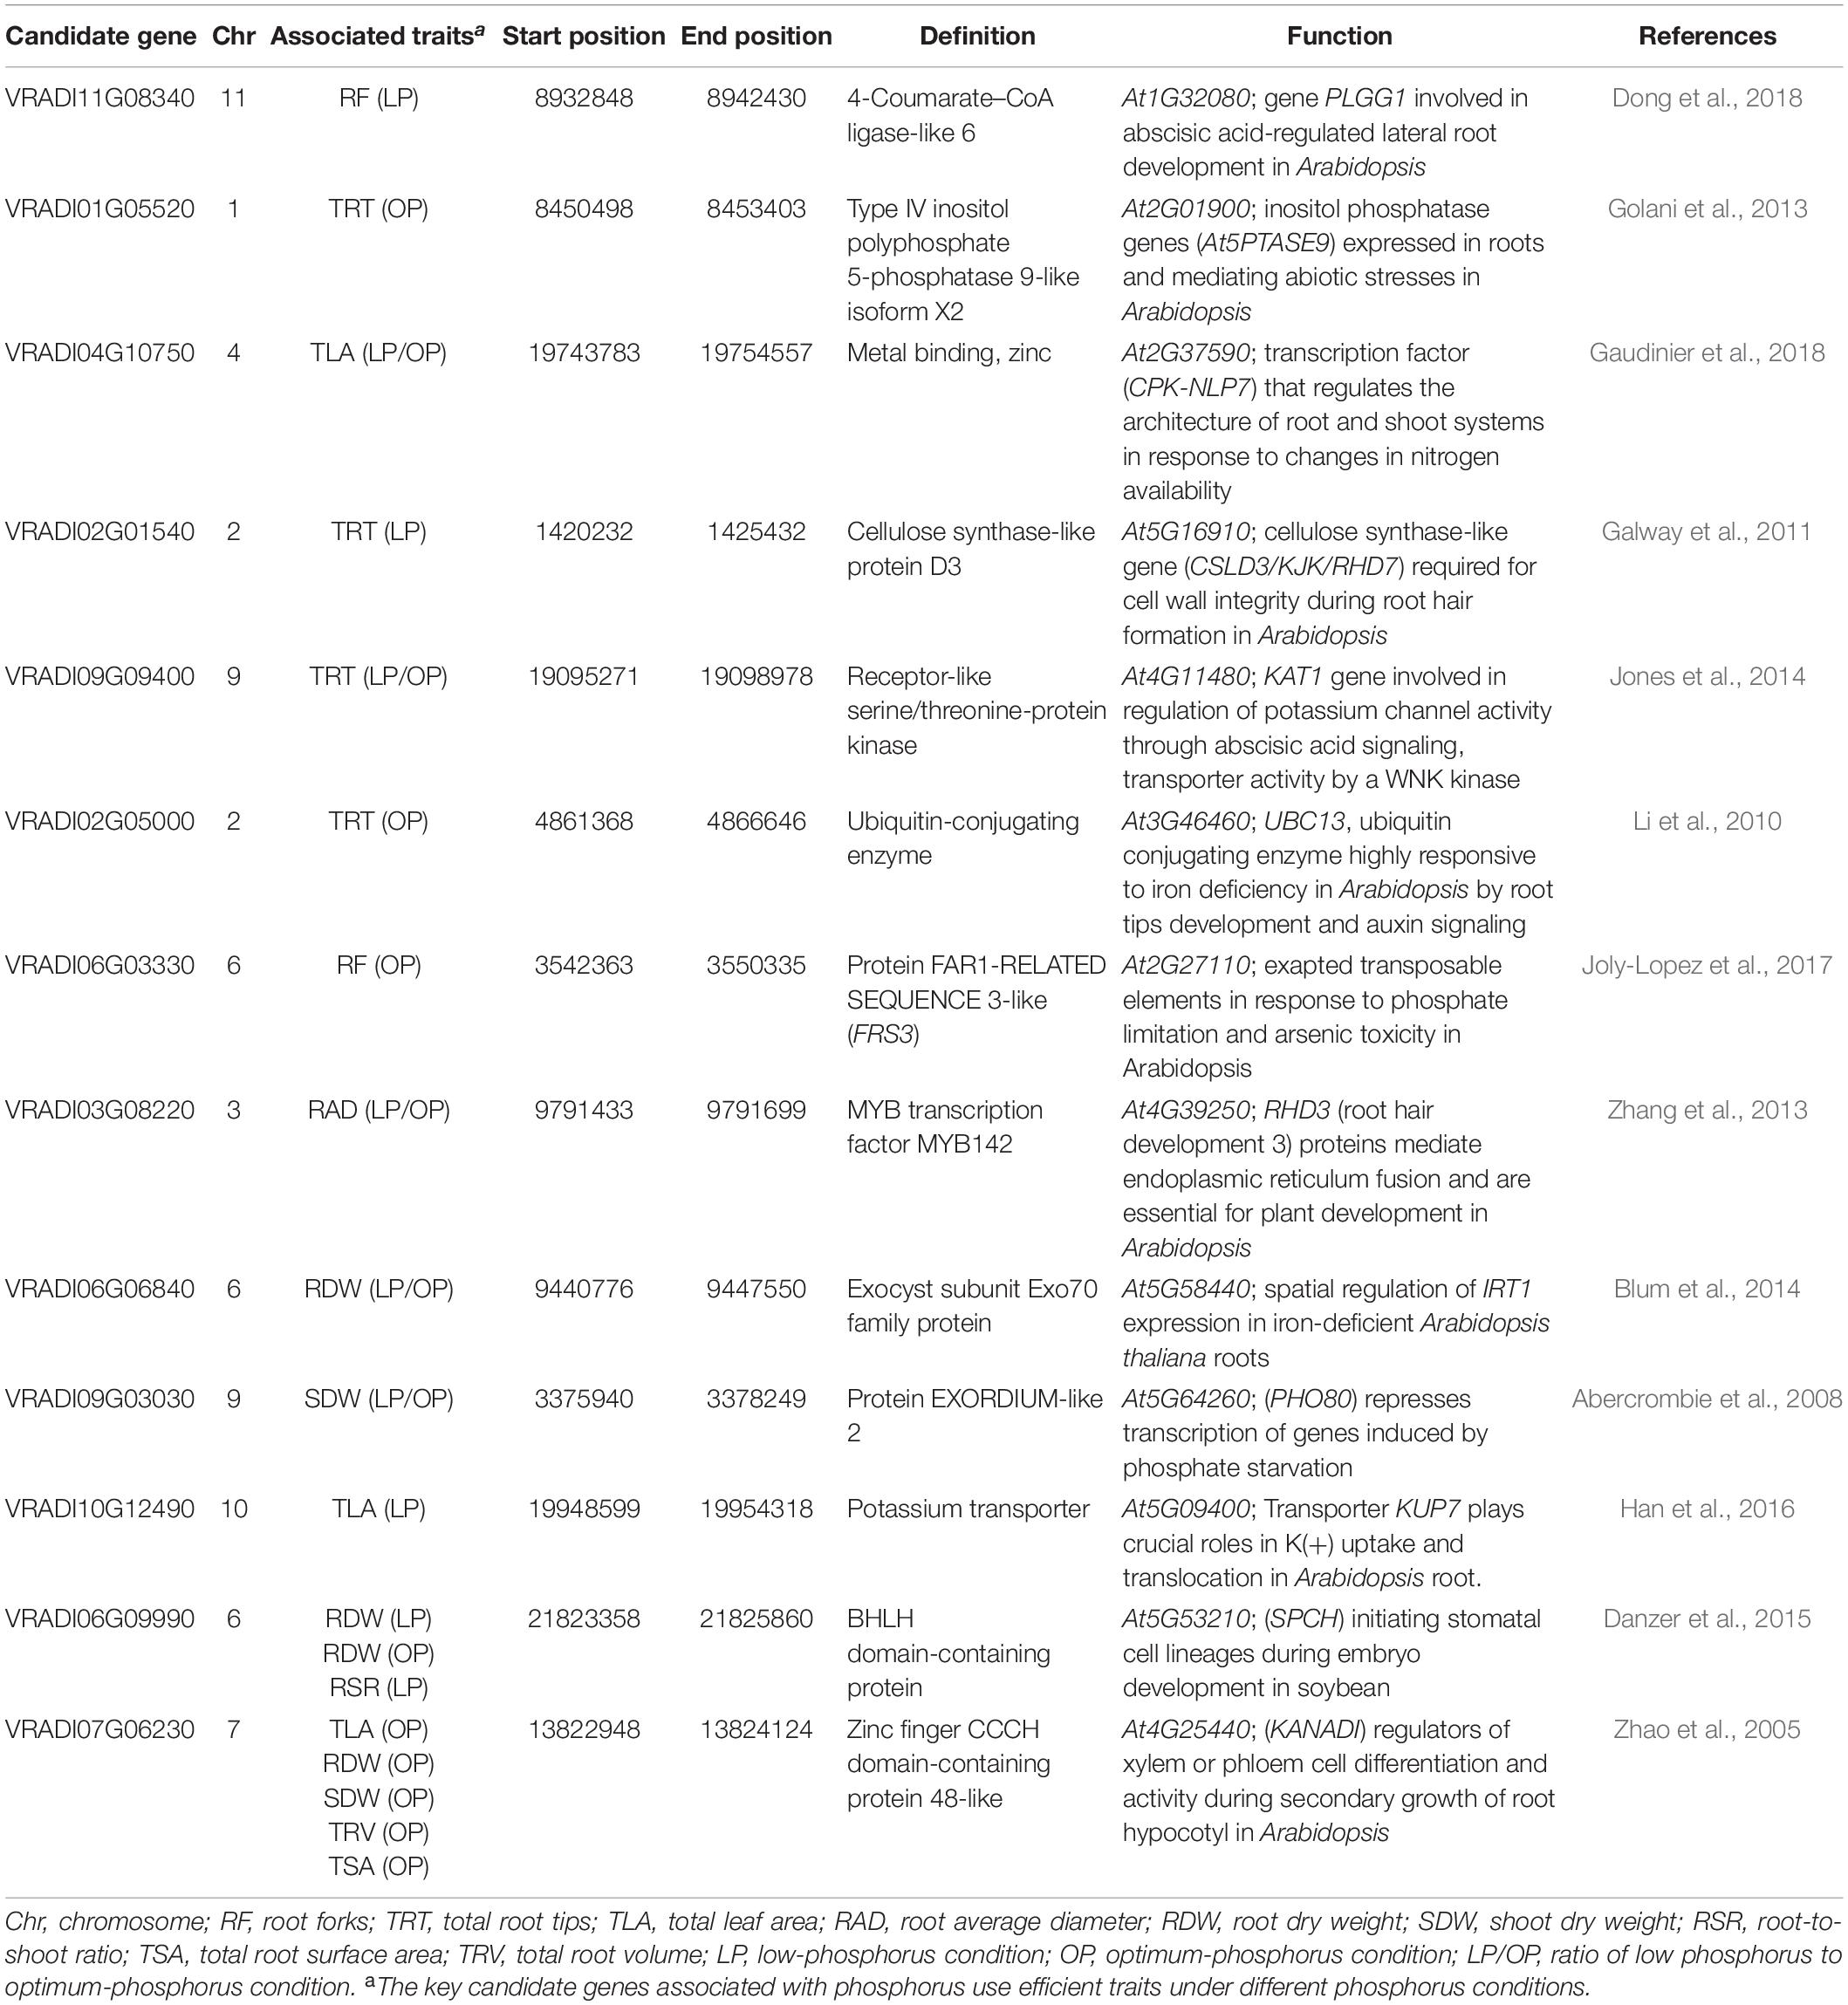
Table 6. Putative candidate genes and their annotation.
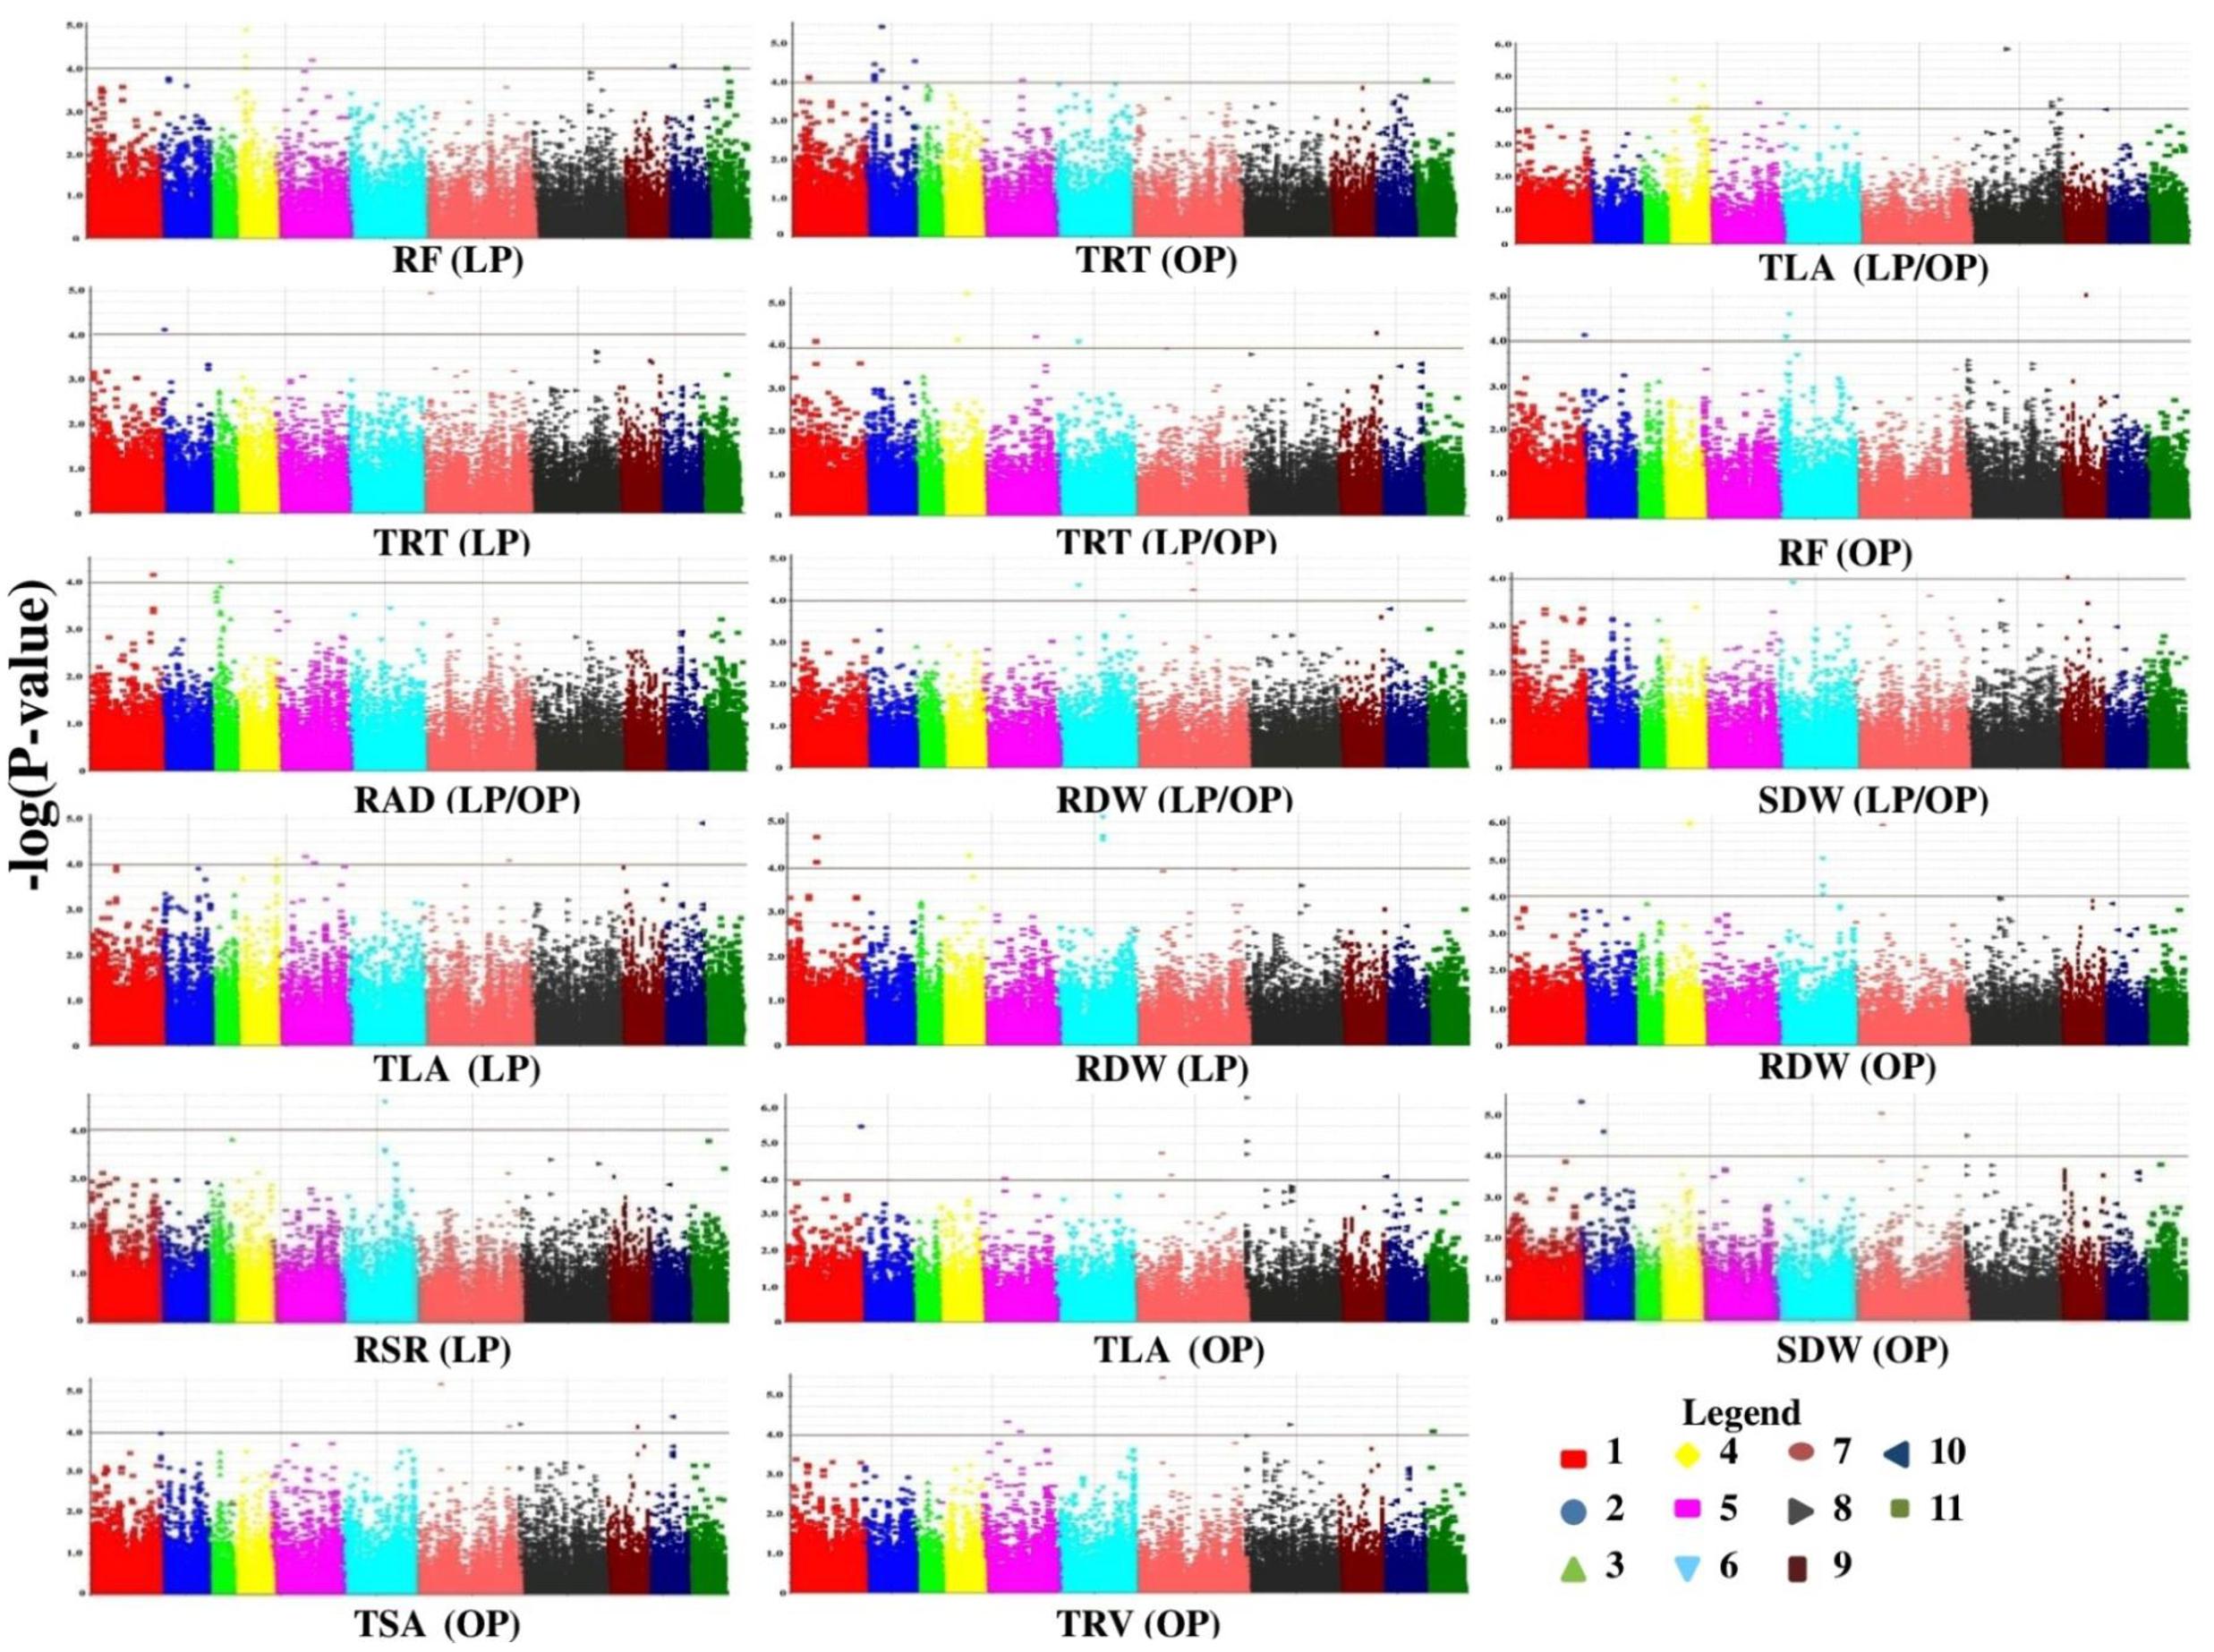
Figure 5. Manhattan plots showing significant p-values (measured with mixed linear model) for Phosphorus use efficiency traits associated with 13 putative candidate genes. Colors indicate different chromosomes while horizontal lines indicate a common significance level of p = 0.0001 [–log(p) = 4.0]. RF, root forks; TRT, total root tips; TLA, total leaf area; RAD, root average diameter; RDW, root dry weight; SDW, shoot dry weight; RSR, root to shoot ratio; TSA, total root surface area; TRV, total root volume; LP, low phosphorus condition; OP, optimum phosphorus condition; LP/OP, ratio of low phosphorus to optimum phosphorus condition.
Digital Gene Expression Analysis for the Candidate Genes
The digital gene expression analysis showed that AT1g32080, AT2g01900, AT2g27110, ATg37590, AT3g46460, AT4g11480, AT5g16910, AT5g53210, AT5g58440, and AT5g64260 gene (ortholog of VRADI11G08340, VRADI01G05520, VRADI04G10750, VRADI09G09400, VRADI02G05000, VRADI02G01540, VRADI06G09990, VRADI06G06840, VRADI10G12490, and VRADI09G03030) had the highest expression in lateral root cap, pericycle, lateral root cap, whole root, seed root cell and hairs, whole root, root hair, pollen, seed, and shoot apical meristem, respectively (Supplementary Figure S5).
Discussion
Phenotypic P Response of Mungbean Genotypes
The present study showed significant greater root biomass accumulation resulting in higher root-to-shoot ratio under low-P condition. Under P-deficient condition, P-efficient genotype maintained higher root-to-shoot ratio than P-inefficient genotype in maize (Mollier and Pellerin, 1999) and common bean (Nielsen et al., 2001). RDW has been indicated as key trait for determining P starvation response in soybean (Li et al., 2005). Higher chlorophyll concentration in leaves causes dark green foliage under low-P condition. P deficiency causes stunted growth and foliage turns dark green color because of accumulation of starch and sugars in the leaves (Pandey, 2015).
GBS Assay Accelerate Genomic Resources Development in Mungbean
In the present study, we employed GBS assay for discovery and genotyping of SNPs in mungbean. The length of pseudomolecule assemblies of mungbean genomes was 333.4 Mb representing 57% of total genome. The SNPs mined with GBS assay were found to be dispersed in different portions of mungbean genomes, which may lead to differences in physical map density of SNPs within the genomes. This large number of SNPs (76,160) reported in our study can be utilized for genotyping and QTL mapping for several traits as well as comparative genome mapping involving mungbean and legumes. Additionally, 55,634 chromosome-based SNPs can be used for marker-based applications of mungbean breeding.
Functional Utility of GBS-Based SNPs in Mungbean
The discovered SNPs were annotated in different components of protein-coding genes of mungbean genomes. The structural and functional annotation revealed that a total of 29,923 SNPs present in intergenic region and 25,663 SNPs in intragenic region. Among the intragenic variants, 10,423 and 13,030 SNPs were found to be present in intron and CDS regions, respectively. Further, the coding variants represented 5,643 and 7,387 missense and synonymous variants. A large number of SNPs were found to be present in regulatory region. The upstream and downstream regulatory region consisted of likely equal number of SNPs (16,260 upstream SNPs, 17,464 downstream SNPs). The structural and functional annotation of genes will accelerate the pace of AM to identify a number of genes/QTLs governing qualitative and quantitative agronomic traits in mungbean. Tajima’s D is a statistical test which is performed to test the null hypothesis of mutation-drift equilibrium and constant population size. A significantly higher Tajima’s D (3.21848) value were observed in our used AM panel. The results indicate that mungbean may undergo for a population reduction (Maruyama and Fuerst, 1985), population subdivision, or a recent bottleneck.
In our study, high-resolution LD pattern were determined in a structured population of 144 mungbean accessions. In soybean and chickpea, several studies have been carried out using GBS and WGRS (Whole genome re-sequence) approach to find the LD pattern and dissect complex trait (Bajaj et al., 2015; Das et al., 2015; Sonah et al., 2015; Zhou et al., 2015; Varshney et al., 2019). In a study, the LD extent was found to be ∼27 kb in wild soybean. In the soybean landraces and improved cultivars, LD was found to be 83 and 133 kb, respectively, which are comparable with mungbean (Zhou et al., 2015). The LD pattern in mungbean is found to be different from chickpea with larger decay at physical position (150–200 kb) (Saxena et al., 2014; Kujur et al., 2015; Upadhyaya et al., 2016; Varshney et al., 2019).
The study revealed a higher LD estimate (r2, 0.62) and less extensive LD decay with approximately 50–100 kb physical distance in mungbean chromosomes. In a previous study, the LD decay was found to be extensive with approximately 60–100 kb physical distance in a panel of cultivated and wild mungbean accessions (Noble et al., 2018). The LD pattern in mungbean was found to be likely the same to other self-pollinated crop species, like soybean (Patil et al., 2016) but different from chickpea (Saxena et al., 2014; Kujur et al., 2015) with larger decay at physical position. The population structure analysis of the composed panel revealed three population groups which was further confirmed by phylogenetic and principal component analysis. Additionally, this is the first high-resolution determination of LD decay in mungbean with such a large number of genome-wide markers (55,634 SNP markers).
GWAS to Dissect Complex PUE Traits in Mungbean
The PUE is an important trait which determines yield potential in several crops, including mungbean. Crops with enhanced PUE lead to higher growth for the same amount of P taken up at a time (Rengel and Marschner, 2005). However, the trait is complex and quantitative in nature (Heuer et al., 2017). Therefore, it is desirable to dissect complex genetic inheritance patterns of PUE traits in mungbean. Efforts have been made toward molecular dissection of this complex trait. Several QTLs/alleles for root, shoot, and grain yield-related traits underlying low-phosphorus tolerance have been reported in different legume crop plants including common bean (Beebe et al., 2006; Ochoa et al., 2006; Diaz et al., 2017), Soybean (Song et al., 2014; Zhang et al., 2017) and cowpea (Ravelombola et al., 2017). However, AM has not been explored in mungbean genome to identify functionally relevant molecular tags regulating important traits. In a previous study, a total of 22,000 polymorphic genome-wide SNPs were developed and utilized for AM for seed coat color in mungbean (Noble et al., 2018). In this study, for the first time, such a large number of high-quality SNPs has been developed (76,160 SNPs) in mungbean. Furthermore, these genome-wide well-distributed SNPs have been utilized to perform AM for PUE traits in mungbean. We reported a total of 1,171 and 139 significant SNPs associated with PUE traits by GLM and MLM models, respectively. Of these, a total of 136 SNP loci shared by both models were found to be associated with 71 protein coding genes (Figure 5). Most of these genes are found to be involved in diverse roles, including nutrient uptake, root architecture development, and abiotic stress in mungbean. The Arabidopsis orthologous genes are found to be involved mostly in root development and nutrient uptake.
In our study, we identified bHLH, MYB, and F-box domain-containing and cellulose synthase-like genes. The genes having basic helix-loop-helix DNA binding domains are reported to be involved in root development and biomass accumulation. These genes may help to increase P content and root hair formation (Chen et al., 2007; Li et al., 2011; Giehl and von Wiren, 2014). The genes with MYB DNA binding domain is reported to act in controlling architecture of root as well as adaptation to P starvation (Devaiah et al., 2009; Dai et al., 2012; Baek et al., 2013). The F-box domain-containing genes are reported to influence response to low-P stress in crop plants (Baldwin et al., 2008; Perez-Torres et al., 2008; Nakamura et al., 2009). The cellulose synthase-like genes are reported to be involved in cell wall remodeling under low-P condition (Xu et al., 2018). Interestingly, most of the genes exhibited root-specific expression which clearly indicates the possible role of these genes in phosphorous nutrient uptake.
Among these 13 putative candidate genes, we identified missense SNPs in CDS region of three genes, VRADI11G08340, VRADI01G05520, and VRADI04G10750. The Arabidopsis ortholog genes of these are plastidal glycolate/glycerate translocator 1 (PLGG1), inositol polyphosphate 5-phosphatase (At5PTASE9), and CPK-NLP7. The PLGG1 encodes a chloroplast protein which regulates lateral root development in response to ABA (Dong et al., 2018). Trull et al. (1997) described the role of ABA in root development under P deficiency with ABA-deficient mutants in Arabidopsis. Interestingly, the AT5PTASE9, inositol polyphosphate 5-phosphatase is previously reported to be involved in phosphate homeostasis (Kuo et al., 2018; Zhu et al., 2019). The AT5PTASE9 is a member of the AT5PTASE family, which regulates several responses, such as the calcium influx, ROS production, bulk endocytosis, and induction of stress-responsive genes (Golani et al., 2013). The CPK-NLP7 is found to be involved in a transcriptional regulatory network that regulates the root and shoot architecture in response to changes in nitrogen availability (Gaudinier et al., 2018). The missense SNPs present in the CDS region resulted in structural changes at protein level. Allelic variation of VRADI11G08340, VRADI01G05520, and VRADI04G10750 between native and mutated sequences suggests that the respective protein differ in domains and structure for post-transcriptional modification (Figure 6). The differences in protein–protein interactions and signal integration results in differential transcriptional modulations that are causal for observed difference in PUE (Wissuwa et al., 2015). Therefore, these genes may be the potential candidate genes regulating PUE trait in mungbean by changing the protein structure at tertiary level.
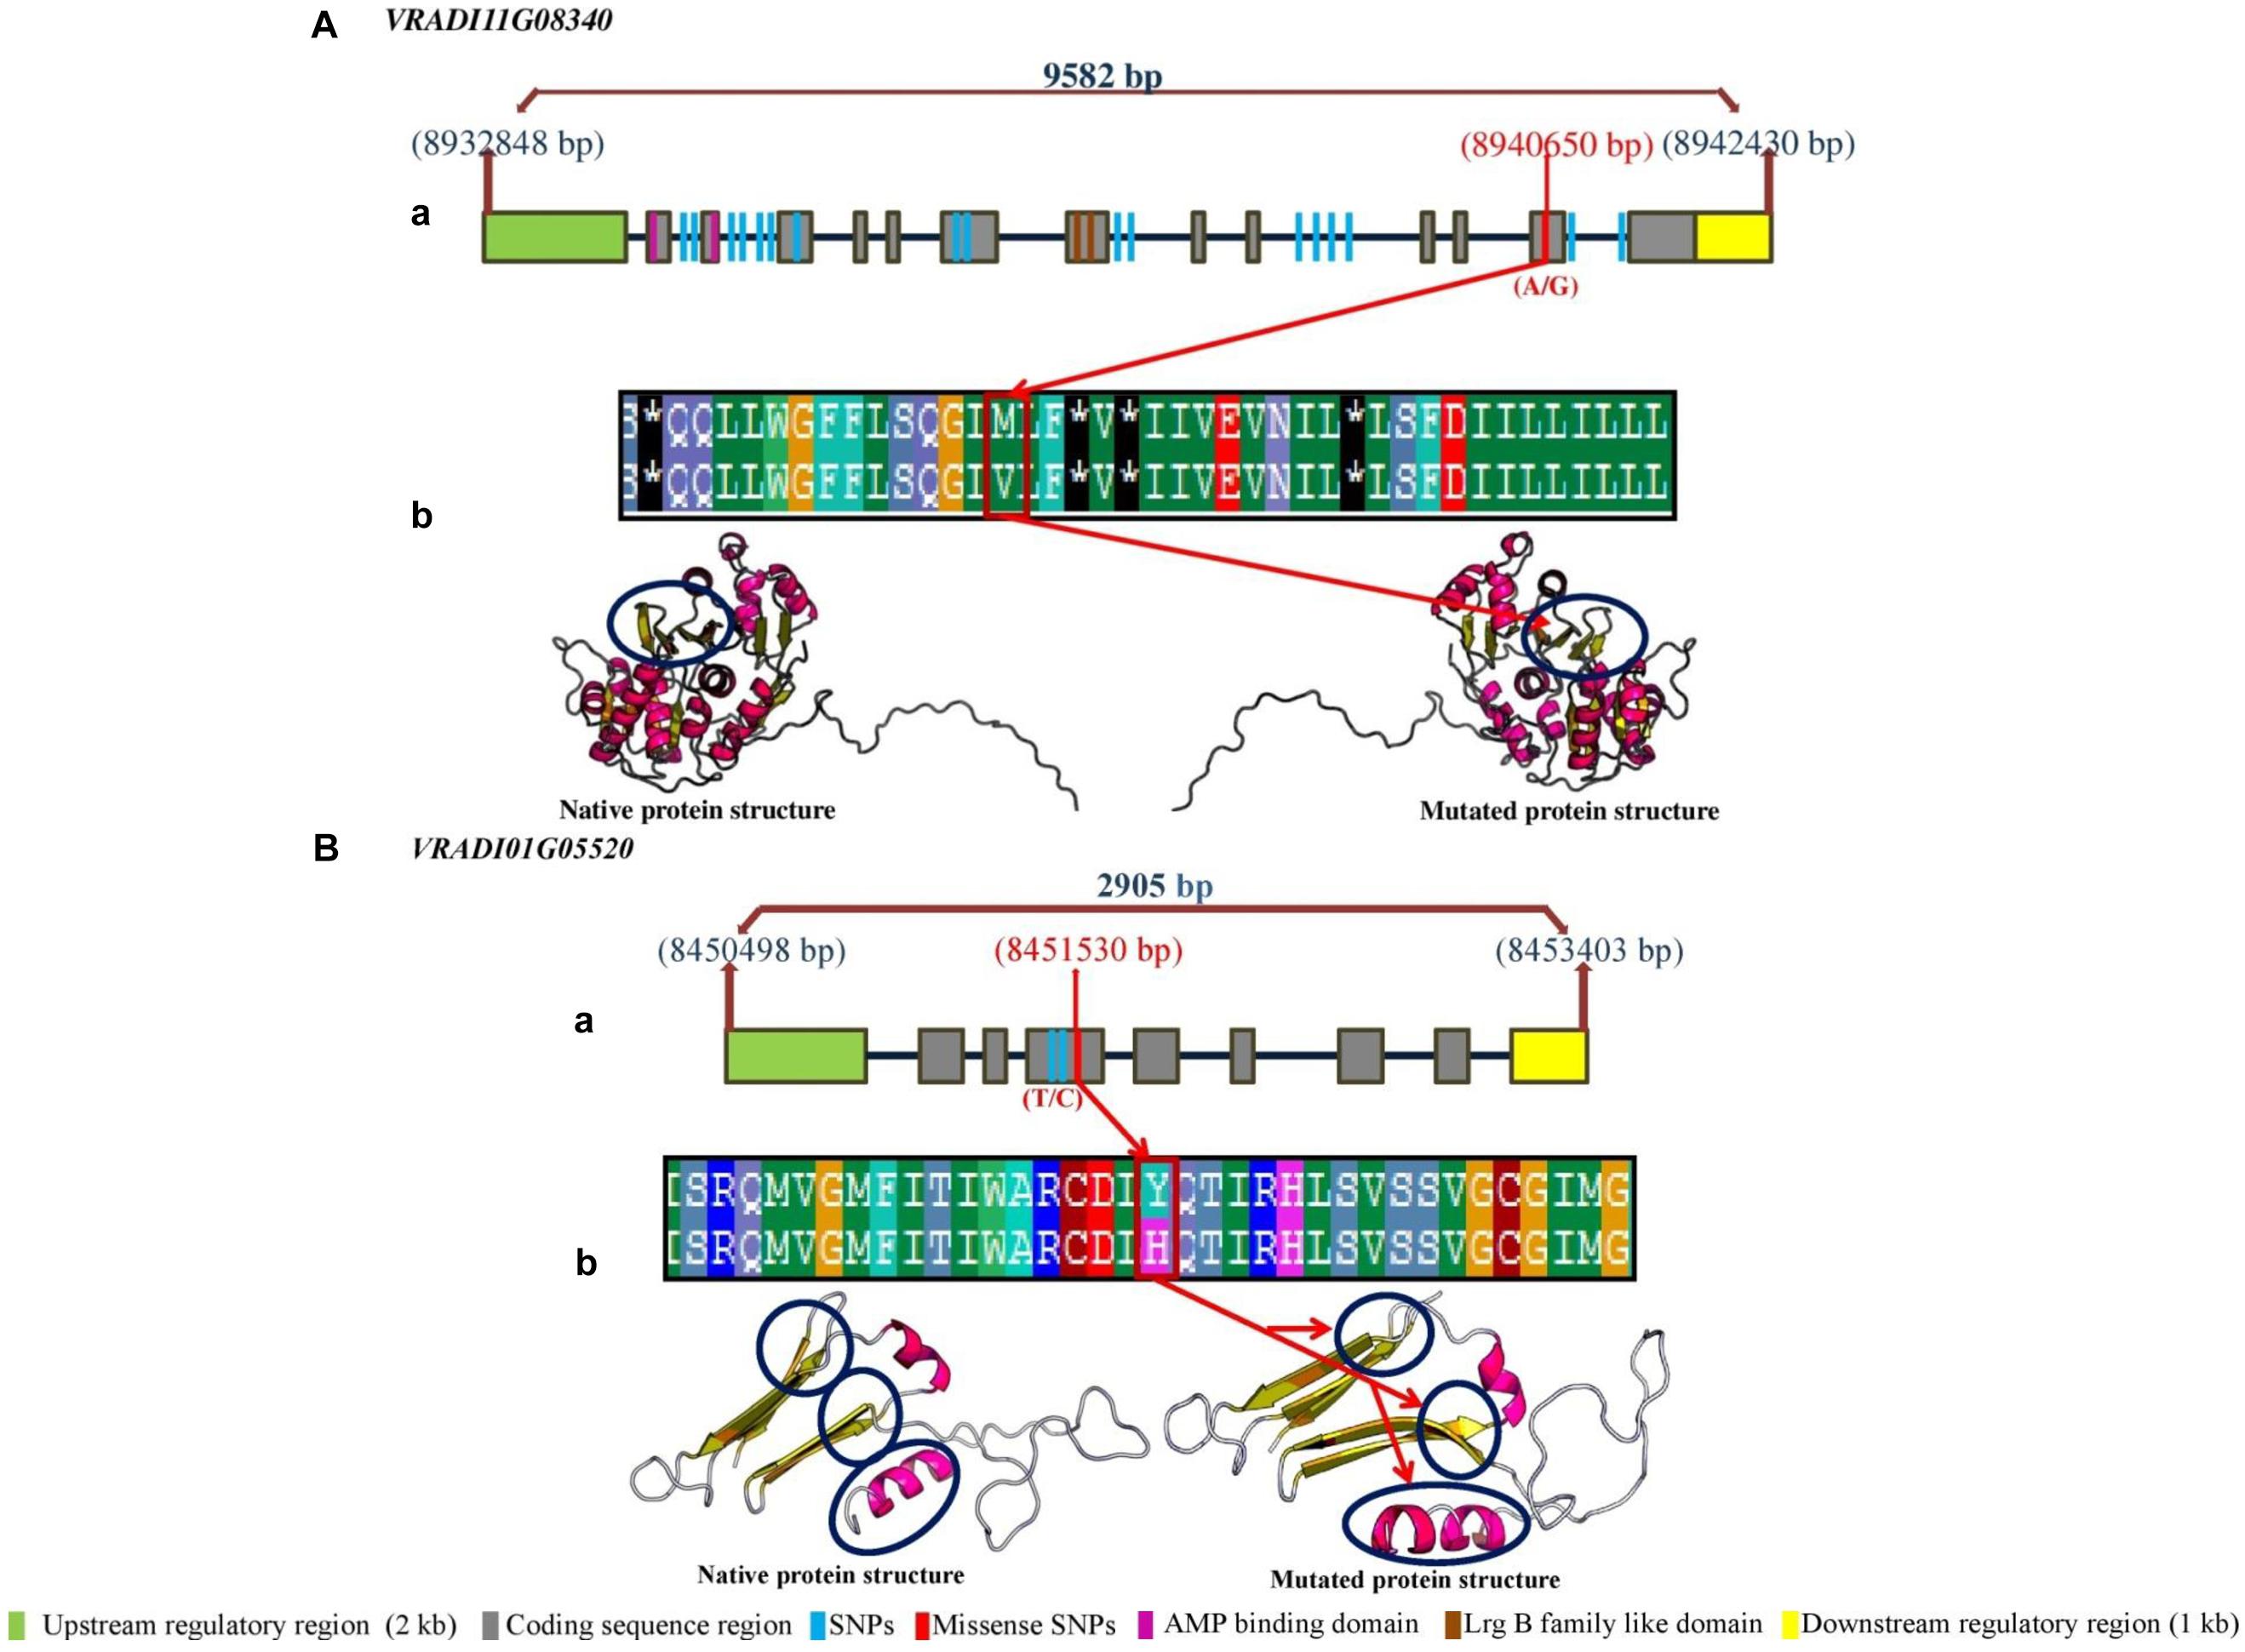
Figure 6. (A) (a) Gene structure of potential candidate gene VRADI11G08340 (b) Conformational changes in protein structure due to functional allele (A/G; missense SNP) at the CDS sequence. (B) (a) Gene structure of potential candidate gene VRADI01G05520 (b) Conformational changes in protein structure due to functional allele (T/C; missense SNP) at the CDS sequence.
Conclusion
We performed GWAS for PUE traits in a population containing 144 diverse mungbean genotypes with 55,634 SNP markers. The genetic diversity analysis, LD analysis, and population structure of this study will accelerate the pace of mungbean genomics research which can be directed toward genetic improvement of mungbean. The identified SNPs and candidate genes associated with PUE traits can be used in mungbean breeding program to enhance phosphorus deficiency tolerance. These results demonstrated the efficacy and reliability of implementing high-resolution AM in mungbean which has a narrow genetic base and least availability of genomic resources. However, these genes need to be validated further to shed light on their functional role in regulation of the PUE traits in mungbean. Overall, the large number of genomic resources developed in our study will lead to enrich mungbean genomics. These resources can also be utilized to advance genomic-assisted breeding in mungbean.
Data Availability Statement
The original contributions presented in the study are publicly available. This data can be found here: https://www.ncbi.nlm.nih.gov/sra/PRJNA609409.
Author Contributions
HD, GM, RP, MS, and VR planned and designed the research. VR, MA, SM, and AS performed the hydroponics experiment. VR, P, TB, KT, and PG helped in data recording. VR, MA, and GM conducted genotyping of the association mapping panel. VR and SD conducted the STRUCTURE, TASSEL, and Bioinformatic analysis. HD, VR, and SD prepared the manuscript. RN, TS, and SK edited the manuscript for publication. All authors have read and approved the final manuscript.
Funding
This research work was carried out from the grants received from ICAR-IARI (research grant from the NAHEP-CAAST project) and DST (CRG/2018/002642). The funds from DST were utilized for phenotyping work and ICAR-IARI grants were utilized for GBS. The funding support for open access publication fees is being contributed by AVRDC.
Conflict of Interest
The authors declare that the research was conducted in the absence of any commercial or financial relationships that could be construed as a potential conflict of interest.
The reviewer MKP declared a past co-authorship with one of the authors GM to the handling editor.
Acknowledgments
The authors are thankful to ICAR-IARI (research grant from the NAHEP-CAAST project) and DST for financial support to this research study. The authors acknowledge the facilities and guidance provided by the Head, Division of Genetics, Joint Director Research and Director, ICAR-IARI. The authors are grateful to the Head, Division of Plant Physiology and Professor, Division of Genetics for help and guidance during the investigations. VR is also thankful to Acharya N. G. Ranga Agricultural University, Andhra Pradesh for according deputation to pursue doctoral degree program at IARI, New Delhi.
Supplementary Material
The Supplementary Material for this article can be found online at: https://www.frontiersin.org/articles/10.3389/fpls.2020.537766/full#supplementary-material
Supplementary Figure 1 | Manhattan plots showing significant p values (measured with mixed linear model) for phosphorus use efficiency traits.
Supplementary Figure 2 | Quantile–quantile plots illustrating the comparison between expected and observed −log10(p) values to detect significant genomic loci (genes) associated with phosphorus use efficient traits in mungbean.
Supplementary Figure 3 | (A) LD decay measured in association panel of 144 diverse mungbean genotypes. (B) Delta K plot showing best peak at K = 3. (C) Population genetic structure plot of mungbean association mapping panel (optimal population number k = 3 with three different colors.
Supplementary Figure 4 | Principal component analysis using 55634 high quality GBS based SNPs assigned to 144 diverse mungbean genotypes into three populations (1, 2 and 3).
Supplementary Figure 5 | Digital gene expression analysis and graphical representation of data.
Supplementary Table 1 | Source/Origin of 144 genotypes of mungbean used in the study.
Supplementary Table 2 | Analysis of variance for the tested traits under two phosphorus regimes.
Supplementary Table 3 | List of 136 SNPs associated with PUE traits along with putative candidate genes.
Footnotes
- ^ http://creskolab.uoregon.edu/stacks
- ^ https://blast.ncbi.nlm.nih.gov/Blast.cgi
- ^ https://zhanglab.ccmb.med.umich.edu/I-TASSER
References
Abercrombie, J. M., Halfhill, M. D., Ranjan, P., Rao, M. R., Saxton, A. M., Yuan, J. S., et al. (2008). Transcriptional responses of Arabidopsis thaliana plants to As (V) stress. BMC Plant Biol. 8:87. doi: 10.1186/1471-2229-8-87
Atwell, S., Huang, Y. S., Vilhjalmsson, B. J., Willems, G., Horton, M., Li, Y., et al. (2010). Genome-wide association study of 107 phenotypes in Arabidopsis thaliana inbred lines. Nature 465, 627–631. doi: 10.1038/nature08800
Austin, R. S., Hiu, S., Waese, J., Ierullo, M., Pasha, A., Wang, T. T., et al. (2016). New BAR tools for mining expression data and exploring Cis-elements in Arabidopsis thaliana. Plant J. 88, 490–504. doi: 10.1111/tpj.13261
Baek, D., Kim, M. C., Chun, H. J., Kang, S., Park, H. C., and Shin, G. (2013). Regulation of miR399f transcription by AtMYB2 affects phosphate starvation responses in Arabidopsis. Plant Physiol. 161, 362–373. doi: 10.1104/pp.112.205922
Bajaj, D., Das, S., Badoni, S., Vinod, K., Singh, M., Bansal, K. C., et al. (2015). Genome-wide high-throughput SNP discovery and genotyping for understanding natural (functional) allelic diversity and domestication patterns in wild chickpea. Sci. Rep. 5:12468. doi: 10.1038/srep12468
Baldwin, J. C., Karthikeyan, A. S., Cao, A. Q., and Raghothama, K. G. (2008). Biochemical and molecular analysis of LePS2;1: a phosphate starvation induced protein phosphatase gene from tomato. Planta 228, 273–280. doi: 10.1007/s00425-008-0736-y
Bastien, M., Sonah, H., and Belzile, F. (2014). Genome wide association mapping of Sclerotinia sclerotiorum resistance in soybean with a genotyping-by-sequencing approach. Plant Genome 7, 1–13. doi: 10.3835/plantgenome2013.10.0030
Basu, U., Srivastava, R., Bajaj, D., Malo, V., Daware, A., Malik, N., et al. (2018). Genome-wide generation and genotyping of informative SNPs to scan molecular signatures for seed yield in chickpea. Sci. Rep. 8:13240.
Beebe, S. E., Rojas-Pierce, M., Yan, X., Blair, M. W., Pedraza, F., Munoz, F., et al. (2006). Quantitative trait loci for root architecture traits correlated with phosphorus acquisition in common bean. Crop Sci. 46, 413–423. doi: 10.2135/cropsci2005.0226
Benjamini, Y., and Hochberg, Y. (1995). Controlling the false discovery rate: a practical and powerful approach to multiple testing. J. R. Stat. Soc. Series B (Methodological). 57, 289–300. doi: 10.1111/j.2517-6161.1995.tb02031.x
Blum, A., Brumbarova, T., Bauer, P., and Ivanov, R. (2014). Hormone influence on the spatial regulation of IRT1 expression in iron-deficient Arabidopsis thaliana roots. Plant Signal. Behav. 9:e28787. doi: 10.4161/psb.28787
Bohra, A., Jha, R., and Pandey, G. (2017). New hypervariable SSR markers for diversity analysis, hybrid purity testing and trait mapping in pigeonpea [Cajanus cajan (L.) Millspaugh]. Front. Plant Sci. 2017: 377.
Chen, J., Xu, L., Cai, Y., and Xu, J. (2008). QTL mapping of phosphorus efficiency and relative biologic characteristics in maize (Zea mays L.) at two sites. Plant Soil 313, 251–266. doi: 10.1007/s11104-008-9698-x
Chen, Z. H., Nimmo, G. A., Jenkins, G. I, and Nimmo, H. G. (2007). BHLH32 modulates several biochemical and morphological processes that respond to Pi starvation in Arabidopsis. Biochem. J. 405, 191–198. doi: 10.1042/BJ20070102
Collard, B. C. Y., Jahufer, M. Z. Z., Brouwer, J. B., and Pang, E. C. K. (2005). An introduction to markers, quantitative trait loci (QTL) mapping and marker-assisted selection for crop improvement: the basic concepts. Euphytica 142, 169–196. doi: 10.1007/s10681-005-1681-5
Dai, X. Y., Wang, Y. Y., Yang, A., and Zhang, W. H. (2012). OsMYB2P-1, an R2R3 MYB transcription factor, is involved in the regulation of phosphate starvation responses and root architecture in rice. Plant Physiol. 159, 169–183. doi: 10.1104/pp.112.194217
Danzer, J., Mellott, E., Bui, A. Q., Le, B. H., Martin, P., Hashimoto, M., et al. (2015). Down-regulating the expression of 53 soybean transcription factor genes uncovers a role for SPEECHLESS in initiating stomatal cell lineages during embryo development. Plant Physiol. 168, 1025–1035. doi: 10.1104/pp.15.00432
Das, S., Upadhyaya, H. D., Bajaj, D., Kujur, A., Badoni, S., Laxmi, et al. (2015). Deploying QTL-seq for rapid delineation of a potential candidate gene underlying major trait-associated QTL in chickpea. DNA Res. 22, 193–203. doi: 10.1093/dnares/dsv004Danzer
Devaiah, B. N., Madhuvanthi, R., Karthikeyan, A. S., and Raghothama, K. G. (2009). Phosphate starvation responses and gibberellic acid biosynthesis are regulated by the MYB62 transcription factor in Arabidopsis. Mol. Plant. 2, 43–58. doi: 10.1093/mp/ssn081
Diaz, L. M., Ricaurte, J., Cajiao, C., Galeano, C. H., Rao, I., Beebe, S., et al. (2017). Phenotypic evaluation and QTL analysis of yield and symbiotic nitrogen fixation in a common bean population grown with two levels of phosphorus supply. Mol. Breed. 37:76. doi: 10.1007/s11032-017-0673-1
Dong, H., Bai, L., Chang, J., and Song, C. P. (2018). Chloroplast protein PLGG1 is involved in abscisic acid-regulated lateral root development and stomatal movement in Arabidopsis. Biochem. Bioph. Res. Co. 495, 280–285. doi: 10.1016/j.bbrc.2017.10.113
Elanchezhian, R., Krishnapriya, V., Pandey, R., Rao, A., and Abrol, Y. (2015). Physiological and molecular approaches for improving phosphorus uptake efficiency of crops. Curr. Sci. 108, 1271–1279.
Flint-Garcia, S. A., Thornsberry, J. M., and Buckler, E. S. (2003). Structure of linkage disequilibrium in plants. Annu. Rev. Plant Biol. 54, 357–374. doi: 10.1146/annurev.arplant
Franco, J. A., Banon, S., Vicente, M. J., Miralles, J., and Martinez-Sanchez, J. J. (2011). Root development in horticultural plants grown under abiotic stress conditions–a review. J. Hortic. Sci. Biotech. 86, 543–556. doi: 10.1080/14620316.2011.11512802
Galway, M. E., Eng, R. C., Schiefelbein, J. W., and Wasteneys, G. O. (2011). Root hair-specific disruption of cellulose and xyloglucan in AtCSLD3 mutants, and factors affecting the post-rupture resumption of mutant root hair growth. Planta 233, 985–999. doi: 10.1007/s00425-011-1355-6
Gamuyao, R., Chin, J. H., Pariasca-Tanaka, J., Pesaresi, P., Catausan, S., Dalid, C., et al. (2012). The protein kinase PSTOL1 from traditional rice confers tolerance of phosphorus deficiency. Nature 488, 535–539. doi: 10.1038/nature11346
Gaudinier, A., Rodriguez-Medina, J., Zhang, L., Olson, A., Liseron-Monfils, C., Bagman, A. M., et al. (2018). Transcriptional regulation of nitrogen-associated metabolism and growth. Nature 563, 259–264. doi: 10.1038/s41586-018-0656-3
Giehl, R. F., and von Wiren, N. (2014). Root nutrient foraging. Plant Physiol. 166, 509–517. doi: 10.1104/pp.114.245225
Golani, Y., Kaye, Y., Gilhar, O., Ercetin, M., Gillaspy, G., and Levine, A. (2013). Inositol polyphosphate phosphatidylinositol 5-phosphatase9 (AT5PTASE9) controls plant salt tolerance by regulating endocytosis. Mol. Plant 6, 1781–1794. doi: 10.1093/mp/sst072
Gore, M. A., Chia, J. M., Elshire, R. J., Sun, Q., Ersoz, E. S., Hurwitz, B. L., et al. (2009). A first-generation haplotype map of maize. Science 326, 1115–1117. doi: 10.1126/science.1177837
Gulles, A. A., Bartolome, V. I., Morantte, R. I. Z. A., and Nora, L. A. (2014). Randomization and analysis of data using STAR (Statistical Tool for Agricultural Research). Philipp. J. Crop Sci. 39:137.
Han, M., Wu, W., Wu, W. H., and Wang, Y. (2016). Potassium transporter KUP7 is involved in K+ acquisition and translocation in Arabidopsis root under K+-limited conditions. Mol. Plant 9, 437–446. doi: 10.1016/j.molp.2016.01.012
Heuer, S., Gaxiola, R., Schilling, R., Herrera-Estrella, L., Lopez-Arredondo, D., Wissuwa, M., et al. (2017). Improving phosphorus use efficiency: a complex trait with emerging opportunities. Plant J. 90, 868–885. doi: 10.1111/tpj.13423
Hirschhorn, J. N., and Daly, M. J. (2005). Genome-wide association studies for common diseases and complex traits. ?Nat. Rev. Genet. 6, 95–108. doi: 10.1038/nrg1521
Jarquin, D., Kocak, K., Posadas, L., Hyma, K., Jedlicka, J., Graef, G., et al. (2014). Genotyping by sequencing for genomic prediction in a soybean breeding population. BMC Genom. 15:740. doi: 10.1186/1471-2164-15-740
Johnston, A. E., Poulton, P. R., Fixen, P. E., and Curtin, D. (2014). Phosphorus: its efficient use in agriculture. Adv. Agron. 123, 177–228. doi: 10.1016/B978-0-12-420225-2.00005-4
Joly-Lopez, Z., Forczek, E., Vello, E., Hoen, D. R., Tomita, A., and Bureau, T. E. (2017). Abiotic stress phenotypes are associated with conserved genes derived from transposable elements. Front. Plant Sci. 8:2027. doi: 10.3389/fpls.2017.02027
Jones, A. M., Xuan, Y., Xu, M., Wang, R. S., Ho, C. H., Lalonde, S., et al. (2014). Border control—a membrane-linked interactome of Arabidopsis. Science 344, 711–716. doi: 10.1126/science.1251358
Kang, Y. J., Kim, S. K., Kim, M. Y., Lestari, P., Kim, K. H., Ha, B. K., et al. (2014). Genome sequence of mungbean and insights into evolution within Vigna species. Nat. Commun. 5:5443. doi: 10.1038/ncomms6443
Kauwenbergh, V. S. J., Stewart, M., and Mikkelsen, R. (2013). World reserves of phosphate rock…a dynamic and unfolding story. Better Crops 97, 18–20.
Kujur, A., Bajaj, D., Saxena, M. S., Tripathi, S., Upadhyaya, H. D., Gowda, et al. (2013). Functionally relevant microsatellite markers from chickpea transcription factor genes for efficient genotyping applications and trait association mapping. DNA Res. 20, 355–374. doi: 10.1093/dnares/dst015
Kujur, A., Bajaj, D., Upadhyaya, H. D., Das, S., Ranjan, R., Shree, T., et al. (2015). Employing genome-wide SNP discovery and genotyping strategy to extrapolate the natural allelic diversity and domestication patterns in chickpea. Front. Plant Sci. 6:162. doi: 10.3389/fpls.2015.00162
Kuo, H. F., Hsu, Y. Y., Lin, W. C., Chen, K. Y., Munnik, T., Brearley, C. A., et al. (2018). Arabidopsis inositol phosphate kinases IPK 1 and ITPK 1 constitute a metabolic pathway in maintaining phosphate homeostasis. Plant J. 95, 613–630. doi: 10.1111/tpj.13974
Lambers, H., Shane, M. W., Cramer, M. D., Pearse, S. J., and Veneklaas, E. J. (2006). Root structure and functioning for efficient acquisition of phosphorus: matching morphological and physiological traits. Ann. Bot. 98, 693–713. doi: 10.1093/aob/mcl114
Langmead, B., and Salzberg, S. L. (2012). Fast gapped-read alignment with Bowtie 2. Nat. Methods 9:357. doi: 10.1038/nmeth.1923
Li, L., Li, H., Li, J., Xu, S., Yang, X., Li, S., et al. (2010). A genome-wide survey of maize lipid-related genes: candidate genes mining, digital gene expression profiling and co-location with QTL for maize kernel oil. China Life Sci. 53, 690–700. doi: 10.1007/s11427-010-4007-3
Li, W., and Schmidt, W. (2010). A lysine 63 linked ubiquitin chain forming conjugase, UBC13, promotes the developmental responses to iron deficiency in Arabidopsis roots. Plant J. 62, 330–343. doi: 10.1111/j.1365-313X.2010.04150.x
Li, Y. D., Wang, Y. J., Tong, Y. P., Gao, J. G., Zhang, J. S., and Chen, S. Y. (2005). QTL mapping of phosphorus deficiency tolerance in soybean (Glycine max L. Merr.). Euphytica 142, 137–142. doi: 10.1007/s10681-005-1192-4
Li, Z. X., Gao, Q., Liu, Y. Z., He, C. M., Zhang, X. R., and Zhang, J. R. (2011). Overexpression of transcription factor ZmPTF1 improves low phosphate tolerance of maize by regulating carbon metabolism and root growth. Planta 233, 1129–1143. doi: 10.1007/s00425-011-1368-1
Liang, Q., Cheng, X., Mei, M., Yan, X., and Liao, H. (2010). QTL analysis of root traits as related to phosphorus efficiency in soybean. Ann. Bot. 106, 223–234. doi: 10.1093/aob/mcq097
Lin, W. Y., Lin, S. I, and Chiou, T. J. (2009). Molecular regulators of phosphate homeostasis in plants. J. Exp. Bot. 60, 1427–1438. doi: 10.1093/jxb/ern303
Liu, K., and Muse, S. V. (2005). PowerMarker: an integrated analysis environment for genetic marker analysis. Bioinformatics 21, 2128–2129. doi: 10.1093/bioinformatics/bti282
Liu, L., Li, Y., Li, S., Hu, N., He, Y., Pong, R., et al. (2012). Comparison of next-generation sequencing systems. Biomed. Res. Int. 2012:251364. doi: 10.1155/2012/251364
Liu, Y., Wang, L., Deng, M., Li, Z., Lu, Y., Wang, J., et al. (2015). Genome-wide association study of phosphorus-deficiency-tolerance traits in Aegilops tauschii. Theor. Appl. Genet. 128, 2203–2212. doi: 10.1007/s00122-015-2578-x
Lü, H., Yang, Y., Li, H., Liu, Q., Zhang, J., Yin, J., et al. (2018). Genome-wide association studies of photosynthetic traits related to phosphorus efficiency in soybean. Front. Plant Sci. 9:1226. doi: 10.3389/fpls.2018.01226
Luo, N., Li, X., Chen, A. Y., Zhang, L. J., Zhao, H. M., Xiang, L., et al. (2017). Does arbuscular mycorrhizal fungus affect cadmium uptake and chemical forms in rice at different growth stages? Sci. Total Environ. 599, 1564–1572. doi: 10.1016/j.scitotenv.2017.05.047
Lynch, J. (1995). Root architecture and plant productivity. Plant Physiol. 109:7. doi: 10.1104/pp.109.1.7
Lynch, J. P. (2011). Root phenes for enhanced soil exploration and phosphorus acquisition: tools for future crops. Plant Physiol. 156, 1041–1049. doi: 10.1104/pp.111.17541
Mahender, A., Anandan, A., Pradhan, S. K., and Singh, O. N. (2018). Traits-related QTLs and genes and their potential applications in rice improvement under low phosphorus condition. Arch. Agron. Soil Sci. 64, 449–464. doi: 10.1080/03650340.2017.1373764
Manschadi, A. M., Kaul, H. P., Vollmann, J., Eitzinger, J., and Wenzel, W. (2014). Developing phosphorus-efficient crop varieties—an interdisciplinary research framework. Field Crops Res. 162, 87–98. doi: 10.1016/j.fcr.2013.12.016
Maruyama, T., and Fuerst, P. A. (1985). Population bottlenecks and nonequilibrium models in population genetics. II. Number of alleles in a small population that was formed by a recent bottleneck. Genetics 111, 675–689.
Maxted, N., Mabuza-Dlamini, P., Moss, H., Padulosi, S., Jarvis, A., and Guarino, L. (2004). African Vigna: an Ecographic Study. Rome: IPGRI.
Menzies, N., and Lucia, S. (2009). The science of phosphorus nutrition: forms in the soil, plant uptake, and plant response. Science 18. Available online at: https://grdc.com.au/
Mollier, A., and Pellerin, S. (1999). Maize root system growth and development as influenced by phosphorus deficiency. J. Exp. Bot. 50, 487–497. doi: 10.1093/jxb/50.333.487
Mubarak, A. E. (2005). Nutritional composition and antinutritional factors of mungbean seeds (Phaseolus aureus) as affected by some home traditional processes. J. Food Chem. 89, 489–495. doi: 10.1016/j.foodchem.2004.01.007
Nair, R. M., Pandey, A. K., War, A. R., Rao, B. H., Shwe, T., Alam, A., et al. (2019). Biotic and abiotic constraints in mungbean production—progress in genetic improvement. Front. Plant Sci. 10:1340. doi: 10.3389/fpls.2019.01340
Nakamura, Y., Koizumi, R., Shui, G. H., Shimojima, M., Wenk, M. R., Ito, T., et al. (2009). Arabidopsis lipins mediate eukaryotic pathway of lipid metabolism and cope critically with phosphate starvation. Proc. Natl. Acad. Sci. U.S.A. 106, 20978–20983. doi: 10.1073/pnas.0907173106
Nielsen, K. L., Eshel, A., and Lynch, J. P. (2001). The effect of phosphorus availability on the carbon economy of contrasting common bean (Phaseolus vulgaris L.) genotypes. J. Exp. Bot. 52, 329–339. doi: 10.1093/jexbot/52.355.329
Ning, L., Kan, G., Du, W., Guo, S., Wang, Q., Zhang, G., et al. (2016). Association analysis for detecting significant single nucleotide polymorphisms for phosphorus-deficiency tolerance at the seedling stage in soybean [Glycine max (L) Merr.]. Breed. Sci. 66, 191–203. doi: 10.1270/jsbbs.66.191
Noble, T. J., Tao, Y., Mace, E. S., Williams, B., Jordan, D. R., Douglas, C. A., et al. (2018). Characterization of linkage disequilibrium and population structure in a mungbean diversity panel. Front. Plant Sci. 8:2102. doi: 10.3389/fpls.2017.02102
Ochoa, I. E., Blair, M. W., and Lynch, J. P. (2006). QTL analysis of adventitious root formation in common bean under contrasting phosphorus availability. Crop Sci. 46, 1609–1621. doi: 10.2135/cropsci2005.12-0446
Pandey, R. (2015). “Mineral nutrition of plants,” in Plant Biology and Biotechnology, eds B. Bahadur, R. M. Venkat, L. Sahijram, and K. Krishnamurthy (New Delhi: Springer), 499–538. doi: 10.1007/978-81-322-2286-6-20
Pandey, R., Meena, S. K., Krishnapriya, V., Ahmad, A., and Kishora, N. (2014). Root carboxylate exudation capacity under phosphorus stress does not improve grain yield in green gram. Plant Cell Rep. 33, 919–928. doi: 10.1007/s00299-014-1570-2
Pandey, V., and Shukla, A. (2015). Acclimation and tolerance strategies of rice under drought stress. Rice Sci. 22, 147–161. doi: 10.1016/j.rsci.2015.04.001
Patil, G., Do, T., Vuong, T. D., Valliyodan, B., Lee, J. D., Chaudhary, J., et al. (2016). Genomic-assisted haplotype analysis and the development of high-throughput SNP markers for salinity tolerance in soybean. ?Sci. Rep. 6, 1–13. doi: 10.1038/srep19199
Peret, B., Clement, M., Nussaume, L., and Desnos, T. (2011). Root developmental adaptation to phosphate starvation: better safe than sorry. Trends Plant Sci. 16, 442–450. doi: 10.1016/j.tplants.2011.05.006
Perez-Torres, C. A., Lopez-Bucio, J., Cruz-Ramirez, A., Ibarra-Laclette, E., Dharmasiri, S., Estelle, M., et al. (2008). Phosphate availability alters lateral root development in Arabidopsis by modulating auxin sensitivity via a mechanism involving the TIR1 auxin receptor. Plant Cell 20, 3258–3272. doi: 10.1105/tpc.108.058719
Piepho, H. P., and Möhring, J. (2007). Computing heritability and selection response from unbalanced plant breeding trials. Genetics 177, 1881–1888. doi: 10.1534/genetics.107.074229
Poland, J. A., and Rife, T. W. (2012). Genotyping-by-sequencing for plant breeding and genetics. Plant Genome 5, 92–102. doi: 10.3835/plantgenome2012.05.0005
Postma, J. A., and Lynch, J. P. (2011). Root cortical aerenchyma enhances the growth of maize on soils with suboptimal availability of nitrogen, phosphorus and potassium. Plant Physiol. 156, 1190–1201. doi: 10.1104/pp.111.175489
Rajkumar, S., and Ibrahim, S. M. (2014). In vitro hydroponic studies on root characters for drought resistance assessment in rice. J. Agric. Environ. Sci. 14, 396–400.
Ramaekers, L., Remans, R., Rao, I. M., Blair, M. W., and Vanderleyden, J. (2010). Strategies for improving phosphorus acquisition efficiency of crop plants. Field Crops Res. 117, 169–176. doi: 10.1016/j.fcr.2010.03.001
Ravelombola, W., Qin, J., Shi, A., Lu, W., Weng, Y., Xiong, H., et al. (2017). Association mapping revealed SNP markers for adaptation to low phosphorus conditions and rock phosphate response in USDA cowpea (Vigna unguiculata (L.) Walp.) germplasm. Euphytica 213:183. doi: 10.1007/s10681-017-1971-8
Reddy, V. R. P., Aski, M. S., Mishra, G. P., Dikshit, H. K., Singh, A., Pandey, R., et al. (2020). Genetic variation for root architectural traits in response to phosphorus deficiency in mungbean at the seedling stage. PLoS One 15:e0221008. doi: 10.1371/journal.pone.0221008
Rengel, Z., and Marschner, P. (2005). Nutrient availability and management in the rhizosphere: exploiting genotypic differences. New Phytol. 168, 305–312. doi: 10.1111/j.1469-8137.2005.01558.x
Saxena, M. S., Bajaj, D., Kujur, A., Das, S., Badoni, S., Kumar, V., et al. (2014). Natural allelic diversity, genetic structure and linkage disequilibrium pattern in wild chickpea. PLoS One 9:e107484. doi: 10.1371/journal.pone.0107484
Singh, V. K., and Jain, M. (2015). Genome-wide survey and comprehensive expression profiling of Aux/IAA gene family in chickpea and soybean. Front. Plant Sci. 6:918. doi: 10.3389/fpls.2015.00918
Singh, V. K., Rajkumar, M. S., Garg, R., and Jain, M. (2017). Genome-wide identification and co-expression network analysis provide insights into the roles of auxin response factor gene family in chickpea. Sci. Rep. 7:10895. doi: 10.1038/s41598-017-11327-5
Sivasakthi, K., Tharanya, M., Kholova, J., Muriuki, R. W., Thirunalasundari, T., and Vadez, V. (2017). Chickpea genotypes contrasting for vigor and canopy conductance also differ in their dependence on different water transport pathways. Front. Plant Sci. 8:1663. doi: 10.3389/fpls.2017.01663
Sonah, H., O’Donoughue, L., Cober, E., Rajcan, I., and Belzile, F. (2015). Identification of loci governing eight agronomic traits using a GBS-GWAS approach and validation by QTL mapping in soya bean. Plant Biotechnol. J. 13, 211–221. doi: 10.1111/pbi.12249
Song, H., Yin, Z., Chao, M., Ning, L., Zhang, D., and Yu, D. (2014). Functional properties and expression quantitative trait loci for phosphate transporter GmPT1 in soybean. Plant Cell Environ. 37, 462–472. doi: 10.1111/pce.12170
Su, J. Y., Zheng, Q., Li, H. W., Li, B., Jing, R. L., Tong, Y. P., et al. (2009). Detection of QTLs for phosphorus use efficiency in relation to agronomic performance of wheat grown under phosphorus sufficient and limited conditions. Plant Sci. 176, 824–836. doi: 10.1016/j.plantsci.2009.03.006
Takahashi, Y., Somta, P., Muto, C., Iseki, K., Naito, K., Pandiyan, M., et al. (2016). Novel genetic resources in the genus vigna unveiled from gene bank accessions. PLoS One 11:e0147568. doi: 10.1371/journal.pone.0147568
Tamura, K., Stecher, G., Peterson, D., Filipski, A., and Kumar, S. (2013). MEGA6: molecular evolutionary genetics analysis version 6.0. Mol. Biol. Evol. 30, 2725–2729. doi: 10.1093/molbev/mst197
Terakami, S., Nishitani, C., and Yamamoto, T. (2011). Development of SNP markers for marker-assisted selection in pear. Acta Horticult. 976, 463–469. doi: 10.17660/ActaHortic.2013.976.65
Tomooka, N., Kaga, A., Isemura, T., and Vaughan, D. A. (2011). “Vigna,” in Wild crop relatives: Genomic and Breeding Resources Legume Crops and Forages, ed. K. Chittaranjan (New York, NY: Springer), 291–311. doi: 10.1007/978-3-642-14387-815
Tomooka, N., Lairungruang, C., Nakeeraks, P., Egawa, Y., and Thavarasook, C. (1992). Development of bruchid-resistant mungbean using wild mungbean germplasm in Thailand. Plant Breed. 109, 60–66. doi: 10.1111/j.1439-0523.1992.tb00151.x
Tomooka, N., Vaughan, D. A., Maxted, N., and Moss, H. (2002). The Asian Vigna: Genus Vigna Subgenus Ceratotropis Genetic Resources. Dordrecht: Kluwer Academic Press.
Trull, M. C., Guiltinan, M. J., Lynch, J. P., and Deikman, J. (1997). The responses of wild-type and ABA mutant Arabidopsis thaliana plants to phosphorus starvation. Plant Cell Environ. 20, 85–92. doi: 10.1046/j.1365-3040.1997.d01-4.x
Uitdewilligen, J. G. M. L., Wolters, A. M. A., D’hoop, B. B., Borm, T. J. A., Visser, R. G. F., and van Eck, H. J. (2013). A next-generation sequencing method for genotyping-by-sequencing of highly heterozygous autotetraploid potato. PLoS One 8:e62355. doi: 10.1371/journal.pone.0062355
Upadhyaya, H. D., Bajaj, D., Das, S., Kumar, V., Gowda, C. L. L., Sharma, S., et al. (2016). Genetic dissection of seed-iron and zinc concentrations in chickpea. Sci. Rep. 6, 1–12. doi: 10.1038/srep24050
Upadhyaya, H. D., Bajaj, D., Srivastava, R., Daware, A., Basu, U., Tripathi, S., et al. (2017). Genetic dissection of plant growth habit in chickpea. Funct. Integr. Genomics 17, 711–723. doi: 10.1007/s10142-017-0566-8
Varshney, R. K., Thudi, M., Roorkiwal, M., Weiming, He, Upadhyaya, H. D., Yang, W., et al. (2019). Resequencing of 429 chickpea accessions from 45 countries provides insights into genome diversity, domestication and agronomic traits. Nat. Genet. 51, 857–864. doi: 10.1038/s41588-019-0401-3
Vinod, K. K., and Heuer, S. (2012). Approaches towards nitrogen-and phosphorus-efficient rice. AoB Plants 2012:pls028. doi: 10.1093/aobpla/pls028
Wang, Q. J., Yuan, Y., Liao, Z., Jiang, Y., Wang, Q., Zhang, L., et al. (2019). Genome-wide association study of 13 traits in maize seedlings under low phosphorus stress. Plant Genome 12, 1–13. doi: 10.3835/plantgenome2019.06.0039
Wang, X., Chen, Y., Thomas, C. L., Ding, G., Xu, P., Shi, D., et al. (2017). Genetic variants associated with the root system architecture of oilseed rape (Brassica napus L.) under contrasting phosphate supply. DNA Res. 24, 407–417. doi: 10.1093/dnares/dsx013
Wiel, C. C. M., Van der Linden, C. G., and Scholten, O. E. (2016). Improving phosphorus use efficiency in agriculture: opportunities for breeding. Euphytica 207, 1–22. doi: 10.1007/s10681-015-1572-3
Wissuwa, M., Kondo, K., Fukuda, T., Mori, A., Rose, M. T., Pariasca-Tanaka, J., et al. (2015). Unmasking novel loci for internal phosphorus utilization efficiency in rice germplasm through genome-wide association analysis. PloS One 10:e0124215. doi: 10.1371/journal.pone.0124215
Xu, C., Zhang, H., Sun, J., Guo, Z., Zou, C., Li, W., et al. (2018). Genome-wide association study dissects yield components associated with low-phosphorus stress tolerance in maize. Theor. Appl. Genet. 131, 1699–1714. doi: 10.1007/s00122-018-3108-4
Yan, X., Liao, H., Beebe, S. E., Blair, M. W., and Lynch, J. P. (2004). QTL mapping of root hair and acid exudation traits and their relationship to phosphorus uptake in common bean. Plant Soil 265, 17–29. doi: 10.1007/s11104-005-0693-1
Yuan, Y., Gao, M., Zhang, M., Zheng, H., Zhou, X., Guo, Y., et al. (2017). QTL mapping for phosphorus efficiency and morphological traits at seedling and maturity stages in wheat. Front. Plant Sci. 8:614. doi: 10.3389/fpls.2017.00614
Zhang, D., Zhang, H., Chu, S., Li, H., Chi, Y., Triebwasser-Freese, D., et al. (2017). Integrating QTL mapping and transcriptomics identifies candidate genes underlying QTLs associated with soybean tolerance to low-phosphorus stress. Plant Mol. Biol. 93, 137–150. doi: 10.1007/s11103-016-0552-x
Zhang, M., Wu, F., Shi, J., Zhu, Y., Zhu, Z., Gong, Q., et al. (2013). ROOT HAIR DEFECTIVE3 family of dynamin-like GTPases mediates homotypic endoplasmic reticulum fusion and is essential for Arabidopsis development. Plant Physiol. 163, 713–720. doi: 10.1104/pp.113.224501
Zhao, C., Craig, J. C., Petzold, H. E., Dickerman, A. W., and Beers, E. P. (2005). The xylem and phloem transcriptomes from secondary tissues of the Arabidopsis root-hypocotyl. Plant Physiol. 138, 803–818. doi: 10.1104/pp.105.060202
Zhou, Z., Jiang, Y., Wang, Z., Zhiheng, G., Jun, L., Li, W., et al. (2015). Resequencing 302 wild and cultivated accessions identifies genes related to domestication and improvement in soybean. Nat. Biotechnol. 33, 408–414. doi: 10.1038/nbt.3096
Zhu, J., Kaeppler, S. M., and Lynch, J. P. (2005). Mapping of QTLs for lateral root branching and length in maize (Zea mays L.) under differential phosphorus supply. Theor. Appl. Genet. 111, 688–695. doi: 10.1007/s00122-005-2051-3
Keywords: mungbean, PUE traits, GBS, GWAS, candidate genes
Citation: Reddy VRP, Das S, Dikshit HK, Mishra GP, Aski M, Meena SK, Singh A, Pandey R, Singh MP, Tripathi K, Gore PG, Priti, Bhagat TK, Kumar S, Nair R and Sharma TR (2020) Genome-Wide Association Analysis for Phosphorus Use Efficiency Traits in Mungbean (Vigna radiata L. Wilczek) Using Genotyping by Sequencing Approach. Front. Plant Sci. 11:537766. doi: 10.3389/fpls.2020.537766
Received: 25 February 2020; Accepted: 18 September 2020;
Published: 29 October 2020.
Edited by:
Anna Maria Mastrangelo, Council for Agricultural Research and Economics (CREA), ItalyReviewed by:
Prakit Somta, Kasetsart University, ThailandSenthil Natesan, Tamil Nadu Agricultural University, India
Manish Kumar Pandey, International Crops Research Institute for the Semi-Arid Tropics (ICRISAT), India
Copyright © 2020 Reddy, Das, Dikshit, Mishra, Aski, Meena, Singh, Pandey, Singh, Tripathi, Gore, Priti, Bhagat, Kumar, Nair and Sharma. This is an open-access article distributed under the terms of the Creative Commons Attribution License (CC BY). The use, distribution or reproduction in other forums is permitted, provided the original author(s) and the copyright owner(s) are credited and that the original publication in this journal is cited, in accordance with accepted academic practice. No use, distribution or reproduction is permitted which does not comply with these terms.
*Correspondence: Harsh Kumar Dikshit, harshgeneticsiari@gmail.com