 Zhengfu Zhou1,2†
 Ziwei Zhang1,2,3†
 Lihua Jia3†Hongxia Qiu1,2Huiyue Guan1,2Congcong Liu1,3Maomao Qin1Yahuan Wang1Wenxu Li1
 Wen Yao3Zhengqing Wu1,2*Baoming Tian2*Zhensheng Lei1,2,3*
- 1Henan Institute of Crop Molecular Breeding, Henan Academy of Agricultural Sciences, Zhengzhou, China
- 2Agronomy College, Zhengzhou University, Zhengzhou, China
- 3National Key Laboratory of Wheat and Maize Crop Science, Henan Agricultural University, Zhengzhou, China
Bread wheat is one of the most important crops worldwide, supplying approximately one-fifth of the daily protein and the calories for human consumption. Gluten aggregation properties play important roles in determining the processing quality of wheat (Triticum aestivum L.) products. Nevertheless, the genetic basis of gluten aggregation properties has not been reported so far. In this study, a recombinant inbred line (RIL) population derived from the cross between Luozhen No. 1 and Zhengyumai 9987 was used to identify quantitative trait loci (QTL) underlying gluten aggregation properties with GlutoPeak parameters. A linkage map was constructed based on 8,518 SNPs genotyped by specific length amplified fragment sequencing (SLAF-seq). A total of 33 additive QTLs on 14 chromosomes were detected by genome-wide composite interval mapping (GCIM), four of which accounted for more than 10% of the phenotypic variation across three environments. Two major QTL clusters were identified on chromosomes 1DS and 1DL. A premature termination of codon (PTC) mutation in the candidate gene (TraesCS1D02G009900) of the QTL cluster on 1DS was detected between Luozhen No. 1 and Zhengyumai 9987, which might be responsible for the difference in gluten aggregation properties between the two varieties. Subsequently, two KASP markers were designed based on SNPs in stringent linkage with the two major QTL clusters. Results of this study provide new insights into the genetic architecture of gluten aggregation properties in wheat, which are helpful for future improvement of the processing quality in wheat breeding.
Introduction
Common wheat is one of the most important crops worldwide, which provides one-fifth of the calories consumed by humans (Dubcovsky and Dvorak, 2007). As the main components of wheat endosperm, proteins play important roles in determining the processing quality of wheat. The functional properties of wheat are largely determined by the composition of gluten proteins and the interactions between different gluten proteins upon addition of water when forming a dough (Shewry and Tatham, 1997; Sliwinski et al., 2004a,b). Gluten proteins consist of glutenin and gliadin, and are responsible for the rheological properties of dough. Glutenin is divided into high- and low-molecular weight glutenin subunits (HMW-GSs and LMW-GSs), encoded by Glu-1 and Glu-3 loci on chromosomes 1A, 1B, and 1D, respectively (Payne, 1987). The role of HMW-GSs on dough strength has been well studied (Ram, 2003; Edwards et al., 2007; Zhang et al., 2007), whereas there has been a lack of studies on the regulation of grain quality by LMW-GSs, although LMW-GSs were reported to play significant roles on dough viscosity and formation of large polymers (Cornish et al., 2001). Gliadin is a significant agent regulating viscoelastic properties of gluten (Xu et al., 2007). It is generally agreed that subunits or alleles Glu-A1a, Glu-B1b, Glu-D1d, Glu-A3b, Glu-A3d, Glu-B3d, Glu-B3g, GliB1b, GliA2b, and GliB2c confer superior dough rheological properties (Metakovsky et al., 1997; He et al., 2005; Liu et al., 2005; Liang et al., 2010; Jin et al., 2013).
Flour properties are largely determined by the quality of gluten, which are usually assessed by means of classical rheological tests, such as Farinograph, Alveograph, or Extensograph analyses (Sun et al., 2010). Unfortunately, a full characteristic of wheat grain based on classical tests are time and labor consuming (Marti et al., 2015a). Recently, a new device, GlutoPeak, was introduced to assess gluten aggregation properties, and a rapid shear-based method was developed for discriminating the gluten quality (Rakita et al., 2018). In addition, much smaller samples are required by the new method (< 10 g). By mixing appropriate amounts of flour and solvent at a certain speed, gluten is separated by the paddle rotation, resulting in aggregation. At this point the gluten aggregate mass exerts a resistant force on the paddle resulting in the generation of a torque curve. The curve records the complexity of aggregation and breakdown of the gluten by providing peak maximum time (PMT), maximum torque (BEM), and other parameters (Wang et al., 2018). It has been shown that the parameters PMT, torque 15 s before the BEM (AM), torque 15 s after the BEM (PM) and area from the first minimum to AM (A3) of GlutoPeak were significantly correlated with the test parameters of the Farinograph, Extensograph, and Alveograph (Melnyk et al., 2012; Chandi et al., 2015; Marti et al., 2015b; Zawieja et al., 2020). By analyzing durum wheat semolina utilizing GlutoPeak and the conventional methods, Sissons (2016) found that the parameter PMT of GlutoPeak is able to separate weak and strong gluten index samples. Rakita et al. (2018) confirmed that GlutoPeak was successful in discriminating wheat varieties of good quality from those of poor quality. A systematic study was conducted by Wang et al. (2017) to elucidate the impact of water absorption (WA) and gluten strength on gluten aggregation behavior in GlutoPeak tests. These studies suggested that GlutoPeak can be used as a reliable and fast approach to evaluate the quality of wheat gluten.
Dozens of studies were reported to dissect the genetic basis of gluten quality, which were quantitative traits controlled by multiple genes (Branlard et al., 2001; He et al., 2004). Although significantly influenced by environmental variations (Peterson et al., 1992; Bao et al., 2004; Zhang et al., 2005), major QTL for gluten quality have been frequently reported (Eagles et al., 2002; Patil et al., 2009). Patil et al. (2009) identified regions on chromosomes 1A, 4A, 5B, 6A, and 7A underlying gluten quality in addition to the major QTL on chromosome 1B. Conti et al. (2011) identified 11 QTL for gluten quality located on chromosomes 1A, 1B, 3B, 4A, 4B, 6A, 6B, and 7A, explaining 4.9–54.2% of the phenotypic variation. Jin et al. (2016) reported 119 additive QTL for gluten quality on 20 wheat chromosomes, among which 11 QTL clusters were identified for Mixograph, RVA, and Mixolab parameters of gluten quality.
Nevertheless, genetic dissection of gluten quality utilizing GlutoPeak parameters has not been reported so far. The associations of GlutoPeak parameters with gluten aggregation properties and the molecular mechanisms underlying gluten aggregation properties in wheat remain unclear. In this study, we employed a recombinant inbred line (RIL) population derived from the cross between Luozhen No. 1 and Zhengyumai 9987 to dissect QTL for gluten aggregation properties evaluated by GlutoPeak parameters. A linkage map was constructed with the SLAF-seq technique, and 33 QTLs were identified for nine GlutoPeak parameters. A candidate gene for the QTL cluster on chromosome 1DS was identified; we further performed additive effect analysis and KASP marker design of the two QTL clusters. Results of this study provides new insights into the genetic mechanisms for wheat grain quality, which are helpful to future wheat breeding efforts targeting the improvement of gluten aggregation properties of wheat.
Materials and Methods
Plant Materials
The F6 generation of a RIL population consisting of 196 wheat lines was generated by crossing between Luozhen No. 1 and Zhengyumai 9987, which were used for genetic mapping and QTL discovery. A large amount of data was collected for the two varieties in previous studies of our lab, and significant differences were observed between the two varieties in Farinograph parameters, Extensograph parameters, and other quality-related parameters. The RIL population and the parents were grown under four environments, including Yuanyang 2017–2018 (E113°97′, N35°05′), Yanjin 2017–2018 (E114°20′, N35°14′), Yuanyang 2018–2019 (E113°97′, N35°05′), and Shangqiu 2018–2019 (E115°65′, N34°45′) in northern China. The average temperatures were 14.3°C, 14°C, and 14.2°C, while the average rainfalls were 556, 656, and 623 mm per year, for Yuanyang, Yanjin, and Shangqiu, respectively. An additional 39 wheat cultivars collected from Henan Province were also planted in 2018 in Yuanyang to establish the correlations between the GlutoPeak parameters and gluten parameters measured by traditional methods. Random block design was used to plant wheat accessions according to two rows of plot, three repetitions; each row has a length of 2 m and a width of 23 cm, plant spacing 10 cm. All wheat accessions were cultivated using standard agronomic practices and were harvested at physiological maturity (8–10% moisture content) under each environment to minimize variation across different environments.
Evaluation of Dough Rheological Parameters
Samples of 39 wheat accessions from Henan Province, China were milled following American Association of Cereal Chemists (AACC) approved method 26–21.02 utilizing Brabender Quadrumat Junior Mill (Brabender, Germany). The moisture and protein content test of flour was conducted based on AACC approved method 46–30.01 utilizing IM9500 (Perten, Sweden). The wet gluten content test of flour was conducted based on AACC approved method 38–12A utilizing GM2200 (Perten, Sweden). The Farinograph test of flour was conducted based on AACC approved method 54–21.02 utilizing Farinograph-E (Brabender, Germany). The Extensograph test of flour was conducted based on AACC approved method 5410 utilizing Extensograph-E (Brabender, Germany). In addition, the whole-wheat meal of 39 samples obtained utilizing LM3100 (Perten, Sweden) were tested by GlutoPeak. Each test was replicated three times, and the average values were used for further analysis.
Collection of Phenotypic Data
The whole-wheat meal was prepared utilizing LM3100 (Perten, Sweden) and stored at low temperature (4–5°C). Gluten aggregation properties of whole-wheat meal were measured by GlutoPeak (Brabender, Germany) with a high shear under four environments. The sample weight and 0.5 mol/L CaCl2 solution weight were calculated based on the moisture of the sample using the software GlutoPeak. The speed of the rotating paddle was set at 1,900 rpm, and the temperature was set at 34°C by circulating water through the jacketed sample cup (Chandi and Seetharaman, 2012). All measurements were performed twice and the average values were used for further analysis.
During the GlutoPeak test, the counter torque generated and gluten network formation upon mixing and the time required to reach peak resistance were recorded in a torque curve (Supplementary Figure 1; Fu et al., 2017). Nine parameters including peak maximum time (PMT), maximum torque (BEM), torque 15 s before the BEM (AM), torque 15 s after the BEM (PM), area from the beginning of the test to the first maximum (A1), area from the first maximum to the first minimum (A2), area from the first minimum to AM (A3), area from AM to BEM (A4), and area from BEM to PM (A5) (Amoriello et al., 2015) were collected for QTL analysis.
Statistical Analysis
Frequency distribution map was made using Origin (OriginLab, United States). Descriptive statistics analysis of the phenotypic data from each environment was conducted using the psych package of the R software. The statistical p value of normality test for each trait was performed using the Shapiro–Wilk Normality Testing in R software. Student’s t-test and analysis of variance (ANOVA) was performed using the international general SAS 9.2 (SAS Institute, United States) statistical software. Best linear unbiased predictor (BLUP) values for each sample across the four environments and broad-sense heritability of each parameter were obtained by fitting the mixed linear model using the “lme4” package of the R software (R Development Core Team, 2012). Correlation analysis between different GlutoPeak parameters was performed in the R software using the BLUP values.
Linkage Map Construction and QTL Mapping
The linkage map of the RIL population was constructed by the High Map software based on SNPs obtained utilizing the SLAF-seq technique of Biomarker Biotech Co., Ltd. QTL analysis was performed using the “QTL.gCIMapping.GUI” (Quantitative Trait Loci Genome-Wide Composite Interval Mapping with Graphical User Interface1) R software package. Significant QTL were determined by a LOD value threshold of 2.5. The software Mapchart 2.3 was used to map the position of QTL on wheat chromosomes.
Prediction of Candidate Genes
The physical positions of all significant QTL were determined by aligning sequences of flanking markers against IWGSC (International Wheat Genome Sequence Consortium) RefSeq v1.1 genome2 via BLAST. Annotations of protein-coding genes in the QTL interval were extracted from the high confidence wheat gene list provided by IWGSC. The expression profiles of candidate genes were obtained from the public database of wheat expression browser3. The heat map was drawn using TBtools. Candidate genes were predicted based on the annotation results and expression profiles of genes in the confidence interval of QTL clusters.
Molecular Cloning and Sequence Analysis of Candidate Genes
The sequences of candidate genes were obtained based on the Chinese spring (CS) genome at EnsemblPlants4. Primers were designed based on conserved sequences flanking candidate genes utilizing the Oligo 7 software and were further synthesized by Sangon Biotech Co., Ltd. The PCR products were separated by electrophoresis on 1% agarose gels, which were cleaned and cloned into the pEASY-Blunt3 vector (Beijing TransGen Biotech Co., Ltd.5). The vector was then transformed into DH5α competent E. coli cells by the heat shock method. Single clones were sequenced by Sangon Biotech Co., Ltd., and sequence analysis (alignment and assembly) was performed using the DNAMAN software6 and the GENEDOC software. According to the method used by DuPont et al. (2005), whole wheat flour was used to extract gluten, and RP-HPLC was used to determine gluten and its subunit components (González-Torralba et al., 2011).
KASP primers were designed based on the differences from the cloned sequences between the RIL parents, which were then used to screen all 196 RILs. The JoinMap software was used to map the gene onto the genetic map based on the genotypes of these marker and neighboring markers. The SNP marker and neighboring markers were evaluated by their physical order on the Chinese Spring reference genome (IWGSC RefSeq v1.12) to confirm the correct location of cloned genes.
Development of Gene-Specific KASP Markers
KASP markers were designed for the two major QTL clusters based on single-nucleotide polymorphisms. Each 10 μl of PCR mixture for the KASP genotyping procedure contained 100 ng of template DNA, 5 μl of KASP master mix, 4 mM MgCl2, and 1.4 μl of primer mixture, which comprised 46 μl of ddH2O, 30 μl of common primer (10 μM), and 12 μl of each tailed primer (10 μM). PCR cycling was performed using the following protocol: a hot start at 95°C for 15 min, 10 touchdown cycles (95°C for 20 s; touchdown at 65°C initially and decreasing by −1°C per cycle for 60 s), and 30 additional cycles of annealing (95°C for 10 s; 57°C for 60 s). Then, an extension step (each three cycles of annealing: 95°C for 10 s; 57°C for 60 s) was replicated three times to obtain the best genotyping cluster result (Rasheed et al., 2016). A final 37°C step was used to get the genotyping results. The primers were synthetized by Sangon Biotech (Shanghai, China).
Results
Correlations Between GlutoPeak Parameters and Dough Rheological Parameters
We performed correlation analysis between the GlutoPeak parameters and the dough rheological parameters utilizing the samples of 39 wheat accessions (see section “MATERIALS AND METHODS”) (Table 1; Supplementary Table 1). Almost all GlutoPeak parameters were significantly correlated with the dough rheological parameters, with correlation coefficients ranging from 0.28 to 0.91. Especially, the PMT, AM, area from the beginning of the test to the first maximum (A1) and A3 values (GlutoPeak parameters) were significantly positively correlated with the dough stabilization time (DST), dough maximum resistance to extension (Rmax), and extensigram area (EA) values (dough rheological parameters), with correlation coefficients ranging from 0.71 to 0.91.
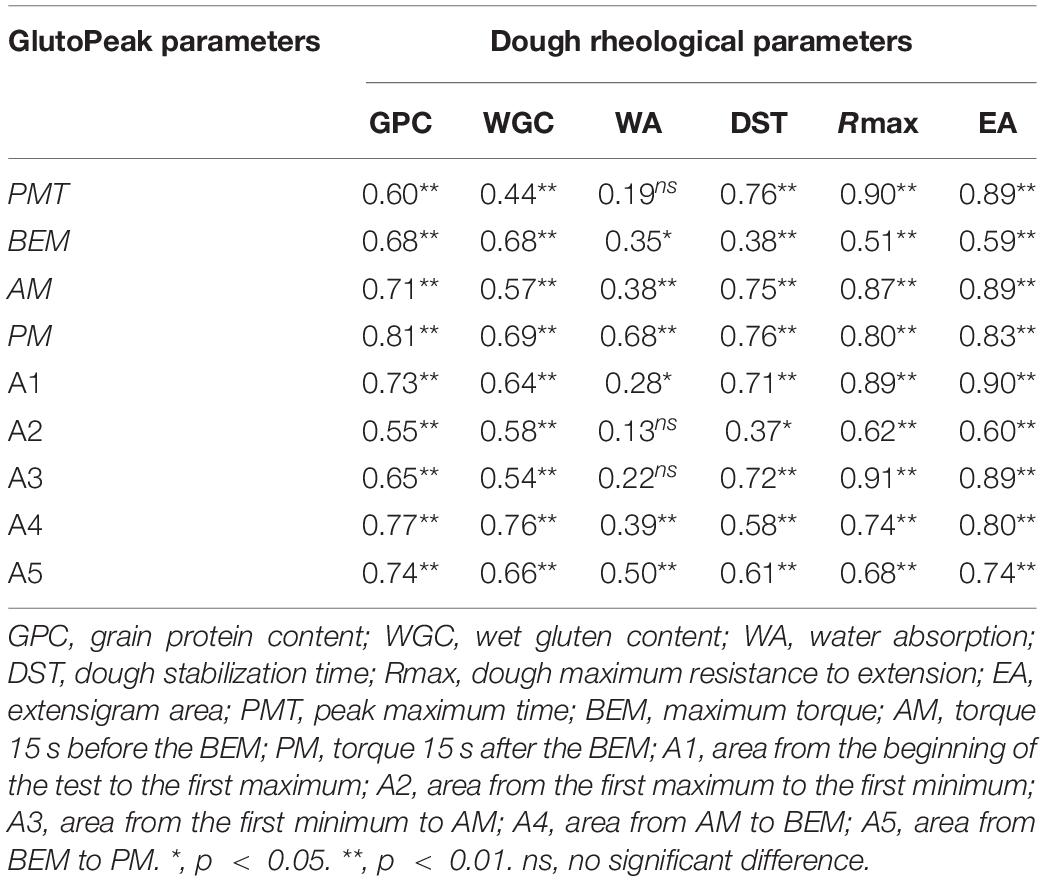
Table 1. Correlation coefficients (r) between GlutoPeak parameters of whole-wheat meal and dough rheological parameters of flour.
Based on the results of correlation analysis, the PMT, AM, A1, and A3 values of whole-wheat meal were found to be good indicators of wheat flour quality and extension parameters. These parameters can be used to establish the rheological properties of wheat flour dough, which can also be used to estimate the qualities of wheat grains measured by Farinograph and Extensograph.
Phenotypic Investigation of the RIL Population
A total of 196 recombinant inbred lines (RILs) derived from the cross between Luozhen No. 1 and Zhengyumai 9987 were evaluated for parameter values including PMT, BEM, AM, PM, A1, A2, A3, A4, and A5 using GlutoPeak under four environments (Supplementary Table 2). The value of nine GlutoPeak parameters for Luozhen No. 1 was higher than that of Zhengyumai 9987 under each environment (Supplementary Table 3). Significant differences of these parameters were observed between the two parents (Supplementary Figure 2). Most of the parameters were nearly normally distributed as shown in Figure 1 (Supplementary Table 4).
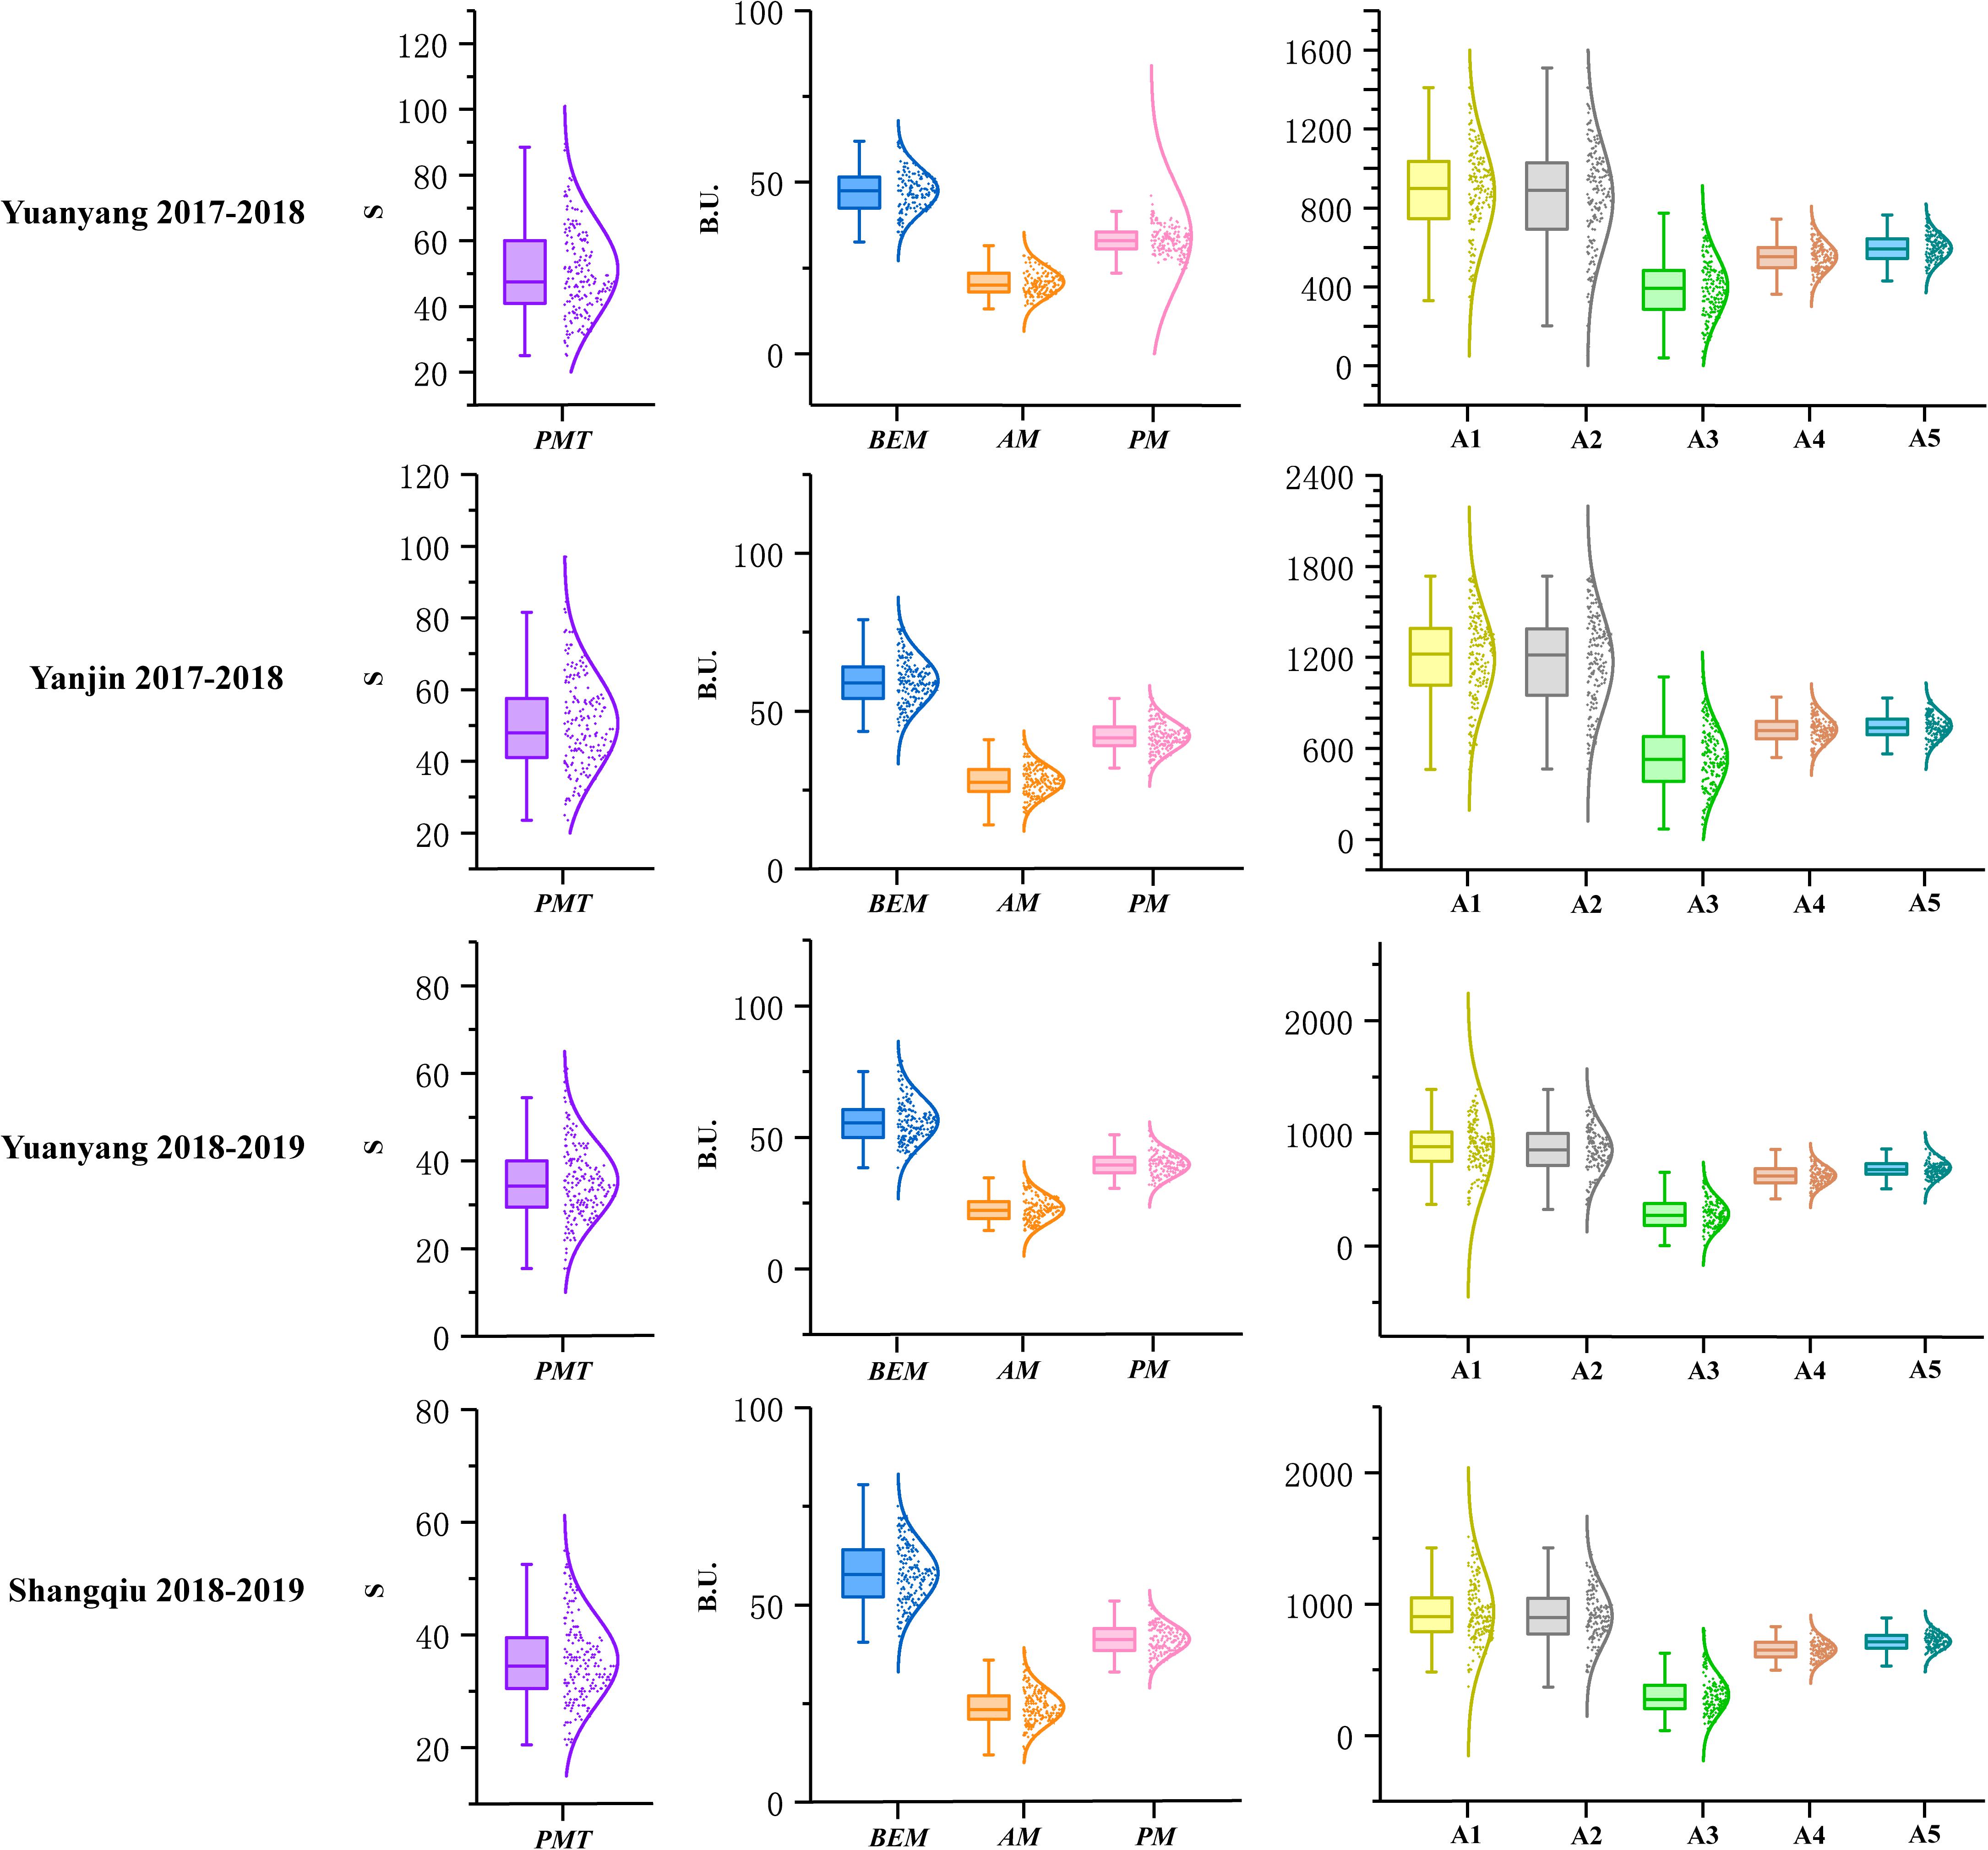
Figure 1. Distributions of the parameters tested by GlutoPeak for the recombinant inbred line (RIL) population derived from the cross between Luozhen No. 1 and Zhengyumai 9987 under four environments. See footnote of Table 1 for abbreviations. The raw data values are displayed as scatter points, while the probability density of the data is demonstrated as a smooth curve. The horizontal line inside the boxplot represents the median value, while the lower and upper borders of the box indicate the lower and upper quartile of the data value. The whiskers of the boxplot define the limits of the data values.
The contributions of variance in genotype (G), environment (E) and G × E interaction were assessed by ANOVA. Significant effects on all parameters were observed for genotype variations. For environmental variations, significant effects were observed on all parameters. The broad-sense heritability for different parameters ranged from 0.43 to 0.83 (Supplementary Table 5).
Significant positive correlations were found among PMT, AM, A1, A2, and A3 while significant negative correlations were found among PMT, BEM, PM, and A5 (Supplementary Figure 3). PMT and A3 were the most vital parameters regarding aggregation properties of gluten, which were highly positively correlated with each other (r = 0.93).
Construction of a Linkage Map for the Recombinant Inbrid Line Population
A genetic map was constructed for the RIL population, which consisted of 8,518 SNPs distributed across all 21 wheat chromosomes and covered 3,140.54 cM (see section “MATERIALS AND METHODS”) (Supplementary Table 6). The length of different chromosomes ranged from 94.33 cM (3D) to 207.17 cM (7A), with an average length of 149.55 cM. More than 98.76% of the distances between adjacent SNPs were smaller than 5 cM, while the max distance between adjacent SNPs was 17.39 cM. A total of 3,415 (40.1%), 3,854 (45.2%), and 1,249 SNPs (14.7%) were distributed in the A, B, and D genomes, representing marker densities of 0.35, 0.30, and 0.64 SNPs/cM, respectively. The number of SNP markers in each chromosome ranged from 106 (7D) to 996 (7A) (Supplementary Table 7).
QTL Analysis of GlutoPeak Parameters Using the RIL Population
A total of 33 additive QTLs were identified for nine GlutoPeak parameters using the linkage map (Supplementary Table 8). Among all QTLs, the trait-increasing allele of 14 QTLs was derived from Luozhen No. 1, while the trait-increasing allele of 19 QTLs was derived from Zhengyumai 9987. A total of 7, 8, 11, 4, 5, 4, 6, 9, and 11 QTL were identified for PMT, BEM, AM, PM, A1, A2, A3, A4, and A5, respectively. QA2.1DS.1, QA3.1DL.2, QA4.3AL, and QA5.3AS.1 explained more than 10% of the phenotypic variation of A2, A3, A4, and A5, separately. QA3.1DL.2 explained the highest phenotypic variation (20.19% to 43.50%) of all QTLs. Many QTLs detected under four environments, and the BLUP values of both environments were colocalized with each other, including QPMT.1DL.2, QA3.1DS.1, and QA3.1DL.2. (Supplementary Figure 5 and Supplementary Table 8).
QTL Clusters for GlutoPeak Parameters
Some QTLs for different GlutoPeak parameters were mapped to the same or neighboring marker intervals, probably caused by pleiotropic effects of a single gene or joint effects of tightly linked genes. The genetic positions of molecular markers were converted into physical positions of the wheat reference genome (Chinese Spring V1.1) to compare the genomic positions of different QTL. As a result, eight QTL clusters were identified on chromosomes 1DS, 1DL, 3AS, 3AL, 4AL, 4DS, 6AS, and 7DS (Table 2 and Figure 2). Two QTL clusters on chromosomes 1DS and 1DL were identified as the most prominent QTL clusters for gluten aggregation properties (Figure 3).
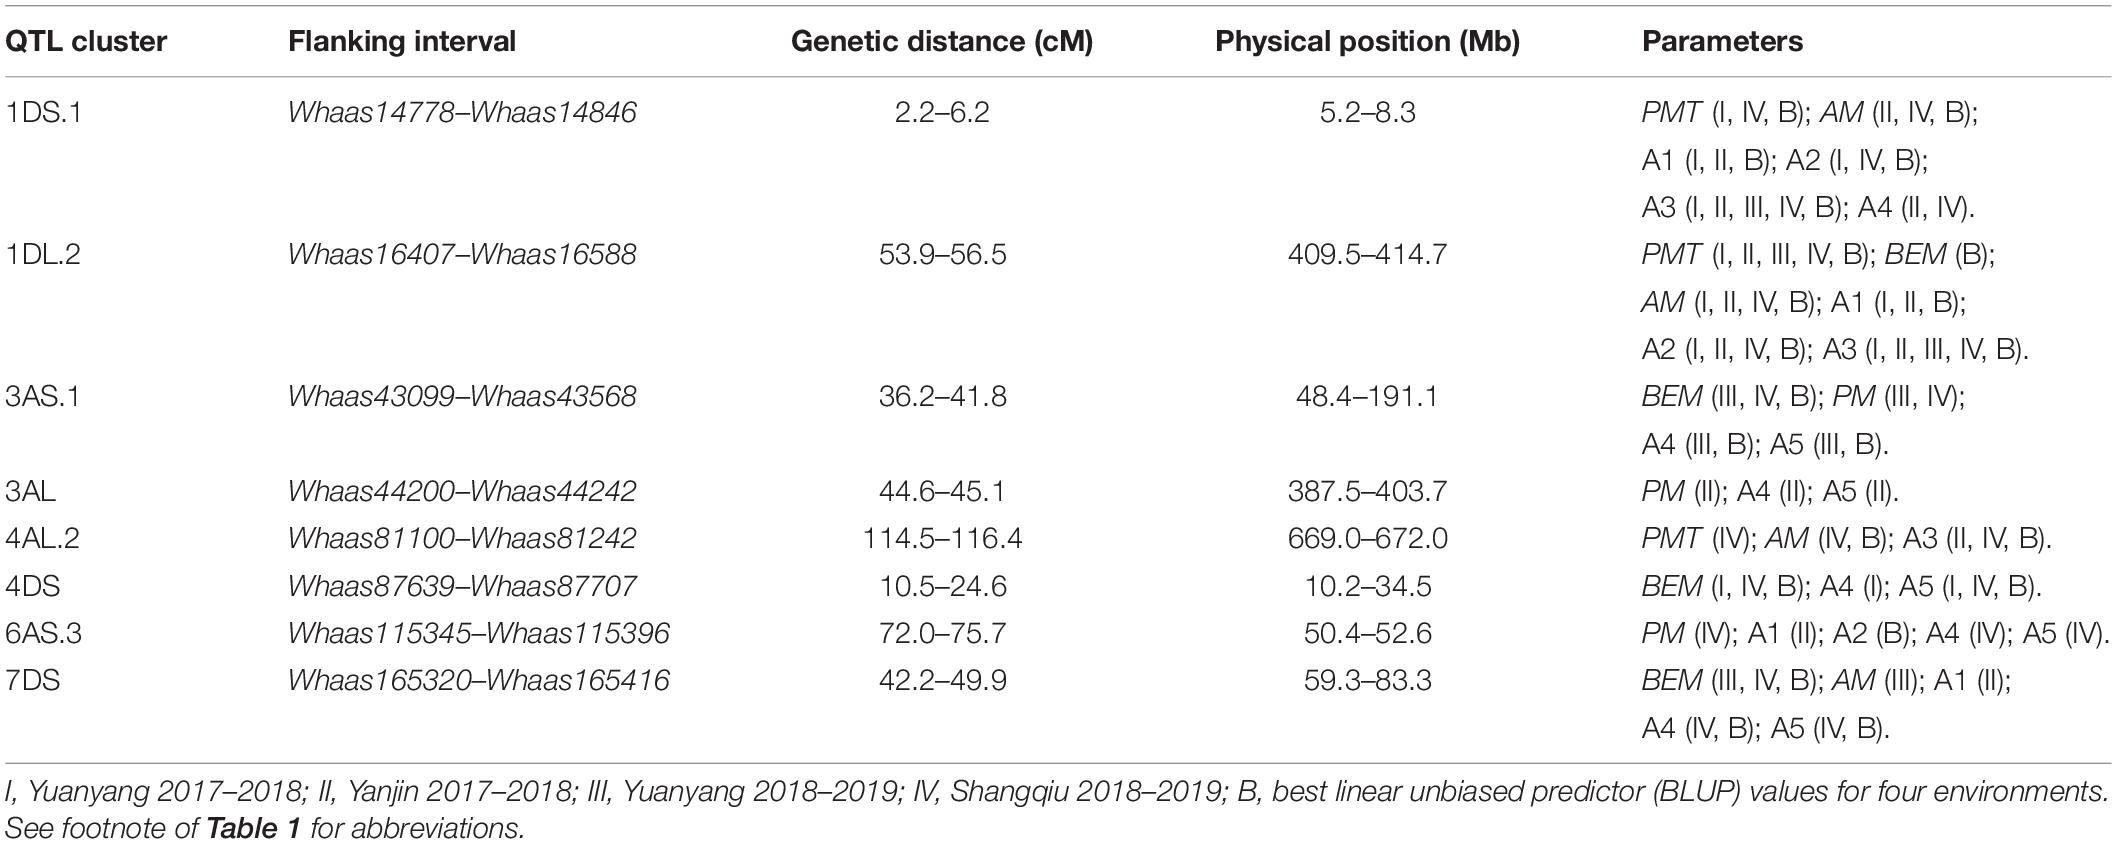
Table 2. QTL clusters detected for GlutoPeak parameters with a recombinant inbred line (RIL) population derived from the cross between Luozhen No. 1 and Zhengyumai 9987.
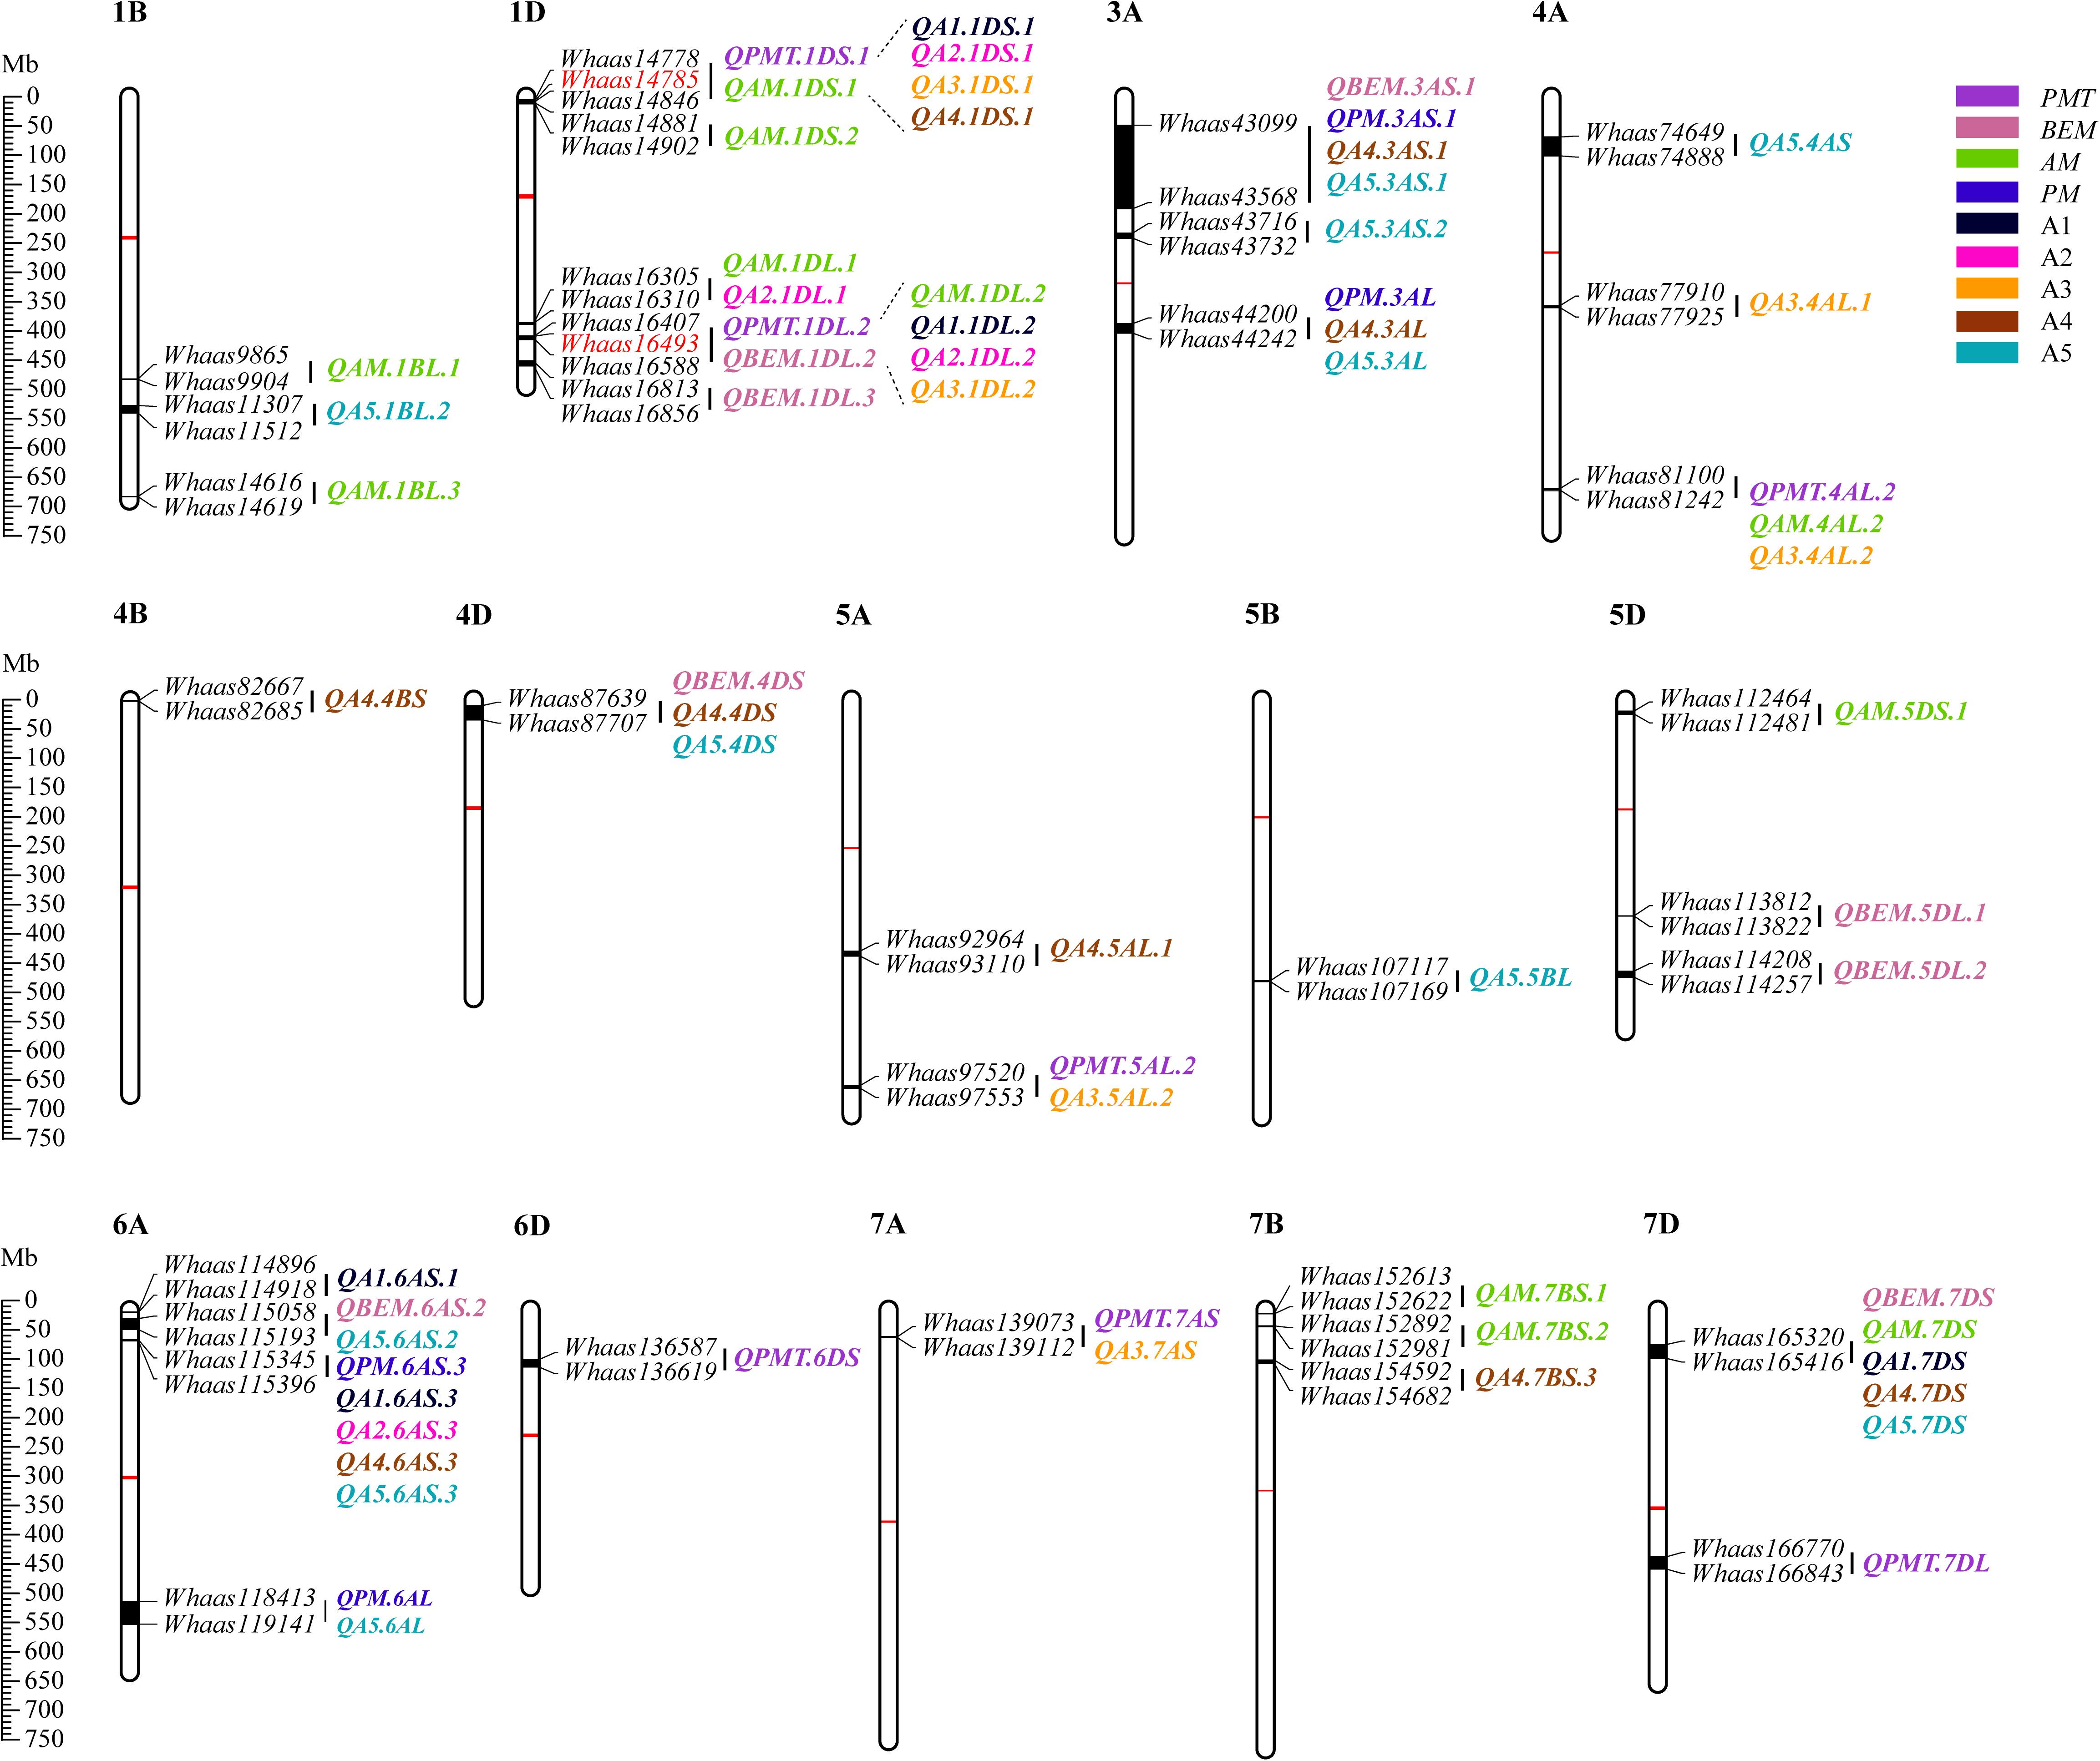
Figure 2. Physical maps and quantitative trait loci (QTL) for Glutopeak parameters identified using the Luozhen No. 1/Zhengyumai 9987 population. The centromere and the QTL intervals on each chromosome are indicated by red and black rectangles, respectively. QTL for different parameters defined in Table 1 are represented by different colors. The SNPs used for KASP marker development are marked in red color. See footnote of Table 1 for abbreviations.
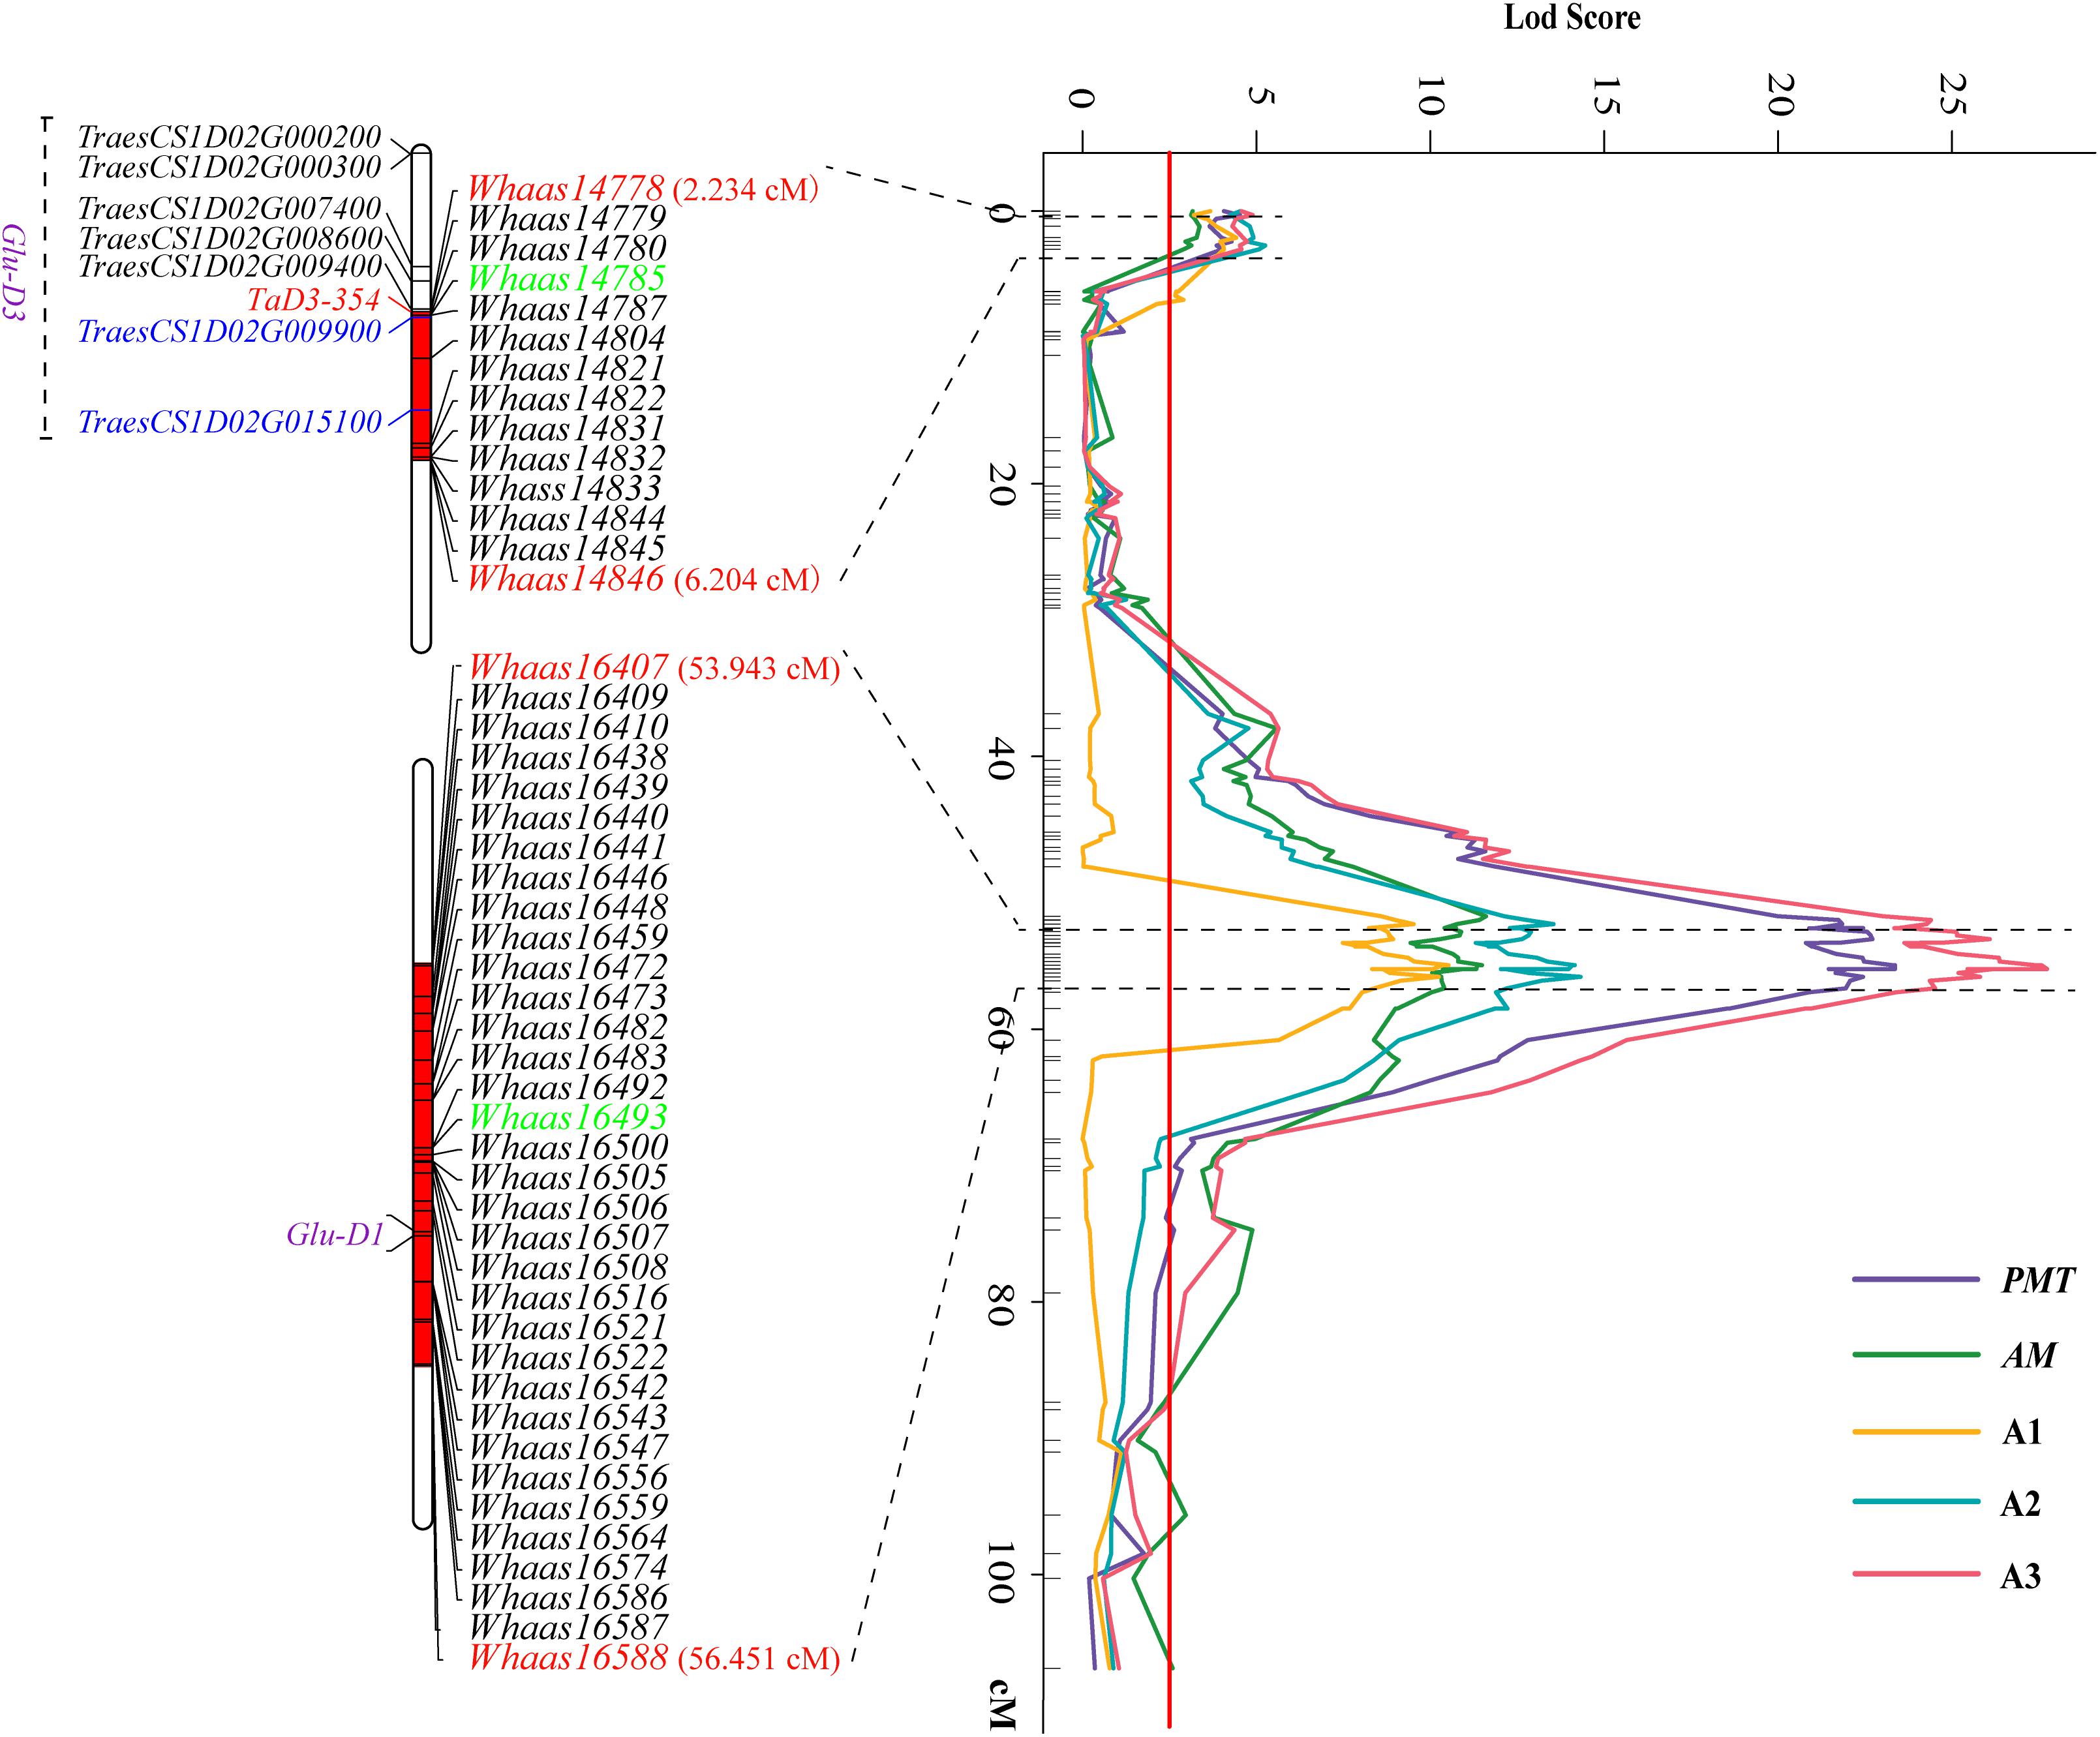
Figure 3. Two major QTL clusters on chromosome 1D underlying gluten aggregation properties. Colored lines represent the LOD score of QTL mapping using best linear unbiased predictor (BLUP) values of different parameters tested by GlutoPeak. The LOD score threshold is indicated by the red vertical line. The two QTL clusters are indicated by dashed lines. The SNPs used for KASP marker development are marked in green. See footnote of Table 1 for abbreviations.
The QTL cluster 1DS.1 was anchored between SNP markers Whaas14778 and Whaas14846, corresponding to 1D (5.2–8.3 Mb) of the Chinese Spring reference genome. The QTL cluster 1DL.2 was anchored between SNP markers Whaas16407 and Whaas16588, corresponding to 1D (408.6–414.7 Mb) of the Chinese Spring reference genome. The LOD values of the QTL clusters 1DS.1 and 1DL.2 ranged from 2.69 to 12.12 and 3.27 to 31.82, respectively. Glu-D1, the most important locus underlying gluten aggregation properties, overlapped with QTL cluster 1DL.2. We then designed a KASP marker based on SNP Whaas16493, which was located in the QTL cluster on 1DL.2 (Supplementary Table 15). The whole RIL population was genotyped using Whaas16493 and two published KASP markers for 1Dx and 1Dy subunit genes of Glu-D1 locus (Ravel et al., 2020). The KASP markers for 1Dx and 1Dy co-segregated with each other completely, whereas recombination was detected in two RILs between the KASP marker of Whaas16493 and the KASP markers of 1Dx/1Dy subunits of Glu-D1 (Supplementary Table 9). As a result, we considered Glu-D1 as the most likely candidate gene for 1DL.2. Meanwhile, Glu-D3 was found in the QTL cluster 1DS.1, which was subjected to further analysis in this study.
Prediction of Candidate Genes for the QTL Cluster on 1DS
The wheat reference genome sequence (IWGSC RefSeq v1.1) was employed to identify the candidate genes accounting for the QTL cluster on 1DS. A total of 110 high-confidence genes were in the QTL cluster on chromosome 1DS flanked by Whaas14778 and Whaas14846. Seven of the 110 genes (TraesCS1D02G009900, TraesCS1D02G011500, TraesCS1D02G012000, TraesCS1D02G 012100, TraesCS1D02G013200, TraesCS1D02G015100, and TraesCS1D02G018300) were found to be highly expressed in wheat grains based on expression data obtained from the public database of wheat expression browser3 (Supplementary Figure 5 and Supplementary Table 10). TraesCS1D02G009900 and TraesCS1D02G015100 were annotated as genes encoding LMW-GSs based on the genome annotation of the Chinese Spring reference genome (Supplementary Table 11). As a result, they were speculated as candidate genes underlying gluten aggregation properties.
Molecular Cloning and Sequence Analysis of Candidate Genes
The sequence of TraesCS1D02G009900 was obtained from Ensembl Plants7. Primers were then designed based on the conserved sequence flanking this gene in the reference genome to clone the genic sequence of TraesCS1D02G009900 in Luozhen No. 1 and Zhengyumai 9987 (Supplementary Table 12). An 897-bp sequence was amplified from Luozhen No. 1, while a 912-bp sequence was amplified from Zhengyumai 9987 (Supplementary Table 13). TraesCS1D02G009900 was identified as a typical m-type LMW-GS, containing eight cysteines in the C-terminal domain based on multiple sequence alignment. The amplified sequence from Luozhen No.1 was designated as TaD3-354. Seven m-type LMW-GS genes (TraesCS1D02G000200, TraesCS1D02G000300, TraesCS1D02G007400, TraesCS1D02G008600, TraesCS1D02 G009400, TraesCS1D02G009900, and TraesCS1D02G015100) were identified at the Glu-D3 locus of the Chinese Spring reference genome. A PTC mutation at the 234th amino acid position in the C-terminal was detected in TaD3-354 compared with the sequences in Zhengyumai 9987 and the Chinese Spring reference genome (Figure 4). The sequences in Zhengyumai 9987 were identical to the sequence of TraesCS1D02G009900 in the Chinese Spring reference genome. Moreover, a PTC mutation was identified in the repetitive domain of TraesCS1D02G008600. Then, we developed KASP molecular markers based on the SNPs between TaD3-354 and TraesCS1D02G009900 (Supplementary Table 14), which were used in genotyping the RIL population. TaD3-354 was anchored between Whaas14779∼Whaas14780 on the genetic map, within the interval of the QTL cluster on chromosome 1DS.1 (Figure 3). We further found that the contents of HMW-GSs and LMW-GSs varied between Luozhen No. 1 and Zhengyumai 9987 based on RP-HPLC analysis, indicating that the variation of gluten aggregation properties probably resulted from differentiations in LMW-GSs (Supplementary Figure 6).
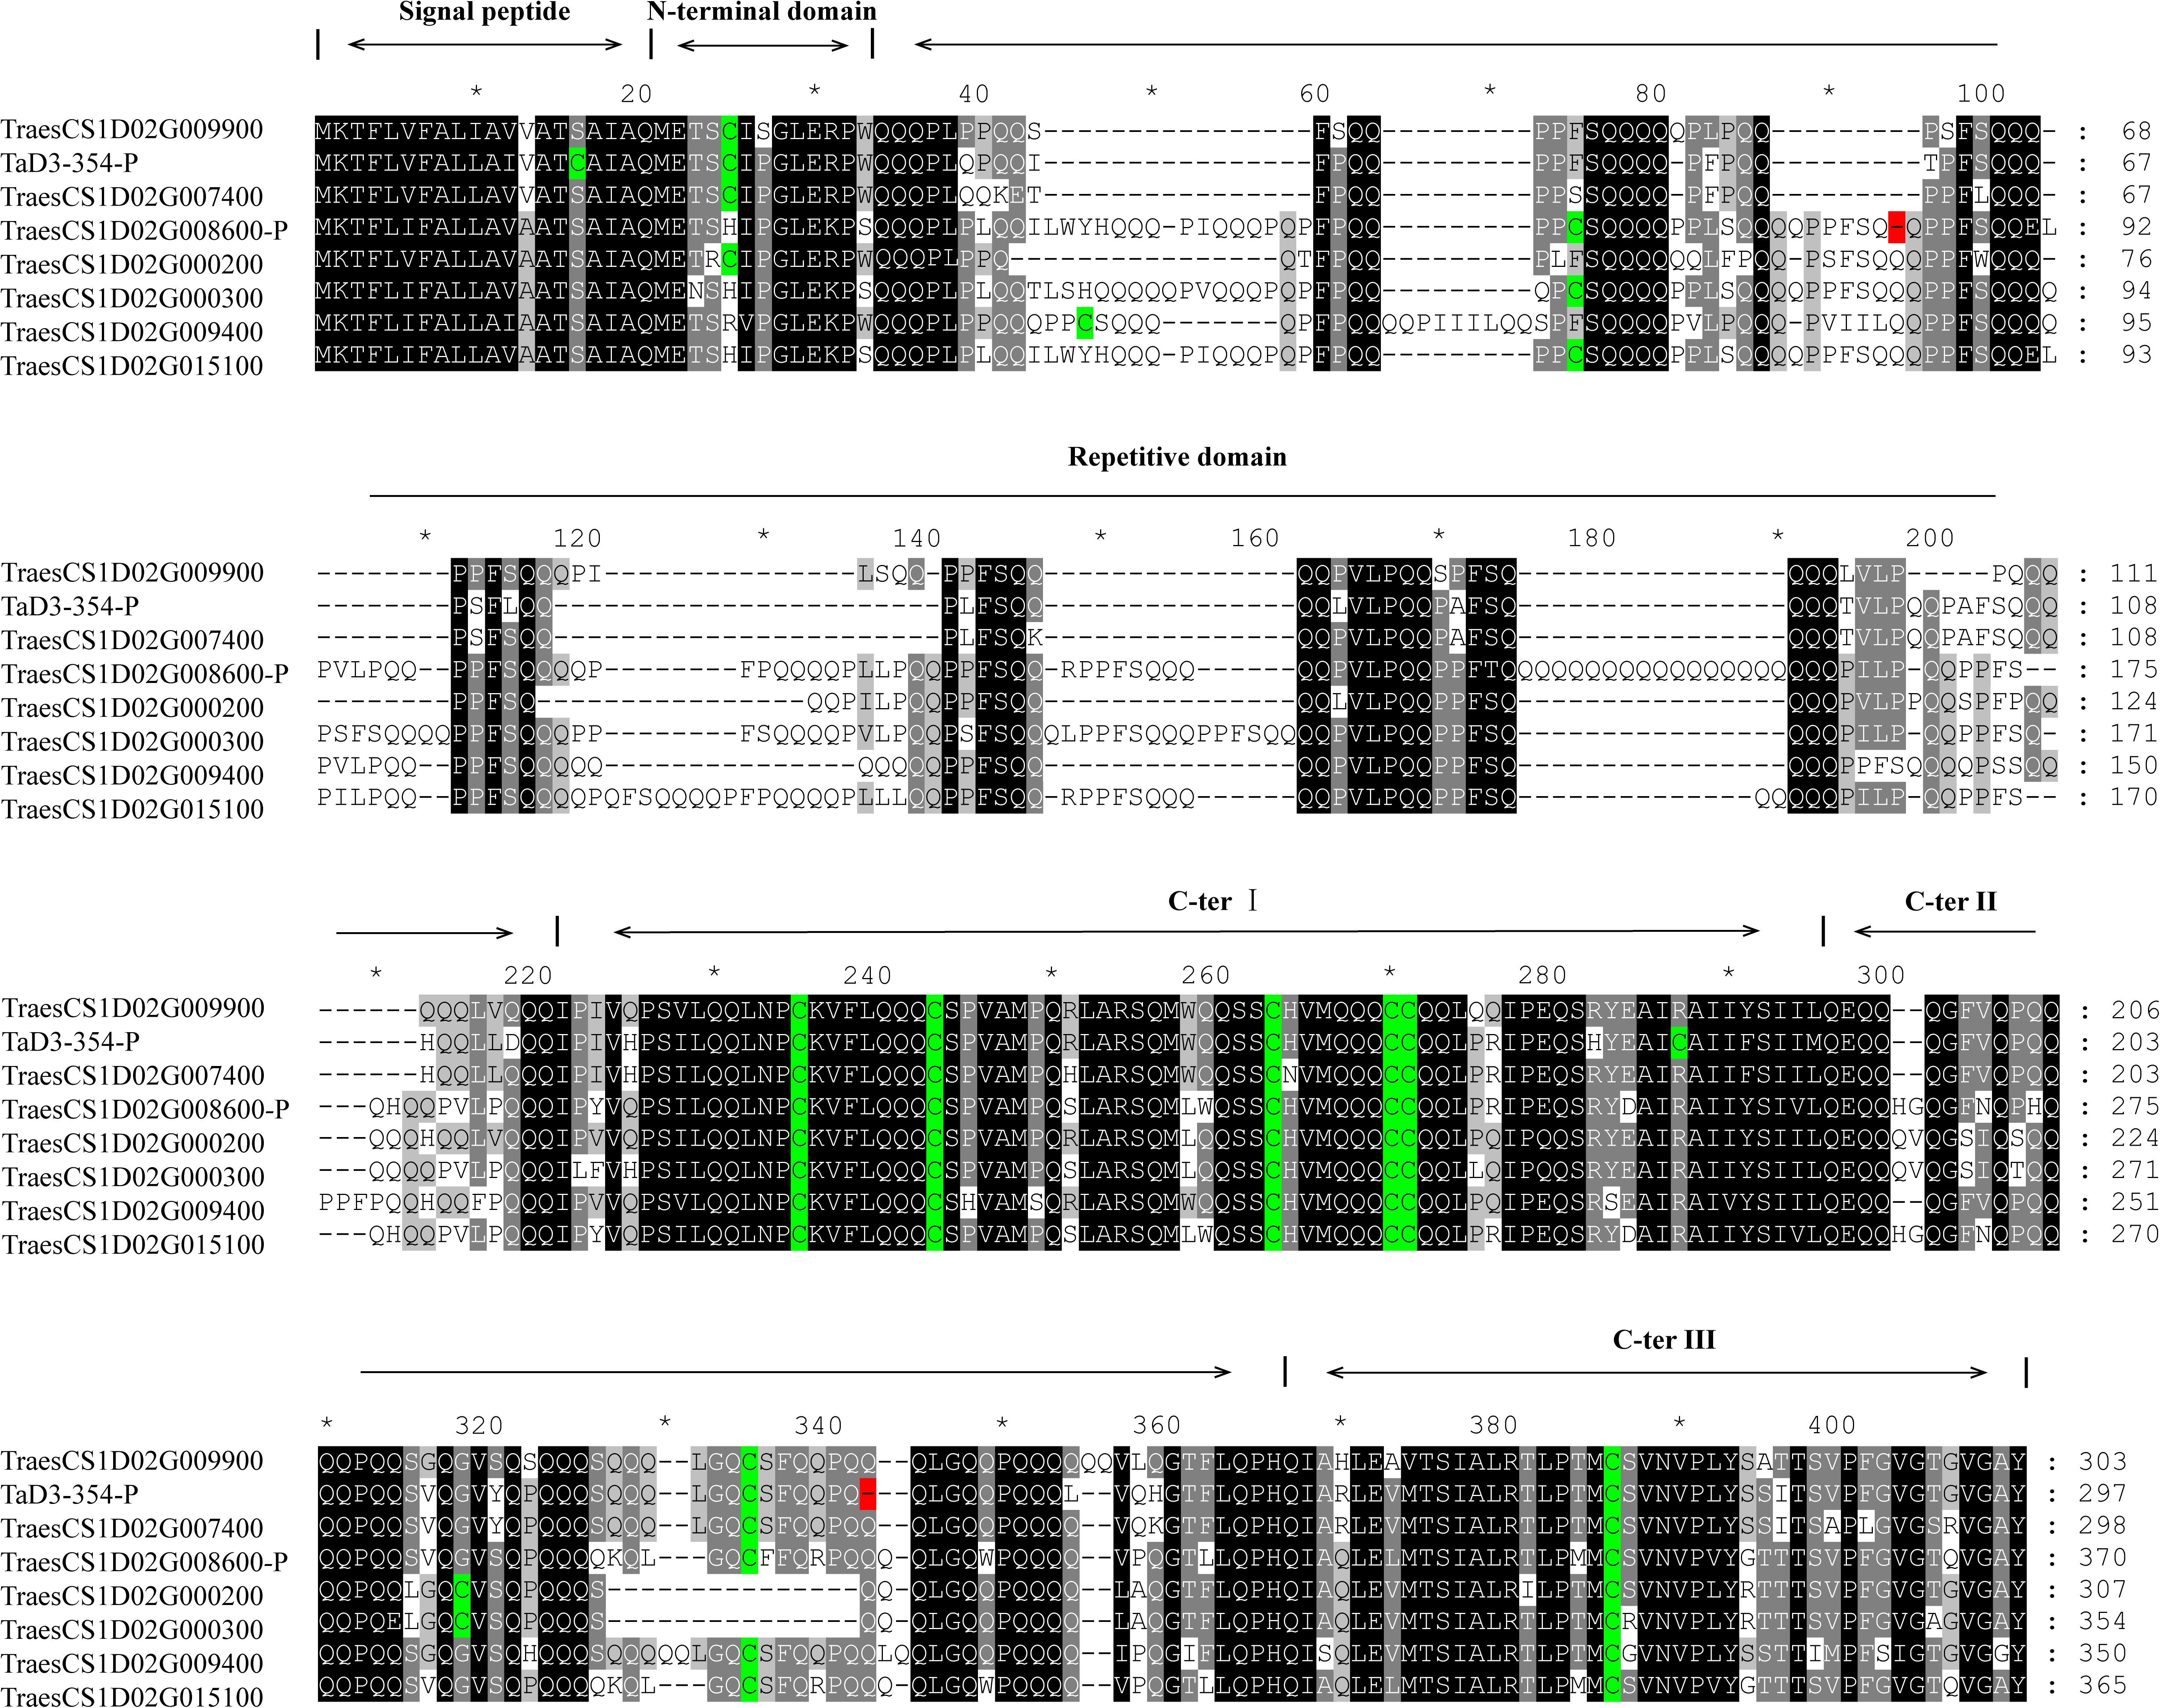
Figure 4. Alignment of putative protein sequences of polymeric protein components of wheat endosperm (LMW-GS) in the major QTL cluster 1DS.1. Cysteine residues are indicated by a green color, while premature termination of codons (PTCs) is indicated by a red color.
Additive Effects of the Two QTL Clusters
Based on the genotypes of the RIL population at the two KASP markers representing the two QTL clusters (Supplementary Figure 7 and Supplementary Tables 15, 16), we compared the GlutoPeak parameters (PMT and A3) of RILs with different genotypes (Figure 5). At Whaas14785, the values of PMT and A3 for RILs of Zhengyumai 9987 genotype (T) were higher than that of Luozhen No. 1 (C). On the contrary, the values of PMT and A3 for RILs of Zhengyumai 9987 genotype (G) at Whaas16493 were lower than that of Luozhen No.1 (A). Taking the two QTL clusters together, the phenotype values of RILs with superior allele combination (A + T) were the highest, followed by the phenotype values of RILs with intermediate (A + C, G + T) and inferior (G + C) allele combinations. These results indicated that pyramiding of superior alleles at the two QTL clusters is promising in future wheat breeding.
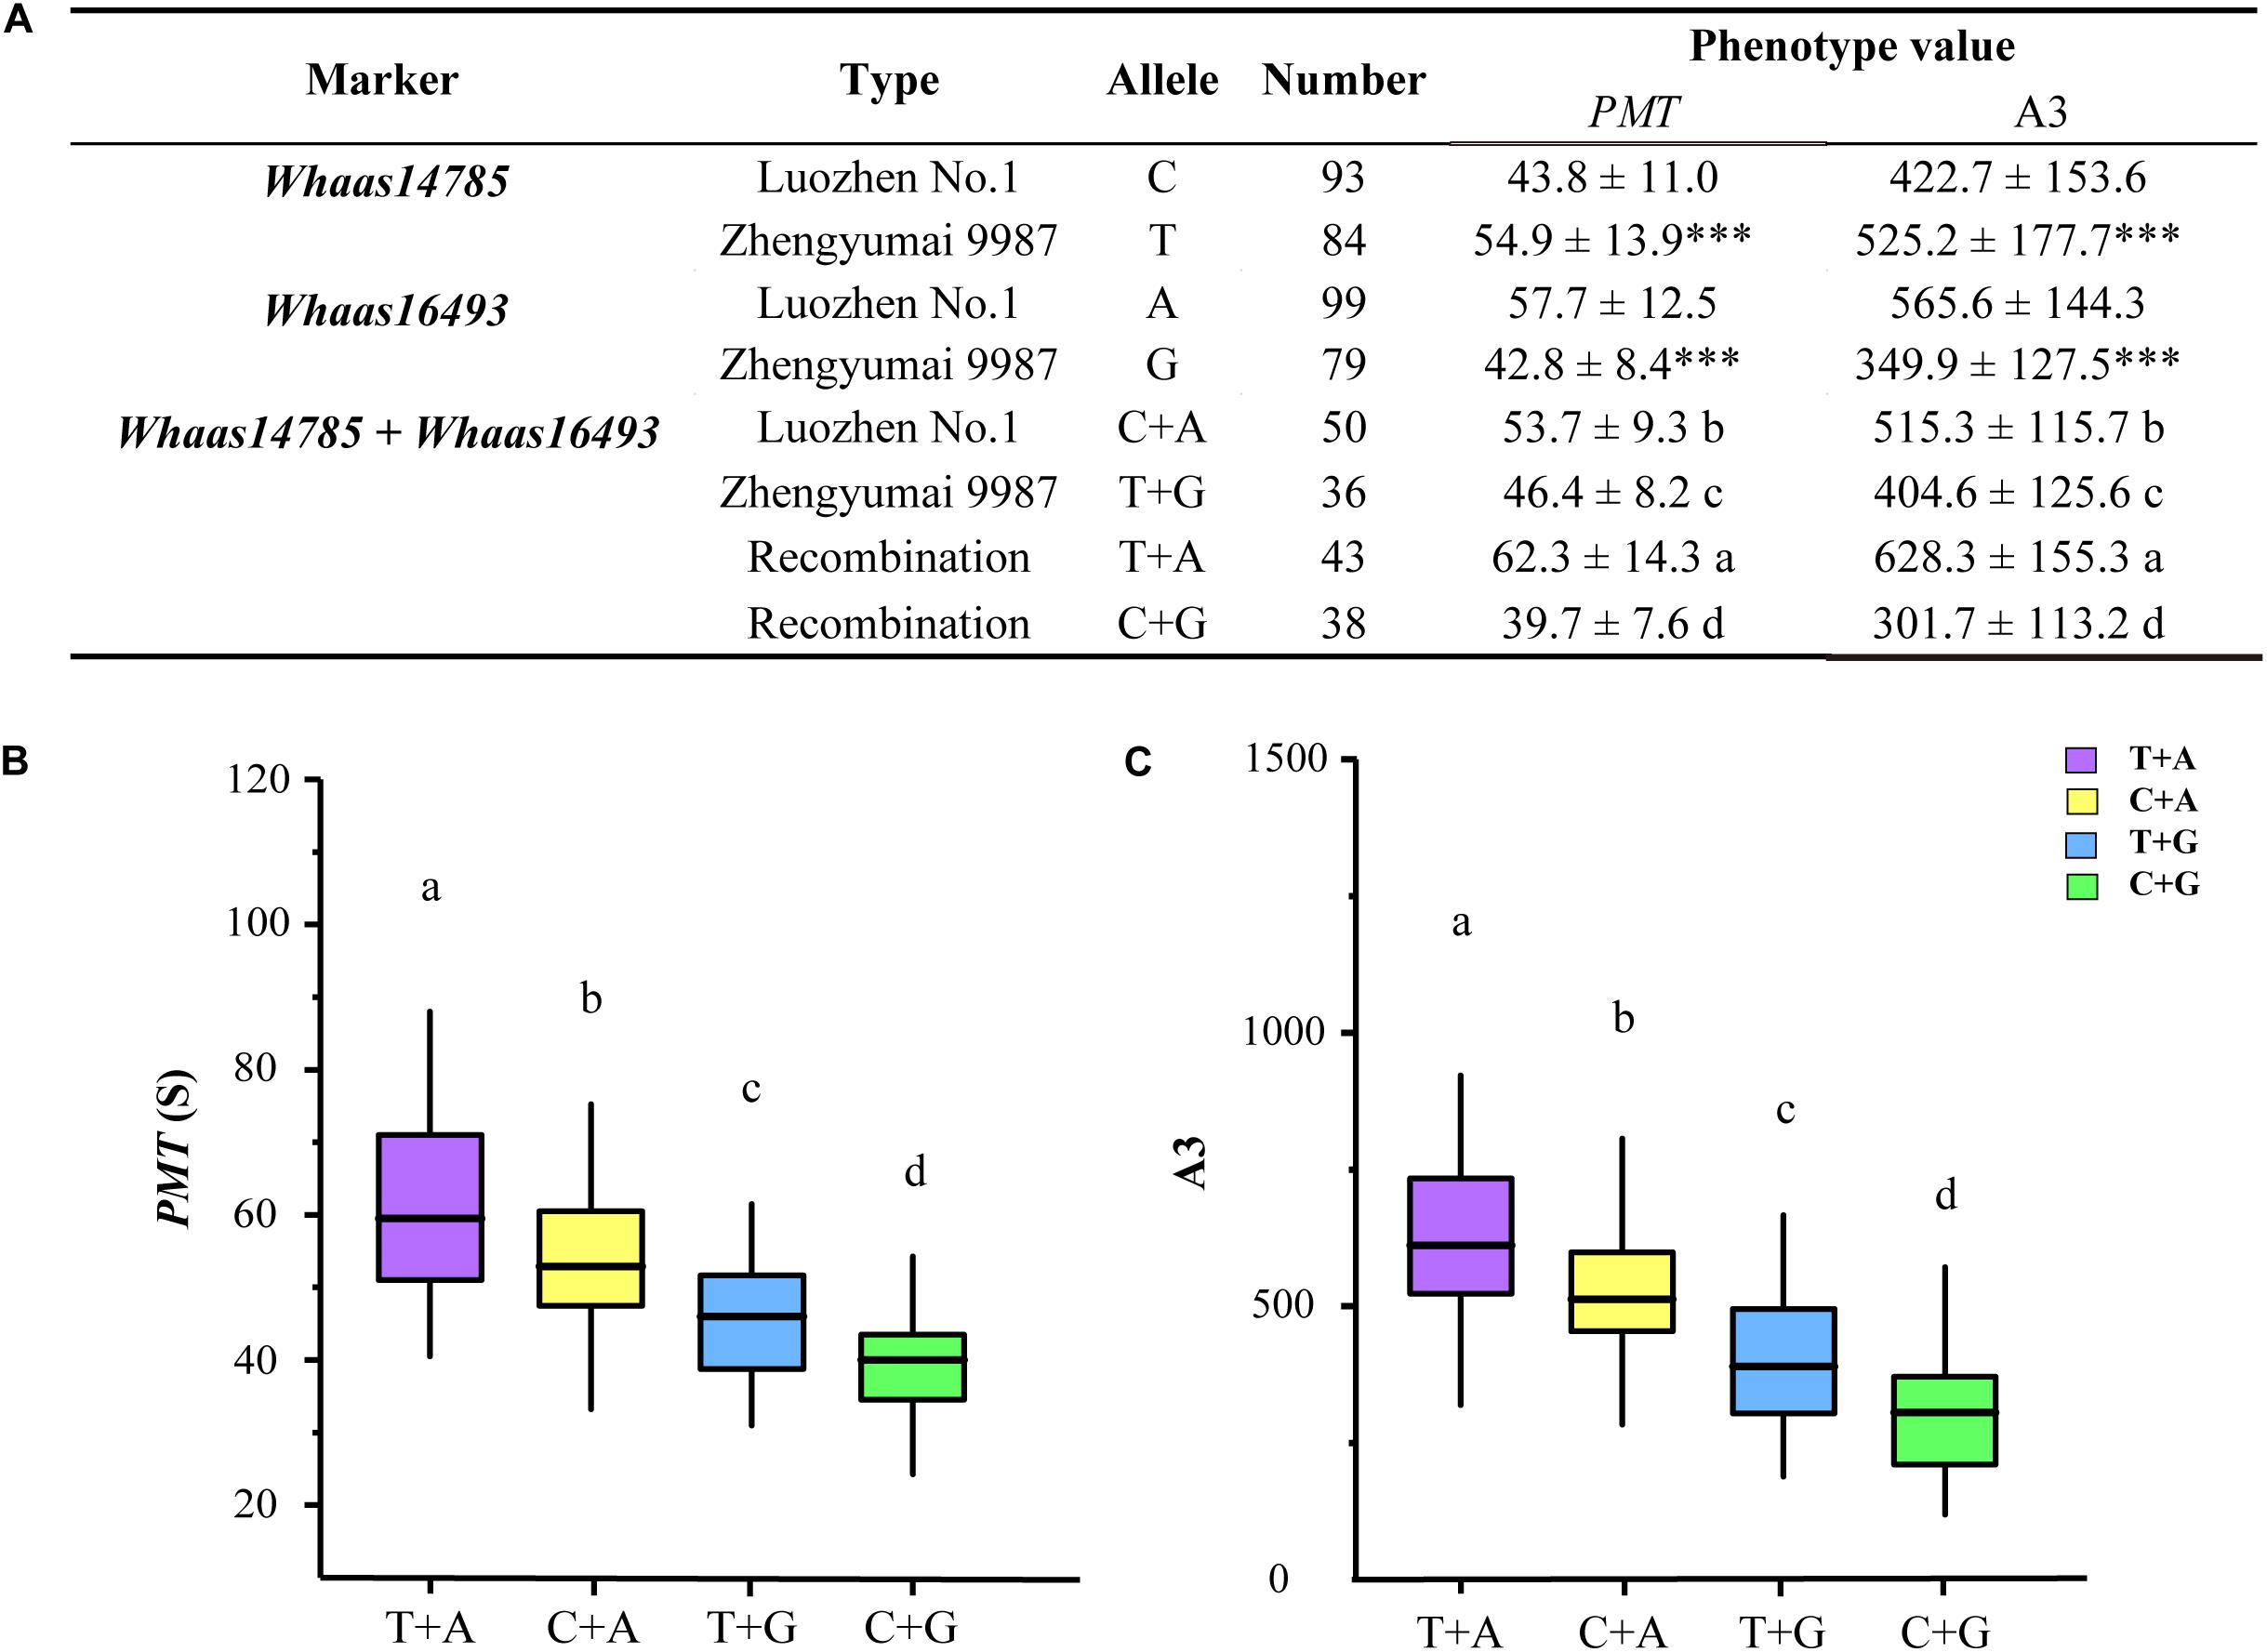
Figure 5. Additive effect analysis of the significant SNPs on chromosome 1D associated with gluten aggregation properties. (A) Analysis of variations with different alleles. ∗∗∗ p < 0.001. (B) Comparisons of parameter peak maximum time (PMT) among RILs of different genotypes. (C) Comparisons of parameter area from the first minimum to AM (A3) among RILs of different genotypes. Lowercase letters (a, b, c, d) represent significant differences determined by ANOVA (p < 0.001). See footnote of Table 1 for abbreviations.
Discussion
In this study, we measured the gluten aggregation properties of 39 wheat samples by GlutoPeak, and the dough rheological parameters by Farinograph and Extensograph. We found that the gluten aggregation properties of whole-wheat meal samples were in significant correlation with the rheological parameters. In particular, the parameters PMT, AM, A1, and A3 of GlutoPeak were highly positively correlated with the dough rheological parameters DST, Rmax, and EA determined by Farinograph and Extensograph (Table 1). As a result, the parameters of Glutopeak can be used to establish the rheological properties of wheat flour dough, and to estimate the qualities of wheat grains measured by Farinograph and Extensograph. Compared with traditional methods to determine wheat quality, the method of GlutoPeak does not require wheat sample moisture adjustment, experimental milling, and post-mature wheat flour sample stabilization treatment, which is much time and labor saving. Our results further confirmed the value of GlutoPeak in researches and breeding targeting wheat grain quality.
Quantitative trait loci (QTL) associated with gluten quality have been detected using SDS sedimentation volume (SV), mixograph parameters, grain protein content (GPC), and gluten index (GI). QTL for gluten quality have been identified on chromosomes 1A, 1B, 1D, 3B, 6A, 6B, 7B, and 7A, and major QTLs for gluten quality were mapped on the long arms of chromosomes 1A, 1B, and 1D, around Glu-A1, Glu-B1, and Glu-D1, respectively (Kunert et al., 2007; Sun et al., 2008; Patil et al., 2009; Conti et al., 2011; Deng et al., 2013, 2015; Kumar et al., 2013; Liu et al., 2017). Nevertheless, QTL analysis of gluten aggregation properties using GlutoPeak parameters has not been conducted up to now. In our study, a total of 33 additive QTL on chromosomes 1B, 1D, 3A, 4A, 4B, 4D, 5A, 5B, 5D, 6A, 6D, 7A, 7B, and 7D were identified using GlutoPeak parameters. Two major QTL clusters were identified on chromosomes 1DS and 1DL for GlutoPeak parameters PMT, AM, A1, A2, and A3 (Figures 2, 3). The QTL cluster 1DL.2 accounted for 4.70–43.50% of the phenotypic variation and was overlapped with the most important locus (Glu-D1) reported to regulate gluten aggregation properties. The QTL cluster 1DS.1 accounted for 3.85–14.23% of the phenotypic variation and was overlapped with another important locus (Glu-D3) reported to be responsible for gluten aggregation properties.
By comparing the QTL mapping results with QTLs reported in previous studies, we found that several QTLs were commonly detected in this study and previous studies (Table 3). The QTL cluster of 1DL.2 overlapped with a detected QTL for parameters Mixolab protein weakening torque (C2), Mixolab development time (DT), Mixograph midline peak time (MPT), Mixograph midline peak value (MPV), Mixograph midline 8 min band width (MTxW), and Mixolab stability time (ST) reported by Jin et al. (2016), which also overlapped with a detected QTL for parameters dough development time of Farinograph, dough stabilization time of Farinograph and sedimentation volume reported by Guo et al. (2020). The QTL cluster of 3AS.1 colocalized with a detected QTL regulating grain protein content under late sowing time (LGPC) and wet gluten content under late sowing time (LWGC) reported by Lou et al. (2020). The QTL cluster of 3AL in this study overlapped with a detected QTL for LWGC and grain starch content under normal sowing time (Lou et al., 2020), whereas the QTL cluster of 6AS.3 in this study colocalized with a QTL for parameters ST and SV reported by Guo et al. (2020). On the contrary, the other four QTL clusters of 1DS.1, 4AL.2, 4DS, and 7DS were not reported in previous studies, which were probable novel QTL clusters regulating the characteristics of gluten aggregation. These results suggested the feasibility to dissect the genetic regulation of gluten aggregation properties using GlutoPeak.
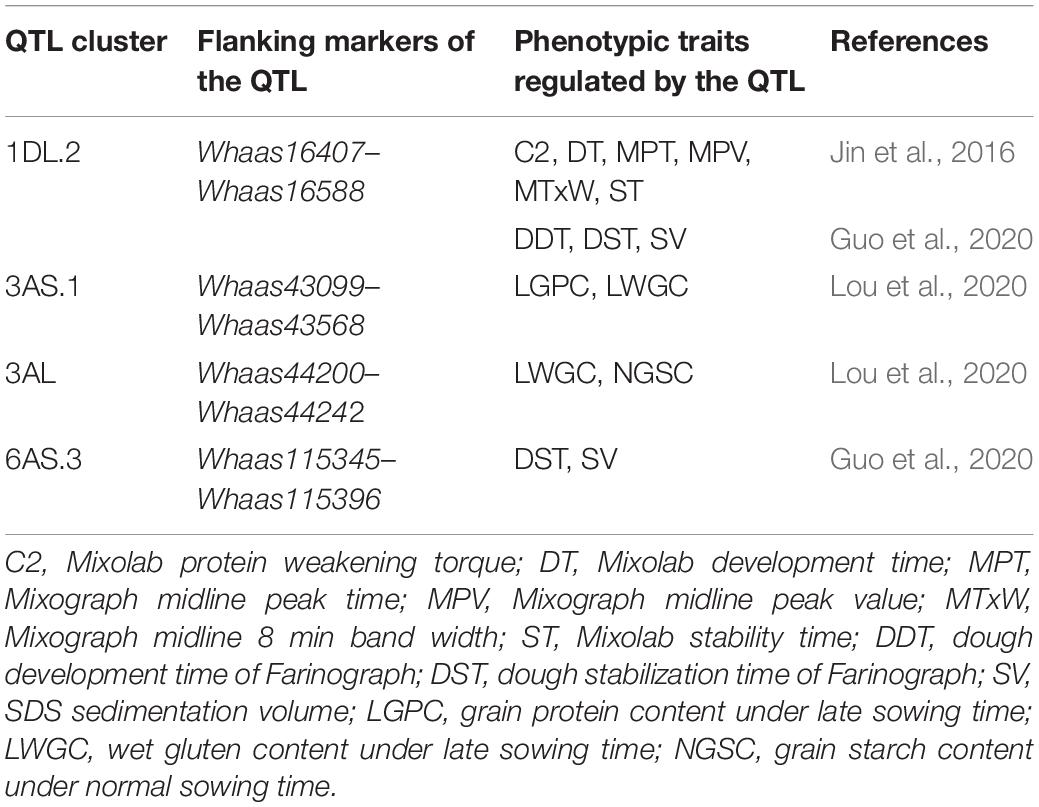
Table 3. Common quantitative trait loci (QTL) clusters detected in this study and previous studies.
Low molecular weight glutenin subunits are polymeric protein components of wheat endosperm, which are among the biggest macromolecules present in nature, and determine the processing properties of wheat dough (Wei-fu et al., 2018). Based on annotations of the Chinese Spring reference genome and gene expression profiles obtained from the wheat expression browser, we found two LMW-GS genes (TraesCS1D02G009900 and TraesCS1D02G015100) in the QTL cluster on 1DS were highly expressed in wheat grains (Supplementary Figure 5). The two genes were designated as candidate genes for the QTL cluster 1DS.1. We further cloned an LMW-GS gene from the parents of the RIL population, Luozhen No. 1 and Zhengyumai 9987, which was designated as TaD3-354, based on the conserved sequences flanking TraesCS1D02G009900. A premature termination codon (PTC) mutation in TaD3-354 was detected between Luozhen No. 1 and Zhengyumai 9987 (Figure 4), which were reported as an important cause for the silence of high-molecular-weight glutenin subunits in Triticum species (Chen et al., 2018). TaD3-354 was anchored in the QTL cluster on chromosome 1DS by genotyping the RIL population with KASP markers designed based on the SNPs in TaD3-354 and TraesCS1D02G009900. We further found that the content of LMW-GSs differed significantly between Luozhen No. 1 and Zhengyumai 9987 through RP-HPLC analysis (Supplementary Figure 6). The results implied that the mutations in LMW-GS gene TaD3-354 were probably responsible for the difference in gluten aggregation properties between Luozhen No. 1 and Zhengyumai 9987.
Based on the genotypes of the RIL population at the two KASP markers representing the two QTL clusters (Supplementary Figure 7), we found that RILs with different genotypes at the two QTL clusters exhibited significant differences regarding gluten aggregation properties. In addition, we observed significant additive effect of the two QTL clusters on gluten aggregation properties. The phenotype values of RILs with superior allele combination were the highest, followed by the phenotype values of RILs with intermediate and inferior allele combinations (Figure 5). These results indicate that pyramiding of beneficial alleles is a promising approach in wheat breeding targeting gluten aggregation properties. The KASP markers designed in this study are useful in future research efforts and breeding programs on gluten aggregation properties.
Data Availability Statement
The raw SLAF sequencing data of our manuscript have been uploaded to the public database, which can be found in Genome Sequence Archive (https://bigd.big.ac.cn/gsa/browse/CRA003543).
Author Contributions
ZFZ, ZWZ, BT, and ZL conceived and designed the experiments. ZWZ, LJ, and HQ carried out phenotype experiments. LJ and HG were responsible for DNA marker analysis. ZWZ, CL, MQ, and WY performed genetic mapping, QTL analysis, and candidate gene identification. YW and WL constructed the mapping population. ZFZ and ZWZ wrote the manuscript. ZL and WY revised the manuscript. All authors read and approved the final manuscript.
Funding
This research was financially supported by the National Key Research and Development Program of China (2017YFD0100704), the Scientific and Technological Research Project of Henan Province (202102110027), the Scientific and Technological Innovation Project of Henan Academy of Agricultural Sciences (2020CX01), and the Project of Henan Provincial Department of Education (20A180011).
Conflict of Interest
The authors declare that the research was conducted in the absence of any commercial or financial relationships that could be construed as a potential conflict of interest.
Supplementary Material
The Supplementary Material for this article can be found online at: https://www.frontiersin.org/articles/10.3389/fpls.2020.611605/full#supplementary-material
Footnotes
- ^ https://cran.r-project.org/web/packages/QTL.gCIMapping.GUI/index.html
- ^ http://www.wheatgenome.org/
- ^ http://www.wheat-expression.com
- ^ http://plants.ensembl.org/Triticum_aestivum/Info/Index
- ^ http://www.transgen.com.cn
- ^ http://www.lynnon.com
- ^ http://plants.ensembl.org/index.html
References
Amoriello, T., Turfani, V., and Carcea, M. (2015). “Durum wheat semolina gluten content predicted by means of GlutoPeak parameters,” in Proceedings of the 10th AISTEC Conference “Grains for Feeding the World” (Milan: ICC), 244–249.
Bao, J., Kong, X., Xie, J., and Xu, L. (2004). Analysis of genotypic and environmental effects on rice starch. 1. Apparent amylose content, pasting viscosity, and gel texture. J. Agric. Food Chem. 52, 6010–6016. doi: 10.1021/jf049234i
Branlard, G., Dardevet, M., Saccomano, R., Lagoutte, F., and Gourdon, J. (2001). Genetic diversity of wheat storage proteins and bread wheat quality. Euphytica 119, 59–67. doi: 10.1007/978-94-017-3674-9_18
Chandi, G. K., Lok, C. W., Jie, N. Y., and Seetharaman, K. (2015). Functionality of Kamut and Millet flours in macro wire cut cookie systems. J. Food Sci. Technol. 52, 556–561. doi: 10.1007/s13197-013-0969-z
Chandi, G. K., and Seetharaman, K. (2012). Optimization of gluten peak tester: a statistical approach. J. Food Qual. 35, 69–75. doi: 10.1111/j.1745-4557.2011.00425.x
Chen, G., Zhang, M. H., Liu, X. J., Fu, J. Y., Li, H. Y., Hao, M., et al. (2018). Characterization of an expressed Triticum monococcum Glu-A1y gene containing a premature termination codon in its C-terminal coding region. Cereal Res. Commun. 46, 201–210. doi: 10.1556/0806.46.2018.02
Conti, V., Roncallo, P. F., Beaufort, V., Cervigni, G. L., Miranda, R., Jensen, C. A., et al. (2011). Mapping of main and epistatic effect QTLs associated to grain protein and gluten strength using a RIL population of durum wheat. J. Appl. Genet. 52, 287–298. doi: 10.1007/s13353-011-0045-1
Cornish, G. B., Bekes, F., Allen, H., and Martin, D. (2001). Flour proteins linked to quality traits in an Australian doubled haploid wheat population. Aust. J. Agric. Res. 52, 1339–1348. doi: 10.1071/ar01060
Deng, Z., Tian, J., Chen, F., Li, W., Zheng, F., Chen, J., et al. (2015). Genetic dissection on wheat flour quality traits in two related populations. Euphytica 203, 221–235. doi: 10.1007/s10681-014-1318-7
Deng, Z. Y., Liang, Z., Liu, B., Zhang, K. P., Chen, J. S., Hou-Lan, Q. U., et al. (2013). Conditional QTL mapping of sedimentation volume on seven quality traits in common wheat. J. Integr. Agric. 12, 2125–2133. doi: 10.1016/S2095-3119(13)60352-4
Dubcovsky, J., and Dvorak, J. (2007). Genome plasticity a key factor in the success of polyploid wheat under domestication. Science 316, 1862–1866. doi: 10.1126/science.1143986
DuPont, F., Chan, R., and Lopez, R. (2005). Sequential extraction and quantitative recovery of gliadins, glutenins, and other proteins from small samples of wheat flour. J. Agric. Food Chem. 53, 1575–1584. doi: 10.1021/jf048697l
Eagles, H., Hollamby, G., and Eastwood, R. (2002). Genetic and environmental variation for grain quality traits routinely evaluated in southern Australian wheat breeding programs. Aust. J. Agric. Res. 53, 1047–1057. doi: 10.1071/AR02010
Edwards, N. M., Gianibelli, M. C., Mccaig, T. N., Clarke, J. M., Ames, N. P., Larroque, O. R., et al. (2007). Relationships between dough strength, polymeric protein quantity and composition for diverse durum wheat genotypes. J. Cereal Sci. 45, 140–149. doi: 10.1016/j.jcs.2006.07.012
Fu, B. X., Wang, K., and Dupuis, B. (2017). Predicting water absorption of wheat flour using high shear-based GlutoPeak test. J. Cereal Sci. 76, 116–121. doi: 10.1016/j.jcs.2017.05.017
González-Torralba, J., Arazuri, S., and Jarén, C. (2011). Stable quality traits of soft winter wheat under non limiting nitrogen conditions. Crop Sci. 51, 2820. doi: 10.2135/cropsci2011.02.0084
Guo, Y., Zhang, G., Guo, B., Qu, C., Zhang, M., Kong, F., et al. (2020). QTL mapping for quality traits using a high-density genetic map of wheat. PLoS One 15:e0230601. doi: 10.1371/journal.pone.0230601
He, Z., Yang, J., Zhang, Y., Quail, K., and Pena, R. (2004). Pan bread and dry white Chinese noodle quality in Chinese winter wheats. Euphytica 139, 257–267. doi: 10.1007/s10681-004-3283-z
He, Z. H., Liu, L., Xia, X. C., Liu, J. J., and Pena, R. (2005). Composition of HMW and LMW glutenin subunits and their effects on dough properties, pan bread, and noodle quality of Chinese bread wheats. Cereal Chem. 82, 345–350. doi: 10.1094/cc-82-0345
Jin, H., Wen, W., Liu, J., Zhai, S., Zhang, Y., Yan, J., et al. (2016). Genome-wide QTL mapping for wheat processing quality parameters in a Gaocheng 8901/Zhoumai 16 recombinant inbred line population. Front. Plant Sci. 7:1032. doi: 10.3389/fpls.2016.01032
Jin, H., Zhang, Y., Li, G., Mu, P., Fan, Z., Xia, X., et al. (2013). Effects of allelic variation of HMW-GS and LMW-GS on mixograph properties and Chinese noodle and steamed bread qualities in a set of Aroona near-isogenic wheat lines. J. Cereal Sci. 57, 146–152. doi: 10.1016/j.jcs.2012.10.011
Kumar, A., Elias, E. M., Ghavami, F., Xu, X., Jain, S., Manthey, F. A., et al. (2013). A major QTL for gluten strength in durum wheat (Triticum turgidum L. var. durum). J. Cereal Sci. 57, 21–29. doi: 10.1016/j.jcs.2012.09.006
Kunert, A., Naz, A. A., Dedeck, O., Pillen, K., and Léon, J. (2007). AB-QTL analysis in winter wheat: I. Synthetic hexaploid wheat (T. turgidum ssp. dicoccoides × T. tauschii) as a source of favourable alleles for milling and baking quality traits. Theor. Appl. Genet. 115, 683–695. doi: 10.1007/s00122-007-0600-7
Liang, D., Tang, J., Pena, R. J., Singh, R., He, X., Shen, X., et al. (2010). Characterization of CIMMYT bread wheats for high-and low-molecular weight glutenin subunits and other quality-related genes with SDS-PAGE, RP-HPLC and molecular markers. Euphytica 172, 235–250. doi: 10.1007/s10681-009-0054-x
Liu, L., He, Z., Yan, J., Zhang, Y., Xia, X., and Pena, R. J. (2005). Allelic variation at the Glu-1 and Glu-3 loci, presence of the 1B. 1R translocation, and their effects on mixographic properties in Chinese bread wheats. Euphytica 142, 197–204. doi: 10.1016/j.cyto.2004.11.006
Liu, T.-T., Kai, L., Wang, F.-F., Zhang, Y., Li, Q.-F., Zhang, K.-R., et al. (2017). Conditional and unconditional QTLs mapping of gluten strength in common wheat (Triticum aestivum L.). J. Integr. Agric. 16, 2145–2155. doi: 10.1016/s2095-3119(16)61564-2
Lou, H., Zhang, R., Liu, Y., Guo, D., Zhai, S., and Chen, A. (2020). Genome-wide association study of six quality-related traits in common wheat (Triticum aestivum L.) under two sowing conditions. Theor. Appl. Genet. doi: 10.1007/s00122-020-03704-y [Epub ahead of print].
Marti, A., Augst, E., Cox, S., and Koehler, P. (2015a). Correlations between gluten aggregation properties defined by the GlutoPeak test and content of quality-related protein fractions of winter wheat flour. J. Cereal Sci. 66, 89–95. doi: 10.1016/j.jcs.2015.10.010
Marti, A., Ulrici, A., Foca, G., Quaglia, L., and Pagani, M. A. (2015b). Characterization of common wheat flours (Triticum aestivum L.) through multivariate analysis of conventional rheological parameters and gluten peak test indices. LWT Food Sci. Technol. 64, 95–103. doi: 10.1016/j.lwt.2015.05.029
Melnyk, J. P., Dreisoerner, J., Marcone, M. F., and Seetharaman, K. (2012). Using the Gluten Peak Tester as a tool to measure physical properties of gluten. J. Cereal Sci. 56, 561–567. doi: 10.1016/j.jcs.2012.07.015
Metakovsky, E., Annicchiarico, P., Boggini, G., and Pogna, N. (1997). Relationship between gliadin alleles and dough strength in Italian bread wheat cultivars. J. Cereal Sci. 25, 229–236. doi: 10.1006/jcrs.1996.0088
Patil, R., Oak, M., Tamhankar, S., and Rao, V. (2009). Molecular mapping of QTLs for gluten strength as measured by sedimentation volume and mixograph in durum wheat (Triticum turgidum L. ssp durum). J. Cereal Sci. 49, 378–386. doi: 10.1016/j.jcs.2009.01.001
Payne, P. I. (1987). Genetics of wheat storage proteins and the effect of allelic variation on bread-making quality. Annu. Rev. Plant Physiol. 38, 141–153. doi: 10.1146/annurev.pp.38.060187.001041
Peterson, C., Graybosch, R., Baenziger, P., and Grombacher, A. (1992). Genotype and environment effects on quality characteristics of hard red winter wheat. Crop Sci. 32, 98–103. doi: 10.2135/cropsci1992.0011183X003200010022x
Rakita, S., Dokić, L., Dapčević Hadnađev, T., Hadnađev, M., and Torbica, A. (2018). Predicting rheological behavior and baking quality of wheat flour using a GlutoPeak test. J. Texture Stud. 49, 339–347. doi: 10.1111/jtxs.12308
Ram, S. (2003). High molecular weight glutenin subunit composition of Indian wheats and their relationships with dough strength. J. Plant Biochem. Biotechnol. 12, 151–155. doi: 10.1007/BF03263177
Rasheed, A., Wen, W., Gao, F., Zhai, S., Jin, H., Liu, J., et al. (2016). Development and validation of KASP assays for genes underpinning key economic traits in bread wheat. Theor. Appl. Genet. 129, 1843–1860. doi: 10.1007/s00122-016-2743-x
Ravel, C., Faye, A., Ben-Sadoun, S., Ranoux, M., Dardevet, M., Dardevet, M., et al. (2020). SNP markers for early identification of high molecular weight glutenin subunits (HMW-GSs) in bread wheat. Theor. Appl. Genet. 133, 751–770. doi: 10.1007/s00122-019-03505-y
R Development Core Team (2012). R: A Language and Environment for Statistical Computing. Vienna: R Foundation for Statistical Computing. Available online at: http://www.R-project.org/
Shewry, P., and Tatham, A. (1997). Disulphide bonds in wheat gluten proteins. J. Cereal Sci. 25, 207–227. doi: 10.1006/jcrs.1996.0100
Sissons, M. (2016). GlutoPeak: a breeding tool for screening dough properties of durum wheat semolina. Cereal Chem. 93, 550–556. doi: 10.1094/CCHEM-03-16-0063-R
Sliwinski, E., Kolster, P., Prins, A., and Van Vliet, T. (2004a). On the relationship between gluten protein composition of wheat flours and large-deformation properties of their doughs. J. Cereal Sci. 39, 247–264. doi: 10.1016/j.jcs.2003.10.006
Sliwinski, E., Kolster, P., and Van Vliet, T. (2004b). On the relationship between large-deformation properties of wheat flour dough and baking quality. J. Cereal Sci. 39, 231–245. doi: 10.1016/j.jcs.2003.10.005
Sun, H., Lü, J., Fan, Y. D., Zhao, Y., Kong, F., Li, R., et al. (2008). Quantitative trait loci (QTLs) for quality traits related to protein and starch in wheat. Prog. Nat. Sci. 18, 825–831. doi: 10.1016/j.pnsc.2007.12.013
Sun, X., Marza, F., Ma, H., Carver, B. F., and Bai, G. (2010). Mapping quantitative trait loci for quality factors in an inter-class cross of US and Chinese wheat. Theor. Appl. Genet. 120, 1041–1051. doi: 10.1007/s00122-009-1232-x
Wang, J., Hou, G. G., Liu, T., Wang, N., and Bock, J. (2018). GlutoPeak method improvement for gluten aggregation measurement of whole wheat flour. LWT 90, 8–14. doi: 10.1016/j.lwt.2017.11.059
Wang, K., Dupuis, B., and Fu, B. X. (2017). Gluten aggregation behavior in high-shear-based GlutoPeak Test: impact of flour water absorption and strength. Cereal Chem. 94, 909–915. doi: 10.1094/CCHEM-05-17-0084-R
Wei-fu, S., Xue-feng, Y., Qing-jie, S., Chun-li, Z., Wen-li, X., and Zhi-min, X. (2018). Relationship between the low-molecular-weight glutenin subunits and quality of strong gluten wheat. Heilongjiang Agric. Sci. 2, 133–135.
Xu, J., Bietz, J. A., and Carriere, C. J. (2007). Viscoelastic properties of wheat gliadin and glutenin suspensions. Food Chem. 101, 1025–1030. doi: 10.1016/j.foodchem.2006.02.057
Zawieja, B., Makowska, A., and Gutsche, M. (2020). Prediction of selected rheological characteristics of wheat based on Glutopeak test parameters. J. Cereal Sci. 91, 102898. doi: 10.1016/j.jcs.2019.102898
Zhang, P., Zhang, Q. J., Li, L., Xia, X., and He, Z. (2007). Identification of HWM-GS in Glu-B1 loci by HPLC and the effects of 7OE on wheat dough strength. Acta Agron. Sin. 10, 1575–1581.
Keywords: wheat, QTL mapping, gluten aggregation properties, GlutoPeak parameters, wheat quality
Citation: Zhou Z, Zhang Z, Jia L, Qiu H, Guan H, Liu C, Qin M, Wang Y, Li W, Yao W, Wu Z, Tian B and Lei Z (2021) Genetic Basis of Gluten Aggregation Properties in Wheat (Triticum aestivum L.) Dissected by QTL Mapping of GlutoPeak Parameters. Front. Plant Sci. 11:611605. doi: 10.3389/fpls.2020.611605
Received: 29 September 2020; Accepted: 21 December 2020;
Published: 28 January 2021.
Edited by:
Luigi Cattivelli, Research Centre for Genomics and Bioinformatics, Council for Agricultural and Economics Research, ItalyReviewed by:
Craig F. Morris, Wheat Health, Genetics, and Quality Research, Agricultural Research Service, United States Department of Agriculture, United StatesYuefeng Ruan, Agriculture and Agri-Food Canada (AAFC), Canada
David Anthony Van Sanford, University of Kentucky, United States
Copyright © 2021 Zhou, Zhang, Jia, Qiu, Guan, Liu, Qin, Wang, Li, Yao, Wu, Tian and Lei. This is an open-access article distributed under the terms of the Creative Commons Attribution License (CC BY). The use, distribution or reproduction in other forums is permitted, provided the original author(s) and the copyright owner(s) are credited and that the original publication in this journal is cited, in accordance with accepted academic practice. No use, distribution or reproduction is permitted which does not comply with these terms.
*Correspondence: Zhengqing Wu, wzhqfy@163.com; Baoming Tian, tianbm@zzu.edu.cn; Zhensheng Lei, zhenshenglei@126.com
†These authors have contributed equally to this work