 Yunyun Chen1,2,3†
 Hongwei Xu2,3†
 Ting He2,3
 Runhong Gao2,3
 Guimei Guo2,3
 Ruiju Lu2,3
 Zhiwei Chen2,3*
 Chenghong Liu2,3*
- 1College of Fisheries and Life Science, Shanghai Ocean University, Shanghai, China
- 2Biotechnology Research Institute, Shanghai Academy of Agricultural Sciences, Shanghai, China
- 3Biotechnology Research Institute, Shanghai Key Laboratory of Agricultural Genetics and Breeding, Shanghai, China
Polyploids play an important role in the breeding of plant for superior characteristics, and many reports have focused on the effects upon photosynthesis from polyploidization in some plant species recently, yet surprisingly little of this is known for barley. In this study, homozygous diploid and tetraploid plants, derived from microspore culturing of the barley cultivar “H30,” were used to assess differences between them in their cellular, photosynthetic, and transcriptomic characteristics. Our results showed that tetraploid barley has the distinct characteristics of polyploids, namely thicker and heavier leaves, enlarged stomata size or stomatal guard cell size, and more photosynthetic pigments and improved photosynthesis (especially under high light intensity). This enhanced photosynthesis of tetraploid barley was confirmed by several photosynthetic parameters, including net photosynthetic rate (Pn), stomatal conductance (Gs), intercellular CO2 concentration (Ci), transpiration rate (Tr), maximum net photosynthetic rate (Pmax), light saturation point (LSP), maximum RuBP saturated rate carboxylation (Vcmax), and maximum rate of electron transport (Jmax). Transcriptomic analyses revealed that just ~2.3% of all detected genes exhibited differential expression patterns [i.e., differentially expressed genes (DEGs)], and that most of these – 580 of 793 DEGs in total – were upregulated in the tetraploid barley. The follow-up KEGG analysis indicated that the most enriched pathway was related to photosynthesis-antenna proteins, while the downregulation of DEGs was related mainly to the light-harvesting cholorophyII a/b-binding protein (Lhcb1) component, both validated by quantitative PCR (qPCR). Taken together, our integrated analysis of morphology, photosynthetic physiology, and transcriptome provides evidences for understanding of how polyploidization enhances the photosynthetic capacity in tetraploids of barley.
Introduction
Haploids are the fundamental ploidy-level type, from which diploids or tetraploids are easily produced via chromosome doubling. Microspores as gametic cells that have undergone androgenesis are able to produce haploid plants through in vitro culturing. This microspore culture provides a useful way for plant breeders to generate genetically stable, homozygous diploids, and colchicine is almost always used to induce the chromosome doubling. Furthermore, plant chromosomes’ doubling can spontaneously occur during anther or microspore culturing (Yuan et al., 2015). For instance, spontaneous chromosome doubling was reportedly higher than 50% in cabbage, broccoli, and barley (Castillo et al., 2009; Yuan et al., 2015). Hence, polyploidization events are very frequent in anther or microspore culture when using colchicine for chromosome doubling, even for wheat plants (Soriano et al., 2007).
Polyploid plants are generally superior to diploid plants in terms of morphology, metabolite contents, and tolerance to biotic or abiotic stresses (Sattler et al., 2016), and the current consensus is that photosynthetic capacity is the dominant characteristic of polyploid plants (Arias and Bhatia, 2015). A plant’s photosynthetic capacity is usually associated with its leaf thickness, stomatal size, and composition of photosynthetic pigments (Liu et al., 2018). Previous studies have shown that polyploids can have thicker leaves than diploids (Sun et al., 2015), polyploidization increases stomatal size (Laere et al., 2011; Zhang et al., 2017), and tetraploid plants of Chrysanthemum nankingense harbor significantly higher chlorophyll contents than counterpart diploids (Dong et al., 2017). However, in comparison with diploids, the changed photosynthetic rate in polyploids differs according to the species studied. For example, it is higher in Allium oleraceum (Eliška et al., 2015), Phlox drummondii (Vyas et al., 2007), Malus × domestica (Xue et al., 2017), and Lilium (Cao et al., 2018), but lower in Triticum (Hejnák et al., 2016) and Fragaria (Gao et al., 2017), yet moderate in Hordeum vulgare (Sicher et al., 1984).
Barley (H. vulgare L.), a worldwide staple crop, has been used for food, feed, brewing, and health products (Newman and Newman, 2006; Gao et al., 2018). Due to its high frequency of embryogenesis, barley has also been thought of as an excellent model plant for breading double haploids (Lu et al., 2008). In our prior work, we obtained both diploid and tetraploid barley plants from microspore cultures, finding that the latter possess thicker leaves than the former. Yet, an early study found no significant differences in the net photosynthetic rate between diploid and tetraploid barley plants under controlled environment conditions (Sicher et al., 1984). Since then, however, we could not find other published work that updates or verifies that finding. Moreover, little is still known of molecular mechanisms responsible for differences between the diploid and tetraploid barley plants.
In this study, we characterized the differences in morphological and photosynthetic parameters between the tetraploids and diploids of barley. Further, a transcriptome analysis was performed to investigate the distinct patterns of gene expression between the plant types. Our aim was to evaluate the effects of polyploidization upon photosynthetic capacity by comparing the phenotypic, photosynthetic, and molecular characteristics between tetraploids and diploids of barley, and to uncover the potential superiority of tetraploids in polyploid barley breeding.
Materials and Methods
Plant Materials and Growth Conditions
The double haploid and tetraploid barley were obtained from a microspore culture of the barley cultivar “H30,” which is the one primarily used in China’s Shanghai region for malt barley production (Chen et al., 2012; Gao et al., 2018). The plant growth conditions of these barley plants are detailed by Xu et al. (2016). Briefly, the seeds were sterilized in 1% (v/v) hypochlorite solution for 30 min, and then germinated in a phytotron at 22 ± 2°C for 1 week. Plants at approximately the two-leaf stage were transferred into plastic tanks containing Hoagland solution, in the phytotron of Shanghai Academy of Agricultural Sciences. The solution of each tank was replaced every 2 days and its pH maintained at 6.2 ± 0.2. Shoots of diploid and tetraploid barley were harvested at 11:30 AM, and one part was used for investigation of shoot dry weight according to Xu et al. (2016) and the other part was used for their RNA isolation, for which samples were rapidly frozen in liquid nitrogen and stored at −80°C.
Identification of the Diploid and Tetraploid Barley Plants
To distinguish diploid and tetraploid barley, the counting of chromosome number and measuring of stomatal guard cells’ length were relied upon. For chromosome counting, three new root tips with a length of 1–2 cm were cut from roots of each barley seedling (at the two-leaf stage), and then incubated in a precooled 90% glacial acetic acid for ca. 10 min (Hu et al., 2015). Next, the root tips were dried with absorbent paper, and then immersed in 70% ethanol and stored at −20°C for later use. Finally, root tips were dissociated in 45% acetic acid, for 2 h, and then observed under a microscope (Olympus BX51, Tokyo, Japan). To measure the length of stomatal guard cells, the middle part of the top second leaf, having a length of 3–4 cm, was sampled and soaked in a Carnoy’s fixative solution [its ratio of anhydrous ethanol to glacial acetic acid was 3:1 (v/v)] until all leaf sections were completely discolored (He et al., 2014). Finally, they were rinsed with distilled water, and the lengths of stomatal guard cells of closed stomas were measured under a 400× field Olympus microscope (Olympus DP71, Tokyo, Japan). Five stomas per leaf section were randomly selected and measured in this way, from 11 different leaves of diploid or tetraploid barley plants, respectively, for a total of 55 replicates for each. The stomatal density was estimated by counting the number of stomata in each field under Evos FL Auto 2 (Invitrogen) with parameters of Objective: 20×, Light source: Trans, Mode: simple, and Camera: color. Five observation fields per leaf were evenly distributed in each leaf, and there were three different leaves of diploid or tetraploidbarley plants, respectively, for a total of 15 replicates for each.
Photosynthetic Pigment Extraction and Quantification
The extraction of photosynthetic pigments was mainly according to Arnon (1949), Porra (2002), and Cao et al. (2018). Briefly, the fresh (top) second leaves of diploid and tetraploid barley plants were cut into pieces, and then submerged in 80% (v/v) acetone for 3–5 min, in the dark, at room temperature. Then, their chlorophyll a (Chl a), chlorophyll b (Chl b), and carotenoid (Car) contents were measured with a spectrophotometer (PuXi Tong Yong T6 new century, Beijing, China) at 663, 645, and 470 nm, respectively. Three biological replicates were used for each sample.
Measurement of Photosynthetic Parameters
Five photosynthetic parameters, namely net photosynthetic rate (Pn) estimated by CO2 uptake (it is also represented by “A” in the equipment), stomatal conductance (Gs; it is also represented by “gsw” in the equipment), intercellular CO2 concentration (Ci) and transpiration rate (Tr; it is also represented by “E” in the equipment), were each measured by a LI-6800 portable photosynthesis system (LI-COR, United States; Farquhar et al., 1980). To assess diurnal variation in photosynthesis, measurements were taken every 2 h from 7:30 AM to 5:30 PM under natural light conditions on a sunny day. The light- and CO2-response curves were constructed by using photosynthesis v1.0 software (Long and Bernacchi, 2003). The maximum net photosynthetic rate (Pmax) estimated by CO2 uptake (it is also represented by “Amax” in the software), light saturation point (LSP) and light compensation point (LCP), and apparent quantum efficiency (AQE) were calculated from the light-responsive curve. The maximum RuBP saturated rate of carboxylation (Vc,max) and maximum rate of electron transport (Jmax) were calculated from the CO2-response curve. The fluorescence was measured automatically, and the maximal photochemical efficiency of PSII in light (Fv’/Fm’) was recorded directly using the LI-6800. The top second leaf was used for all measurements above, with 10 biological replicates for each sample.
RNA Isolation, cDNA Library Construction, and Sequencing
Total RNA was isolated by using the Trizol Reagent (Invitrogen, Carlsbad, CA, United States) and following its manufacturer’s instructions. Each sample’s RNA concentration and quality were measured by a Nano Drop spectrophotometer (Thermo Scientific). The RNA integrity was evaluated with a 2,100 Bioanalyzer (Agilent Technologies, Palo Alto, CA, United States). To construct each cDNA library, 3 μg of RNA was used and its sequencing was performed on a Hi-Seq platform (Illumina) by Shanghai OE Biotech CO., Ltd., for which 150 bp paired-end reads were generated. Three biological replicates were used for each sample.
Identification of DEGs and Their Functional Analysis
Clean data were obtained by removing those reads containing adapter sequences and any low-quality reads from the raw data, using the Trimmomatic tool (Bolger et al., 2014). Both Q30 and GC information variables were calculated to evaluate the cleaned dataset, for which clean nucleotide sequence data ranged from 6.73 to 6.87 Gb (all >6 Gb), and the Q30 percentages were all >90% (Supplementary Table S1). Spearman correlations and principal component analysis (PCA) further showed that the three biological replicates per sample met the requirements for a robust analysis (all over 0.96; Supplementary Figure S1). The clean reads were aligned to the reference genome using the hisat2 tool (Kim et al., 2015), and barley’s genome data were directly downloaded from the Ensembl Plants website.1 Putative transcript annotations were performed by searching the listed annotations of high confidence (HC) genes.2 The mapped reads and gene expression level were assembled using the htseq-count script (Anders et al., 2015) and Cufflinks (Roberts et al., 2011), respectively. The fragments per kilo bases per million reads (FPKM) was used to evaluate the level of gene expression. The differentially expressed genes (DEGs) were identified by DESeq (v1.26.0, European Molecular Biology Laboratory, Heidelberg, Germany), as described by Li et al. (2019), designated as those genes with a threshold fold change (FC) ≥ 2 and an p < 0.05. Hierarchical analysis was applied to these DEGs in Cluster 3.0 software after their normalization. Gene Ontology (GO) and Kyoto Encyclopedia of Genes and Genomes (KEGG) enrichment analysis of the DEGs (Simon Anders) were used to predict their respective functions by searching the GO3 and KEGG4 databases.
Validation by qRT-PCR
To validate the RNA-Seq data and confirm their expression profiles, all DEGs involved in the pathway of photosynthesis-antenna proteins were selected for a qRT-PCR analysis, since this pathway was the most enriched one. The sequences of these genes were directly downloaded from the Ensembl Plants website. The primers were designed by using Primer-BLAST in NCBI, and thee can be found in Supplementary Table S2. The first-strand cDNA was synthesized with the PrimeScript™ II 1st Strand cDNA Synthesis Kit (Takara, Japan), according to the manufacturer’s instructions. The quantitative PCR (qPCR) reactions were performed on the 7,500 Fast platform (Applied Biosystems, United States) using the PowerUp™ SYBR™ Green Master Mix (Applied Biosystems). Each 20-μl reaction contained 10 μl of the PowerUp™ SYBR™ Green Master Mix, 2 μl of 5× diluted cDNA, 0.8 μl of each forward and reverse primer (10 μM). Each reaction was pre-denatured at 50°C for 20 s, and then at 95°C for 10 min, followed by 40 cycles of 95°C for 15 s and 60°C for 1 min. The melting curves were conducted after these 40 cycles. A given gene’s expression level was first normalized according to a reference gene, HvGAPDH (Quan et al., 2016), and its amplification efficiency evaluated in LinReg software (Ramakers et al., 2003). Three biological replicates were used for each qPCR, for which the data analysis and statistics were carried out as described by Chen et al. (2013).
Statistical Analysis of Experimental Data
To test for differences in the means of stomatal guard cell length, chlorophyll content, photosynthetic variables, and gene expression levels’ data by qPCR, the Student’s t-test was used in MS Excel 2010 or Fisher’s least significant difference (LSD) test was implemented in SPSS 21.0 software.
Results
Identification of Diploid and Tetraploid Barley Plants
Cytological anatomy analysis confirmed the presence of 14 chromosomes (2n = 2x = 14) for the diploid barley plants, and corresponding doubled chromosomes (2n = 4x = 28) for the tetraploid barley plants (Figure 1A). The average length of stomatal guard cells of tetraploid barley (71.0 ± 7.3 μm) was greater than that of diploid barley (49.3 ± 3.3 μm), while the stomatal density was in the opposite situation (the stomatal density of dipoid barley was 35.7 ± 5.8 stomatas per field, while the tetraploid was 20.5 ± 3.2 stomatas per field; Figure 1B; Supplementary Figure S2). It seemed that leaves were thicker in the tetraploid than diploid barley plants by color and texture, and it was consist with the trait of shoot dry weight (Figure 1C; Supplementary Table S3). While the diploid barley grew more rapidly (reaching the 5-leaf stage) than did the tetraploid barley (it reached the four-leaf stage only; Figure 1C).
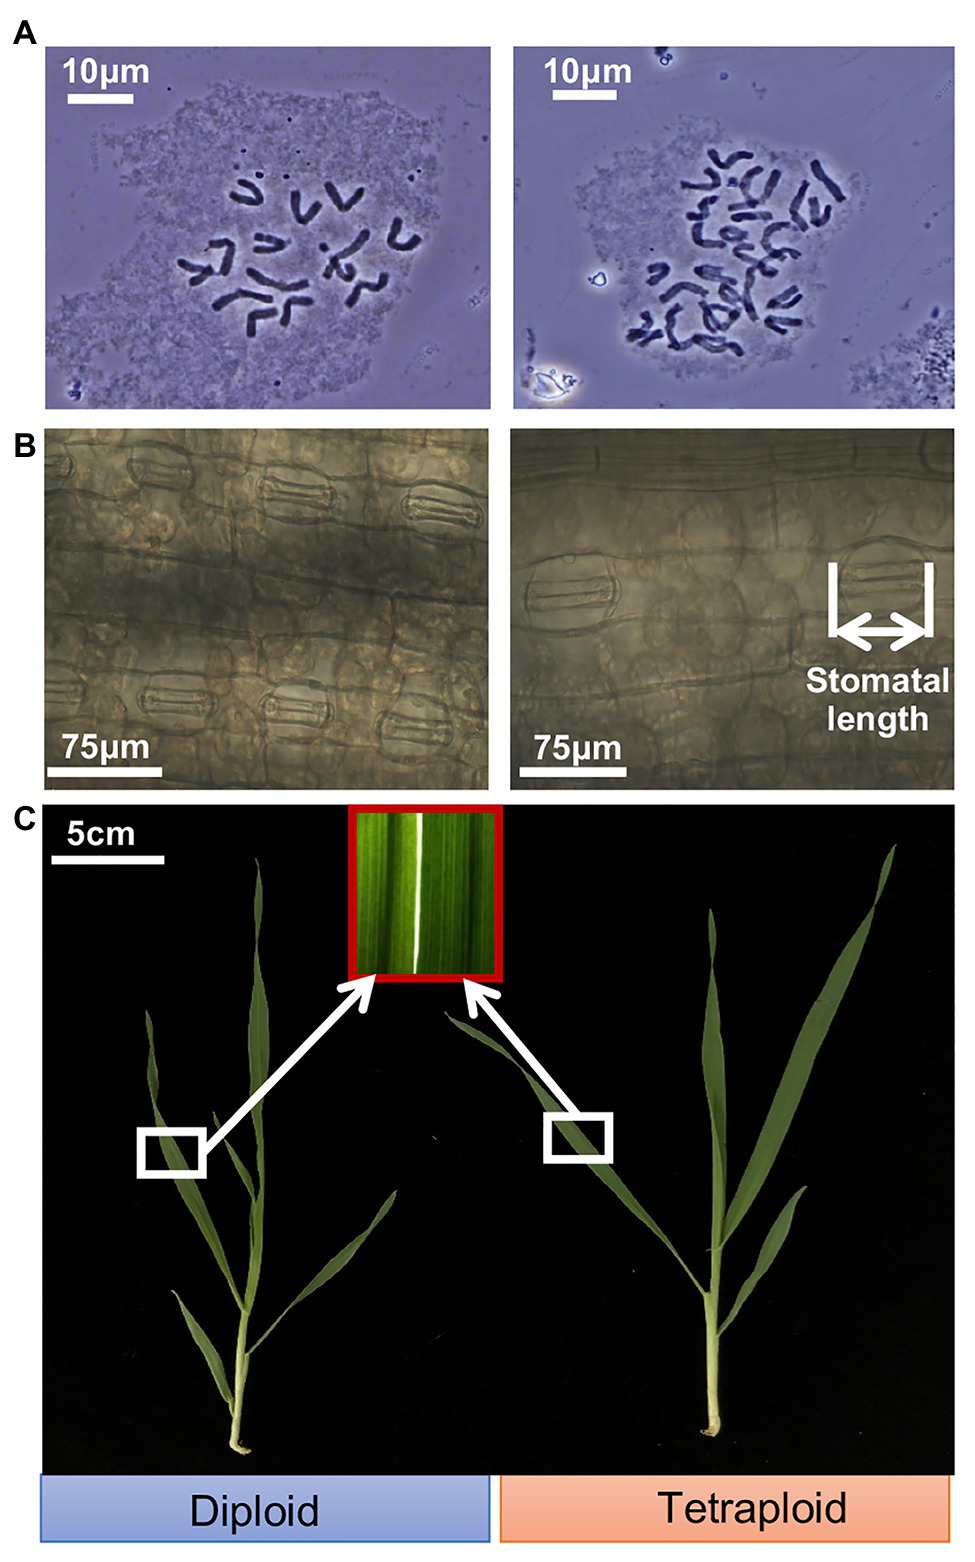
Figure 1. Ploidy analysis and appearance of shoots of the diploid and tetraploid barley seedlings. (A) Chromosomes of the diploid (2n = 14) and tetraploid (2n = 28) barley at mitotic metaphase. (B) Closed stomas and straightened stomatal guard cells. (C) Shoots of the diploid and tetraploid barley seedlings.
Photosynthetic Pigment Contents
This analysis revealed that all the pigments – chlorophyll a (Chl a), chlorophyll b (Chl b), total chlorophyll [Chl (a+b)] and carotenoid (Car) contents – were significantly higher in the tetraploid barley than diploid barley plants (Table 1). According to these differences, the rank order of increased percentage for the four pigments was Chl a > Chl (a+b) > Chl b > Car.
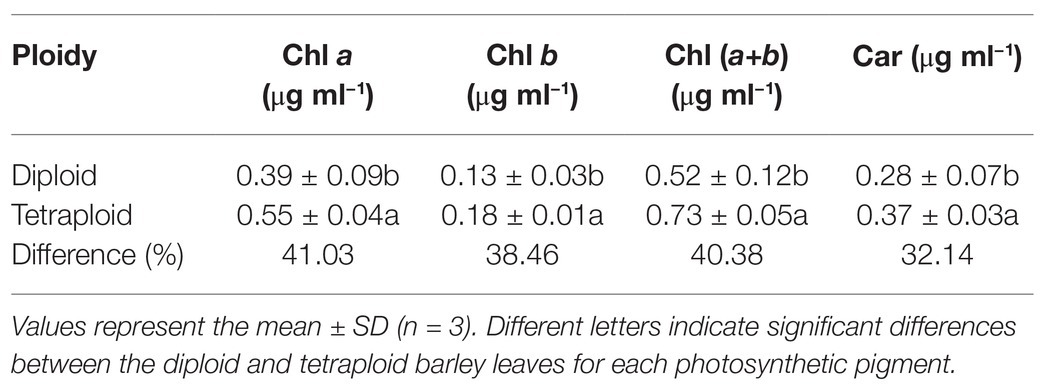
Table 1. Photosynthetic pigment contents in the diploid and tetraploid barley leaves.
Diurnal Variation of Photosynthesis
The trend in diurnal variation of photosynthesis was quite similar in the diploid and tetraploid barley plants (Figure 2). For the net photosynthesis rate (Pn) curve, its values increased from 7:30 AMonward, peaking at 11:30 AM, but then gradually declined until 5:30 PM in the tetraploid barley (Figure 2A). Although the Pn of diploid barley likewise peaked at 11:30 AM, a plateau was apparent at noon as well. In addition, the Pn of tetraploid barley exceeded that of diploid barley at each time point after 9:30 AM. Concerning the stomatal conductance (Gs) curve, it closely matched the Pn curve except for a plateau in tetraploid barley lasting from 11:30 PM to 3:30 PM (Figure 2B), and the Gs was higher in tetraploid than diploid barley at all sampled times. Similarly, the transpiration rate (Tr) curve followed the same trend in both diploid and tetraploid barley, but with peaks at 3:30 PM and being higher in the tetraploid barley at the three time points (11:30 AM to 3:30 PM; Figure 2D). Unlike those three curves, intercellular CO2 concentration (Ci) first gradually declined, but after reaching its lowest point, it increased gradually (Figure 2C). However, the Ci of tetraploid barley increased somewhat later in the daytime than did diploid barley, and the Ci values of diploid barley at all the time points except 7:30 AM and 1:30 PM were significantly higher than those of tetraploid barley.
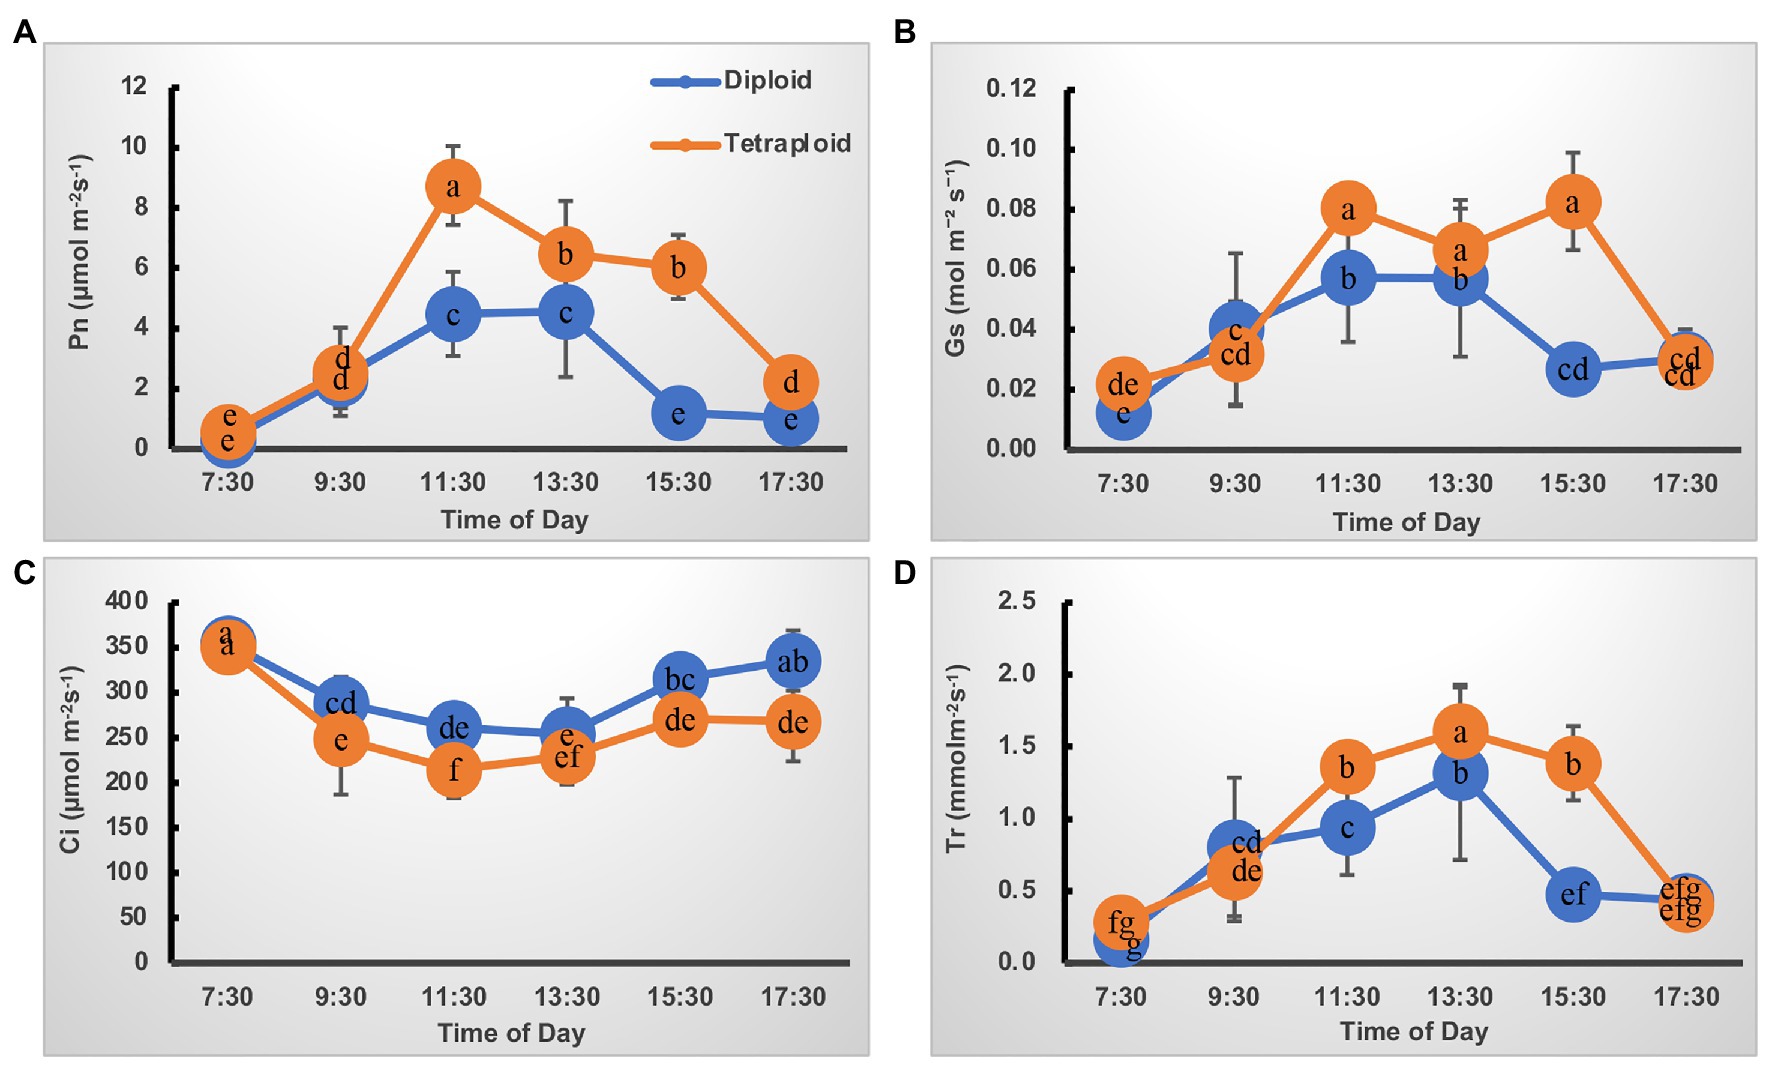
Figure 2. Diurnal variation of photosynthetic characteristics of the diploid and tetraploid barley plants. (A) Net photosynthetic rate (Pn). (B) Stomatal conductance (Gs). (C) Intercellular CO2 concentration (Ci). (D) Transpiration rate (Tr). Different letters represent significant differences (of Pn or Tr or Gs or Ci) between diploid and tetraploid barley at different time points (n = 10).
Response of Photosynthesis to Irradiation and CO2 Concentration
The light- and CO2-response curves of diploid and tetraploid barley are presented in Figure 3. With greater light irradiation and higher CO2 concentration, the Pn increased rapidly before 1,000 μmol m−2 s−1 of photosynthetic photon flux density (PPFD) and 600 μmol mol−1 of CO2, respectively, and then each plateaued. The tetraploid barley showed a significantly higher Pn than did diploid barley when PPFD attained 1,000 μmol m−2 s−1 or more (Figure 3A), and also a significantly higher Pn than the diploid barley when ambient Ca was at least 200 μmol mol−1 (Figure 3B). Based on the fitted light-and CO2-response curves, all four parameters – maximum net photosynthetic rate (Pmax), light saturation point (LSP), maximum rate of RuBP carboxylation (Vc,max) and maximum rates of electron transport (Jmax) – were significantly higher in the tetraploid than diploid barley leaves (Table 2). The light compensation point (LCP), apparent quantum yield (AQY), and maximal photochemical efficiency of PSII in light (Fv’/Fm’) were similar between the diploid and tetraploid barley plants (Table 2).
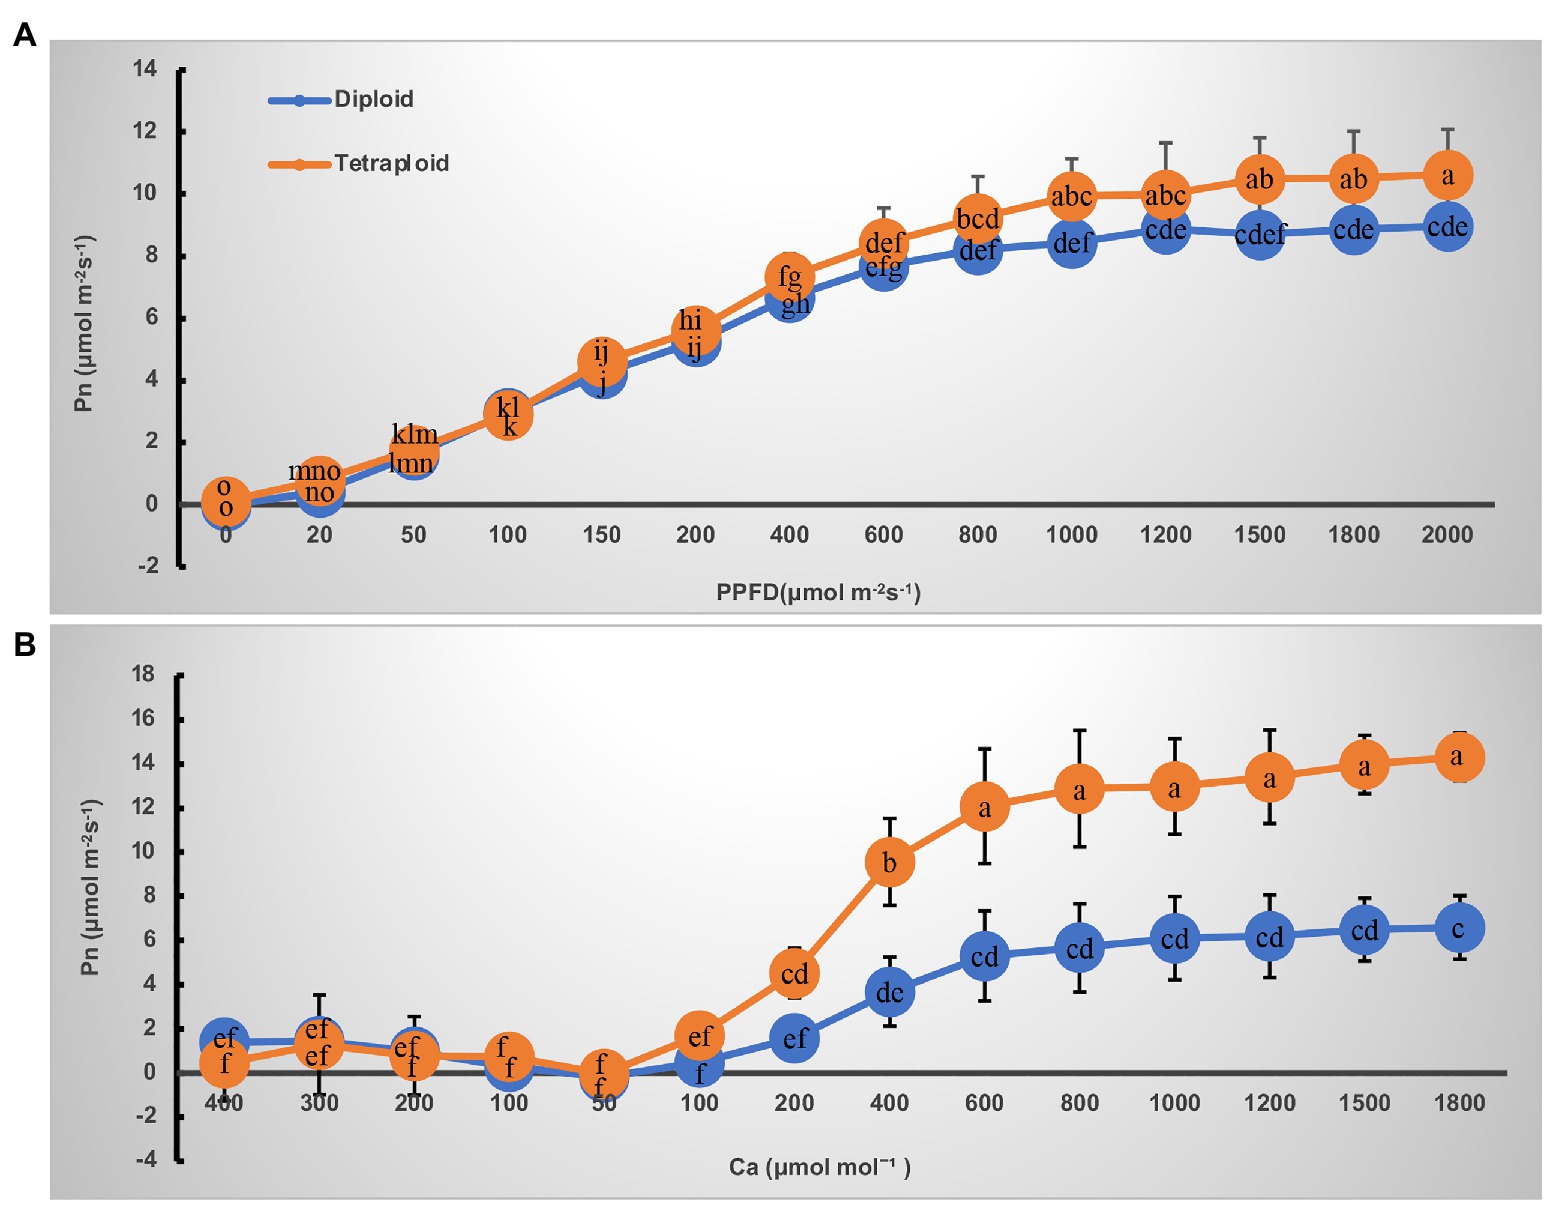
Figure 3. Curves of net photosynthetic rate (Pn) response to irradiance and CO2 in leaves of the diploid and tetraploid barley. (A) Response to photosynthetic photon flux density (PPFD). (B) Response to ambient CO2 concentration (Ca). Different letters represent significant differences of Pn between diploid and tetraploid barley under varying supply of PPFD or Ca (n = 10).
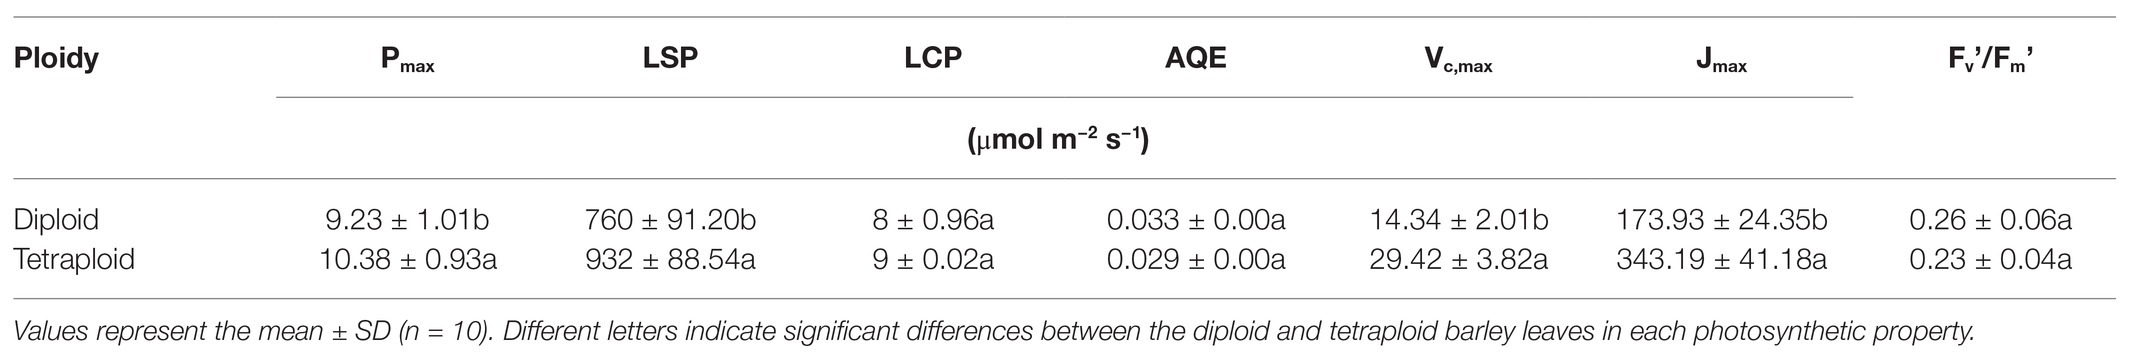
Table 2. Leaf photosynthetic properties in the diploid and tetraploid barley.
Differentially Expressed Genes of Tetraploid Barley vs. Diploid Barley
Considering the higher photosynthesis activity at noontime and the higher Pn in the tetraploid barley, samples were taken at ca. 11:30 AM for the RNA-Seq (these data were deposited with NCBI under submission ID: SUB7735025 and bioProject ID: PRJNA642324). The normalized expression of mRNAs was compared between the diploid and tetraploid barley. The clustering results showed that genes grouped into two categories in the diploid and tetraploid barley samples (Figure 4A). In total, 793 genes displayed differential expression levels between diploid and tetraploid barley, of which 580 were upregulated and 213 were downregulated in tetraploid barley vis-à-vis diploid barley (Figure 4B). These DEGs were found located across all barley chromosomes yet they were most abundant on Chromosome 2 (Supplementary Material of DEGs).
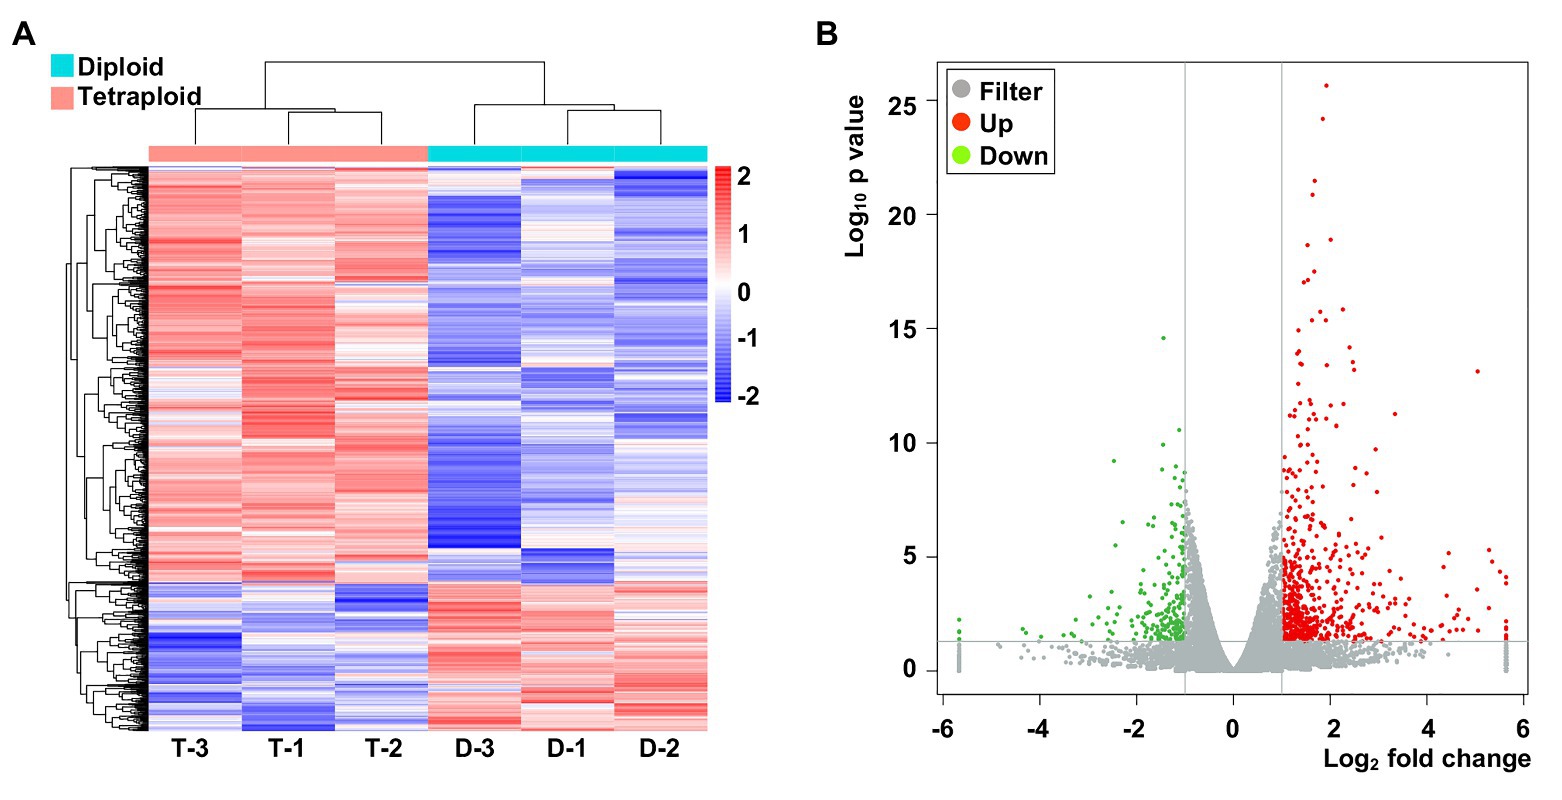
Figure 4. The abundance of specifically expressed mRNA transcripts in the six barley samples and differentially expressed genes (DEGs). (A) Cluster of specifically expressed mRNAs, for which D-1,2,3 denote three biological replicates of diploid barley; T-1,2,3 denote three biological replicates of tetraploid barley. (B) Volcano of DEGs in the tetraploid barley comparing to the diploid barley.
Functional Analysis of DEGs in the Tetraploid Barley
To analyze the potential functions of the DEGs in tetraploid barley relative to diploid barley, GO and KEGG analyses were conducted. GO analysis of upregulated genes determined that 22 terms were enriched across all the three categories, though mostly in those of biological process and molecular function, in which the three terms of oxidation-reduction process (GO id: 05114), defense response (GO id: 0006952), and isocitrate lyase activity (GO id: 0004451) were evidently the three most enriched (Figure 5A). There were 25 terms enriched for downregulated genes with similar characteristics of upregulated genes, while the three most enriched terms were 2-phytyl-1,4-naphthoquinone methyltransferase activity (GO id: 0052624), 4-hydroxy-tetrahydrodipicolinate reductase (GO id: 0008839), and the 2 iron, 2 sulfur cluster binding (GO id: 0051537; Figure 5B).
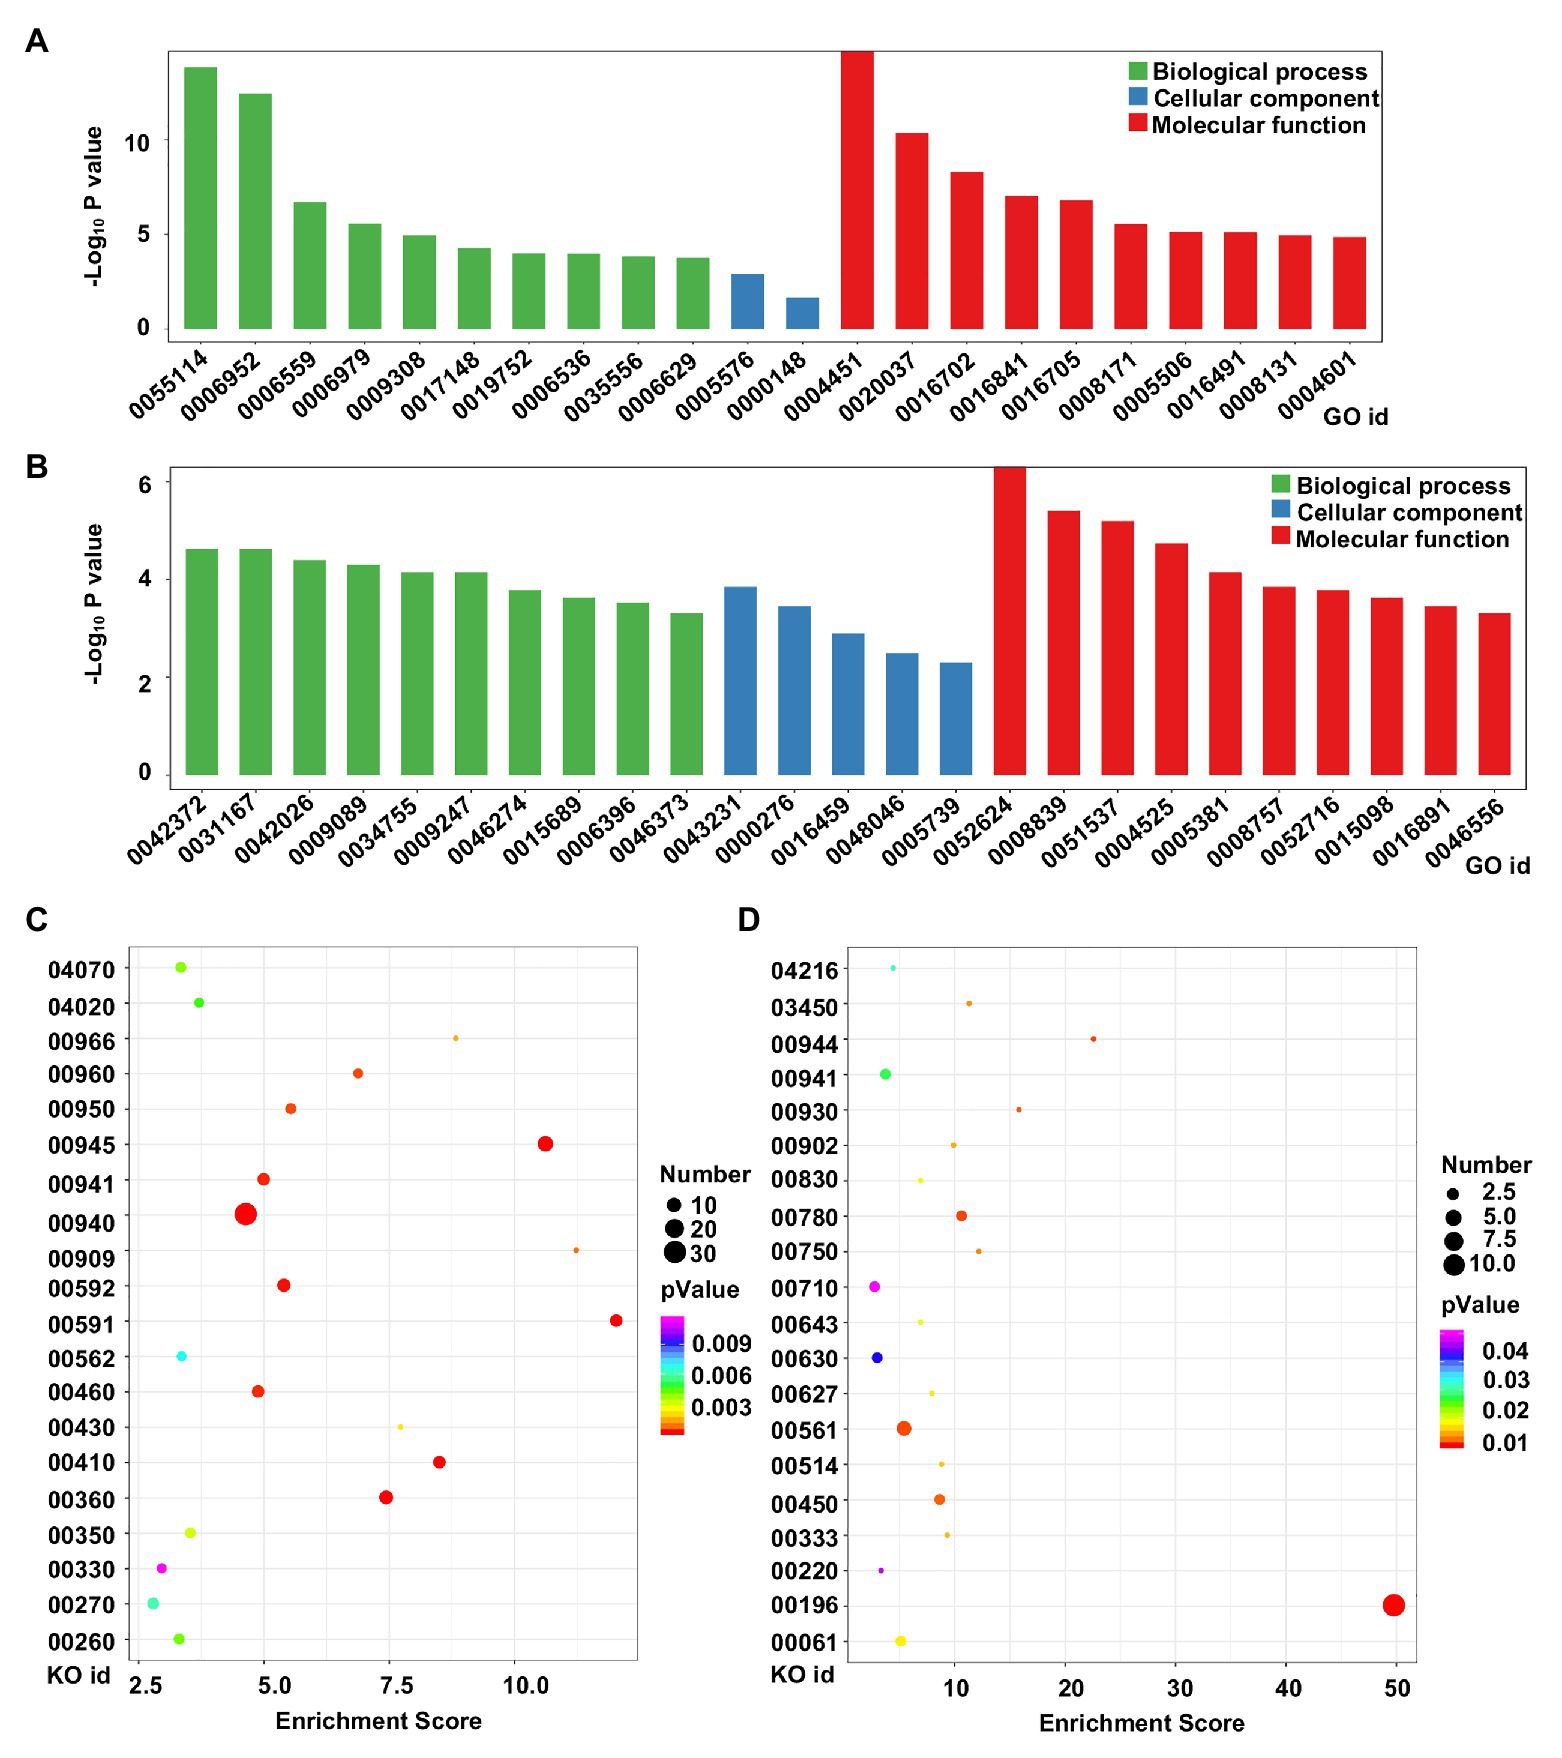
Figure 5. Functional analysis of DEGs between diploid and tetraploid barley. (A) Gene Ontology (GO) analysis of upregulated genes; (B) GO analysis of downregulated genes; (C) Kyoto Encyclopedia of Genes and Genomes (KEGG) analysis of upregulated genes; (D) KEGG analysis of downregulated genes. For the GO ids, 0055114: oxidation-reduction process; 0006952: defense response; 0006559: L-phenylalanine catabolic process; 0006979: response to oxidative stress; 0009308: amine metabolic process; 0017148: negative regulation of translation; 0019752: carboxylic acid metabolic process; 0006536: glutamate metabolic process; 0035556: intracellular signal transduction; 0006629: lipid metabolic process; 0005576: extracellular region; 0000148: 1,3-beta-D-glucan synthase complex; 0004451: isocitrate lyase activity; 0020037: heme binding; 0016702: oxidoreductase activity, acting on single donors with the incorporation of molecular oxygen, incorporation of two atoms of oxygen; 0016841: ammonia-lyase activity; 0016705: oxidoreductase activity, acting on paired donors, with incorporation or reduction of molecular oxygen; 0008171: O-methyltransferase activity; 0005506: iron ion binding; 0016491: oxidoreductase activity; 0008131: primary amine oxidase activity; 0004601: peroxidase activity; 0042372: phylloquinone biosynthetic process; 0031167: rRNA methylation; 0042026: protein refolding; 0009089: lysine biosynthetic process via diaminopimelate; 0034755: iron ion transmembrane transport; 0009247: glycolipid biosynthetic process; 0046274: lignin catabolic process; 0015689: molybdate ion transport; 0006396: RNA processing; 0046373: L-arabinose metabolic process; 0043231: intracellular membrane-bounded organelle; 0000276: mitochondrial proton-transporting ATP synthase complex, coupling factor F(o); 0016459: myosin complex; 0048046: apoplast; 0005739: mitochondrion; 0052624: 2-phytyl-1,4-naphthoquinone methyltransferase activity; 0008839: 4-hydroxy-tetrahydrodipicolinate reductase; 0051537: 2 iron, 2 sulfur cluster binding; 0004525: ribonuclease III activity; 0005381: iron ion transmembrane transporter activity; 0008757: S-adenosylmethionine-dependent methyltransferase activity; 0052716: hydroquinone: oxygen oxidoreductase activity; 0015098: molybdate ion transmembrane transporter activity; 0016891: endoribonuclease activity, producing 5'-phosphomonoesters; 0046556: alpha-L-arabinofuranosidase activity. For the KO ids, 04070: phosphatidylinositol signaling system; 04020: calcium signaling pathway; 00966: glucosinolate biosynthesis; 00960: tropane, piperidine and pyridine alkaloid biosynthesis; 00950: isoquinoline alkaloid biosynthesis; 00945: stilbenoid, diarylheptanoid and gingerol biosynthesis; 00941: flavonoid biosynthesis; 00940: phenylpropanoid biosynthesis; 00909: sesquiterpenoid and triterpenoid biosynthesis; 00592: alpha-linolenic acid metabolism; 00591: linoleic acid metabolism; 00562: inositol phosphate metabolism; 00460: cyanoamino acid metabolism; 00430: taurine and hypotaurine metabolism; 00410: beta-alanine metabolism; 00360: phenylalanine metabolism; 00350: tyrosine metabolism; 00330: arginine and proline metabolism; 00270: cysteine and methionine metabolism; 00260: glycine, serine, and threonine metabolism; 04216: ferroptosis; 03450: non-homologous end-joining; 00944: flavone and flavonol biosynthesis; 00930: caprolactam degradation; 00902: monoterpenoid biosynthesis; 00830: retinol metabolism; 00780: biotin metabolism; 00750: vitamin B6 metabolism; 00710: carbon fixation in photosynthetic organisms; 00643: styrene degradation; 00630: glyoxylate and dicarboxylate metabolism; 00627: aminobenzoate degradation; 00561: glycerolipid metabolism; 00514: other types of O-glycan biosynthesis; 00450: selenocompound metabolism; 00333: prodigiosin biosynthesis; 00220: arginine biosynthesis; 00196: photosynthesis-antenna proteins; 00061: fatty acid biosynthesis.
KEGG analysis indicated that the top-20 enriched pathways of upregulated genes were mainly related to metabolism or biosynthesis, with the three pathways of phenylpropanoid biosynthesis (KO id: 00940), stilbenoid, diarylheptanoid, and gingerol biosynthesis (KO id: 00945), and phenylalanine metabolism (KO id: 00360) harboring the most the most DEGs, while the linoleic acid metabolism (KO id: 00591), sesquiterpenoid, and triterpenoid biosynthesis (KO id: 00909), and stilbenoid, diarylheptanoid, and gingerol biosynthesis (KO id: 00945) pathways featured the highest rich factors (Figure 5C). The top-20 enriched pathways of downregulated genes were more varied and complicated; however, the pathway of photosynthesis-antenna proteins (KO id: 00196) included the most DEGs and had the highest rich factor (Figure 5D).
Validation by qRT-PCR for RNA-Seq
All the DEGs involved in the photosynthesis-antenna proteins, with the exception of HORVU1Hr1G088930 because of its unstable detection by qPCR, were selected for validation by qPCR. These comprised HORVU1Hr1G088900, HORVU1Hr1G088920, HORVU1Hr1G089180, HORVU6Hr1G016850, HORVU6Hr1G016880, HORVU6Hr1G016940, HORVU6Hr1G091650, HORVU6Hr1G091660, HORVU7Hr1G040370, and HORVU7Hr1G040380, all of which were related to the Lhcb1 component (Figure 6A). These qPCR results confirmed all 10 genes were downregulated in the tetraploid barley compared with the diploid barley, albeit not always significantly, a pattern basically consistent with the corresponding RNA-Seq data (Figure 6B).
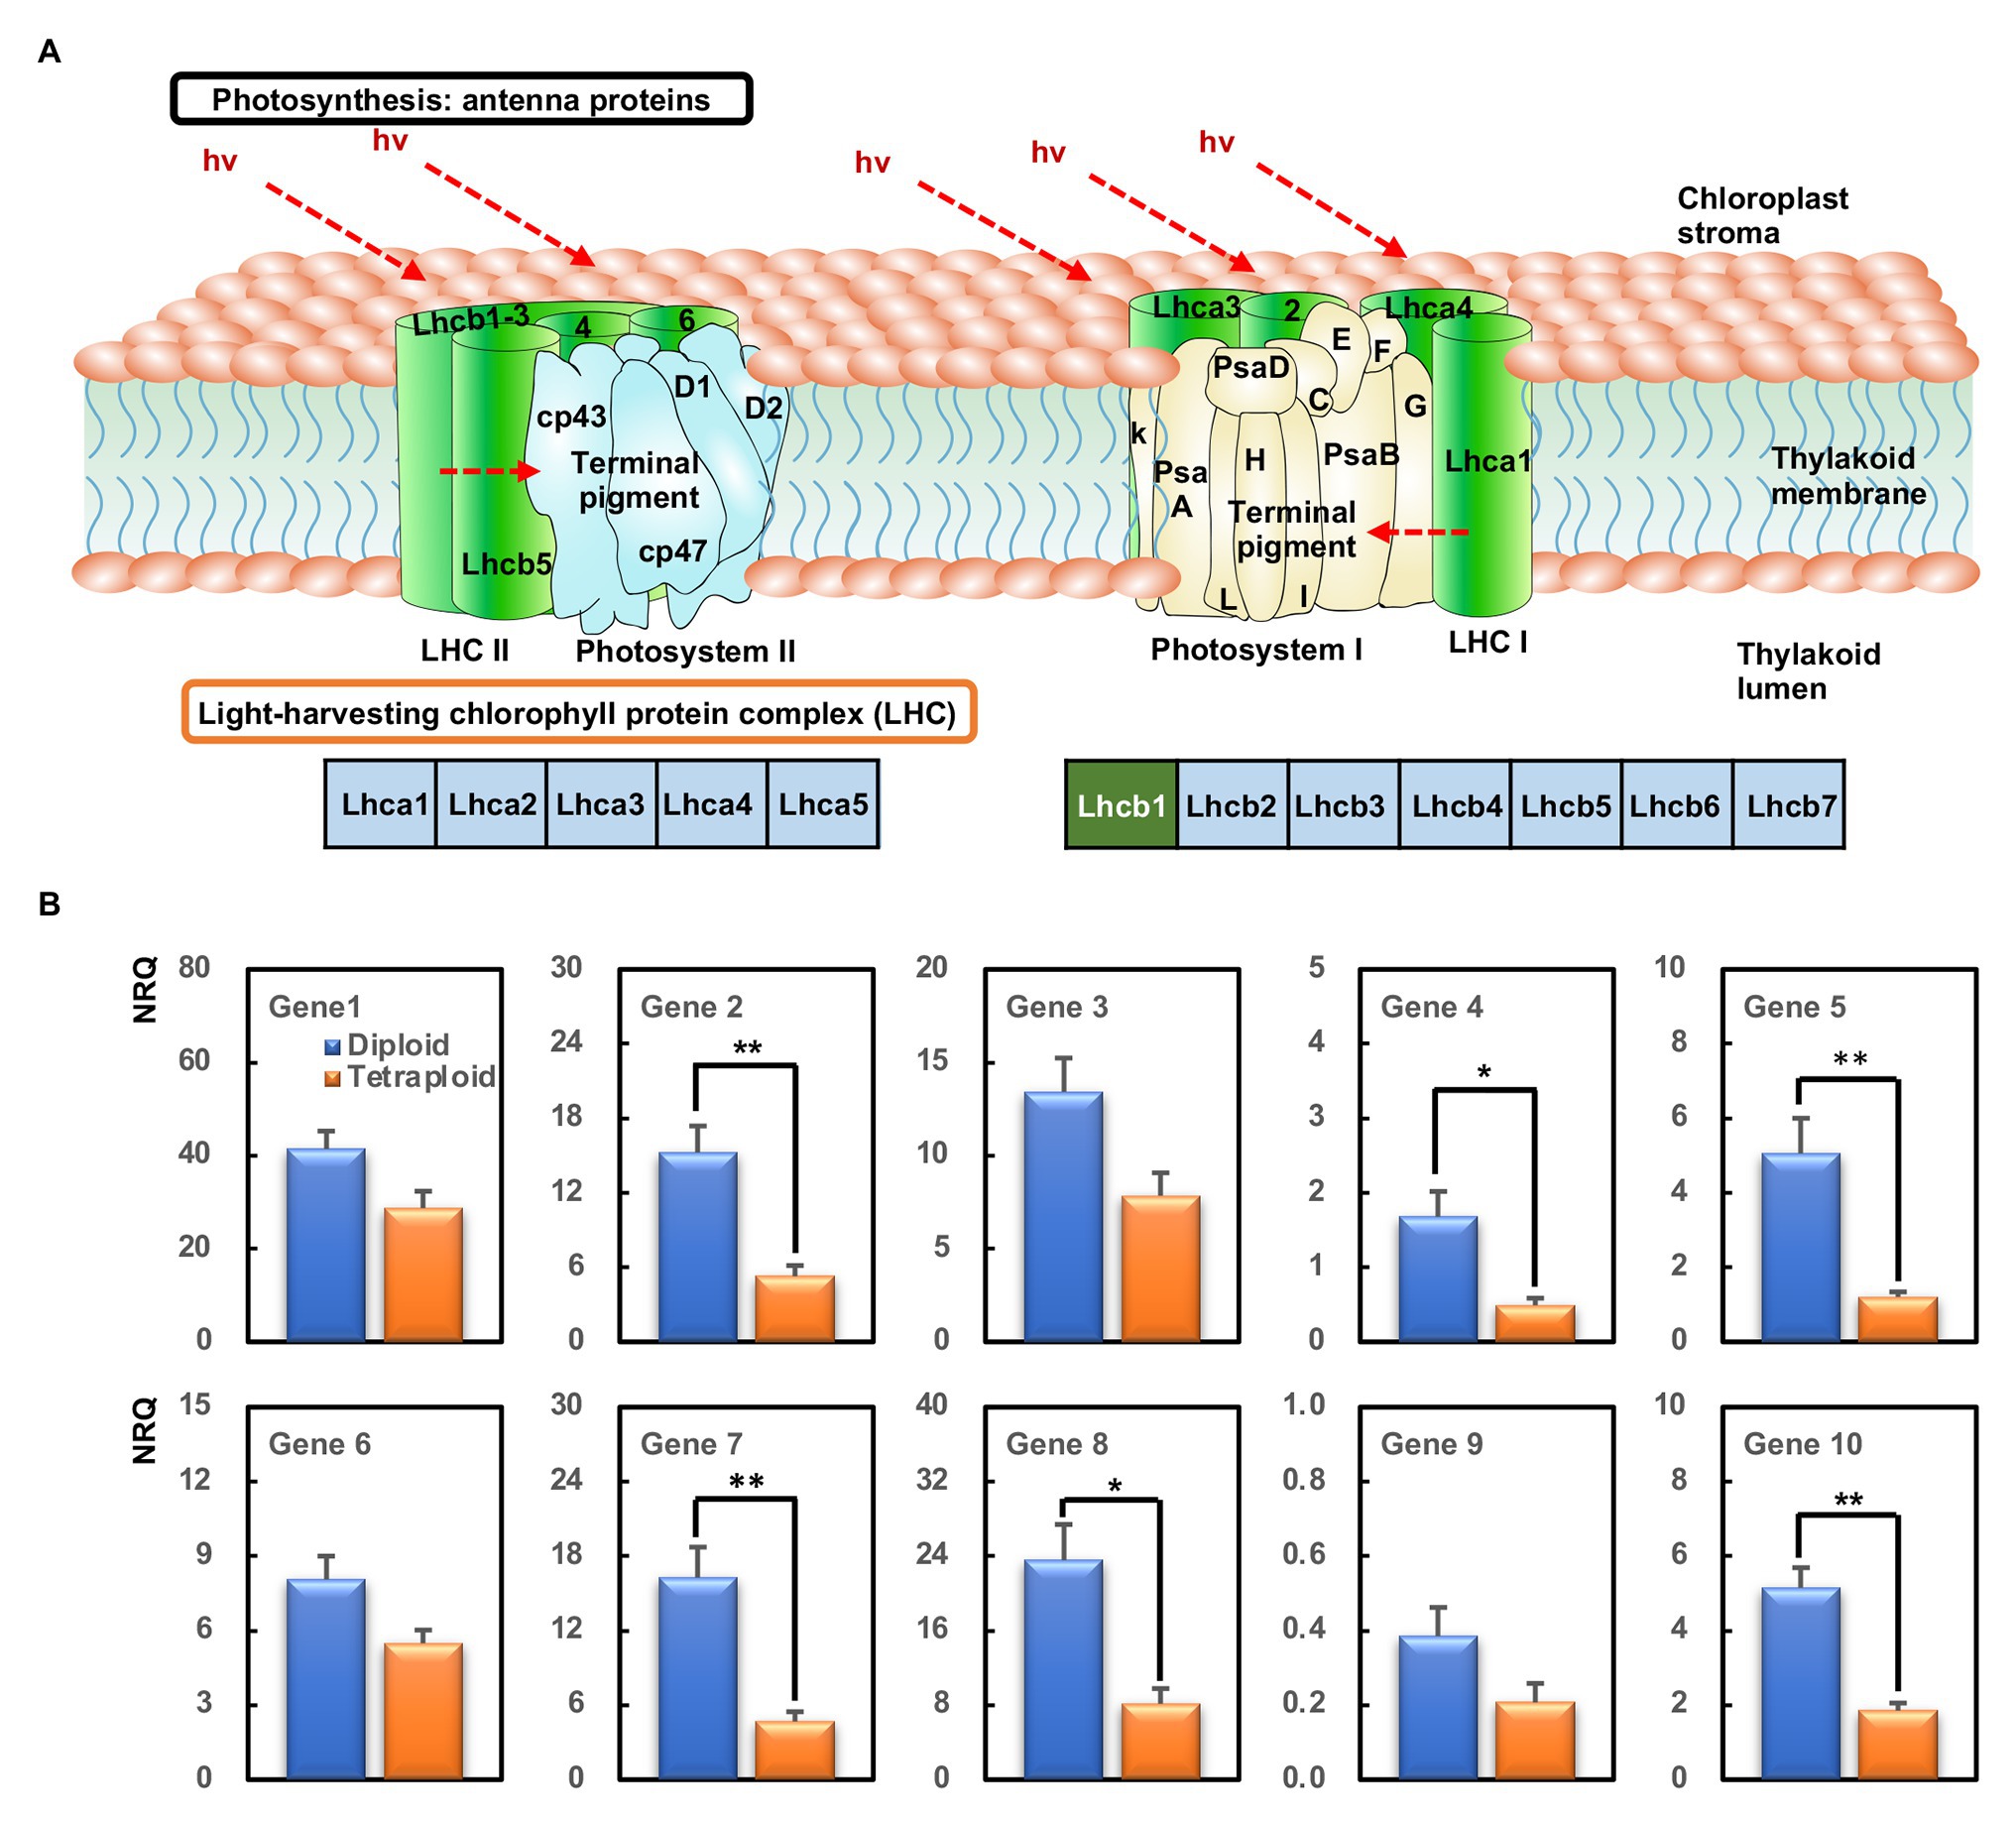
Figure 6. The most enriched KEGG pathways and genes’ expression analyzed by quantitative PCR (qPCR). (A) The KEGG pathway of photosynthesis-antenna proteins. The green box within Lhcb1 means those downregulated. (B) Relative gene expression [normalized relative quantity (NRQ)] of DEGs between the diploid and tetraploid barley. The ** indicates significantly differential expression between the diploid and tetraploid barley in a t-test at 0.01 level and the * at 0.05 level (n = 3); Gene 1, HORVU1Hr1G088900; Gene 2, HORVU1Hr1G088920; Gene 3, HORVU1Hr1G089180; Gene 4, HORVU6Hr1G016850; Gene 5, HORVU6Hr1G016880; Gene 6, HORVU6Hr1G016940; Gene 7, HORVU6Hr1G091650; Gene 8, HORVU6Hr1G091660; Gene 9, HORVU7Hr1G040370; Gene 10, HORVU7Hr1G040380.
Discussion
Superior Characteristics of Tetraploid Barley for Organ Size and Photosynthesis
Polyploids often feature enlarged organs, including both vegetative and reproductive organs (Otto, 2007). In this research, we found that the leaves of tetraploid barley were thicker than those of diploid barley at this stage (which was confirmed by shoot dry weight), and tetraploid barley also had larger-sized stomata and seeds (Figures 1B,C; Supplementary Figure S2A; Supplementary Table S3). Yet, at a given growth time-point, tetraploid barley had fewer leaves than diploid barley, a finding also observed in Stevia rebaudiana plants (Xiang et al., 2019), and it was thought to arise from occasionally prolonged vegetative growth (Dudits et al., 2016). In addition, other cells were also enlarged alongside the bigger stomatal cells in leaves of tetraploid barley, which had lower stomatal density than those of diploid barley (Figure 2B). A similar trade-off was reported in work done by Padoan et al. (2013).
Chlorophyll is the key photosynthetic pigment in plants, playing critical roles in the photosynthesis of flowering plants (Masuda and Fujita, 2008; Cao et al., 2018). Here, we found that leaf chlorophyll contents of tetraploid barley were significantly increased over those of diploid barley, suggesting that the tetraploid barley might be superior at carrying out photosynthesis (Table 1). Further, diurnal variation in photosynthetic characteristics indicated tetraploid barley performed better than diploid barley in terms of Pn, Gs, and Tr and more Ci consumed, an interpretation confirmed by the light- and CO2-response Pn curves (Figures 2, 3). These results disagree with an early study of barley (Sicher et al., 1984), perhaps because controlled light conditions were used in that research. In our study of barley, the net photosynthetic rate in tetraploids showed significant improvement over diploids when exposed to intense light, but it was similar under exposure to low light. Additionally, the carotenoid contents were also augmented in tetraploid barley, indicating that it might also be superior at quenching the excessive excitation energy, which plays a crucial role in photoprotection combined with downregulation of Lhcb1-encoding genes (Table 1, Figure 6A).
Moreover, several photosynthetic parameters were significantly higher in tetraploid barley, namely Pmax, LSP, Vc,max, and Jmax (Table 2). The higher Pmax and LSP suggested that tetraploid barley was better able to adjust to high light intensity, and the higher Vc,max and Jmax implied tetraploid barley was also more active in carbon assimilation, especially the higher of Jmax would be helpful for improving Vc,max (von Caemmerer and Farquhar, 1981). These results demonstrate that the photosynthetic capacity is stronger in tetraploid than diploid barley plants. It was also observed by Cao et al. (2018), although the Vc,max and Jmax were not significantly higher in the tetraploid.
Subtle Changes in Gene Expression Between Diploid and Tetraploid Barley
To investigate the differences of potential molecular mechanisms between the tetraploid and diploid barley, a transcriptome comparison was conducted for their leaves when photosynthesis was highest. We found that the genes’ expression of these six samples – three for the diploid barley and three for the tetraploid barley – very similar according to Spearman correlations and the PCA (Supplementary Figure S1), with only 793 DEGs uncovered (about 2.9% of all detected genes), indicating minor differences in gene expression between diploid and tetraploid barley overall. This agrees with the findings of several other reports (Lu et al., 2006; Pignatta et al., 2010; Gao et al., 2016; Xiang et al., 2019). Nevertheless, we did uncover a high proportion of upregulated DEGs (73.1%) that appeared among the identified DEGs via global transcriptomic profiling, a percentage higher than in those reports (Gao et al., 2016; Xiang et al., 2019). Further studies await to discern whether more potential genes were ploidy-responsive or activated in tetraploid barley.
Downregulation of Antenna Protein-Encoding Genes in Tetraploid Barley
Light-harvesting antenna complexes and two reaction centers of photosystem II (PSII) and photosystem I (PSI) constitute the system of light-energy capture and photochemistry in natural photosynthesis (Liu and Blankenship, 2019). Antenna proteins are crucial for photosynthesis, by absorbing light, and their higher activity usually augments photosynthesis, especially when light is a limiting resource (Blankenship and Chen, 2013). But these proteins could be harmful at much higher light intensities, especially when the capacity of processing the intermediate products generated by the primary photochemistry lags too far behind (Blankenship and Chen, 2013), in what is known broadly as photoinhibition (Vass et al., 2007). We found that the KEGG pathway of photosynthesis-antenna proteins was significantly enriched, and all genes in this pathway were downregulated in barley. Considering the sampling time used, the higher light density was better for the photosynthesis while the higher temperature was harmful, so there should have been enough or even excess light for the photosynthesis during this time period. Accordingly, reducing the transcription of antenna protein-encoding genes around noon might be more beneficial for photosynthesis in the tetraploid barley compared with the diploid barley. Furthermore, these downregulated genes were all related to the Lhcb1 component in the PSII, indicating that the primary site of photoinhibition might lie within the PSII complex (Vass et al., 2007). We suggest that tetraploid barley harbors different regulation patterns to strike a balance between protection from high-light irradation and maintaining its high photosynthetic capacity.
Conclusion
In this work, a homogenous double haploid and autotetraploid were rapidly produced in barley through in vitro microspore culturing with spontaneously chromosomal doubling. The tetraploid barley plants possess the distinct characteristic of polyploids in having a larger cellular or organ size (i.e., leaf). Photosynthetic capacity was enhanced in tetraploids via increased photosynthetic pigments and photosynthesis (especially under high light intensity). Furthermore, a transcriptomic analysis revealed that subtle changes of global gene expression occur in these tetraploids through small subset (793, ~2.3% of all detected genes) of identified DEGs, of which most (580; 73.1%) were upregulated. The KEGG enriched pathway was closed with the photosynthesis-antenna proteins, in which light-harvesting cholorophyII a/b-binding protein (Lhcb1) components were downregulated in the tetraploid samples. Taken together, our results provide evidences for understanding of enhanced photosynthetic capacity caused by polyploidization in morphology, photosynthetic physiology, and transcriptome in barley.
Data Availability Statement
The original contributions presented in the study are publicly available. This data can be found at: NCBI with submission ID: SUB7735025 and bioProject ID: PRJNA642324.
Author Contributions
YC performed RNA-Seq related experiments, including barley plants’ culturing, sample preparations, cDNA synthesis, and the qPCR. HX performed photochemistry- and photosynthesis-related experiments, including the analysis of photosynthesis pigments, measuring of photosynthetic parameters, and evaluating the light- and CO2-response curves. TH measured the stomatal guard cells’ length. RG conducted the cytological identification of barley chromosomes. GG and RL obtained and provided the stable diploid and tetraploid barley seeds from the microspore cultures. YC and HX prepared and wrote the manuscript. ZC supervised the experiments and revised the manuscript. CL designed the study. All authors contributed to the article and approved the submitted version.
Funding
This work was funded by the Key Technology R&D Project of Shanghai Agriculture-developed with Science & Technology Program, China [grant no. 2018(1-2)]; the National Natural Science Foundation of China (grant no. 31801353); the Natural Science Foundation of Shanghai, China (grant no. 19ZR1417000); and the China Agriculture Research System (grant no. CARS-05-01A-02).
Conflict of Interest
The authors declare that the research was conducted in the absence of any commercial or financial relationships that could be construed as a potential conflict of interest.
Acknowledgments
We thank Nigel G. Halford (Rothamsted Research, United Kingdom) for his critical reading of the manuscript. We also thank the charlesworth group for providing the service of proofreading of the manuscript.
Supplementary Material
The Supplementary Material for this article can be found online at: https://www.frontiersin.org/articles/10.3389/fpls.2021.626916/full#supplementary-material
Footnotes
1. http://plants.ensembl.org/Hordeum_vulgare/Info/Index?db=core
2. http://webblast.ipk-gatersleben.de/barley_ibsc/downloads/Hv_IBSC_PGSB_r1_HighConf.gtf.gz
References
Anders, S., Pyl, P. T., and Huber, W. (2015). HTSeq-a Python framework to work with high-throughput sequencing data. Bioinformatics 31, 166–169. doi: 10.1093/bioinformatics/btu638
Arias, S., and Bhatia, S. K. (2015). “Barley” in Medical applications for biomaterials in Bolivia. Cham: Springer.
Arnon, D. (1949). Copper enzymes in isolated chloroplasts. Polyphenoloxidase in Beta vulgaris. Plant Physiol. 24, 1–15. doi: 10.1104/pp.24.1.1
Blankenship, R. E., and Chen, M. (2013). Spectral expansion and antenna reduction can enhance photosynthesis for energy production. Curr. Opin. Chem. Biol. 17, 457–461. doi: 10.1016/j.cbpa.2013.03.031
Bolger, A. M., Lohse, M., and Usadel, B. (2014). Trimmomatic: a flexible trimmer for Illumina sequence data. Bioinformatics 30, 2114–2120. doi: 10.1093/bioinformatics/btu170
Cao, Q., Zhang, X., Gao, X., Wang, L., and Jia, G. (2018). Effects of ploidy level on the cellular, photochemical and photosynthetic characteristics in Lilium FO hybrids. Plant Physiol. Biochem. 133, 50–56. doi: 10.1016/j.plaphy.2018.10.027
Castillo, A. M., Cistué, L., Vallés, M. P., and Soriano, M. (2009). Chromosome doubling in monocots. Advances in haploid production in higher plants. Netherlands: Springer.
Chen, Z., Huang, J., Muttucumaru, N., Powers, S. J., and Halford, N. G. (2013). Expression analysis of abscisic acid (ABA) and metabolic signalling factors in developing endosperm and embryo of barley. J. Cereal Sci. 58, 255–262. doi: 10.1016/j.jcs.2013.06.009
Chen, Z., Lu, R., Zou, L., Du, Z., Gao, R., He, T., et al. (2012). Genetic diversity analysis of barley landraces and cultivars in the Shanghai region of China. Genet. Mol. Res. 11, 644–650. doi: 10.4238/2012.March.16.2
Dong, B., Wang, H., Liu, T., Cheng, P., Chen, Y., Chen, S., et al. (2017). Whole genome duplication enhances the photosynthetic capacity of Chrysanthemum nankingense. Mol. Gen. Genomics. 292, 1247–1256. doi: 10.1007/s00438-017-1344-y
Dudits, D., Török, K., Cseri, A., Paul, K., Nagy, A. V., Nagy, B., et al. (2016). Response of organ structure and physiology to autotetraploidization in early development of energy willow Salix viminalis. Plant Physiol. 170, 1504–1523. doi: 10.1104/pp.15.01679
Eliška, J., Vladimíra, N. H., and Martin, D. (2015). Photosynthetic characteristics of three ploidy levels of Allium oleraceum L. (Amaryllidaceae) differing in ecological amplitude. Plant Spec. Biol. 30, 212–224. doi: 10.1111/1442-1984.12053
Farquhar, G. D., von Caemmerer, S., and Berry, J. A. (1980). A biochemical model of photosynthetic CO2 assimilation in leaves of C3 species. Planta 149, 78–90. doi: 10.1007/BF00386231
Gao, R., Guo, G., Fang, C., Huang, S., Chen, J., Lu, R., et al. (2018). Rapid generation of barley mutant lines with high nitrogen uptake efficiency by microspore mutagenesis and field screening. Front. Plant Sci. 9:450. doi: 10.3389/fpls.2018.00450
Gao, R., Wang, H., Dong, B., Yang, X., Chen, S., Jiang, J., et al. (2016). Morphological, genome and gene expression changes in newly induced autopolyploid Chrysanthemum lavandulifolium (Fisch. ex Trautv.) Makino. Int. J. Mol. Sci. 17:1690. doi: 10.3390/ijms17101690
Gao, S., Yan, Q., Chen, L., Song, Y., Li, J., Fu, C., et al. (2017). Effects of ploidy level and haplotype on variation of photosynthetic traits: novel evidence from two Fragaria species. PLoS One 12:e0179899. doi: 10.1371/journal.pone.0179899
He, T., Guo, G., Chen, Z., Du, Z., Gao, R., Xu, H., et al. (2014). Relationship between the stomatal guard cell length and ploidy level in barley microspore regenerated plantlets. J. Triticeae Crops 34, 175–180. doi: 10.7606/j.issn.1009-1041.2014.02.06
Hejnák, V., Hniličková, H., Hnilička, F., and Andr, J. (2016). Gas exchange and Triticum sp. with different ploidy in relation to irradiance. Plant Soil Environ. 62, 47–52. doi: 10.17221/591/2015-PSE
Hu, F., Liu, H., Wang, F., Bao, R., and Liu, G. (2015). Root tip chromosome karyotype analysis of hyacinth cultivars. Genet. Mol. Res. 14, 10863–10876. doi: 10.4238/2015.September.9.24
Kim, D., Langmead, B., and Salzberg, S. L. (2015). HISAT: a fast spliced aligner with low memory requirements. Nat. Methods 12, 357–360. doi: 10.1038/nmeth.3317
Laere, K. V., França, S. C., Vansteenkiste, H., Huylenbroeck, J. V., Steppe, K., and Labeke, M. C. V. (2011). Influence of ploidy level on morphology, growth and drought susceptibility in Spathiphyllum wallisii. Acta Physiol. Plant. 33, 1149–1156. doi: 10.1007/s11738-010-0643-2
Li, Y., Guo, G., Zhou, L., Chen, Y., Zong, Y., Huang, J., et al. (2019). Transcriptome analysis identifies candidate genes and functional pathways controlling the response of two contrasting barley varieties to powdery mildew infection. Int. J. Mol. Sci. 21:151. doi: 10.3390/ijms21010151
Liu, H., and Blankenship, R. E. (2019). On the interface of light-harvesting antenna complexes and reaction centers in oxygenic photosynthesis. Bioenergetics 1860:148079. doi: 10.1016/j.bbabio.2019.148079
Liu, B., Li, M., Li, Q., Cui, Q., Zhang, W., Ai, X., et al. (2018). Combined effects of elevated CO2 concentration and drought stress on photosynthetic performance and leaf structure of cucumber (Cucumis sativus L.) seedlings. Photosynthetica 56, 942–952. doi: 10.1007/s11099-017-0753-9
Long, S. P., and Bernacchi, C. J. (2003). Gas exchange measurements, what can they tell us about the underlying limitations to photosynthesis? Procedures and sources of error. J. Exp. Bot. 54, 2393–2401. doi: 10.1093/jxb/erg262
Lu, B., Pan, X., Zhang, L., Huang, B., Sun, L., Li, B., et al. (2006). A genome-wide comparison of genes responsive to autopolyploidy in Isatis indigotica using Arabidopsis thaliana affymetrix genechips. Plant Mol. Biol. Report. 24, 197–204. doi: 10.1007/BF02914058
Lu, R., Wang, Y., Sun, Y., Shan, L., Chen, P., and Huang, J. (2008). Improvement of isolated microspore culture of barley (Hordeum vulgare L.): the effect of floret co-culture. Plant Cell Tissue Organ Cult. 93, 21–27. doi: 10.1007/s11240-008-9338-4
Masuda, T., and Fujita, Y. (2008). Regulation and evolution of chlorophyll metabolism. Photochem. Photobiol. Sci. 7, 1131–1149. doi: 10.1039/b807210h
Newman, C. W., and Newman, R. K. (2006). A brief history of barley foods. Cereal Foods World 51, 4–7. doi: 10.1094/CFW-51-0004
Otto, S. P. (2007). The evolutionary consequences of polyploidy. Cell 131, 452–462. doi: 10.1016/j.cell.2007.10.022
Padoan, D., Mossad, A., Benedetta, C., Chiancone, B., Germana, M. A., and Khan, P. S. S. V. (2013). Ploidy levels in citrus clementine affects leaf morphology, stomatal density and water content. Theor. Exp. Plant Phys. 25, 283–290. doi: 10.1590/S2197-00252013000400006
Pignatta, D., Dilkes, B. P., Yoo, S. Y., Henry, I. M., Madlung, A., Doerge, R. W., et al. (2010). Differential sensitivity of the Arabidopsis thaliana transcriptome and enhancers to the effects of genome doubling. New Phytol. 186, 194–206. doi: 10.1111/j.1469-8137.2010.03198.x
Quan, X., Zeng, J., Ye, L., Chen, G., Han, Z., Shah, J., et al. (2016). Transcriptome profiling analysis for two Tibetan wild barley genotypes in responses to low nitrogen. BMC Plant Biol. 16:30. doi: 10.1186/s12870-016-0721-8
Ramakers, C., Ruijter, J. M., Deprez, R. H. L., and Moorman, A. F. M. (2003). Assumption-free analysis of quantitative real-time polymerase chain reaction (PCR) data. Neurosci. Lett. 339, 62–66. doi: 10.1016/S0304-3940(02)01423-4
Roberts, A., Pimentel, H., Trapnell, C., and Pachter, L. (2011). Identification of novel transcripts in annotated genomes using RNA-Seq. Bioinformatics 27, 2325–2329. doi: 10.1093/bioinformatics/btr355
Sattler, M. C., Carvalho, C. R., and Clarindo, W. R. (2016). The polyploidy and its key role in plant breeding. Planta 243, 281–296. doi: 10.1007/s00425-015-2450-x
Sicher, R. C., Kremer, D. F., Harris, W. G., and Baenziger, P. S. (1984). Photosynthate partitioning in diploid and autotetraploid barley (Hordeum vulgare). Physiol. Plant. 60, 239–246. doi: 10.1111/j.1399-3054.1984.tb04571.x
Soriano, M., Cistué, L., Vallés, M. P., and Castillo, A. M. (2007). Effects of colchicine on anther and microspore culture of bread wheat (Triticum aestivum L.). Plant Cell Tiss. Org. 91, 225–234. doi: 10.1007/s11240-007-9288-2
Sun, Q., Sun, H., Bell, R., Li, L., Zhou, G., Xin, L., et al. (2015). Field performance of vegetative form traits of neopolyploids produced by in vitro colchicine treatment in Pyrus communis. Sci. Hortic-Amsterdam. 193, 182–187. doi: 10.1016/j.scienta.2015.06.047
Porra, R. J. (2002). The chequered history of the development and use of simultaneous equations for the accurate determination of chlorophylls a and b. Photosynth. Res. 73, 149–156. doi: 10.1023/A:1020470224740
Vass, I., Cser, K., and Cheregi, O. (2007). Molecular mechanisms of light stress of photosynthesis. Ann. N. Y. Acad. Sci. 1113, 114–122. doi: 10.1196/annals.1391.017
von Caemmerer, S., and Farquhar, G. D. (1981). Some relationships the biochemistry of photosynthesis and the gas exchange of leaves. Planta 153, 376–387. doi: 10.1007/BF00384257
Vyas, P., Bisht, M. S., Miyazawa, S. -I., Yano, S., Noguchi, K., Terashima, I., et al. (2007). Effects of polyploidy on photosynthetic properties and anatomy in leaves of Phlox drummondii. Funct. Plant Biol. 34, 673–682. doi: 10.1071/FP07020
Xiang, Z., Tang, X., Liu, W., and Song, C. (2019). A comparative morphological and transcriptomic study on autotetraploid Stevia rebaudiana (Bertoni) and its diploid. Plant Physiol. Biochem. 143, 154–164. doi: 10.1016/j.plaphy.2019.09.003
Xu, H., Liu, C., Lu, R., Guo, G., Chen, Z., He, T., et al. (2016). The difference in responses to nitrogen deprivation and re-supply at seedling stage between two barley genotypes differing nitrogen use efficiency. Plant Growth Regul. 79, 119–126. doi: 10.1007/s10725-015-0117-z
Xue, H., Zhang, B., Tian, J., Chen, M., Zhang, Y., Zhang, Z., et al. (2017). Comparison of the morphology, growth and development of diploid and autotetraploid ‘Hanfu’ apple trees. Sci. Hortic-Amsterdam. 225, 277–285. doi: 10.1016/j.scienta.2017.06.059
Yuan, S., Su, Y., Liu, Y., Li, Z., Fang, Z., Yang, L., et al. (2015). Chromosome doubling of microspore-derived plants from cabbage (Brassica oleracea var. capitata L.) and broccoli (Brassica oleracea var. italica L.). Front. Plant Sci. 6:1118. doi: 10.3389/fpls.2015.01118
Zhang, X., Cao, Q., and Jia, G. (2017). A protocol for fertility restoration of F1 hybrid derived from Lilium×formolongi ‘Raizan 3’×oriental hybrid ‘Sorbonne’. Plant Cell Tiss. Org. 129, 375–386. doi: 10.1007/s11240-017-1184-9
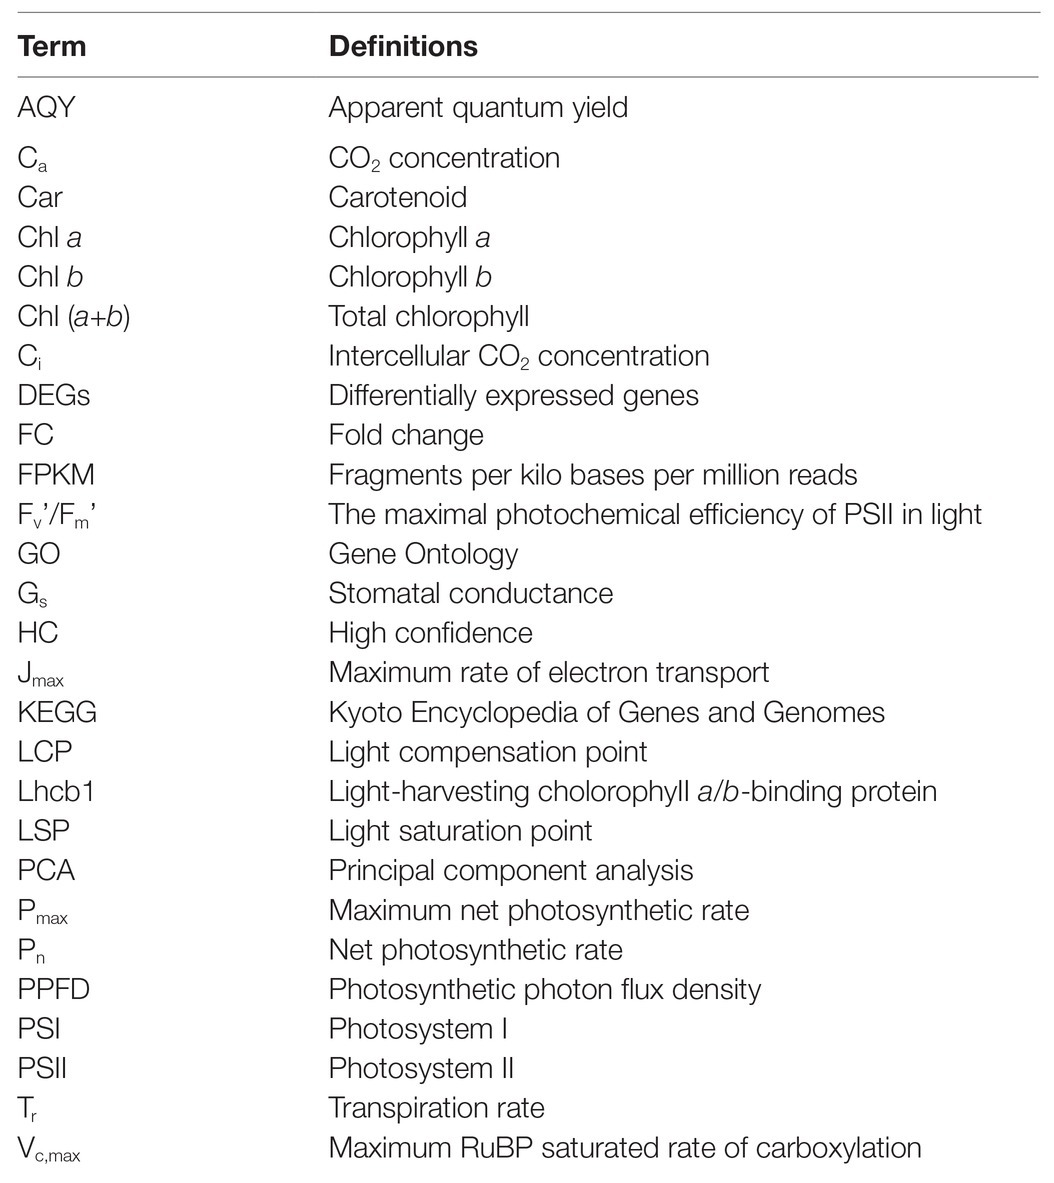
Glossary
Keywords: barley (Hordeum vulgare L.), tetraploid, photosynthesis, RNA-seq, quantitative PCR
Citation: Chen Y, Xu H, He T, Gao R, Guo G, Lu R, Chen Z and Liu C (2021) Comparative Analysis of Morphology, Photosynthetic Physiology, and Transcriptome Between Diploid and Tetraploid Barley Derived From Microspore Culture. Front. Plant Sci. 12:626916. doi: 10.3389/fpls.2021.626916
Edited by:
Abraham J. Escobar-Gutiérrez, Institut National de Recherche pour l'agriculture, l'alimentation et l'environnement (INRAE), FranceReviewed by:
Luigi Lucini, Catholic University of the Sacred Heart, ItalyCatello Di Martino, University of Molise, Italy
Copyright © 2021 Chen, Xu, He, Gao, Guo, Lu, Chen and Liu. This is an open-access article distributed under the terms of the Creative Commons Attribution License (CC BY). The use, distribution or reproduction in other forums is permitted, provided the original author(s) and the copyright owner(s) are credited and that the original publication in this journal is cited, in accordance with accepted academic practice. No use, distribution or reproduction is permitted which does not comply with these terms.
*Correspondence: Chenghong Liu, liuchenghong@saas.sh.cn; Zhiwei Chen, chenzhiwei@saas.sh.cn
†These authors share first authorship (Co-first authors)