 Zi-Han Wu1
 Ruo-Zhong Wang
 Lang-Tao Xiao
- 1College of Bioscience and Biotechnology, Hunan Agricultural University, Changsha, China
- 2College of Veterinary Medicine, Hunan Agricultural University, Changsha, China
Gelsemium elegans contains multiple alkaloids with pharmacological effects, thus researchers focus on the identification and application of alkaloids extracted from G. elegans. Regretfully, the spatiotemporal distribution of alkaloids in G. elegans is still unclear. In this study, the desorption electrospray ionization mass spectrometry imaging (DESI-MSI) was applied to simultaneously analyze the distribution of pharmacologically important alkaloids in different organ/tissue sections of G. elegans at different growth stages. Finally, 23 alkaloids were visualized in roots, stems and leaves at seedling stage and 19 alkaloids were observed at mature stage. In mature G. elegans, 16 alkaloids were distributed in vascular bundle region of mature roots, 15 alkaloids were mainly located in the pith region of mature stems and 2 alkaloids were enriched in epidermis region of mature stems. A total of 16 alkaloids were detected in leaf veins of mature leaves and 17 alkaloids were detected in shoots. Interestingly, diffusion and transfer of multiple alkaloids in tissues have been observed along with the development and maturation. This study comprehensively characterized the spatial metabolomics of G. elegans alkaloids, and the spatiotemporal distribution of alkaloid synthesis. In addition, the results also have reference value for the development and application of Gelsemium elegans and other medicinal plants.
Introduction
Mass spectrometry imaging (MSI) emerges as an effective biological imaging technique within the last 20 years because of its versatility, high sensitivity, and label-free advantage (Dilillo et al., 2017). Being an important technique to understand the locations of molecular entities inside biochemical and biological systems (Jeckel et al., 2020), it can also capture snapshots for the spatial distribution of metabolites in complex samples, providing an additional dimension of information for metabolic researches. Sample preparation for MSI does not require whole-tissue homogenate, furthermore, within-tissue spatial distribution profiles of metabolites in plants can be acquired through MSI (Bong et al., 2016). Recently, MSI has been employed to visualize certain target molecules in various plant organs, such as Hypericum perfortum roots (Tocci et al., 2018), Ginkgo biloba leaves (Li et al., 2018), Vitex agnus-castus fruits/leaves (Heskes et al., 2018) and strawberry fruits (Enomoto et al., 2018). Meanwhile, it has been used to visualize the spatial distribution of some important medicinal compositions in medicinal plants Catharanthus roseusm (Dutkiewicz et al., 2021) and Camellia sinensis (Liao et al., 2019).
Alkaloids are naturally occurring cyclic nitrogen containing compounds with low molecular-weight and alkali-like properties, mostly derived from amino acids (Cordell, 2013). As secondary metabolites found in approximately 20% of plant species, alkaloids are reported to play defensive roles against herbivores and pathogens (Lee et al., 2013). In addition, the applications of alkaloids also have pharmacological, veterinary and medical importance (Ziegler and Facchini, 2008). Owing to their diverse effects, many of the approximately 12,000 known alkaloids have been exploited as pharmaceuticals, stimulants, narcotics, and poisons (Facchini, 2001). For example, vinblastine can be used for the treatment of cancer (Souza et al., 2017), and ajmaline can be used for antiarrythmic heart disorders (Ozkartal et al., 2019).
Gelsemium elegans (G. elegans) is a genus of flowering plants in the Gelsemicaeae family being mainly distributed in North America and Southeast Asia (Jin et al., 2014). Previous studies showed that G. elagans has a variety of pharmacological effects including anti-tumor, anti-inflammation, skin ulcers relief, immune function, and analgesia (Liu et al., 2011; Ye et al., 2019). In fact, the basic pharmaceutically active compounds in G. elagans are alkaloids. According to the chemical structures, G. elagans alkaloids are divided into 6 types of gelsedine-, gelsemine-, humantenine-, koumine-, sarpagine- and the yohimbane-type (Jin et al., 2014). Structures of multiple alkaloids in G. elagans were characterized by high-performance liquid chromatography coupled with quadruopole time-of-flight mass spectrometry (LC-QTOF/MS) (Liu et al., 2017a) and nuclear magnetic resonance (NMR) (Wang et al., 2017). Meanwhile, the relative quantification is usually carried out through liquid chromatography coupled with mass spectrometry (LC-MS) (Liu et al., 2017b). Furthermore, an offline preparative three-dimensional HPLC (3D-HPLC) method was developed to perform the systematic purification of 24 indole alkaloids in G. elegans (Liu et al., 2021). Based on the two-dimension LC-UV-MS plus online heart-cutting method, a total of 256 alkaloids were grouped and tentatively identified in G. elegans (Liu et al., 2022).
As one of MSI-based technologies, DESI has firstly been applied in identification and visualization of plant target compounds, such as flavones and alkaloids. Recently, high-performance thin layer chromatography coupled with desorption electrospray ionization multistage mass spectrometry (HPTLC-DESI-MSn) analysis was used to identify 13 aporphine and 4 benzylisoquinoline-type alkaloids in Ocotea spixiana (Conceicao et al., 2020). The seven Uncaria alkaloids were quantitatively imaged in rat brains by using DESI-MSI (Gao et al., 2022). Visualizing the distribution of a metabolite is an important approach to explore its translocation and the possible pathways of biosynthesis (Ifa et al., 2011; Kumara et al., 2019). High-throughput determination of alkaloids is necessary for the research of plant spatial metabolomics. Although DESI-MSI has been applied in the quantification of plant alkaloids, the application in high-throughput determination is rare. In our previous study, we employed DESI-MSI to visualize the distributions of several alkaloids in G. elegans (Wu et al., 2022b). Regretfully, the spatiotemporal distribution of more alkaloids in G. elagans is still unclear. For better exaction and application, it is essential to determine the detailed tissue localization and putative mobility of alkaloids in G. elagans. In this study, we simultaneously analyzed the spatiotemporal distributions of multiple alkaloids in organs/tissues of G. elegans at different growth stages by using the desorption electrospray ionization mass spectrometry imaging (DESI-MSI). The results also showed reference value for the development and application of G. elegans and other medicinal plants.
Materials and methods
Reagents and chemicals
Methanol was obtained from Merck Chemicals Co., Ltd. (Darmstadt, Germany). Saccharose was purchased from the Sinopharm Chemical Reagent Co., Ltd. (Shanghai, China). Glass slides were obtained from Wuhan Servicebio Technology Co., Ltd. (Wuhan, China). Optimum Cutting Polymer (O.C.T.) was purchased from Sakura (USA). Ultrapure water (resistivity ≥ 18.25 MΩ/cm) obtained from WaterPro water system (ULUPURE, China). All the reagents and chemicals employed in the experiments were of superior analytical grade (least 98% purity).
Plant culture conditions
The seeds of G. elegans were collected from Longyan (N24°43′12″, E116°43′48″), Fujian Province, China. The seeds were washed with sterile distilled water, and vernalization at 4 °C was carried out for 48 h. The seeds were germinated and transplanted into sand pots. The potted seedlings were grown in greenhouse with a photoperiod of 16/8 h light/darkness, 70% humidity, and a temperature of 24/20 °C day/night. For DESI-MSI analysis, the seedlings (30 d, 60 d and 90 d after planting) and the mature plants (180 d after planting) of G. elegans were collected.
Alkaloid analysis by LC-MS/MS
The sample preparation method and analytical method for LC-MS/MS was analyzed as previously reported (Wu et al., 2022b). Fresh tissues of G. elegans were ground with liquid nitrogen and 100 mg aliquot of the homogenate was immediately collected in microcentrifuge tube. Each tissue has three replicates. The homogenate was extracted twice by ultrasonic bath (Shumei KQ-250DE, Jiangsu, China) in 2.5 mL of 80% ethanol (1:25) for 0.5 h at 60 °C. The extraction solution was combined for filtration, and 1 mL of the filtered solution was evaporated by nitrogen. The sample was prepared by dissolving it in 1 mL of acetonitrile-ammonium acetate (1:4, volume percent) and filtering through a 0.22-µm membrane filter, 10 µL of which was used to LC-MS/MS analysis.
The UPLC-MS/MS was equipped with an Agilent 1290 series liquid chromatography (Agilent Technologies, USA) and Agilent 6460 triple quadruple mass spectrometer (Agilent Technologies, USA). The sample extraction solutions were separated on a Waters C18 column (3.5 μm, 4.6 μm×150 mm, Waters, USA). The separation conditions were as follows: the column oven temperature was kept at 40 °C, and the flow rate of the mobile phase was 0.3 mL/min. Auto MS/MS analysis was performed in both scan mode and multiple reaction monitoring (MRM) mode. Nitrogen gas was used as the drying and collision gas. The ionization source conditions were set as follows: flow rate of the nebulizer gas, 12 L/min; source temperature of the mass spectrometer, 350 °C; nebulizer pressure, 40 psi; capillary voltage, 3.50 kV; scan range, m/z 50-1000. The data acquisition was used by Agilent MassHunter workstation software (version B.07.00).
Plant sample preparation for DESI-MSI
Frozen sections of G. elegans organ/tissue were made for DESI-MSI. Fresh organ/tissue samples (root, stem, leaf and shoot) were immediately wrapped in aluminum foils and were frozen in liquid nitrogen. Three replicates of organ/tissue samples were made into frozen sections. The frozen samples were then transferred to a freezer (Haier DW-86L388J, Qingdao, China) for storage at -80 ℃. The frozen samples were put up on the specimen chuck, and O.C.T. embedding agent was dropped around the organ/tissue. The specimen chuck with sample was put on the quick-freezing table of the frozen section machine (Thermo CRYOSTAR NX50, San Jose, CA, USA). When O.C.T. became white and hard, the samples were sectioned with the slice thickness 8-10 µm. The roots, stems and leaves were neatly sliced along their cross sections. The shoots were longitudinally sliced. The organ/tissue sections were adhered to a glass slide and was analyzed by DESI-MSI.
DESI-MSI instrumentation
DESI-QToF-MS (Waters Xevo G2-XS, Milford, MA, USA) was employed for MSI analysis. Methanol: water=98:2 (v/v) was used as the solvent and was sprayed at an angle of 60° to surface. The flow rate was 2 μL/min. Nebulizing gas (nitrogen) pressure was 5 bar. Distance between the emitter and the mass spectrometer inlet was kept at 3 mm, the emitter was positioned 2 mm above the tissue surface, and the mass spectrometer inlet was 0.5 mm to the tissue surface. Imaging area was chosen according to the sample dimensions, the spatial resolution used was 50 μm × 50 μm, and the spatial scanning rate was 100 μm/s. Imaging acquisition interval varied between 6.0 and 6.5 hours in 1 cm × 1 cm area of tissue sample. Data were acquired in positive ion mode with a spray voltage of 4.5 kV. Signals were recorded from m/z 50 to 1200 and the ion source temperature was 150°C. Each experiment has three replicates. Each frozen section was scanned three times by DESI-MSI.
Compounds imaging and data processing
The acquisition setup, processing, and visualization of data were performed using High Definition Imaging (HDI) 1.5 (Waters Corporation, Manchester, UK) software. Data were acquired and mined using MassLynx software version 4.1 (Waters Corporation, Manchester, UK). To identify the metabolites, each interested peak was scanned for the details of MS2 spectrum. The ion intensity values of the organs/tissues were obtained from the mass spectrum exported from the HDI software with centroid data. The image brightness intensities were calculated according to the ion intensity of samples and were plotted as the color scale. The relative quantification of alkaloids was performed according to the image brightness intensities captured by the DESI-MSI.
Results
Alkaloids identified in G. elegans
G. elegans is a woody and evergreen climber which thrives in warm and humid climates (Figures 1A-C). The leaves of G. elegans are ovate, lanceolate and verticillate (Figure 1D). The roots are light brown, nearly smooth and wiry. The center of the root cross section appears pink (Figure 1E). The stems are smooth and twining, containing a milky latex (Figure 1F). In this study, through LC-MS/MS we identified 26 alkaloids, including 2 gelsemine-type alkaloids, 1 koumine-type alkaloid, 12 gelsedine-type alkaloids, 2 humantenine-type alkaloids, 1 yohimbane-type alkaloid and 8 sarpagine-type alkaloids (Figures S1–3 and Table 1). According to the structural information, most of alkaloids belonged to monoterpenoid indole alkaloids, which may derive from the precursors of tryptamine and secologanin through a series of biosynthetic processes. These alkaloids were characterized with two nitrogen atoms, and showed higher pharmacodynamics, such as analgesia, anti-tumor and anti-inflammation.
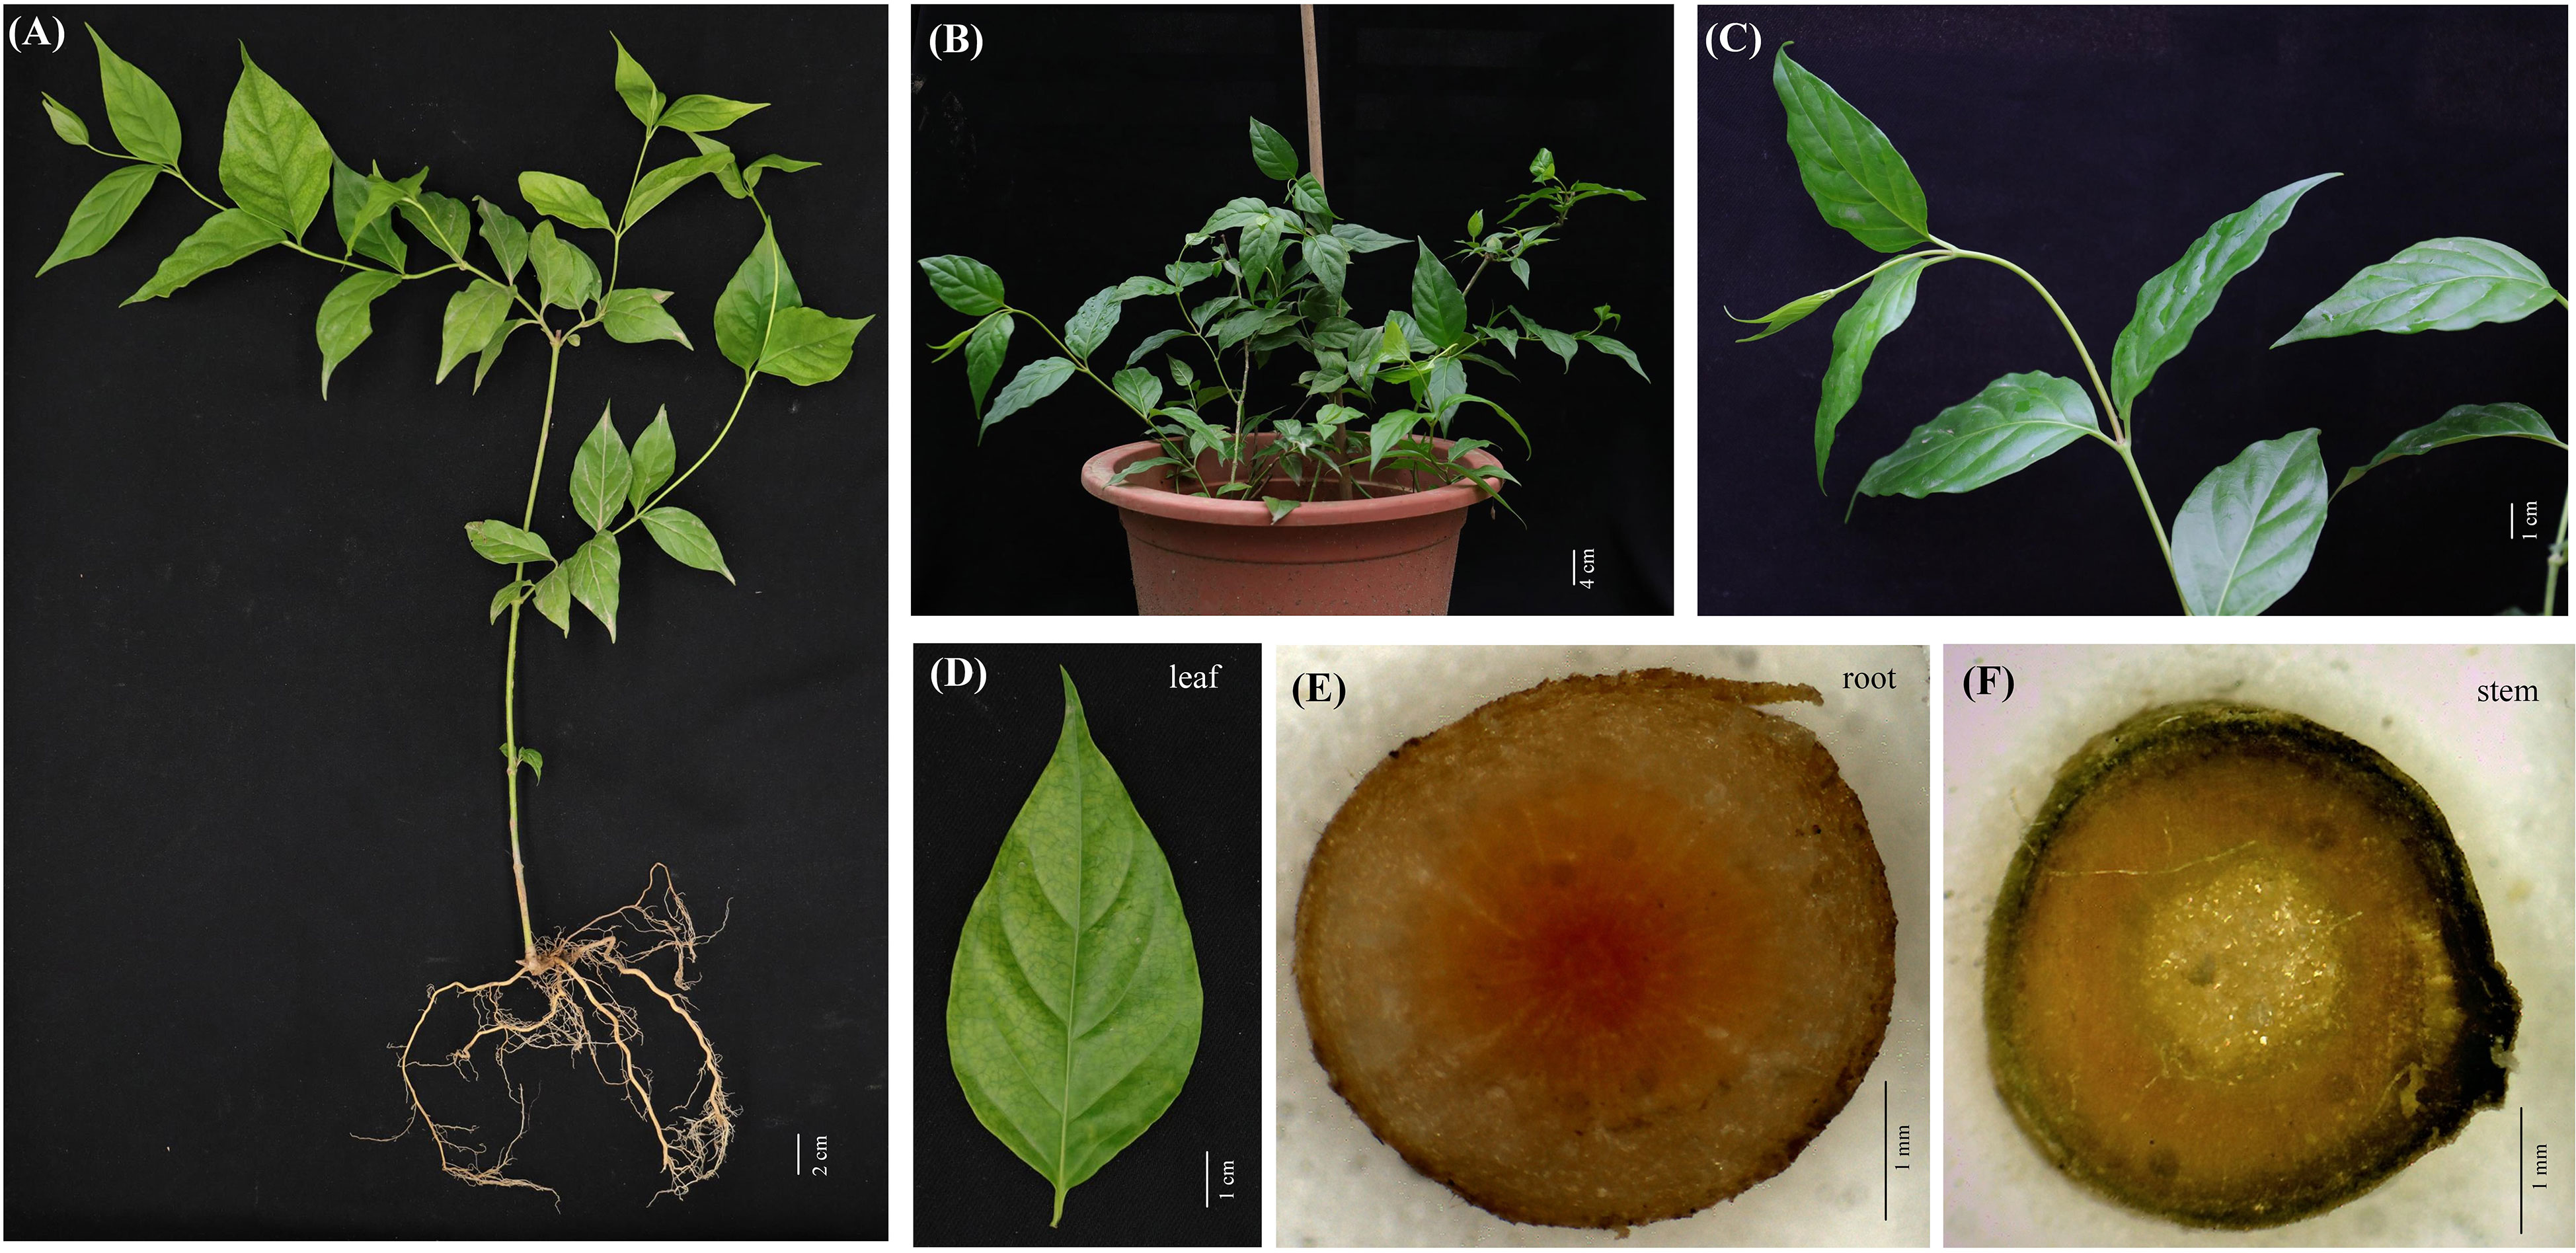
Figure 1 G. elegans plants cultured in pot. (A–C) The mature stage of G. elegans. (D) The leaf of G. elegans. (E) The root cross-sections. (F) The stem cross-section.
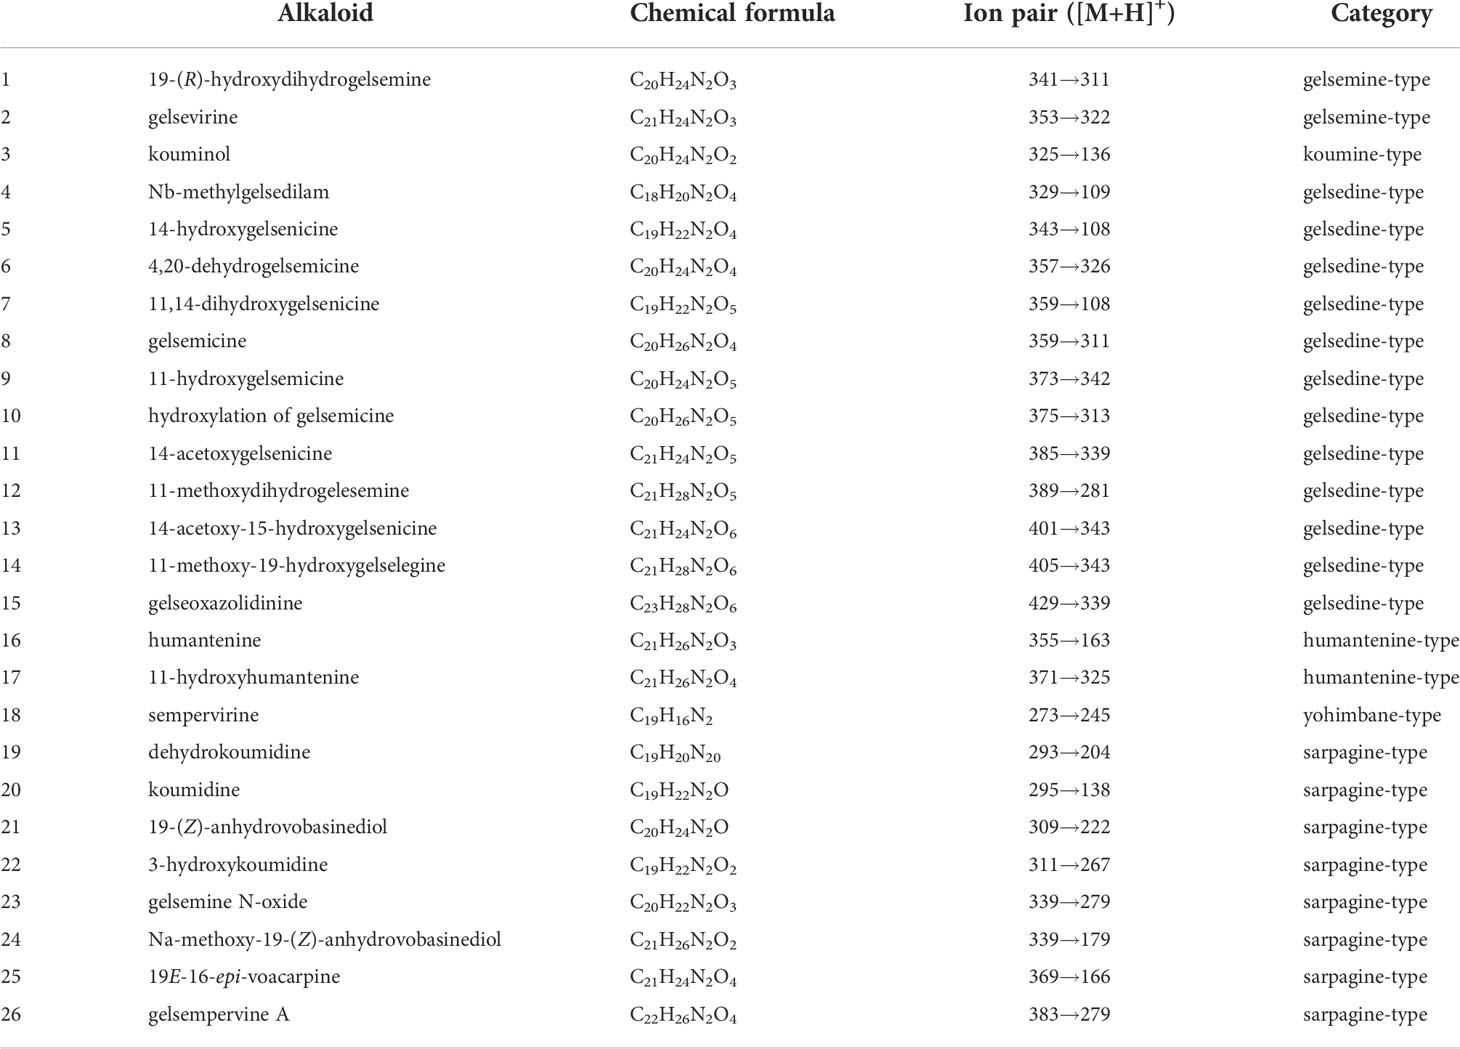
Table 1 Identified alkaloids in Gelsemiume legans.
DESI based imaging pipeline for alkaloids in G. elegans
Among MSI-based technologies, matrix-assisted laser desorption ionization (MALDI) and DESI have been widely applied in recent years (Muller et al., 2011). MALDI-MSI requires a sample embedded in a typical matrix that can absorb laser energy and help the transfer of analytes into the gas and ionic phases. High laser precision guarantees high spatial resolution, up to 1 µm/pixel (Bjarnholt et al., 2014). However, the high matrix background noise makes MALDI-MSI unsuitable for the analysis of m/z less than 1000 molecules (Buscher et al., 2009). DESI-MSI has the advantages of minimal sample preparation, detection under atmospheric pressure, and small-molecule applicability (Campbell et al., 2012). Cryosectioning is a commonly used method to prepare plant tissue slices, in which freezing well quenches metabolic processes (Boughton et al., 2016). The glass slide bearing a tissue sample was placed on the mobile platform and directly analyzed by DESI-MSI. Its sample preparation is convenient, and the consumption of sample metabolites is minimal.
In this study, we were interested in simultaneously analyzing the spatiotemporal distributions of multiple alkaloids in organs/tissues of G. elegans. The molecular weight of alkaloids is generally not higher than 1000 and the structures of alkaloids are relatively stable. Due to the requirement of simultaneously analyzing multiple alkaloids in multiple organs/tissues, DESI-MSI seems to be the best choice. Therefore, DESI-MSI was employed to visualize the spatiotemporal localization of multiple alkaloids in G. elegans (Figure 2). Frozen sections of four organ/tissue sections (roots, stems, leaves, and shoots) of G. elegans were prepared (Figure 2A). The glass slide bearing a tissue sample was placed on the mobile platform. To obtain a higher image resolution, methanol in water (98:2, v/v) was used as the solvent (Manicke et al., 2008). As a key component in the DESI, the DESI sprayer consists of a solvent emitter surrounded by a second capillary that delivers a nebulizing gas flow (Wu et al., 2022a). The surface of frozen section is divided into a series of 50 μm × 50 μm lattice with a certain coordinate (X, Y). The DESI directs charged droplets to the lattice via a spray capillary, the ESI (electrospray ionization) stream impacts the extracting and ionizing analytes. The ions are desorbed into the gas phase and then transferred via an atmospheric ion transfer line into the mass spectrometer, thus enabling measurement of ions (Figure 2B). In the last step, the recorded mass spectra were converted into two-dimensional ion images on the certain lattice according to the coordinate (X, Y). For each spatial coordinate, the amounts of ionizable molecules present as a function of their m/z. The resulting mass spectra for each coordinate (X, Y) was computationally reconstructed to form a complete dataset. The resultant reconstructed ion image represented the spatial distribution of the corresponding molecules. The mass spectra were processed with Masslynx software version 4.1 and images were viewed using HDImaging version 1.4 (Figure 2C).
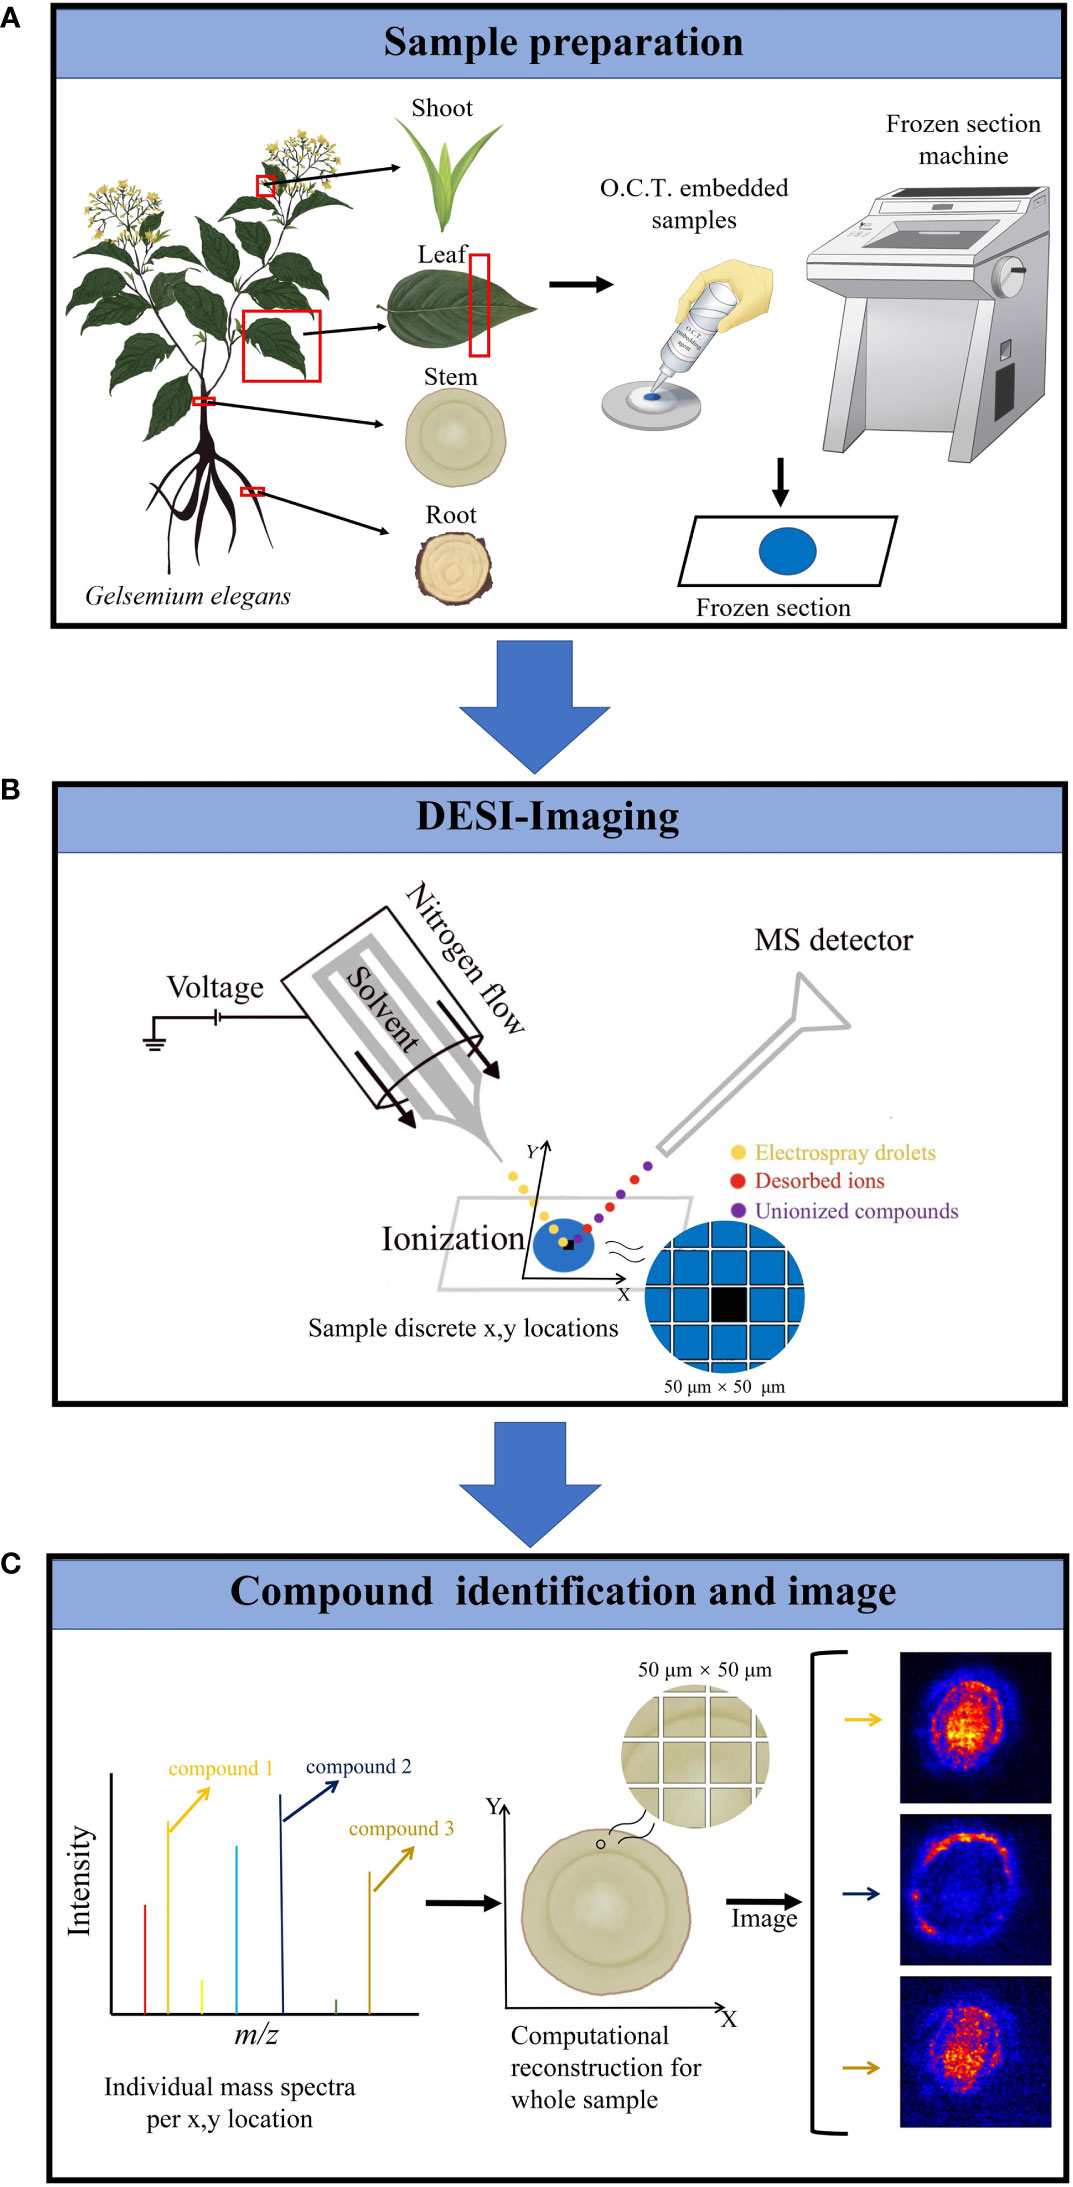
Figure 2 DESI-MS imaging experiment workflow. (A) The plant sample preparation for DESI-MSI. Frozen sections of four organ/tissue sections (roots, stems, leaves, and shoots) of G elegans were prepared. O.C.T. was used as the embedded agent. (B) The frozen sections were placed on the mobile platform of DESI-MSI. The DESI sprayer consists of a solvent emitter surrounded by a second capillary that delivers a nebulizing gas flow. Methanol in water (98:2, v/v) was used as the solvent. The DESI directs charged droplets to 50 μm × 50 μm lattice with a certain coordinate (X, Y) via a spray capillary, the ESI (electrospray ionization) stream impacts the extracting and ionizing analytes. Finally, the mixed droplets were ejected into the mass spectrometer. Imaging area was determined according to the lattice dimensions. (C) Target molecules identification and imaging. The resulting mass spectra for each coordinate (X, Y) was computationally reconstructed to form a complete dataset. The resultant reconstructed ion image represents the spatial distribution of the corresponding molecules. The acquisition setup, processing, and visualization of data were performed using HDI 1.5.
Visualizing alkaloids locations in plant organs/tissues
To visulize the spatial distribution of alkaloids in G. elegans, the plant organ/tissue sections were detected by DESI-MSI in positive ionization mode. The typical DESI-MSI spectrums of alkaloids in plant organ/tissue sections were acquired (Figure S4). A large number of alkaloids related signals were detected in the ranges of m/z 100-1200. These alkaloids were confirmed by comparing the m/z values and MS/MS spectra with the results obtained by LC-QTOF/MS (Table 1).
In situ distributions of alkaloids in the sections of mature roots, stems, leaves and shoots were imaged (Figures 3–5). The microscopic pictures of frozen sections in tissues were shown in Figure S5. The results showed that 19 alkaloids were detected and imaged via DESI-MSI (Figures 3–5). 16 alkaloids were detected in the roots, all of which were located in the vascular bundle region and decreased gradually from pith to epidermis. In mature stems, 17 alkaloids were detected but their spatial distributions were not consistent. Two sarpagine-type alkaloids, gelsemine N-oxide (m/z 339) and 19E-16-epi-voacarpine (m/z 369) were mainly enriched in epidermis region, and the others displayed a similar localization pattern in roots, i.e., the 15 alkaloids were mainly located in the stem pith region and were significantly decreased in the epidermis. 16 alkaloids were detected in leaves and 17 in shoots. 16 alkaloids in leaves were mainly located in leaf veins. In shoots, most of alkaloids were distributed in young leaves and bud primordium. However, 14-hydroxygelsenicine (m/z 343), 11-hydroxygelsemicine (m/z 373) and 11,14-dihydroxygelsenicine (m/z 359) were distributed in bud axis which further developed into stem. Dehydrokoumidine (m/z 293), 19-(Z)-anhydrovobasinediol (m/z 309), gelsempervine A (m/z 383), sempervirine (m/z 273), Nb-methylgelsedilam (m/z 329), gelsemicine (m/z 359) and 11-methoxy-19-hydroxygelselegine (m/z 405) were not detected. In addition, some non-alkaloid constituents were also visualized by DESI-MSI, e.g. ferulic acid (m/z 195) and GEIR-1 (m/z 213) were detected in stems, leaves and shoots, gelsemiol (m/z 201) and semperoside (m/z 361) were detected in shoots (Figure S6).
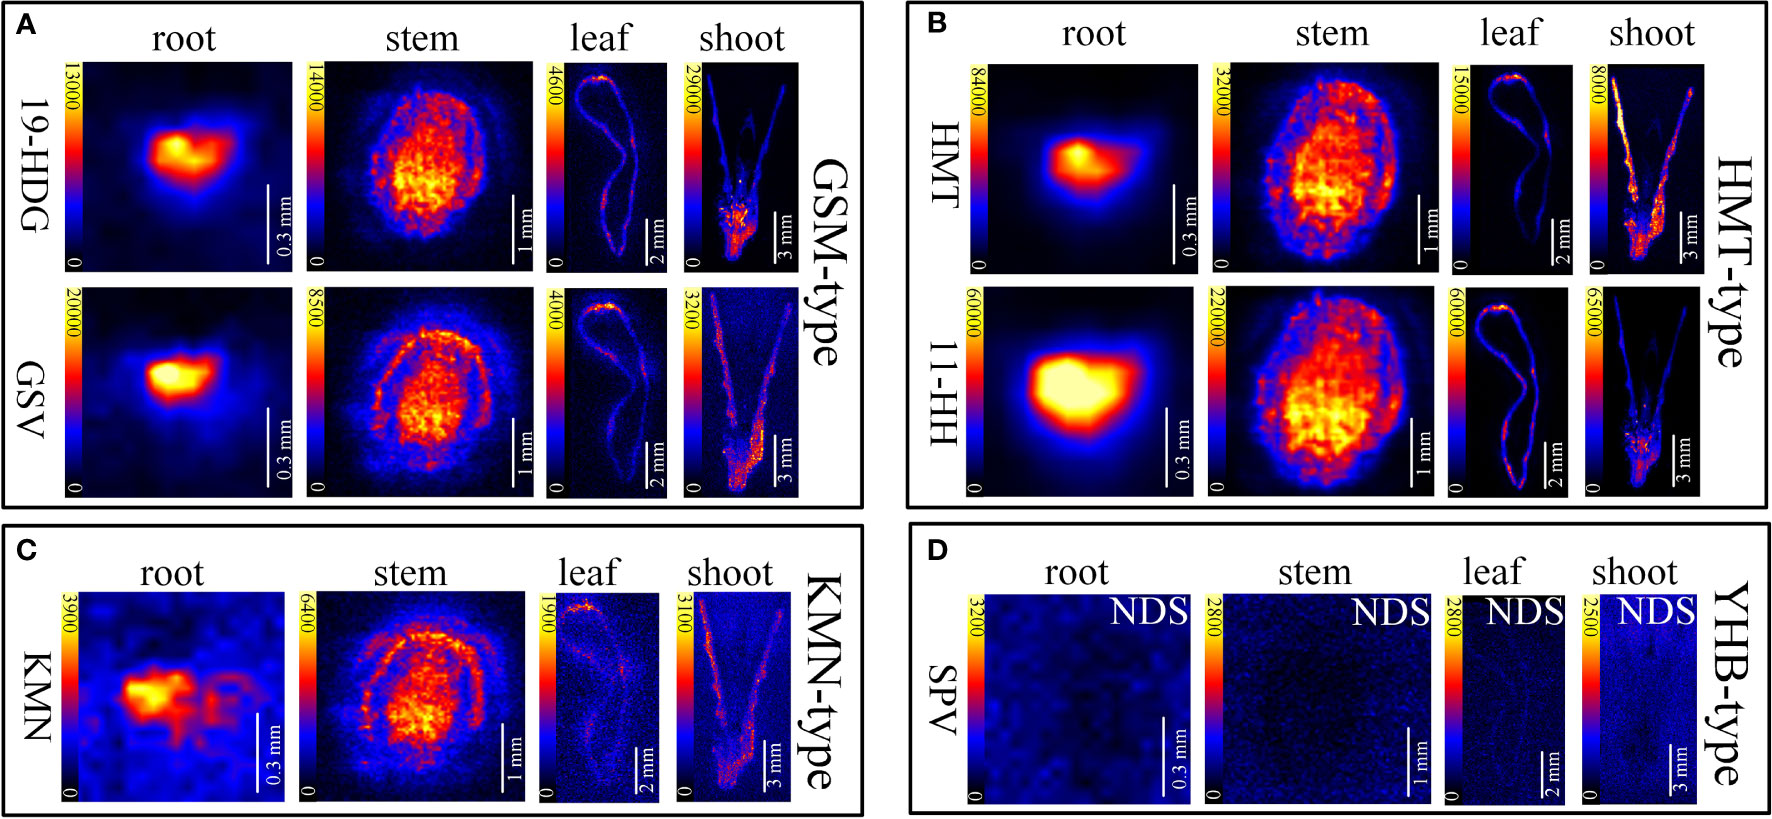
Figure 3 In situ visualization of alkaloids in sections of mature roots, stems, leaves and shoots. The color scale from dark to yellow indicates the regions of minimum (absence) and maximum relative quantification of multiple alkaloids in different organ/tissue. The relative quantifications of alkaloids were performed according to the image brightness intensities captured by the DESI-MSI. The names of the alkaloids are abbreviated. (A) Gelsmine-type (GSM-type) alkaloids. 19-HDG, 19-(R)-hydroxydihydrogelsemine (m/z 341.1865); GSV, gelsevirine (m/z 353.1865). (B) Humantenine-type (HMT-type) alkaloids. HMT, humantenine (m/z 355.2022); 11-HH, 11-hydroxyhumantenine (m/z 371.1971). (C) Koumine-type (KMN-type) alkaloids. KMN, kouminol (m/z 325.1916). (D) Yohimbane-type (YHB-type) alkaloids; SPV, sempervirine (m/z 273.1370). NDS means no detectable signal. Each organs/tissues had three replicates and analyzed by DESI-MSI.
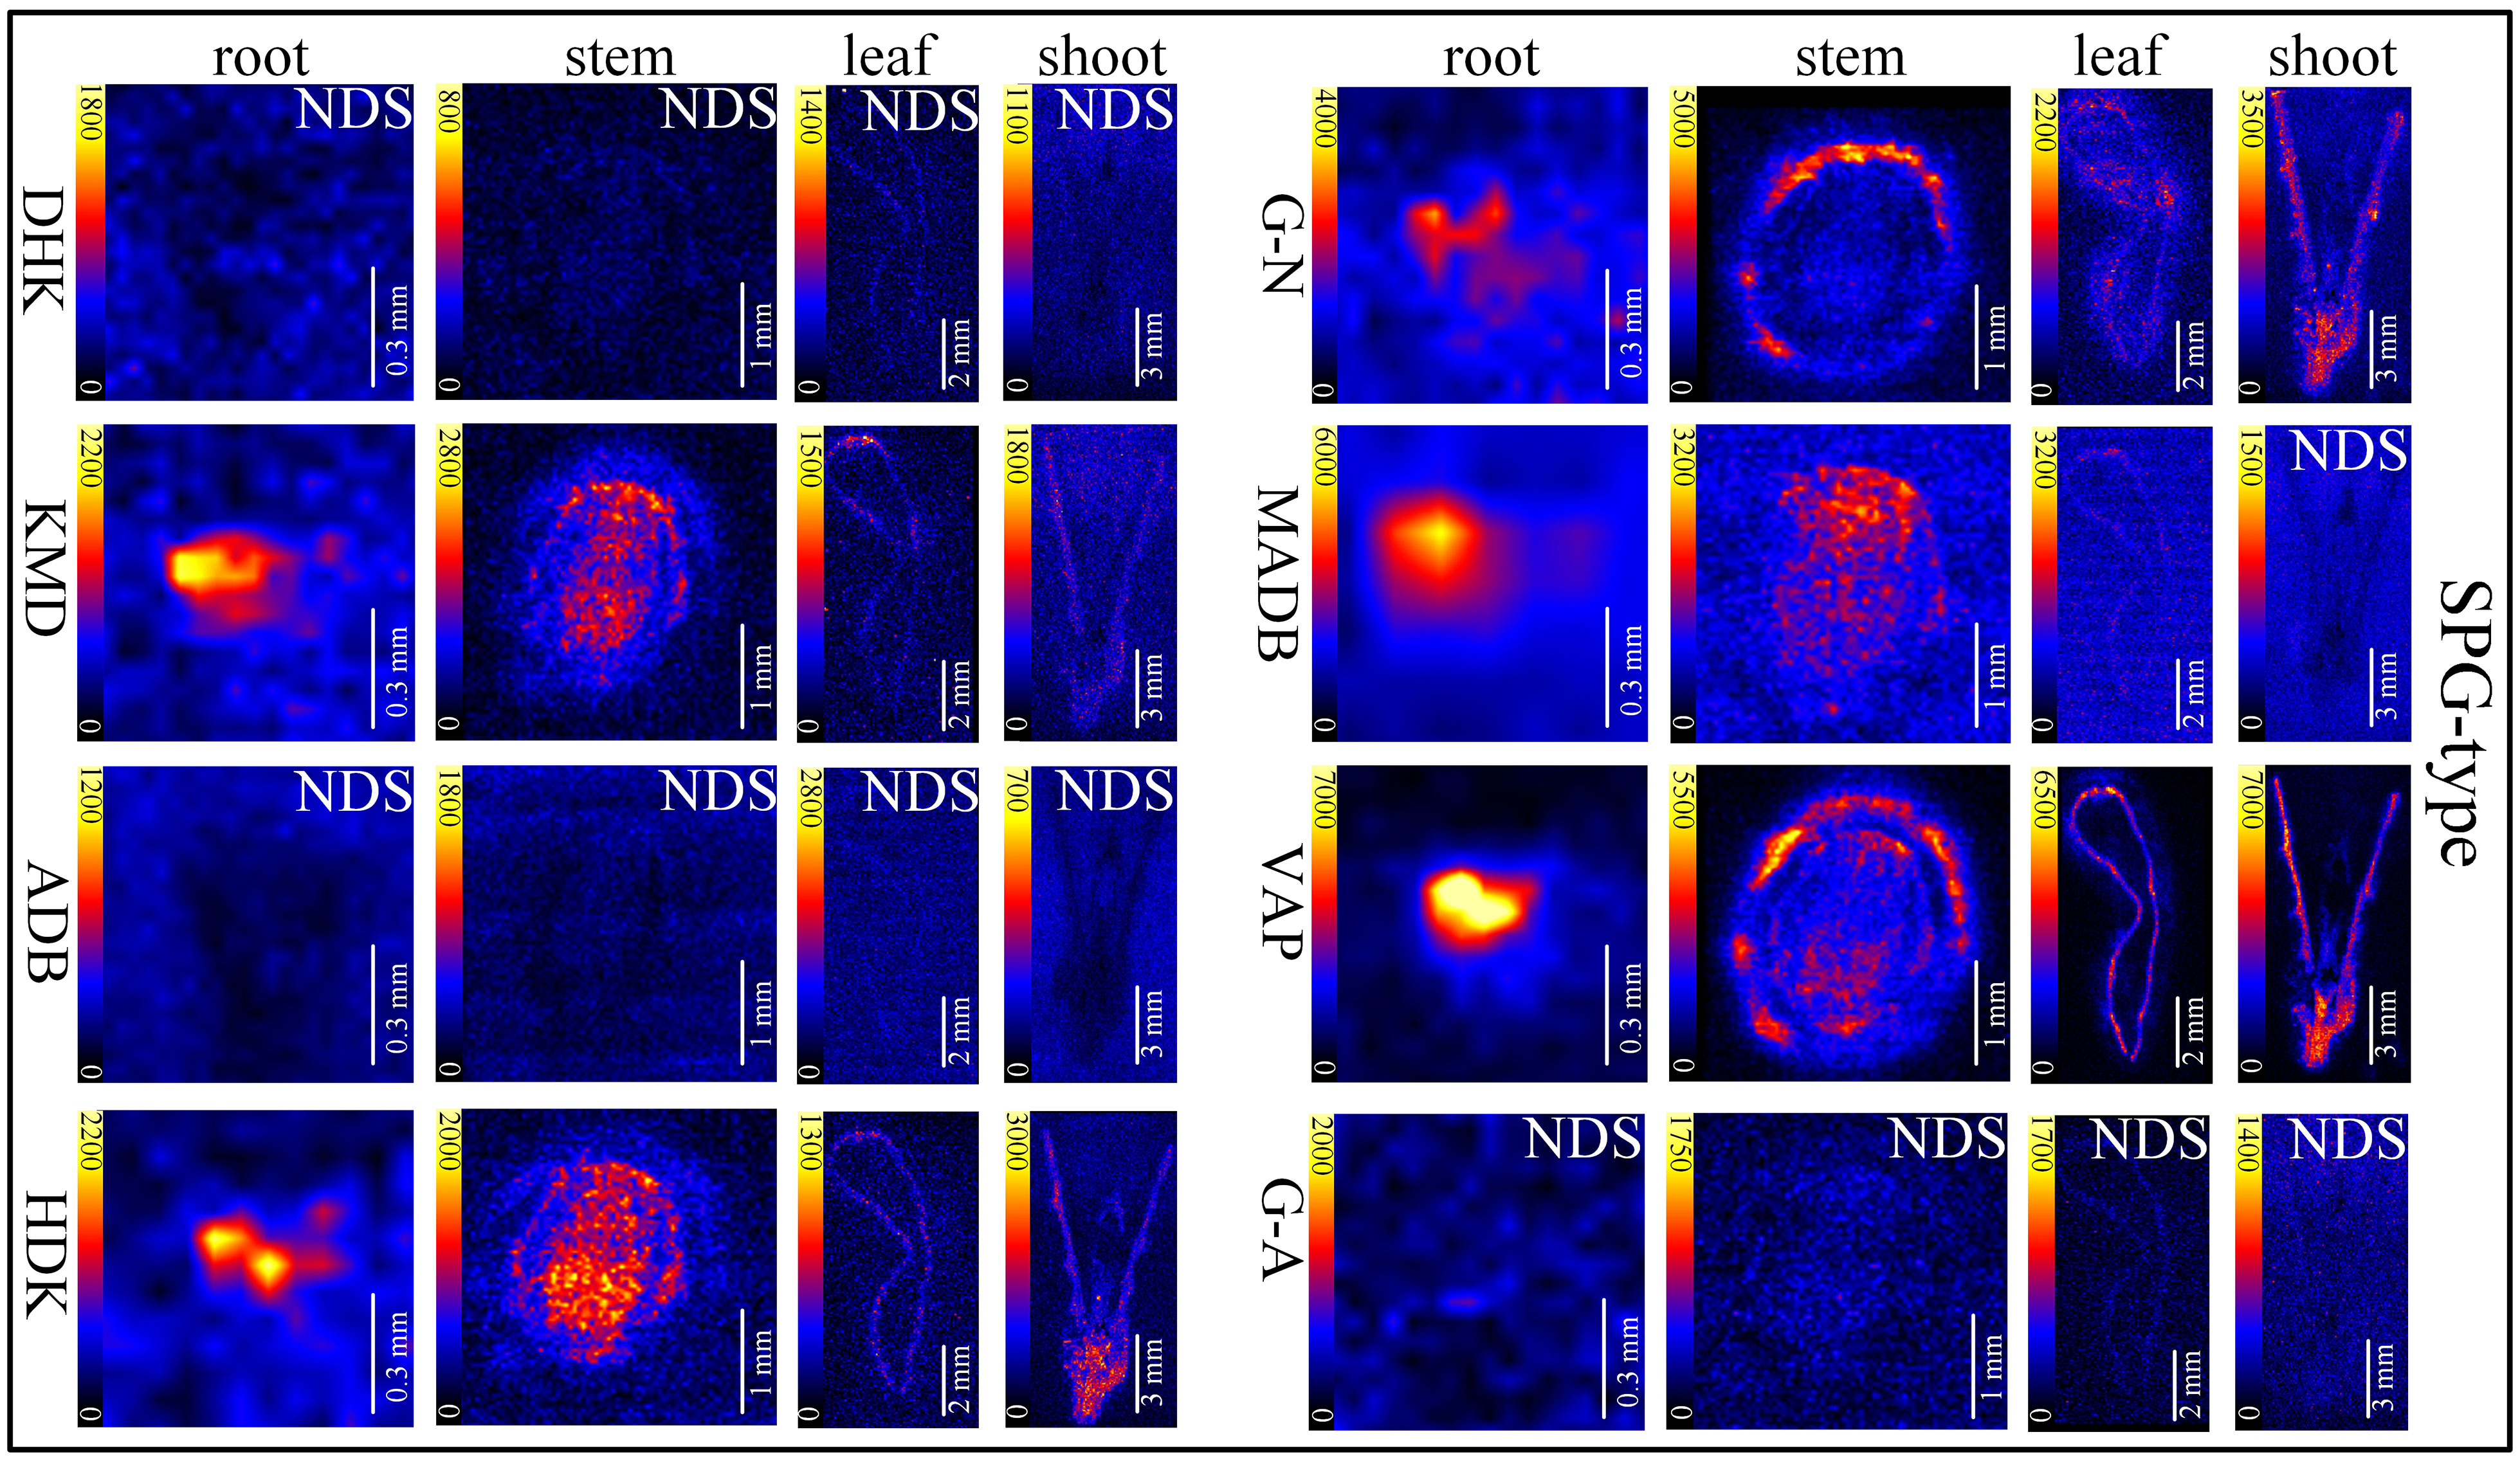
Figure 4 In situ visualization of sarpagine-type (SPG-type) alkaloids in different organ/tissue sections. NDS means no detectable signal. The names of the alkaloids are abbreviated. DHK, dehydrokoumidine (m/z 293.1644); KMD, koumidine (m/z 295.1810); ADB, 19-(Z)-anhydrovobasinediol (m/z 309.1881); HDK, 3-hydroxykoumidine (m/z 311.1760); G-N, gelsemine N-oxide (m/z 339.1709); MADB, Na-methoxy-19(Z)anhydrovobasinediol (m/z 339.2071); VAP, 19E-16-epi-voacarpine (m/z 369.1814); G-A, gelsempervine A (m/z 383.1978).
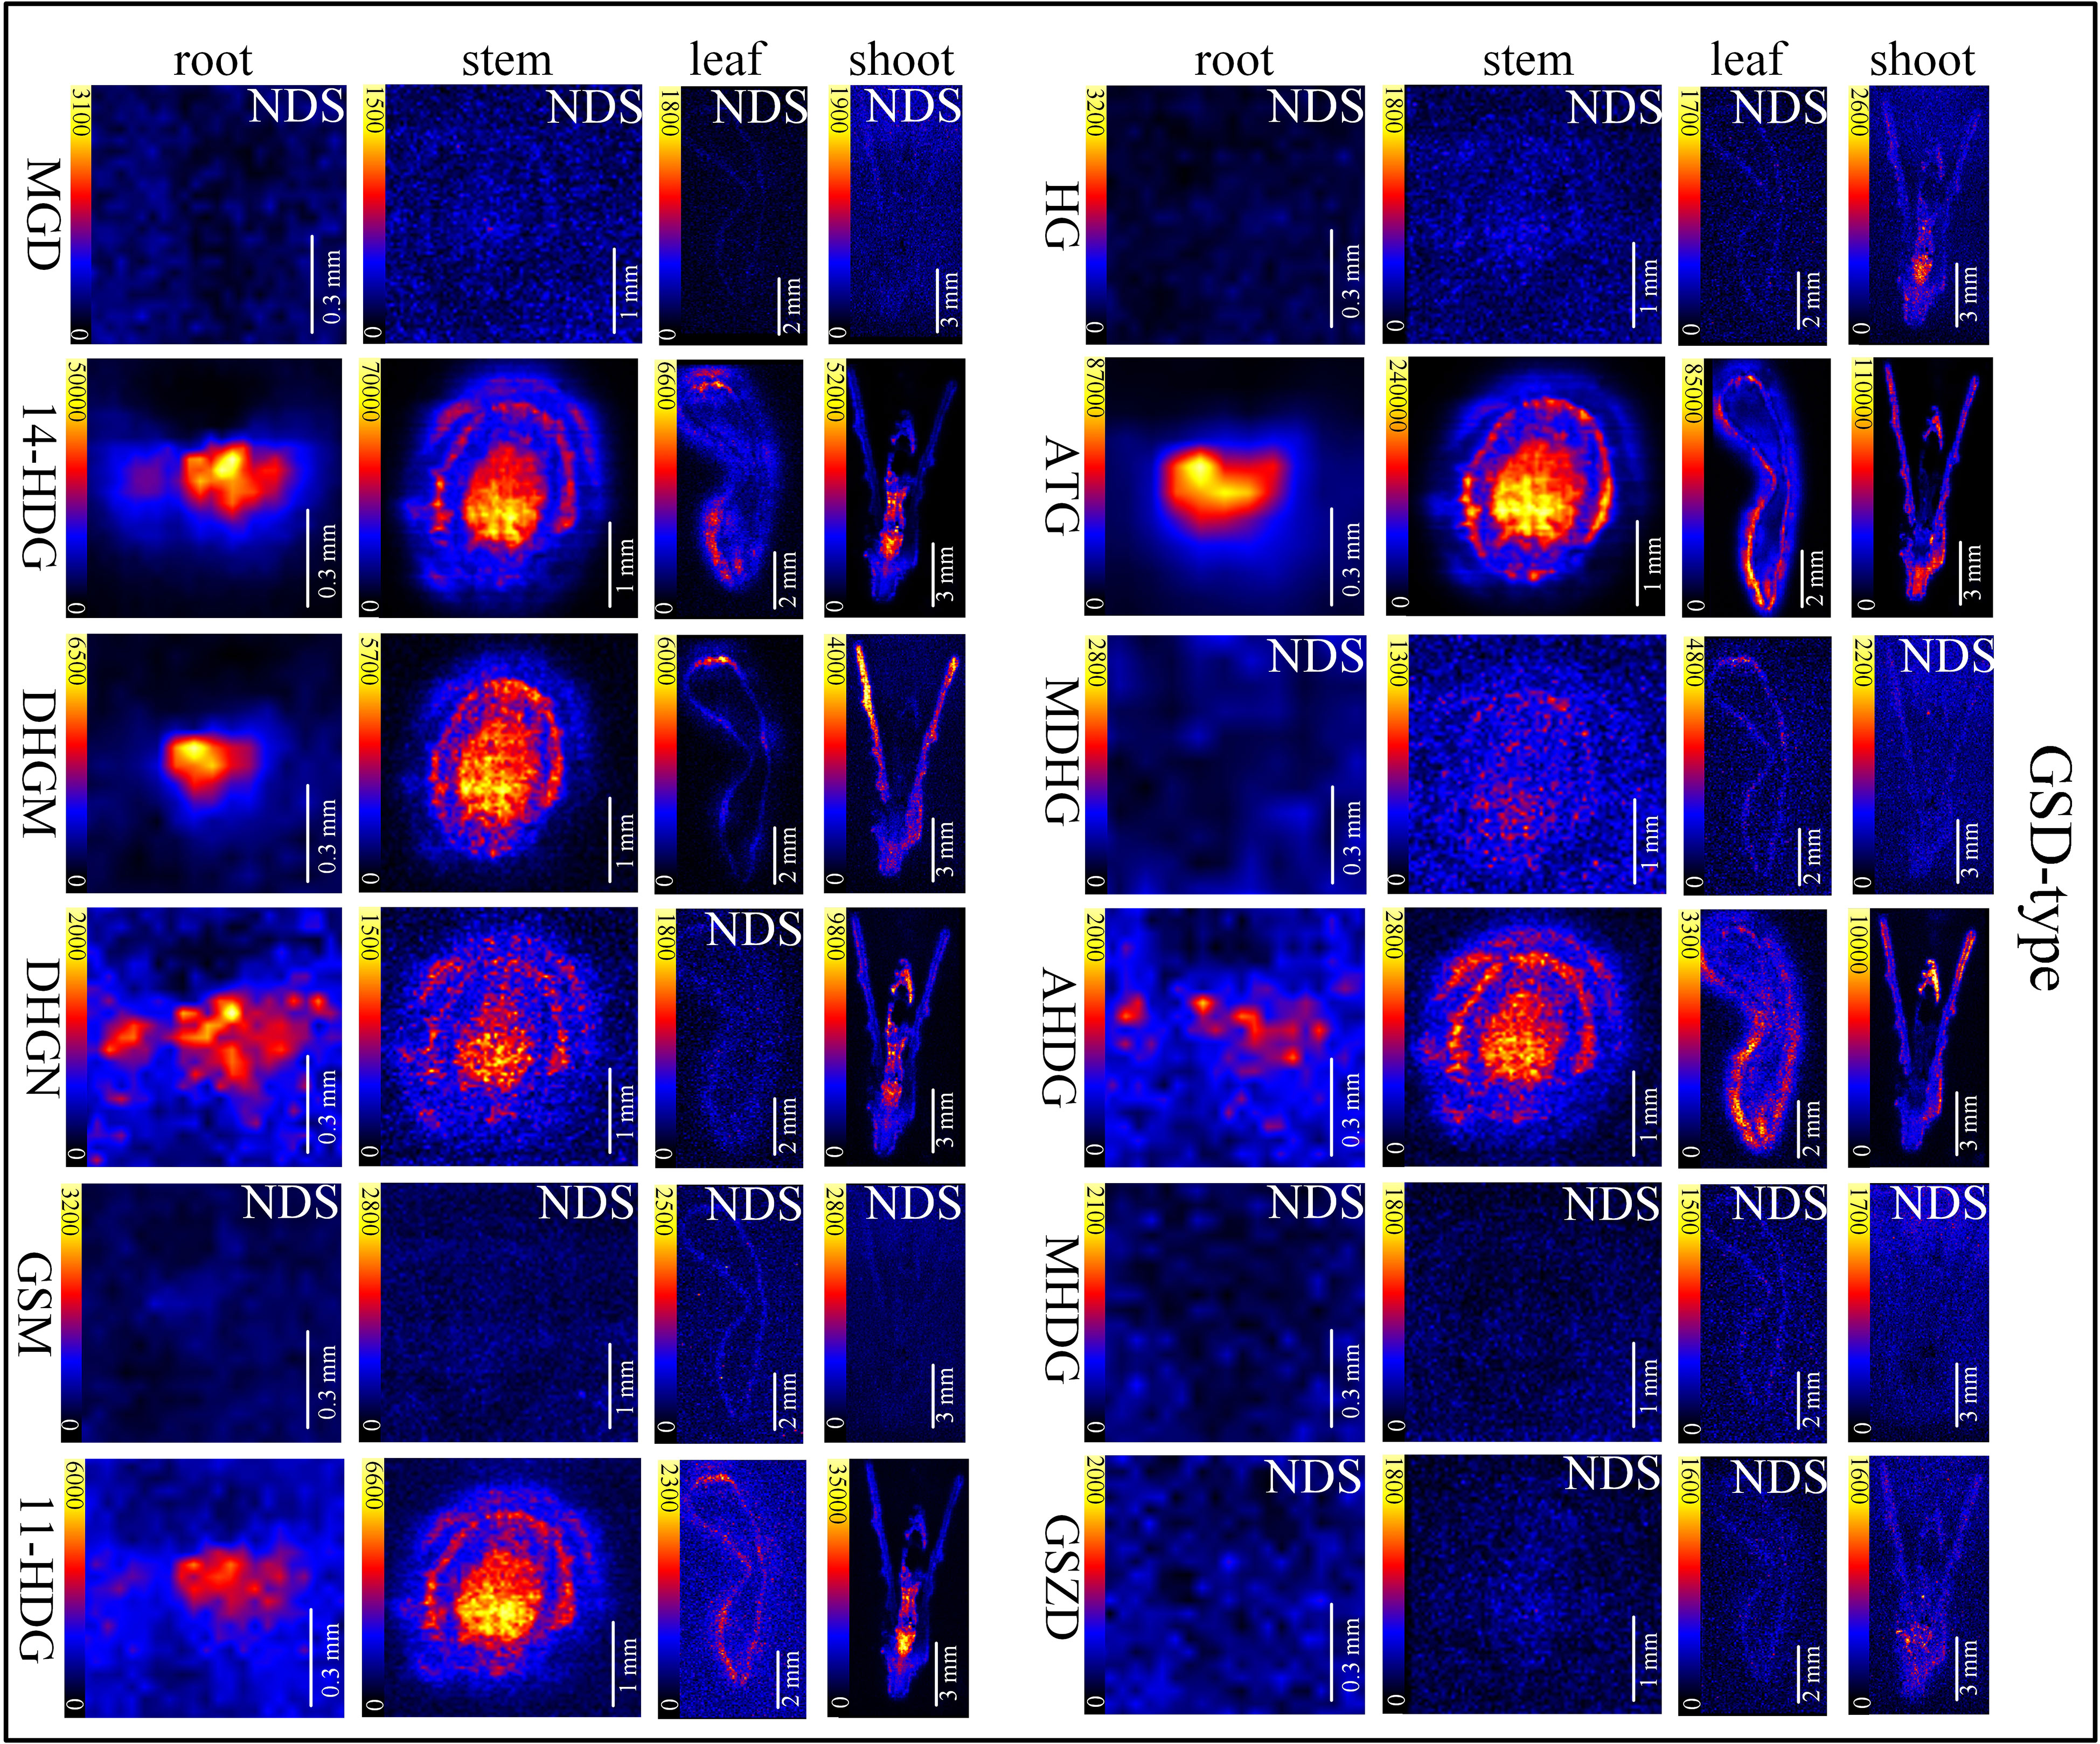
Figure 5 In situ visualization of gelsedine-type (GSD-type) alkaloids in different organ/tissue sections. NDS means no detectable signal. The names of the alkaloids are abbreviated. MGD, Nb-methylgelsedilam (m/z 329.1271); 14-HDG, 14-hydroxygelsenicine (m/z 343.1658); DHGM, 4,20-dehydrogelsemicine (m/z 357.1814); DHGN, 11,14-dihydroxygelsenicine (m/z 359.1607); GSM, gelsemicine (m/z 359.1951); 11-HDG:11-hydroxygelsemicine (m/z 373.1763); HG, hydroxylation of gelsemicine (m/z 375.1924); ATG, 14-acetoxygelsenicine (m/z 385.1763); MDHG, 11-methoxydihydrogelesemine (m/z 389.2085); AHDG, 14-acetoxy-15-hydroxygelsenicine (m/z 401.1713); MHDG, 11-methoxy-19-hydroxygelselegine (m/z 405.2009); GSZD, gelseoxazolidinine (m/z 429.2030).
Alkaloids distributions in root at different seedling stages
The accumulation of alkaloids is both spatially and temporally. In this study, DESI-MSI was used to visualize multiple alkaloids in seedling roots of G. elegans respectively at 30, 60 and 90 d-age. The typical DESI-MSI spectrums of alkaloids in seeding roots were acquired (Figure S7). The maps captured by DESI-MSI revealed the spatial distribution of multiple alkaloids (Figure S8) and the image brightness intensities represented their relative contents in tissues. By using the HDI 1.5 software, the relative quantification range of alkaloids in main location was shown (Table 2). Accordingly, 20 alkaloids were detected in G. elegans root at seedling stage. Along with the root development, more alkaloids were detected. For example, 14-acetoxygelsenicine (m/z 385) was detected in 60 d-age seedling and gelsemine N-oxide (m/z 339) had significant signal response in 90 d-age seedlings. In seedling roots, most of alkaloids were accumulated in the vascular bundle region. However, Nb-methylgelsedilam (m/z 329) were only detected in the epidermis of 60 d-age roots. Sempervirine (m/z 273) was enriched in the vascular bundle of 30 d-age roots, and was concentrated in the epidermis at 60 d and 90 d. Additionally, the alkaloids detected in seedling roots were not the same compared with that detected in mature roots (Figure 3). 14-acetoxy-15-hydroxygelsenicine (m/z 401) and 11,14-dihydroxygelsenicine (m/z 359) were detected in mature roots, but not detected in seedling roots. 19-(Z)-anhydrovobasinediol (m/z 309), gelsempervine A (m/z 383) and sempervirine (m/z 273) were only found in seedling roots.
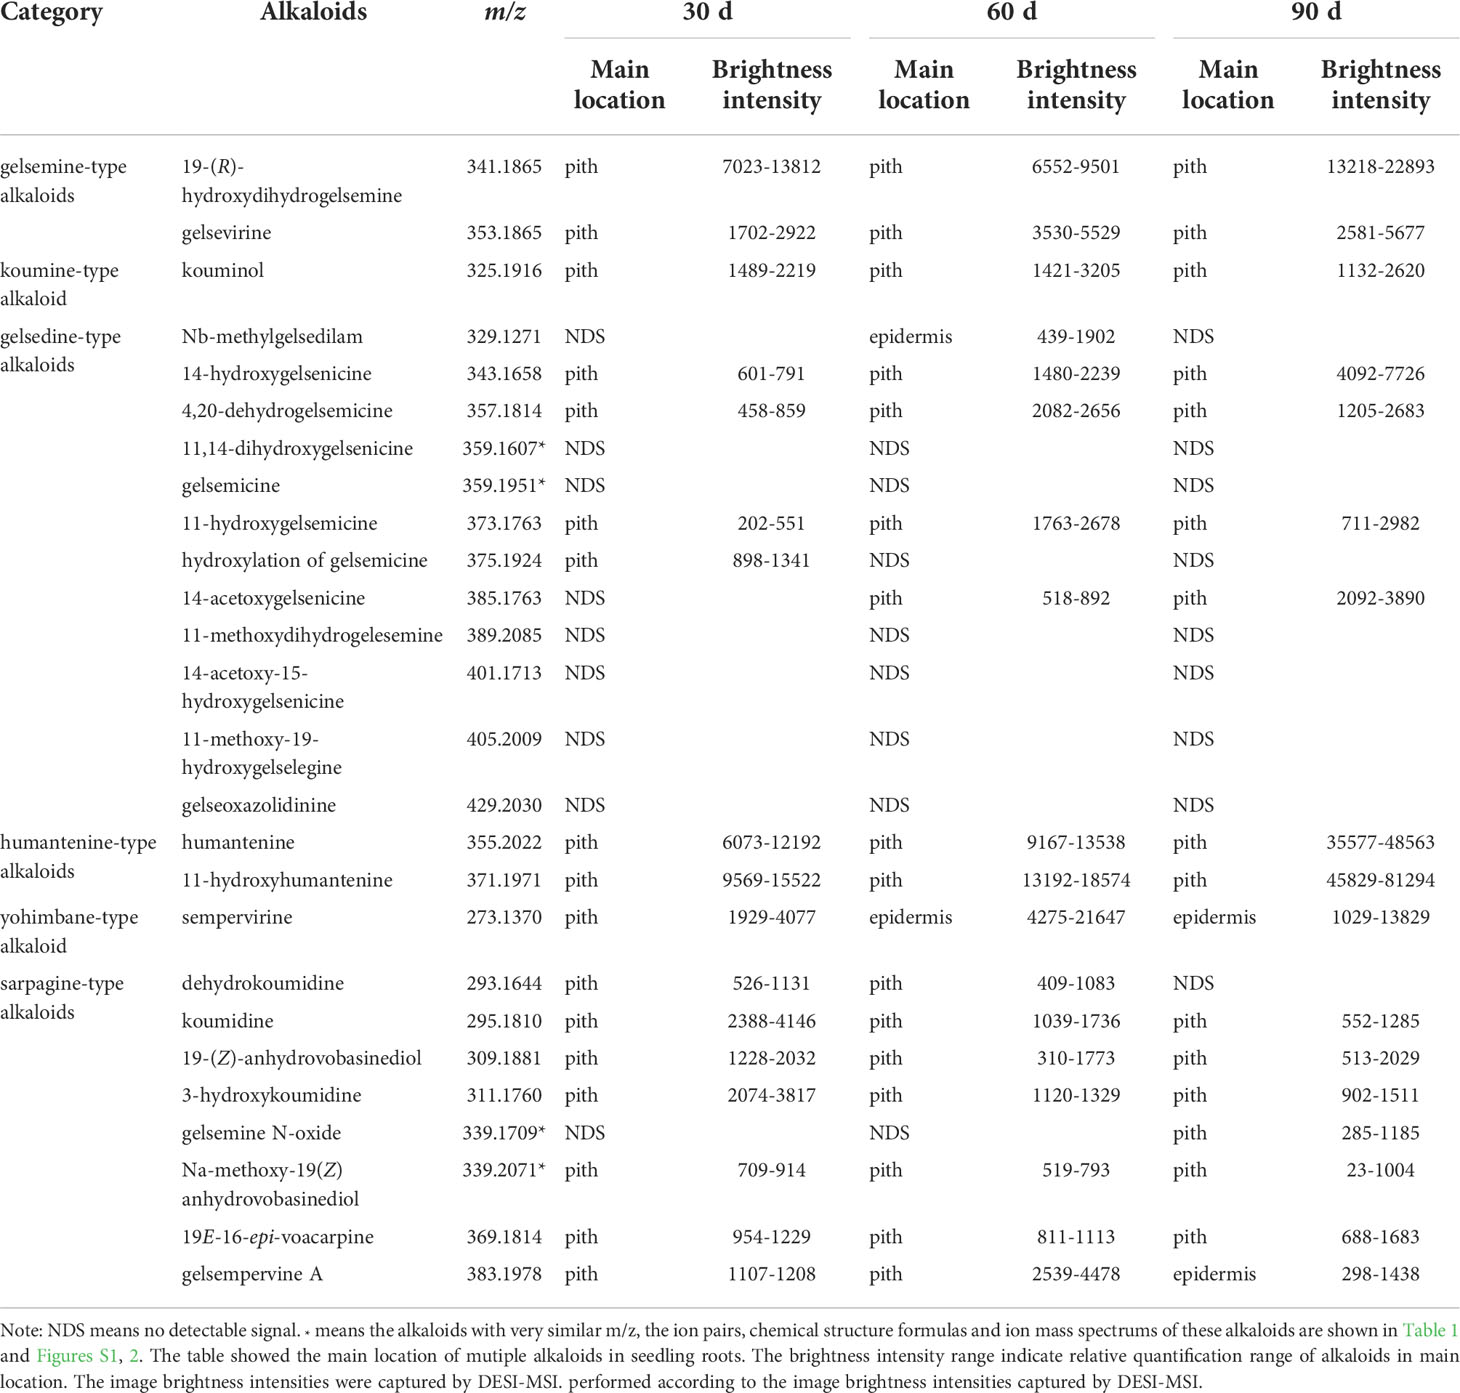
Table 2 Distribution of alkaloids in seedling roots.
Alkaloids distributions in stem at different seedling stages
The typical DESI-MSI spectrums of alkaloids in seeding stems were acquired (Figure S9). 21 alkaloids were visualized in the seedling stems through DESI-MSI, and more than half of the alkaloids were detected at the later stage of seedling (Figure S10 and Table 3). 10 alkaloids were detected in 30 d-age seedling, 13 alkaloids had signal response in 60 d-age seedlings, but 21 alkaloids were imaged in 90 d-age seedlings. Interestingly, the alkaloids detected in seedling stems was more than alkaloids in mature stems. A surprising discovery was that in situ distribution of alkaloids showed the phenomenon of transfer and diffusion along with the development and maturity of stems. In mature stems, 19E-16-epi-voacarpine (m/z 369) was mainly located in epidermis region (Figure 3), but in pith region at seedling stage. It indicated that 19E-16-epi-voacarpine gradually diffused from the inside to the outside during the growth process, and finally accumulated in epidermis region. 14-acetoxygelsenicine (m/z 385) and Na-methoxy-19(Z)anhydrovobasinediol (m/z 339) were enriched in pith region in 30 and 60 d-age seedlings, but diffused from pith to epidermis in 90 d-age seedlings. In addition, gelsemicine (m/z 359), 19-(Z)-anhydrovobasinediol (m/z 309) and gelsempervine A (m/z 383) were only detected in 90 d-age stems.
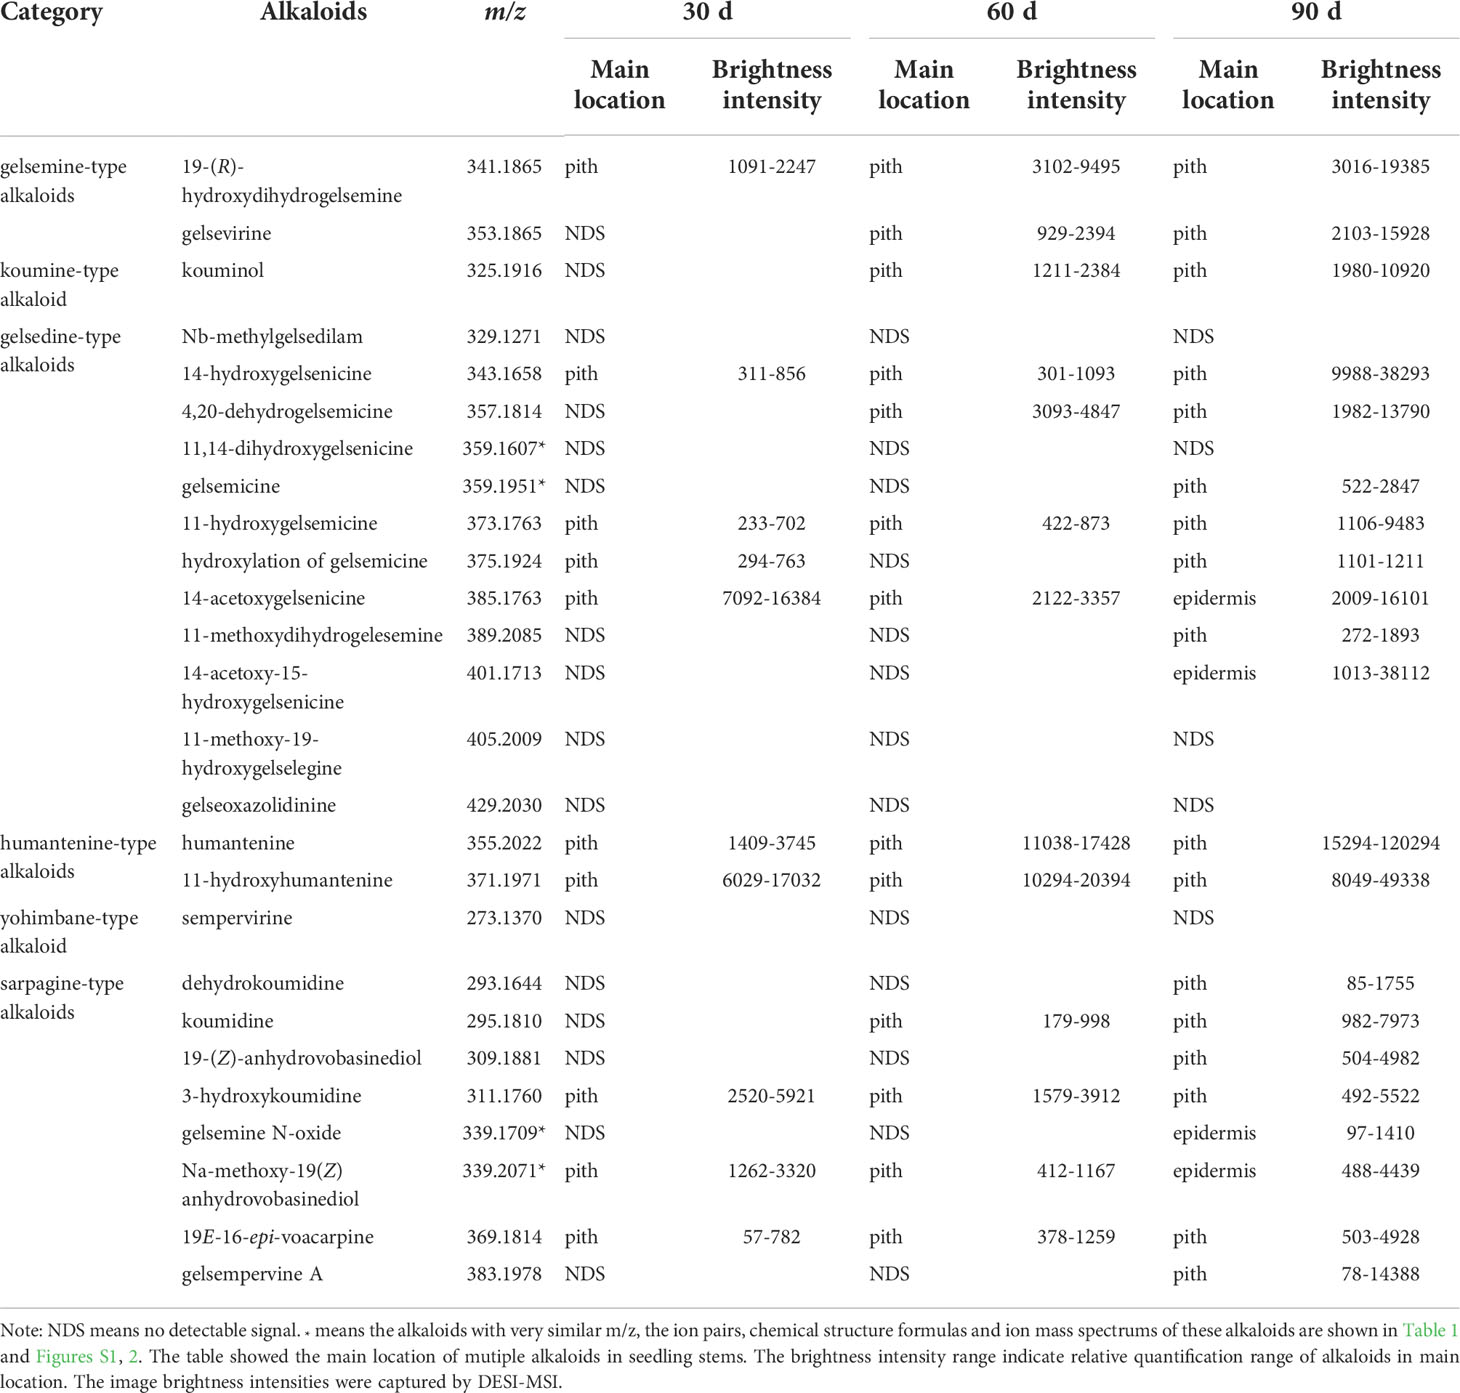
Table 3 Distribution of alkaloids in seedling stems.
Alkaloids distributions in leaf at different seedling stages
The typical DESI-MSI spectrums of alkaloids in seeding leaves were acquired (Figure S11). In seedling leaves, many alkaloids showed different distribution patterns (Figure S12 and Table 4). 16 alkaloids were detected in seedling leaves (Figure 3). 14-acetoxy-15-hydroxygelsenicine (m/z 401) and Na-methoxy-19(Z) anhydrovobasinediol (m/z 339) were respectively detected in leaf of 60 and 90 d-age seedling. As results, alkaloids were mainly concentrated in mesophyll at the early stage of seedling leaves, but they gradually enriched in leaf veins along with the development and eventually accumulates in large quantities at the later stage of seedling leaves. However, 14-acetoxy-15-hydroxygelsenicine (m/z 401) distribution was scattered in the leaves of 90 d-age seedling. 4 alkaloids were imaged in 30 d-age seedling, and no signal response in 60 d-age seedling, but they were surprisingly detected again in the leaves of 90 d-age seedling.
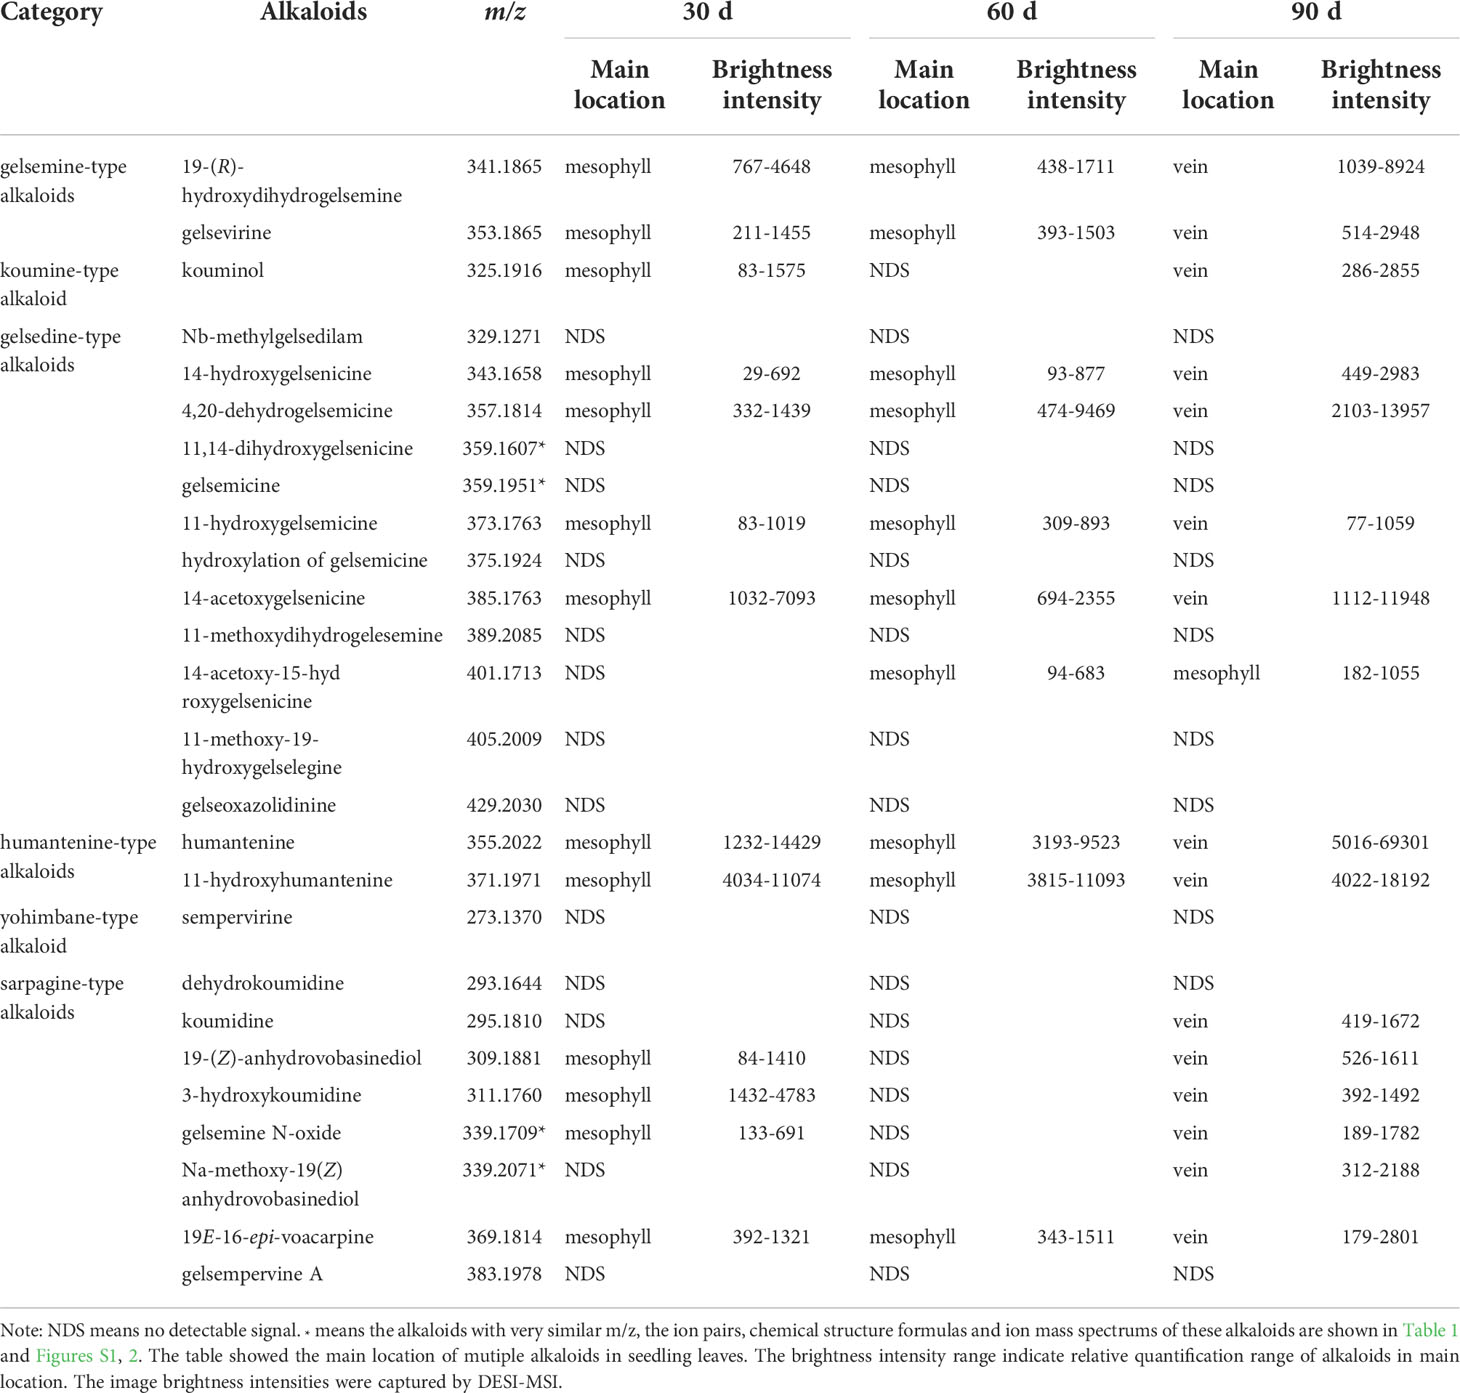
Table 4 Distribution of alkaloids in seedling leaves.
Discussion
Capabilities and applications of MSI in metabolomics
MSI has been developed to understand the spatial distribution of small organic molecules in organisms, and has been successfully applied to a variety of plants, including Hypericum perfortum roots (Tocci et al., 2018), Ginkgo biloba leaves (Li et al., 2018), Vitex agnus-castus fruits and leaves (Heskes et al., 2018) and strawberry fruits (Enomoto et al., 2018). MSI analysis enables spatial acquisition of targeted or untargeted metabolism data. MSI permits the determination of exactly where the target metabolites accumulate because of its higher resolution and accuracy. Recently, spatial metabolomics was developed based on MSI, which has greatly accelerated the development of biomedicine (Yen et al., 2014). This method was performed to study the distribution of key flavonoids involved in various synthesis pathways in mint leaves (Freitas et al., 2019). Through spatial metabolomics based on MSI, the localization of asparaptine A was identified in Asparagus officinalis (Nakabayashi et al., 2021). Spatial metabolomics was employed to simultaneously determine the spatial localization and distribution patterns of endogenous molecules in plant tissues and provide a theoretical basis for understanding the synthesis and interactions of multiple components (Palla et al., 2022).
DESI-MSI for visualizing spatiotemporal distribution of multiple alkaloids in Gelsemium elegans
Since the relationship between metabolites and their spatial distribution in plants attracts research interests (Moreno-Pedraza et al., 2019), DESI was successfully applied to the detection of alkaloids. In recent years, HPTLC-DESI-MSn was used to identify 13 aporphine and 4 benzylisoquinoline-type alkaloids in Ocotea spixiana (Conceicao et al., 2020). The quantitative imaging of 7 Uncaria alkaloids in rat brains using DESI-MSI was also performed (Gao et al., 2022). DESI-MSI was also used to visualize the spatial distribution of 63 metabolites in Salvia miltiorrhiza, and the complementary data obtained from the metabolomics coupled with mass spectrometry imaging enabled the identification of key reactions involved in flavonoid biosynthesis (Tong et al., 2022). Therefore, DESI-MSI is an useful tool to analyze the relationship between the spatial distribution and relative content of a specific compound. The authors’ group has previously applied DESI-MSI and visualized the spatial distribution of three alkaloids (gelsemine, koumine, and gelsenicine) in G. elegans (Wu et al., 2022b). In this study, in situ distribution of multiple alkaloids in organ/tissue sections of G. elegans at different growth stages were simultaneously visualized by DESI-MSI. 26 alkaloids in G. elegans were analyzed by LC-MS/MS, and the precursor ions, product ions and chemical formulas of these alkaloids were presented (Table 1). Among a total of 23 alkaloids detected in roots, stems, leaves and shoots of G. elegans by DESI-MSI, 19 alkaloids were found to exhibit specific spatiotemporal distribution in planta (Figure 3).
In mature roots, 16 alkaloids were located in vascular bundle region, and were decreased gradually from pith to epidermis. However, research on Rauvolfia tetraphylla showed that the spatial distribution of three alkaloids in roots mainly accumulated in epidermis (Kumara et al., 2019), indicating the in-situ distribution of alkaloids in roots of different medical plants is tissue specific. In mature stems, 17 alkaloids were detected and most of them were distributed in the pith region. However, sarpagine-type alkaloids such as gelsemine N-oxide and 19E-16-epi-voacarpine were mainly enriched in epidermis region. Sarpagine-type alkaloids serve as the precursors for the more complex ajmaline- and koumine- type indole alkaloids, and exhibit antimalarial activity (Chen et al., 2022). The accumulation of alkaloids is both spatially and temporally. Multiple alkaloids in roots, stems and leaves at different seedling stages of G. elegans were visualized by DESI-MSI (Figures S7–12; Tables 2–4). Moreover, the relative quantification (RQ) of alkaloids were performed according to the image brightness intensities captured by the DESI-MSI. The relative content of most alkaloids increased along with the growth of G. elegans. As many as 20, 21 and 16 alkaloids were respectively detected in seedling roots, stems and leaves. In seedling roots, 14-acetoxygelsenicine and gelsemine N-oxide showed spatial distribution from 60 d and 90 d, respectively. In seedling leaves, 14-acetoxy-15-hydroxygelsenicine and Na-methoxy-19-(Z)-anhydrovobasinediol were detected from 60 d and 90 d. In seedling stems, the accumulation time points of alkaloids were found to be inconsistent, 10 and 13 alkaloids had signal response respectively at 30 d, 60 d, and the later stage of seedling. Several secondary metabolites have been reported to accumulate in developing seeds, presumably confer resistance against abiotic and biotic stress during seed dispersal and germination (Patrick and Offler, 2001; Dyer et al., 2001; Alves et al., 2007). Secondary metabolites are either synthesized de novo in the seed from available precursors or are transported from elsewhere in the plant. In the present study, although it is hard to tell whether the alkaloids detected in seedlings at 30 d are synthesized locally or not, it is sure that the alkaloids detected at the later stage was produced by a series of enzymatic reactions during plant development. In either case, it will be interesting to examine their spatial and temporal pattern of accumulation. Another surprising finding was the spatial distribution of multiple alkaloids changed significantly along with the stem development, 14-acetoxygelsenicine and Na-methoxy-19-(Z)-anhydrovobasinediol were enriched in vascular bundle region at the early stage of seedling and then diffused to epidermis at 90 d. 19E-16-epi-voacarpine was mainly located in vascular bundle region of seedling stems, and then diffused to epidermis region of mature stems. Since the biosynthesis and storage of plant metabolites are highly regulated, it is possible that these alkaloids localized in stems at the early stage will play roles in stress resistance at different growth stages or the alkaloids transportation to the epidermis from other parts are involved. Thus the spatial-temporal distribution of these alkaloids would be precisely regulated in stress responses.
The spatial metabolomics is a developing sub-branch of metabolomics rarely employed in medical plant studies, especially the plant alkaloids research. Only a few studies in plants have been previously reported including the spatial metabolome (monoterpene and paeonol glycosides, tannins, flavonoids, saccharides and lipids) of Paeonia suffruticosa and Paeonia lactiflora roots by MALDI-MSI (Li et al., 2021), the spatial metabolome (flavonoids, ginkgolic acids, cardanols, saccharides, phospholipids and chlorophylls) of Ginkgo biloba by MALDI and LDI-MSI (Li et al., 2018). Using DESI-MSI method, we successfully visualized the spatial distribution for as more as 26 alkaloids in different G. elegans tissues at different growth stages, and analyzed the spatial transport of specific alkaloid. In addition to the visualization of spatial distribution of alkaloids in plant tissues, this study also provides robust data for further constructing spatial omics frameworks for multiple alkaloids in G. elegans, which will greatly promote DESI-MSI application in plants.
Conclusion
The DESI-MSI technique provides an efficient approach to directly visualize the target molecules in situ in plants without the extra extraction and processing. In this study, 23 alkaloids were visualized in roots, stems and leaves at seedling stage and 19 alkaloids were observed at mature stage by using DESI-MSI. Among them, 16 alkaloids were distributed in vascular bundle region of mature roots, 15 alkaloids were mainly located in the pith region of mature stems and 2 alkaloids were enriched in epidermis region of mature stems. In addition, 17 alkaloids were detected in shoots and 16 alkaloids were detected in mature leaf veins. Interestingly, along with the development process of G. elegans, in situ distribution showed that multiple alkaloids in tissues may undergo diffusion and transfer. Overall, our work indicated DESI-MSI is a promising spatial omics technique for visualizing the spatiotemporal distribution of alkaloids in plants.
Data availability statement
The original contributions presented in the study are included in the article/Supplementary Material. Further inquiries can be directed to the corresponding authors.
Author contributions
Z-HW and R-ZW developed the sample preparation and MSI method, and compiled the manuscript. YS interpreted the results and drafted the manuscript. Z-LS supported the method development and the data analysis. L-TX acquired funding, supervised the project and revised the manuscript. All authors contributed to the article and approved the submitted version.
Funding
This study was supported by the financial support from the National Natural Science Foundation of China (grant number: 91317312 and 31871714), and Provincial Natural Science Foundation of Hunan (grant number: 2022JJ30294).
Acknowledgments
We are very grateful to Zhihong Gong (Waters Corporation, Shanghai) for his technical support during DESI experiments, Zhaoying Liu (Hunan Agricultural University, Changsha) for providing seeds of Gelsemium elegans, and Yaqi Liu (University of the Arts London, London) for image processing assistance.
Conflict of interest
The authors declare that the research was conducted in the absence of any commercial or financial relationships that could be construed as a potential conflict of interest.
Publisher’s note
All claims expressed in this article are solely those of the authors and do not necessarily represent those of their affiliated organizations, or those of the publisher, the editors and the reviewers. Any product that may be evaluated in this article, or claim that may be made by its manufacturer, is not guaranteed or endorsed by the publisher.
Supplementary material
The Supplementary Material for this article can be found online at: https://www.frontiersin.org/articles/10.3389/fpls.2022.1051756/full#supplementary-material
`References
Alves, M. N., Sartoratto, A., Trigo, ,. J. R. (2007). Scopolamine in brugmansia suaveolens (Solanaceae): defense, allocation, costs, and induced response. J. Chem. Ecol. 33, 297–309. doi: 10.1007/s10886-006-9214-9
Bjarnholt, N., Li, B., D'Alvise, J., Janfelt, C. (2014). Mass spectrometry imaging of plant metabolites - principles and possibilities. Nat. Prod. Rep. 31, 818–837. doi: 10.1039/c3np70100j
Bong, Y., Li, B., Malitsky, S., Rogachev, L., Aharoni, A., Kaftan, F., et al. (2016). Sample preparation for mass spectrometry imaging of plant tissues: A review. Front. Plant Sci. 7. doi: 10.3389/fpls.2016.00060
Boughton, B. A., Thinagaran, D., Sarabia, D., Bacic, A., Roessner, U. (2016). Mass spectrometry imaging for plant biology: A review. Phytochem. Rev. 15, 445–488. doi: 10.1007/s11101-015-9440-2
Buscher, J. M., Czernik, D., Ewald, J. C., Sauer, U., Zamboni, N. (2009). Cross-platform comparison of methods for quantitative metabolomics of primary metabolism. Anal. Chem. 81, 2135–2143. doi: 10.1021/ac8022857
Campbell, D. I., Ferreira, C. R., Eberlin, L. S., Cooks, ,. R. G. (2012). Improved spatial resolution in the imaging of biological tissue using desorption electrospray ionization. Anal. Bioanal. Chem. 404, 389–398. doi: 10.1007/s00216-012-6173-6
Chen, W., Ma, Y., He, W., Wu, Y., Huang, Y., Zhang, Y., et al. (2022). Structure units oriented approach towards collective synthesis of sarpagine-ajmaline-koumine type alkaloids. Nat. Commun. 13, 908. doi: 10.1038/s41467-022-28535-x
Conceicao, R. S., Reis, I. M. A., Cerqueira, A. P. M., Perez, C. J., Junior, M., Branco, A., et al. (2020). Rapid structural characterisation of benzylisoquinoline and aporphine alkaloids from Ocotea spixiana acaricide extract by HPTLC-DESI-MSn. Phytochem. Anal. 31, 711–721. doi: 10.1002/pca.2935
Cordell, G. A. (2013). Fifty years of alkaloid biosynthesis in phytochemistry. Phytochemistry. 91, 29–51. doi: 10.1016/j.phytochem.2012.05.012
Dilillo, M., Ait-Belkacem, R., Esteve, C., Pellegrini, D., Nicolardi, S., Costa, M., et al. (2017). Ultra-high mass resolution MALDI imaging mass spectrometry of proteins and metabolites in a mouse model of glioblastoma. Sci. Rep. 7, 603. doi: 10.1038/s41598-017-00703-w
Dutkiewicz, E. P., Su, C.-H., Lee, H.-J., Hsu, C.-C., Yang, Y.-L. (2021). Visualizing vinca alkaloids in the petal of Catharanthus roseus using functionalized titanium oxide nanowire substrate for surface-assisted laser desorption/ionization imaging mass spectrometry. Plant J. 105, 1123–1133. doi: 10.1111/tpj.15092
Dyer, L. A., Dodson, C. D., Beihoffer, J., Letourneau, ,. D. K. (2001). Trade-offs in antiherbivore defenses in piper cenocladum: ant mutualists versus plant secondary metabolites. J. Chem. Ecol. 27, 581–592. doi: 10.1023/a:1010345123670
Enomoto, H., Sato, K., Miyamoto, K., Ohtsuka, A., Yamane, H. (2018). Distribution analysis of anthocyanins, sugars, and organic acids in strawberry fruits using matrix-assisted laser desorption/ionization-imaging mass spectrometry. J. Agr. Food Chem. 66, 4958–4965. doi: 10.1021/acs.jafc.8b00853
Facchini, P. J. (2001). Alkaloid biosynthesis in plants: biochemistry, cell biology, molecular regulation, and metabolic engineering applications. Annu. Rev. Plant Physiol. Plant Mol. Biol. 52, 29–66. doi: 10.1146/annurev.arplant.52.1.29
Freitas, J. R. L. E., Vendramini, P. H., Melo, J. O. F., Eberlin, M. N., Augusti, R. (2019). Assessing the spatial distribution of key flavonoids in Mentha × piperita leaves: an application of desorption electrospray lonization mass spectrometry imaging (DESI-MSI). J. Brazil. Chem. Soc 30, 1437–1446. doi: 10.21577/0103-5053.20190039
Gao, L., Zhang, Z., Wu, W., Deng, Y., Zhi, H., Long, H., et al. (2022). Quantitative imaging of natural products in fine brain regions using desorption electrospray ionization mass spectrometry imaging (DESI-MSI): Uncaria alkaloids as a case study. Anal. Bioanal. Chem. 414, 4999–5007. doi: 10.1007/s00216-022-04130-3
Heskes, A. M., Sundram, T. C. M., Boughton, B. A., Jensen, N. B., Hansen, N. L., Crocoll, C., et al. (2018). Biosynthesis of bioactive diterpenoids in the medicinal plant Vitex agnus-castus. Plant J. 93, 943–958. doi: 10.1111/tpj.13822
Ifa, D. R., Srimany, A., Eberlin, L. S., Naik, H. R., Bhat, V., Cooks, R. G., et al. (2011). Tissue imprint imaging by desorption electrospray ionization mass spectrometry. Anal. Methods 3, 1910–1912. doi: 10.1039/c1ay05295k
Jeckel, A. M., Matsumura, K., Nishikawa, K., Morimoto, Y., Saporito, R. A., Grant, T., et al. (2020). Use of whole-body cryosectioning and desorption electrospray ionization mass spectrometry imaging to visualize alkaloid distribution in poison frogs. J. Mass. Spectrom. 55, 4520. doi: 10.1002/jms.4520
Jin, G. L., Su, Y. P., Liu, M., Xu, Y., Yang, J., Liao, K. J., et al. (2014). Medicinal plants of the genus Gelsemium (Gelsemiaceae, gentianales)-a review of their phytochemistry, pharmacology, toxicology and traditional use. J. Ethnopharmacol. 152, 33–52. doi: 10.1016/j.jep.2014.01.003
Kumara, P. M., Shaanker, R. U., Pradeep, T. (2019). UPLC and ESI-MS analysis of metabolites of Rauvolfia tetraphylla l. and their spatial localization using desorption electrospray ionization (DESI) mass spectrometric imaging. Phytochemistry. 159, 20–29. doi: 10.1016/j.phytochem.2018.11.009
Lee, E. J., Hagel, J. M., Facchini, ,. P. J. (2013). Role of the phloem in the biochemistry and ecophysiology of benzylisoquinoline alkaloid metabolism. Front. Plant Sci. 4. doi: 10.3389/fpls.2013.00182
Liao, Y., Fu, X., Zhou, H., Rao, W., Zeng, L., Yang, Z. (2019). Visualized analysis of within-tissue spatial distribution of specialized metabolites in tea (Camellia sinensis) using desorption electrospray ionization imaging mass spectrometry. Food Chem. 292, 204–210. doi: 10.1016/j.foodchem.2019.04.055
Li, B., Ge, J. Y., Liu, W., Hu, D. J., Ping, L. (2021). Unveiling spatial metabolome of Paeonia suffruticosa and Paeonia lactiflora roots using MALDI MS imaging. New Phyto. 231, 892–902. doi: 10.1111/NPH.17393
Li, B., Neumann, E. K., Ge, J. Y., Gao, W., Yang, H., Li, P., et al. (2018). Interrogation of spatial metabolome of Ginkgo biloba with high-resolution matrix-assisted laser desorption/ionization and laser desorption/ionization mass spectrometry imaging. Plant Cell Environ. 41, 2693–2703. doi: 10.1111/pce.13395
Liu, D., Han, Y., Zhou, H., Jin, H., Kang, H., Huang, F., et al. (2021). Offline preparative three-dimensional HPLC for systematic and efficient purification of alkaloids from Gelsemium elegans benth. J. Chromatogr. A. 1640, 461935. doi: 10.1016/j.chroma.2021.461935
Liu, Y. C., Lin, L., Cheng, P., Sun, Z. L., Wu, Y., Liu, Z. Y. (2017a). Fingerprint analysis of gelsemium elegans by HPLC followed by the targeted identification of chemical constituents using HPLC coupled with quadrupole-time-of-flight mass spectrometry. Fitoterapia. 121, 94–105. doi: 10.1016/j.fitote.2017.07.002
Liu, D., Liu, Y., Shen, A., Li, X., Yu, L., Wang, C., et al. (2022). Analysis of alkaloids in Gelsemium elegans benth using an online heart-cutting + comprehensive RPLCxRPLC system tandem mass spectrometry. Talanta. 239, 123069. doi: 10.1016/j.talanta.2021.123069
Liu, M., Shen, J., Liu, H., Xu, Y., Su, Y. P., Yang, J., et al. (2011). Gelsenicine from Gelsemium elegans attenuates neuropathic and inflammatory pain in mice. Biol. Pharm. Bull. 34, 1877–1880. doi: 10.1248/bpb.34.1877
Liu, Y. C., Xiao, S., Yang, K., Ling, L., Sun, Z. L., Liu, Z. Y. (2017b). Comprehensive identification and structural characterization of target components from gelsemium elegans by high-performance liquid chromatography coupled with quadrupole time-of-flight mass spectrometry based on accurate mass databases combined with MS/MS spectra. J. Mass. Spectrom. 52, 378–396. doi: 10.1002/jms.3937
Manicke, N. E., Wiseman, J. M., Ifa, D. R., Cooks, R. G. (2008). Desorption electrospray ionization (DESI) mass spectrometry and tandem mass spectrometry (MS/MS) of phospholipids and sphingolipids: ionization, adduct formation, and fragmentation. J. Am. Soc. Mass. Spectr. 19, 531–543. doi: 10.1016/j.jasms.2007.12.003
Moreno-Pedraza, A., Rosas-Roman, I., Garcia-Rojas, N. S., Guillen-Alonso, H., Ovando-Vazquez, C., Diaz-Ramirez, D., et al. (2019). Elucidating the distribution of plant metabolites from native tissues with laser desorption low-temperature plasma mass spectrometry imaging. Anal. Chem. 91, 2734–2743. doi: 10.1021/acs.analchem.8b04406
Muller, T., Oradu, S., Ifa, D. R., Cooks, R. G., Krautler, B. (2011). Direct plant tissue analysis and imprint imaging by desorption electrospray ionization mass spectrometry. Anal. Chem. 83, 5754–5761. doi: 10.1021/ac201123t
Nakabayashi, R., Hashimoto, K., Mori, T., Toyooka, K., Sudo, H., Saito, K. (2021). Spatial metabolomics using imaging mass spectrometry to identify the localization of asparaptine a in Asparagus officinalis. Plant Biotechnol. (Tokyo). 38, 311–315. doi: 10.5511/plantbiotechnology.21.0504b
Ozkartal, T., Auricchio, A., Conte, G. (2019). Ajmaline infusion during automated screening in brugada syndrome and spontaneous type 1 electrocardiogram unmasks non-suitability for subcutaneous implantable cardioverter-defibrillator. Eur. Heart J. 40, 1888–1889. doi: 10.1093/eurheartj/ehz049
Palla, G., Spitzer, H., Klein, M., Fischer, D., Schaar, A. C., Kuemmerle, L. B., et al. (2022). Squidpy: a scalable framework for spatial omics analysis. Nat. Methods 19, 171–178. doi: 10.1038/s41592-021-01358-2
Patrick, J. W., Offler, C. E. (2001). Compartmentation of transport and transfer events in developing seeds. J. Exp. Bot. 52, 551–564. doi: 10.1093/jxb/52.356.551
Souza, J., Lourenco, H. M., Mendes, G. (2017). Low-dose chemotherapy with methotrexate and vinblastine for desmoid tumors: a single institution experience. Ann. Onco. 28, 3528. doi: 10.1093/annonc/mdx387.022
Tocci, N., Gaid, M., Kaftan, F., Belkheir, A. K., Belhadj, I., Liu, B. Y., et al. (2018). Exodermis and endodermis are the sites of xanthone biosynthesis in Hypericum perforatum roots. New Phytol. 217, 1099–1112. doi: 10.1111/nph.14929
Tong, Q., Zhang, C., Tu, Y., Chen, J., Li, Q., Zeng, Z., et al. (2022). Biosynthesis-based spatial metabolome of Salvia miltiorrhiza bunge by combining metabolomics approaches with mass spectrometry-imaging. Talanta. 238, 123045. doi: 10.1016/j.talanta.2021.123045
Wang, L., Wang, J. F., Mao, X., Jiao, L., Wang, X. J. (2017). Gelsedine-type oxindole alkaloids from Gelsemium elegans and the evaluation of their cytotoxic activity. Fitoterapia. 120, 131–135. doi: 10.1016/j.fitote.2017.06.005
Wu, V., Tillner, J., Jones, E., McKenzie, J. S., Gurung, D., Mroz, A., et al. (2022a). High resolution ambient MS imaging of biological samples by desorption electro-flow focussing ionization. Anal. Chem. 94, 10035–10044. doi: 10.1021/acs.analchem.2c00345
Wu, Z. H., Su, Y., Luo, Z. F., Sun, Z. L., Gong, Z. H., Xiao, ,. L. T. (2022b). In situ visual distribution of gelsemine, koumine, and gelsenicine by MSI in Gelsemium elegans at different growth stages. Molecules. 27, 1810. doi: 10.3390/molecules27061810
Ye, Q., Feng, Y., Wang, Z., Zhou, A., Xie, S., Fan, L., et al. (2019). Effects of dietary Gelsemium elegans alkaloids on intestinal morphology, antioxidant status, immune responses and microbiota of Megalobrama amblycephala. Fish. Shellfish. Immun. 94, 464–478. doi: 10.1016/j.fsi.2019.09.048
Yen, T. C., Visvikis, D., Pan, T., Fang, ,. Y. H. (2014). Biomedical imaging: role and opportunities of medical imaging in the "omics" era. BioMed. Res. Int. 2014, 930213. doi: 10.1155/2014/930213
Keywords: mass spectrometry imaging, alkaloid, Gelsemium elegans, spatio-temporal distribution, DESI-MSI
Citation: Wu Z-H, Wang R-Z, Sun Z-L, Su Y and Xiao L-T (2022) A mass spectrometry imaging approach on spatiotemporal distribution of multiple alkaloids in Gelsemium elegans. Front. Plant Sci. 13:1051756. doi: 10.3389/fpls.2022.1051756
Received: 23 September 2022; Accepted: 01 November 2022;
Published: 18 November 2022.
Edited by:
Xiaodong Wang, Minzu University of China, ChinaCopyright © 2022 Wu, Wang, Sun, Su and Xiao. This is an open-access article distributed under the terms of the Creative Commons Attribution License (CC BY). The use, distribution or reproduction in other forums is permitted, provided the original author(s) and the copyright owner(s) are credited and that the original publication in this journal is cited, in accordance with accepted academic practice. No use, distribution or reproduction is permitted which does not comply with these terms.
*Correspondence: Lang-Tao Xiao, ltxiao@hunau.edu.cn; Yi Su, yisu@hunau.edu.cn