 Irfan Ali Sabir1†
 Muhammad Aamir Manzoor2†
 Iftikhar Hussain Shah1
 Xunju Liu1Songtao Jiu1Jiyuan Wang1Pravej Alam3
 Muhammad Abdullah1Caixi Zhang1*
- 1Department of Plant Science, School of Agriculture and Biology, Shanghai Jiao Tong University, Shanghai, China
- 2School of Life Sciences, Anhui Agricultural University, Hefei, China
- 3Department of Biology, College of Science and Humanities, Prince Sattam Bin Abdulaziz University, Al-Kharj, Saudi Arabia
Glutathione S-transferases (GSTs) in plants are multipurpose enzymes that are involved in growth and development and anthocyanins transportation. However, members of the GST gene family were not identified in sweet cherry (Prunus avium). To identify the GST genes in sweet cherry, a genome-wide analysis was conducted. In this study, we identified 67 GST genes in P. avium genome and nomenclature according to chromosomal distribution. Phylogenetic tree analysis revealed that PavGST genes were classified into seven chief subfamily: TCHQD, Theta, Phi, Zeta, Lambda, DHAR, and Tau. The majority of the PavGST genes had a relatively well-maintained exon–intron and motif arrangement within the same group, according to gene structure and motif analyses. Gene structure (introns-exons) and conserved motif analysis revealed that the majority of the PavGST genes showed a relatively well-maintained motif and exons–introns configuration within the same group. The chromosomal localization, GO enrichment annotation, subcellular localization, syntenic relationship, Ka/Ks analysis, and molecular characteristics were accomplished using various bioinformatics tools. Mode of gene duplication showed that dispersed duplication might play a key role in the expansion of PavGST gene family. Promoter regions of PavGST genes contain numerous cis-regulatory components, which are involved in multiple stress responses, such as abiotic stress and phytohormones responsive factors. Furthermore, the expression profile of sweet cherry PavGSTs showed significant results under LED treatment. Our findings provide the groundwork for future research into induced LED anthocyanin and antioxidants deposition in sweet cherries.
Introduction
Many physiological and metabolic processes are dependent on transcriptional regulation of gene expression in plants, particularly response to various environmental stimulation and stressors like drought, salt, and cold along with defensive responses toward pathogenic organisms (Qu and Zhu, 2006). The action of these transcription factors (TFs) can retain, improve, or suppress gene expression at the molecular level. The functional regulation of these TFs represents a dynamic mechanism that assists higher plants to adapt to environmental changes, as well as other developmental and genetic responses (Benfey and Weigel, 2001; Carroll, 2005). Mainly, variations in TFs activity or quantitative levels are responsible for regulating gene expression. Based on their conserved domains, more than 84 families of TFs have been identified so far (Pérez-Rodríguez et al., 2010). The Glutathione S-transferases (GSTs) TF family was first identified in maize (Frear and Swanson, 1970), and is responsible for the transport and metabolism of secondary compounds, including porphyrins, flavonoids, and anthocyanins (Dixon et al., 2010). GSTs are quite a vast, old, and diversified family of multifunctional proteins present in virtually all aerobic species, including humans. In many plants, GSTs are found in the cytoplasm, where they might be found as monomers, or heterodimers of 23–30 kDa, depending on the type of GST. Each subunit has a glutathione binding (G-site) at the N-terminus domain and a C-terminal domain that defines second-substrate specificity (C-site; Edwards et al., 2000).
Plant GSTs are categorized into 11 classes according to dynamic site residues, protein sequence resemblance, and genetic association: Tau, Zeta, Phi, Lambda, Theta, TCHQD (tetrachlorohydroquinone dehalogenase), DHAR (dehydroascorbate reductase), mPGES2 (microsomal prostaglandin -e -synthase type 2), EF1G (elongation factor 1; Sheehan et al., 2001). TCHQD, Tau, Phi, and Lambda are plant-specific GSTs between all these classes. Furthermore, In silico investigations have recently confirmed that there are 79 genes in Oryza sativa (rice; Jain et al., 2010), 53 Arabidopsis thaliana (Sappl et al., 2009), 90 in Solanum lycopersicum (tomato; Islam et al., 2017), 23 in Citrus X sinensis (sweet oranges; Licciardello et al., 2014), 85 in Piper nigrum (black paper; Islam et al., 2019), 42 in Zea mays (maize), 25 in Glycine max (soybean; McGonigle et al., 2000), 52 in Malus domestica (apple) and 50 in Prunus persica (peach; Fang et al., 2020).
Flavonoids are secondary metabolites found in virtually all higher plants and support a variety of biological activities. They are the primary mediators of plant auxin transport and might be deployed to protect plants from biotic and abiotic stressors (Winkel-Shirley, 2001). Anthocyanin is a kind of flavonoid found in a diverse array of higher plants. They are important for attracting seed dispersers (Vogt et al., 1994) and UV protection (Sarma and Sharma, 1999). Anthocyanin is a kind of water-soluble pigment found in flavonoid compounds that are found in a variety of plants. The pH value of vacuoles influences the development of color (Jackson et al., 1992; Steyn et al., 2002). Anthocyanins work as a ripening indicator for many species, suggesting that fruits with more anthocyanin content have better market value and health advantages (Boyer and Liu, 2004). The presence of anthocyanin not only enhances the fruit quality but also has economic consequences. The cytosol produces anthocyanins, which are then transferred to the vacuole for storage. The mechanism of transporting anthocyanins is not as well known as the method of synthesis. Recently, three distinct hypotheses regarding the transit of anthocyanin to the vacuole have been proposed: GST-mediated pathway, membrane transporters, and vesicle trafficking, and all of these functioned in a well-collaborated way (Zhao, 2015). Anthocyanin is transported from endoplasmic reticulum (ER) to the vacuole through GSTs (Dixon et al., 2010; Zhu et al., 2016), which are key non-catalytic carrier proteins for anthocyanin absorption by vacuoles (Kitamura et al., 2004; Zhu et al., 2016). Furthermore, functional investigations have shown that particular plant GSTs are required for anthocyanin and proanthocyanidin vacuolar deposition. The role of these GSTs in vacuolar anthocyanin transportation was initially discovered in the maize bronze-2 (bz2, GST-like protein) mutant (Maars et al., 1995), which exhibited apparent pigmentation deficit. GSTs with comparable roles for anthocyanin have now been discovered in a variety of plant species, including VviGST1 and VviGST4 in Vitis vinifera (Conn et al., 2008), FvRAP in Fragaria vesca (Luo et al., 2018), AcGST1 in Actinidia deliciosa (Liu et al., 2019), MdGSTF6 in M. domestica (Jiang et al., 2019), and PpGST1 in P. persica (Zhao et al., 2020) have been described as crucial for floral or fruit pigmentation.
Sweet cherries (Prunus avium L.) are nutrient-dense fruit that is high in anthocyanins, a kind of dietary flavonoids responsible for its red pigmentation. Anthocyanins are associated with both defensive and physiological processes, as well as assisting with sweet cherry sensory attributes. Additionally, anthocyanins may be responsible for the health advantages associated with sweet cherry consumption. Anthocyanin transportation is mediated by GST genes in plants. Moreover, a genome-wide investigation of GST genes was conducted in sweet cherry because of the reported involvement of GSTs in mediating anthocyanin accumulation (Maars et al., 1995; Mueller et al., 2000; Sun et al., 2012; Pérez-Díaz et al., 2016). Each member’s physiochemical characteristics, subcellular localization, chromosomal position, evolutionary linkage, and gene duplication events have all been studied in more detail. In addition, the expression of sweet cherry GSTs upon LED treatment was investigated. Our findings provide the groundwork for future research into induced LED anthocyanin deposition in sweet cherry.
Materials and Methods
Physico-Chemical Characterization and Identification of Glutathione S-Transferase Genes in Prunus avium
The P. avium genome sequences were obtained for GST gene annotation and identification: from the Genome Database for Rosaceae (GDR1; Verde et al., 2013; Jung et al., 2014; Daccord et al., 2017; Shirasawa et al., 2017; Aamir et al., 2020). To further verify the conserved domains like GST_C (PF00043) and GST_N (PF02798). Initially, the protein sequence alignment for GST C (PF00043), GST N (PF02798), (Pfam GST domain) was obtained in Stockholm format, and Hmmbuild was used to create a model from that alignment. The Hmmsearch program was being utilized to find all potential genes through the whole-genome database of P. avium with BLASTP (E < 1e––5). Furthermore, 57 protein sequences of A. thaliana were utilized as a query to retrieve 67 potential GST protein sequences of the sweet cherry genome. The sequences of all GST proteins were aligned, and repetitive genes were eliminated. All GST genes were then validated through InterProScan2 (Zdobnov and Apweiler, 2001; Finn, 2006; Letunic et al., 2012; Manzoor et al., 2021a), SMART3 (Letunic et al., 2012) and Pfam database4 (Finn, 2006). The ExPASY server5 was used to anticipate molecular properties (length of amino acid, IP (isoelectric point) and weight) while, WoLF PSOPT II6 was used to determine the subcellular localization (Horton et al., 2007; Abdullah et al., 2018a; Cao et al., 2018; Manzoor et al., 2021a).
Phylogeny Analysis of Glutathione S-Transferase Genes Family
ClustalX software was used to align all GST full-length protein sequences with default parameters (1000 bootstrap, pairwise deletion; Thompson et al., 1997; Abdullah et al., 2018b). MEGA-X (Molecular Evolutionary Analysis) and the maximum likelihood method (ML-M) were utilized to construct the phylogenetic tree (Tamura et al., 2011). Moreover, the itols online software7 (Letunic and Bork, 2019; Manzoor et al., 2021b) was employed to illustrate the phylogenetic trees.
Conserved Motif and Gene Structure Analysis
The GSDS 2.0 (Gene Structure and Display Server)8 was used to emphasize the important features, such as exon-intron arrangement and composition, conserved elements, and binding sites (Hu et al., 2015; Abdullah et al., 2018a; Manzoor et al., 2021c,d). The MEME software (Motif Elicitation)9 (Bailey et al., 2015; Sabir et al., 2022) was used to illustrate the conserved motifs.
Conserved Domain and Chromosomal Distribution Analysis
All GST gene positions were determined through the Rosaceae Genome Database (see text footnote 1) and then visualized using Mapinspect web tool10 (Sneddon et al., 2012; Chen et al., 2018; Manzoor et al., 2021d). Furthermore, the Pfam database,11 HMMER software,12 and Conserved Domain Architecture Retrieval Tool (CDART) were used to identify the conserved domains of PavGST proteins (Geer et al., 2002; Cheng et al., 2019).
Cis-Elements Analysis in Sweet Cherry
The promoter regions were discovered through the initiation codon along with 1.5 kb upstream sequences for all PavGST members and PlantCARE database13 was utilized to estimate and display all cis-elements (Lescot, 2002; Manzoor et al., 2021d).
Gene Duplications, Collinearity Relationships, and Non-synonymous and Synonymous Mutation Rates
Collinearity analysis through BLASTP (E < 1 × 10⁻⁵) alongside several Rosaceae genomes was carried out using the MCScanX (Multiple Collinearity Scan Toolkit) with default parameters of OrthoMCL were used. The combination of OrthoMCL intermediate files “orthologs.txt” and “coorthologs.txt” (generated by orthomclDumpPairsFiles) was used as the whole set of ortholog pairs (Wang et al., 2012; Qiao et al., 2015; Riaz et al., 2021). MCScanX software was used to identify several types of duplications (tandem duplications, scattered, proximal, and WGD/segmental duplication) in P. avium while, TBtools and circos toolkits were utilized to show the collinearity correlations and gene duplications (Chen et al., 2020; Manzoor et al., 2021c). In this study, Ks (the synonymous: mutations/substitutions resulting in single amino acid alter on a given polypeptide) and Ka (non-synonymous mutation rates: mutations or substitutions that do not alter the amino acid sequence) for corresponding duplication pairs were got from the Plant Genome Duplication Database (PGDD)14 (Lee et al., 2013). Moreover, for computing the Ka/Ks ratio of every pair of identical genes along with multiple alignments, we used the MAFFT program and calculator15 (Wang et al., 2010; Qiao et al., 2019).
Plant Material and Treatments
The sweet cherry cultivar “Van” was cultivated on the research farm of Shanghai Jiao Tong University in Shanghai, China (31.25°N, 121.48°E). The rootstock “DaQingye” (P. pseudocerasus) was being utilized to graft diploid cultivars. All plantations were established at a 5–6 m spacing using the same agricultural approaches. Fully mature “Van” fruits (43D) was irradiated with LED light (450 nm) for different period of time (30H, 50H, 80H, 100H). Some fresh experimental material was used for physic-chemical evaluation while the remaining experimental materials were freeze-dried and stored at –80°C till further use. Three duplicates of each treatment were utilized.
RNA Extraction, Reverse Transcription, and Quantitative Real-Time PCR
In order to examine the qRT-PCR results, RNAiso-mate Tissue Kit was used to isolate total RNA from frozen fruit tissue (Tiangen, Beijing, China). A Nanodrop 1000 spectrophotometer was used to check the RNA’s purity and quantity (ThermoScientific, Beijing, China). A one-step RT-qPCR kit was used to reverse transcribe the RNA into the first-strand cDNA (Takara, Shanghai, China). The ABI 7500 real-time PCR detection system was used to perform quantitative RT-PCR (qRT-PCR) following the manufacturer’s instructions and an SYBR green Premix Ex TaqTM kit (Takara). As an internal control, the tubulin gene was used to normalize the gene expression data (Chun et al., 2020). The primer premier software was used to design qRT-PCR primers enlisted in Supplementary Table 7. The relative expression levels for each of the genes were measured using the 2–Δ Δ CT method with three biological and technical replicates (Livak and Schmittgen, 2001; Manzoor et al., 2021a).
Color Index Evaluation
Computation of the color index The CIELAB color system was used to measure the color of the fruit’s surface using a Minolta CR-410 colorimeter. Bayberries’ color index was determined as CIRG = (180 – h)(C + L; Carreño et al., 1995), where L is lightness and correlates to a black–white scale, h is hue angle on the color wheel, and C represents chroma, a measure of color intensity. Three distant color measurements were taken around the equator of each sweet cherry fruit, and statistical analyses were performed on the mean values for twenty fruits from each treatment.
Anthocyanin Contents (mg CEQ/100 g) Evaluation
The flavonoids were identified using the technique used by Kim et al. (2003). 1 ml of fruit juice was mixed with 4 ml of distilled water. This was followed by the addition of a 5% sodium nitrite solution (0.3 ml) and a 10% aluminum chloride solution (0.3 ml). After 5 min of incubation at ambient temperature, 2 ml of 1M sodium hydroxide was added to the reaction mixture, followed by the addition of distilled water to bring the volume up to 10 ml. The mixture was completely vortexed, and the absorbance of the pink hue that resulted was measured at 510 nm using a spectrophotometer (Li et al., 2012). A calibration curve was developed using catechin, and the results were expressed in mg catechin equivalents. All measurements had to be taken in triplicate so that the mean values could be obtained.
Total Antioxidants (% DPPH Inhibition)
The total antioxidant activity was determined by their ability to scavenge 2, 2-diphenyl-1-picrylhydrazyl stable radicles which were previously demonstrated by Wang et al. (1996). The absorbance was measured at 517 nm against a blank through a microplate ELISA reader (Bio Tek, United States). The following formula was used to compute the inhibition of free radicals by DPPH in the present (%).
where A blank represents the absorbance of the control reaction mixture without the sample and A sample represents the absorbance of the test substances. The IC50 values, which reflect the concentration of sweet cherry fruit extracts required to neutralize 50% of DPPH radicals, were determined by plotting the inhibition percentage against the concentrations.
Results
Investigation and Classification of Glutathione S-Transferases Genes in Sweet Cherry
A genome-wide investigation was achieved to find all GST genes from Prunus avium by using a genome database. The availability of the sequenced genome of A. thaliana (from the Phytozome database) and Pfam-specific domains (GST C-terminus (PF00043), GST N-terminus (PF02798) permitted for the identification and prediction of all GST members in the P. avium genome. The BlastP and HMM were being utilized to find the GST genes in the P. avium genome database. The Pfam database, the Interpro tool, and the SMART database were utilized to verify the domain’s presence in all GST genes. The sweet cherry genomes were used to derive the protein and coding sequences. Finally, 67 GST genes were found and classified as PbGST1–67 based on their chromosomal localization or physical location (Supplementary Table 1). In sweet cherry (PavGST), a total of 67 GST genes were discovered (Supplementary Table 1). Additionally, the evolutionary relationship between P. avium and A. thaliana was investigated. The amino acid sequences were aligned using clustalX, and the MEGA-X program was used to construct a phylogenetic tree. Additionally, we employed two phylogenetic inference techniques, neighbor-joining (N-J) and maximum likelihood (ML), to create phylogenetic trees to validate the topologies because the N-J tree has greater bootstrap values than the other phylogenetic tree, we elected it for our future investigation (Figure 1). All discovered GSTs from P. avium were classified into seven subfamilies based on their bootstrap values, topography, and sequence similarity (Tau, DHAR, Lambda, Zeta, Phl, Theta, and TCHQD). Surprisingly, the Tau subfamily was the biggest, accounting for more than half of all GSTs, while the DHAR, Lambda, Zeta, Phl, Theta, and TCHQD subfamilies were quite tiny (Figure 1). For example, 52 proteins were classified as Tau among the 67 PavGSTs, while only one protein was identified as TCHQD (PavGST13) or Theta (PavGST41). These findings imply that members of the GST Tau subfamily proliferated more quickly in plants and presumably have a wide range of vital roles. In comparison to Arabidopsis, however, lost GST subfamilies, such as Theta and Phi, indicating that the Theta and Phi subfamilies were lost during evolution or after divergence in the last common ancestor. However, the majority of GSTs from the seven subfamilies included in the research were found to be different from Arabidopsis homologs in the phylogenetic analysis, showing that the majority of the mode of gene duplication events occurred after their divergence from Arabidopsis. Additionally, our findings showed that they might have been the consequence of gene loss or gain events that happened throughout the evolutionary process. The functional divergence occurred as a result of the accumulation and deletion of certain GSTs gene members.
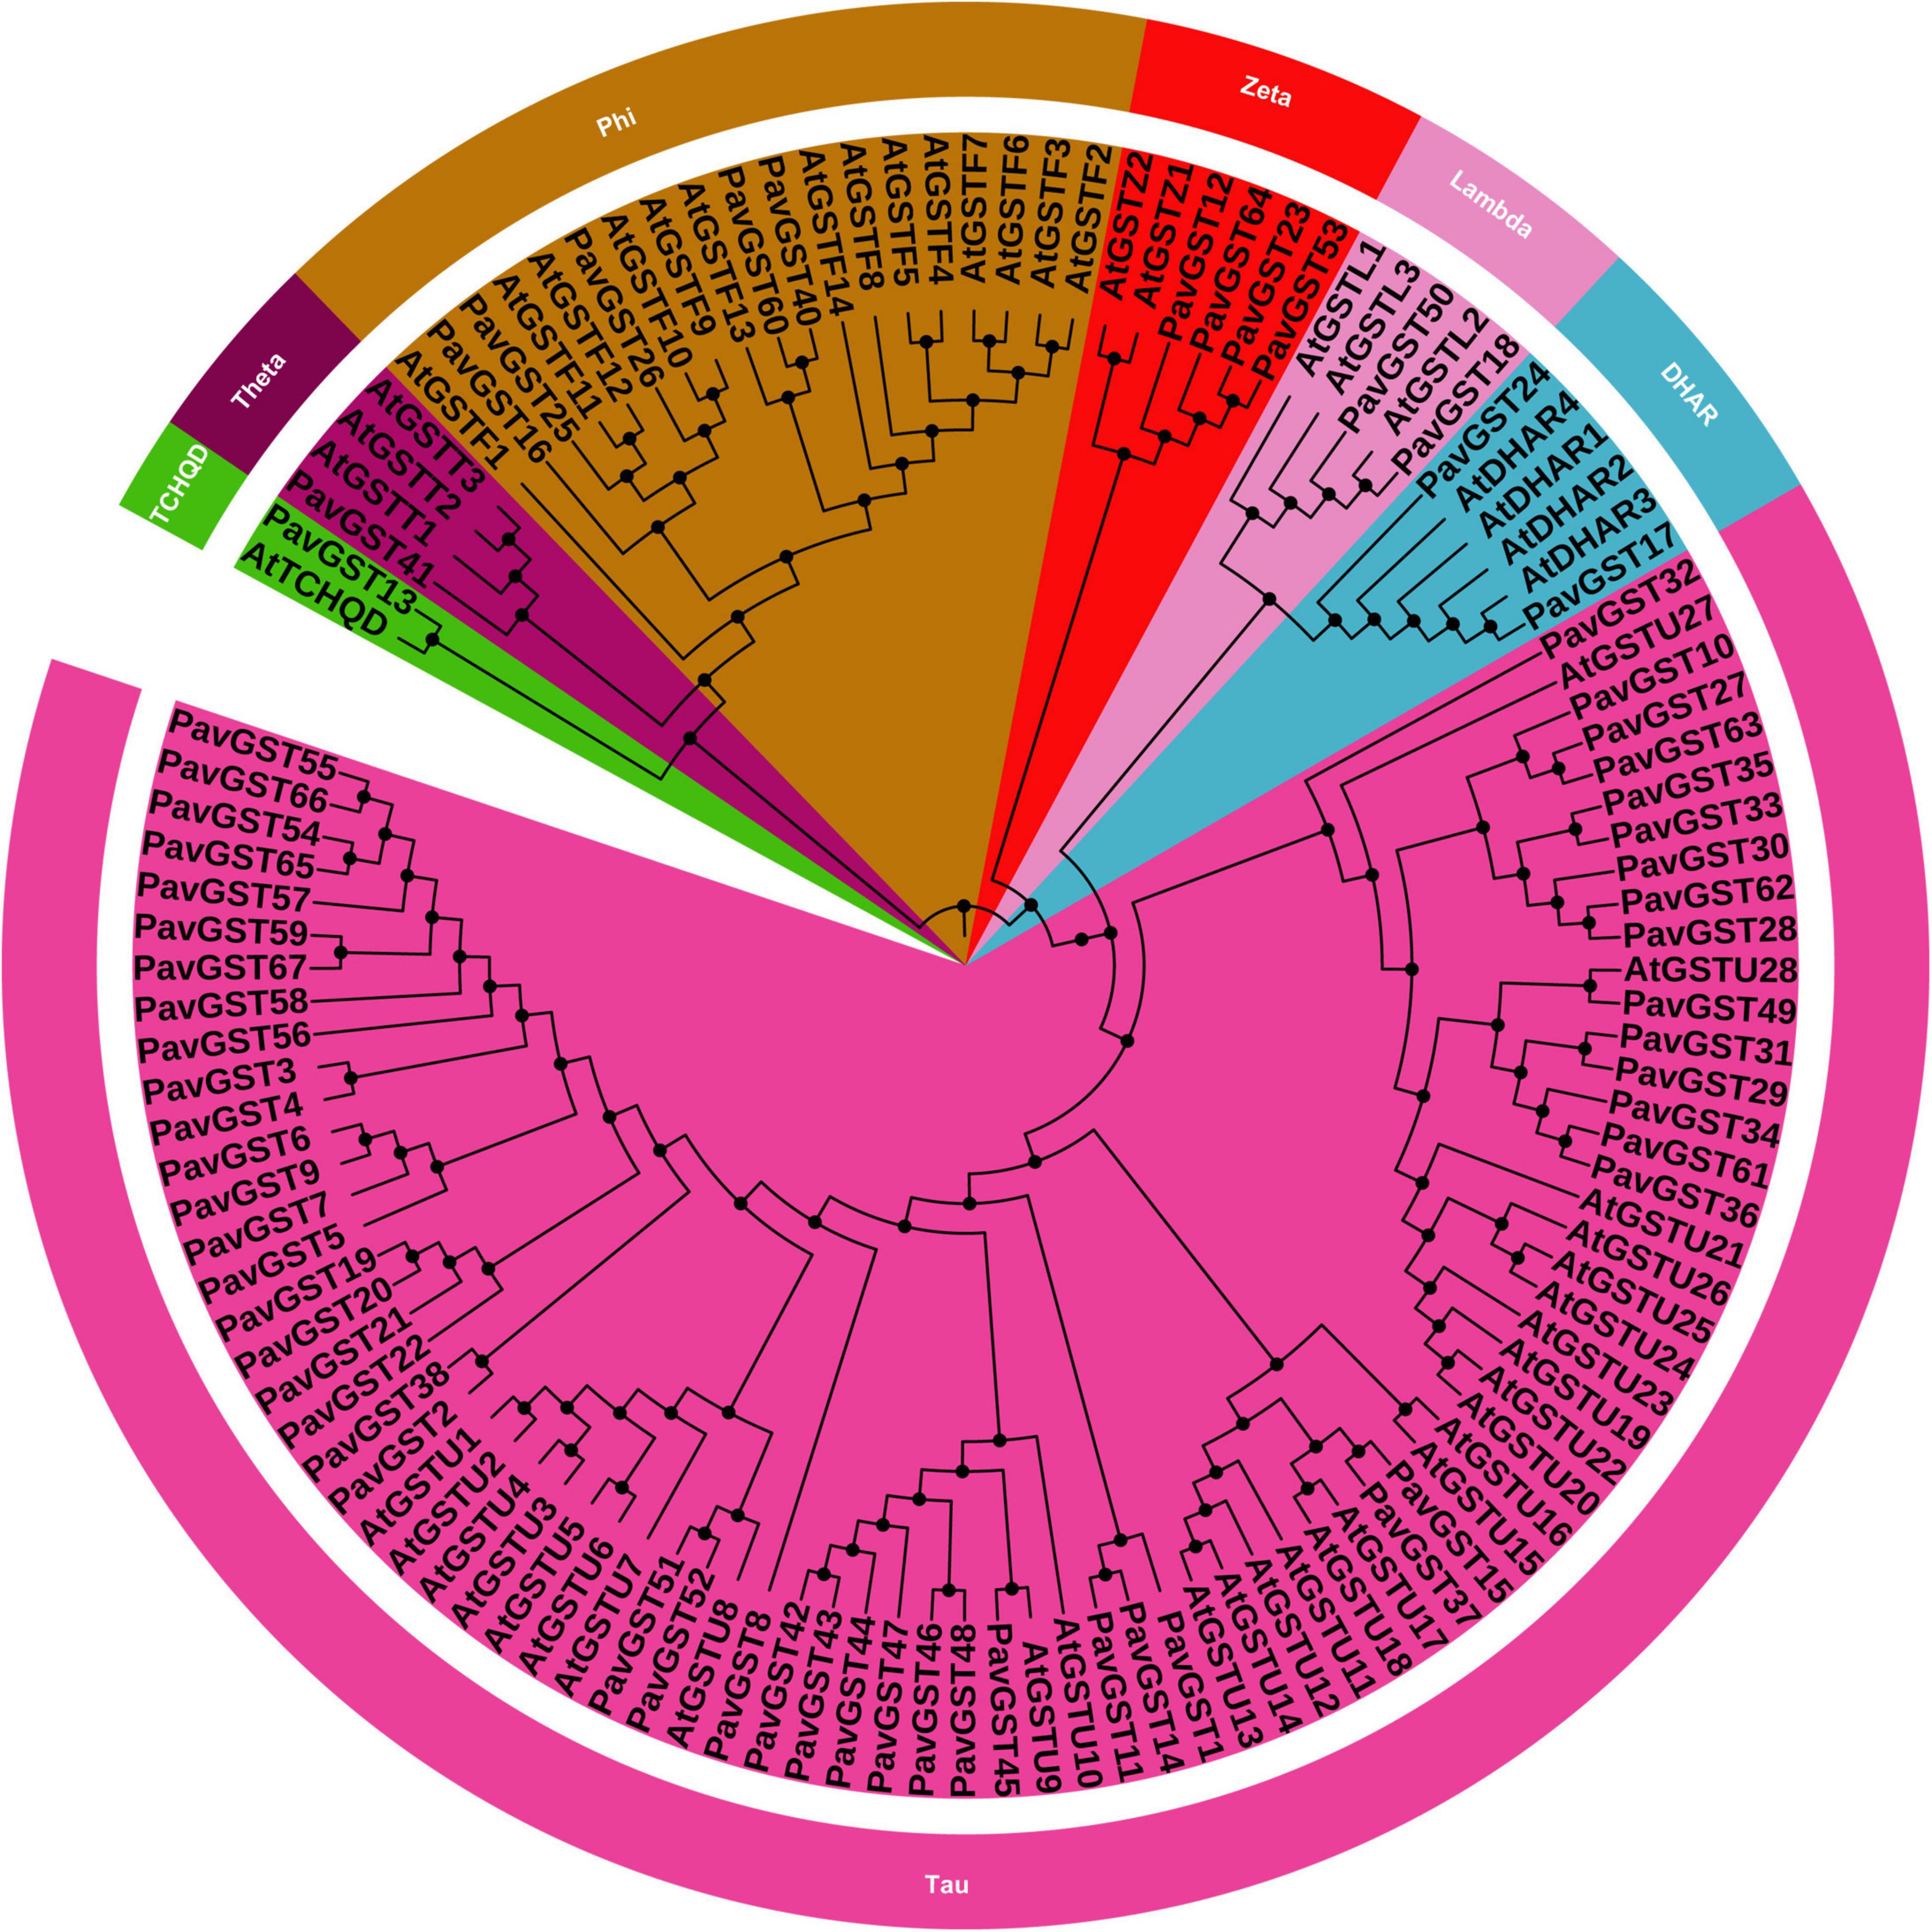
Figure 1. Phylogenetic tree of glutathione S-transferase (GST) gene family of P. avium and Arabidopsis thaliana. Each color representing a subfamily (TCHQD, Theta, Phi, Zeta, Lambda, DHAR and Tau) of GST genes and itol was used to construct the phylogenetic tree.
Assessment of Gene Structure and Conserved Motif of PavGST Genes
A phylogenetic tree was constructed to provide more insight into the structure of the 67 PavGST gene family members (Figure 2). We analyzed PavGST’s exon–intron structure and conserved motif distribution. The GST family members in each subfamily share the same conserved motifs, strengthening the phylogenetic tree conclusions. They might, though, contain diverse conserved motifs in numerous subfamilies. A total of 20 conserved motifs were investigated while using MEME software (Figure 2). Motif 3, 6, and 7 has been identified as PavGST conserved motifs and could be traced in all subfamilies which revealed that the addition of these three motifs (3, 6, and 7) in all subfamilies members occurred through some specific mutual evolutionary process and they have some specific function, while few subfamilies had exclusive motif formation, such as subfamilies I and II own unique motif 12 and 20, respectively, whereas motif 9 was traced only in VI and VII subfamilies which demonstrated that these two families faced some unique evolutionary processes, and these families have some unique functionalities. MEME results showed that PavGST15 (IV subfamily) had only three motifs (Motif 4, 10, and 5). It was also identified that in the identical subfamily the motif distribution of members was extremely conservative, such as subfamily I members had motifs 7,3 1,8, 2, 5, 4, 10, and 6; while most members of subfamily II had motifs 7, 3, 1, 8, 2, 5, 4, 10, and 6 (Figure 2).

Figure 2. Phylogeny (left panel), conserved motifs (center panel) and intron-exons (right panel) for GST family proteins in sweet cherry were analyzed. (A) The motif composition of PavGST protein (1–20) is represented by distinct colored boxes with appropriate motif numbers and figure legends are mentioned on the top. (B) Phylogeny and gene structure for GST family proteins in sweet cherry. The relative position and size of the exon can be estimated using the scale at the bottom. Green boxes, black lines, and yellow boxes illustrated exons, introns, and UTR, respectively.
The structural components of the exons and introns of about 67 PavGST genes were retrieved using the Gene Structure Display Server16 (Figure 2). The structure of PavGST genes indicated a tremendous deal of diversity. The findings revealed a wide range of PavGST gene structures. Moreover, it was observed that the intron number varied from 1 to 12 (PavGST12) while the exon number varies from 1 to 10 in PavGST transcripts. A maximum number of exons was found in PavGST53 and PavGST64 (10 exons) and the minimum number of one exon was found in PavGST54, PavGST8, and PavGST39 (Subfamily I) while PavGST47 (subfamily III), PavGST24, PavGST32, PavGST63, and PavGST35 (subfamily V) Transcripts (Figure 2). Intron locations are critical for proper amino acid coding and protein secondary structure; they also give an evolutionary benefit by boosting protein variety through exon shuffling and alternative splicing (Gorlova et al., 2014). Eight genes (PavGST54, PavGST8, PavGST39, PavGST47, PavGST24, PavGST32, PavGST63, and PavGST35) were identified to be intron less and hence to lack intron phase in their gene structure. The single intron was present in 35 PavGST members. The remainder of the genes had a variable number of introns. The relationship between the intron phase and sequence conservation at splice sites is associated with the evolution of spliceosomal introns (Long and Deutsch, 1999). Additionally, phase 0 of the intron had the maximum conservation, whereas phase 2 exhibited the lowest conservation. In case of PavGST classes, Subfamilies I, II, III, IV, and V exhibited peak conservation whereas subfamily VI, and VII showed a greater number of introns and mixed conservation at the splice site sequence (Figure 2).
Examination of Cis-Regulating Elements in PavGST Genes
Transcription factors (TFs) influence target genes both spatially and functionally via specialized binding of cis-regulatory elements found in promoters (Qiu, 2003). The genomic sequence upstream of every gene was obtained and analyzed to the PlantCARE database to investigate the cis-regulatory elements of the PavGST gene family. Cis-regulatory elements of PavGST were found to be engaged in phytohormone responses (abscisic acid, gibberellin, salicylic acid, auxin, and methyl jasmonate response elements), as well as stress responses (light, low temperature, and drought; Figure 3 and Supplementary Table 2). Several cis-regulatory elements were noticed to be engaged in the hormone responsiveness, such as gibberellin response element (P-box), auxin (TGA element) response elements, and promoter and enhancer regions (CAAT-box) and MeJA (CGTCA-motif, TGACG-motif). On the other hand, there were also found stress-response elements associated with ABA (ABRE), low-temperature reactivity (LTR), the MYB binding site (MBS) implicated in drought, and zein metabolism regulation (O2-site) activation (Figure 3). ABRE cis-elements (ABA response) were identified in 7% of PavGST members while 2% of total members of the MBS (MYB binding site) engaged in drought induction was found. Moreover, G-Box with 1% (Light-responsive cis-acting regulatory elements), Box4 with 1% (a DNA module implicated in light responsiveness), and G Box with 1% (light-responsive elements) were all discovered. The phytohormones response related cis-regulatory elements, such as TGACG motif (2%) and GARE-motif (1%), were also discovered, which are associated with gibberellin and MeJA responses, respectively (Figure 3). Most of the PavGST components were found to be involved in the appropriate expression of promoters, such as CAAT-Box (82%). Moreover, we discovered GRAS cis-elements relevant to plant growth/development, comprising 02-site of having 2%, which are linked to zein metabolic responsiveness (Li et al., 2020).
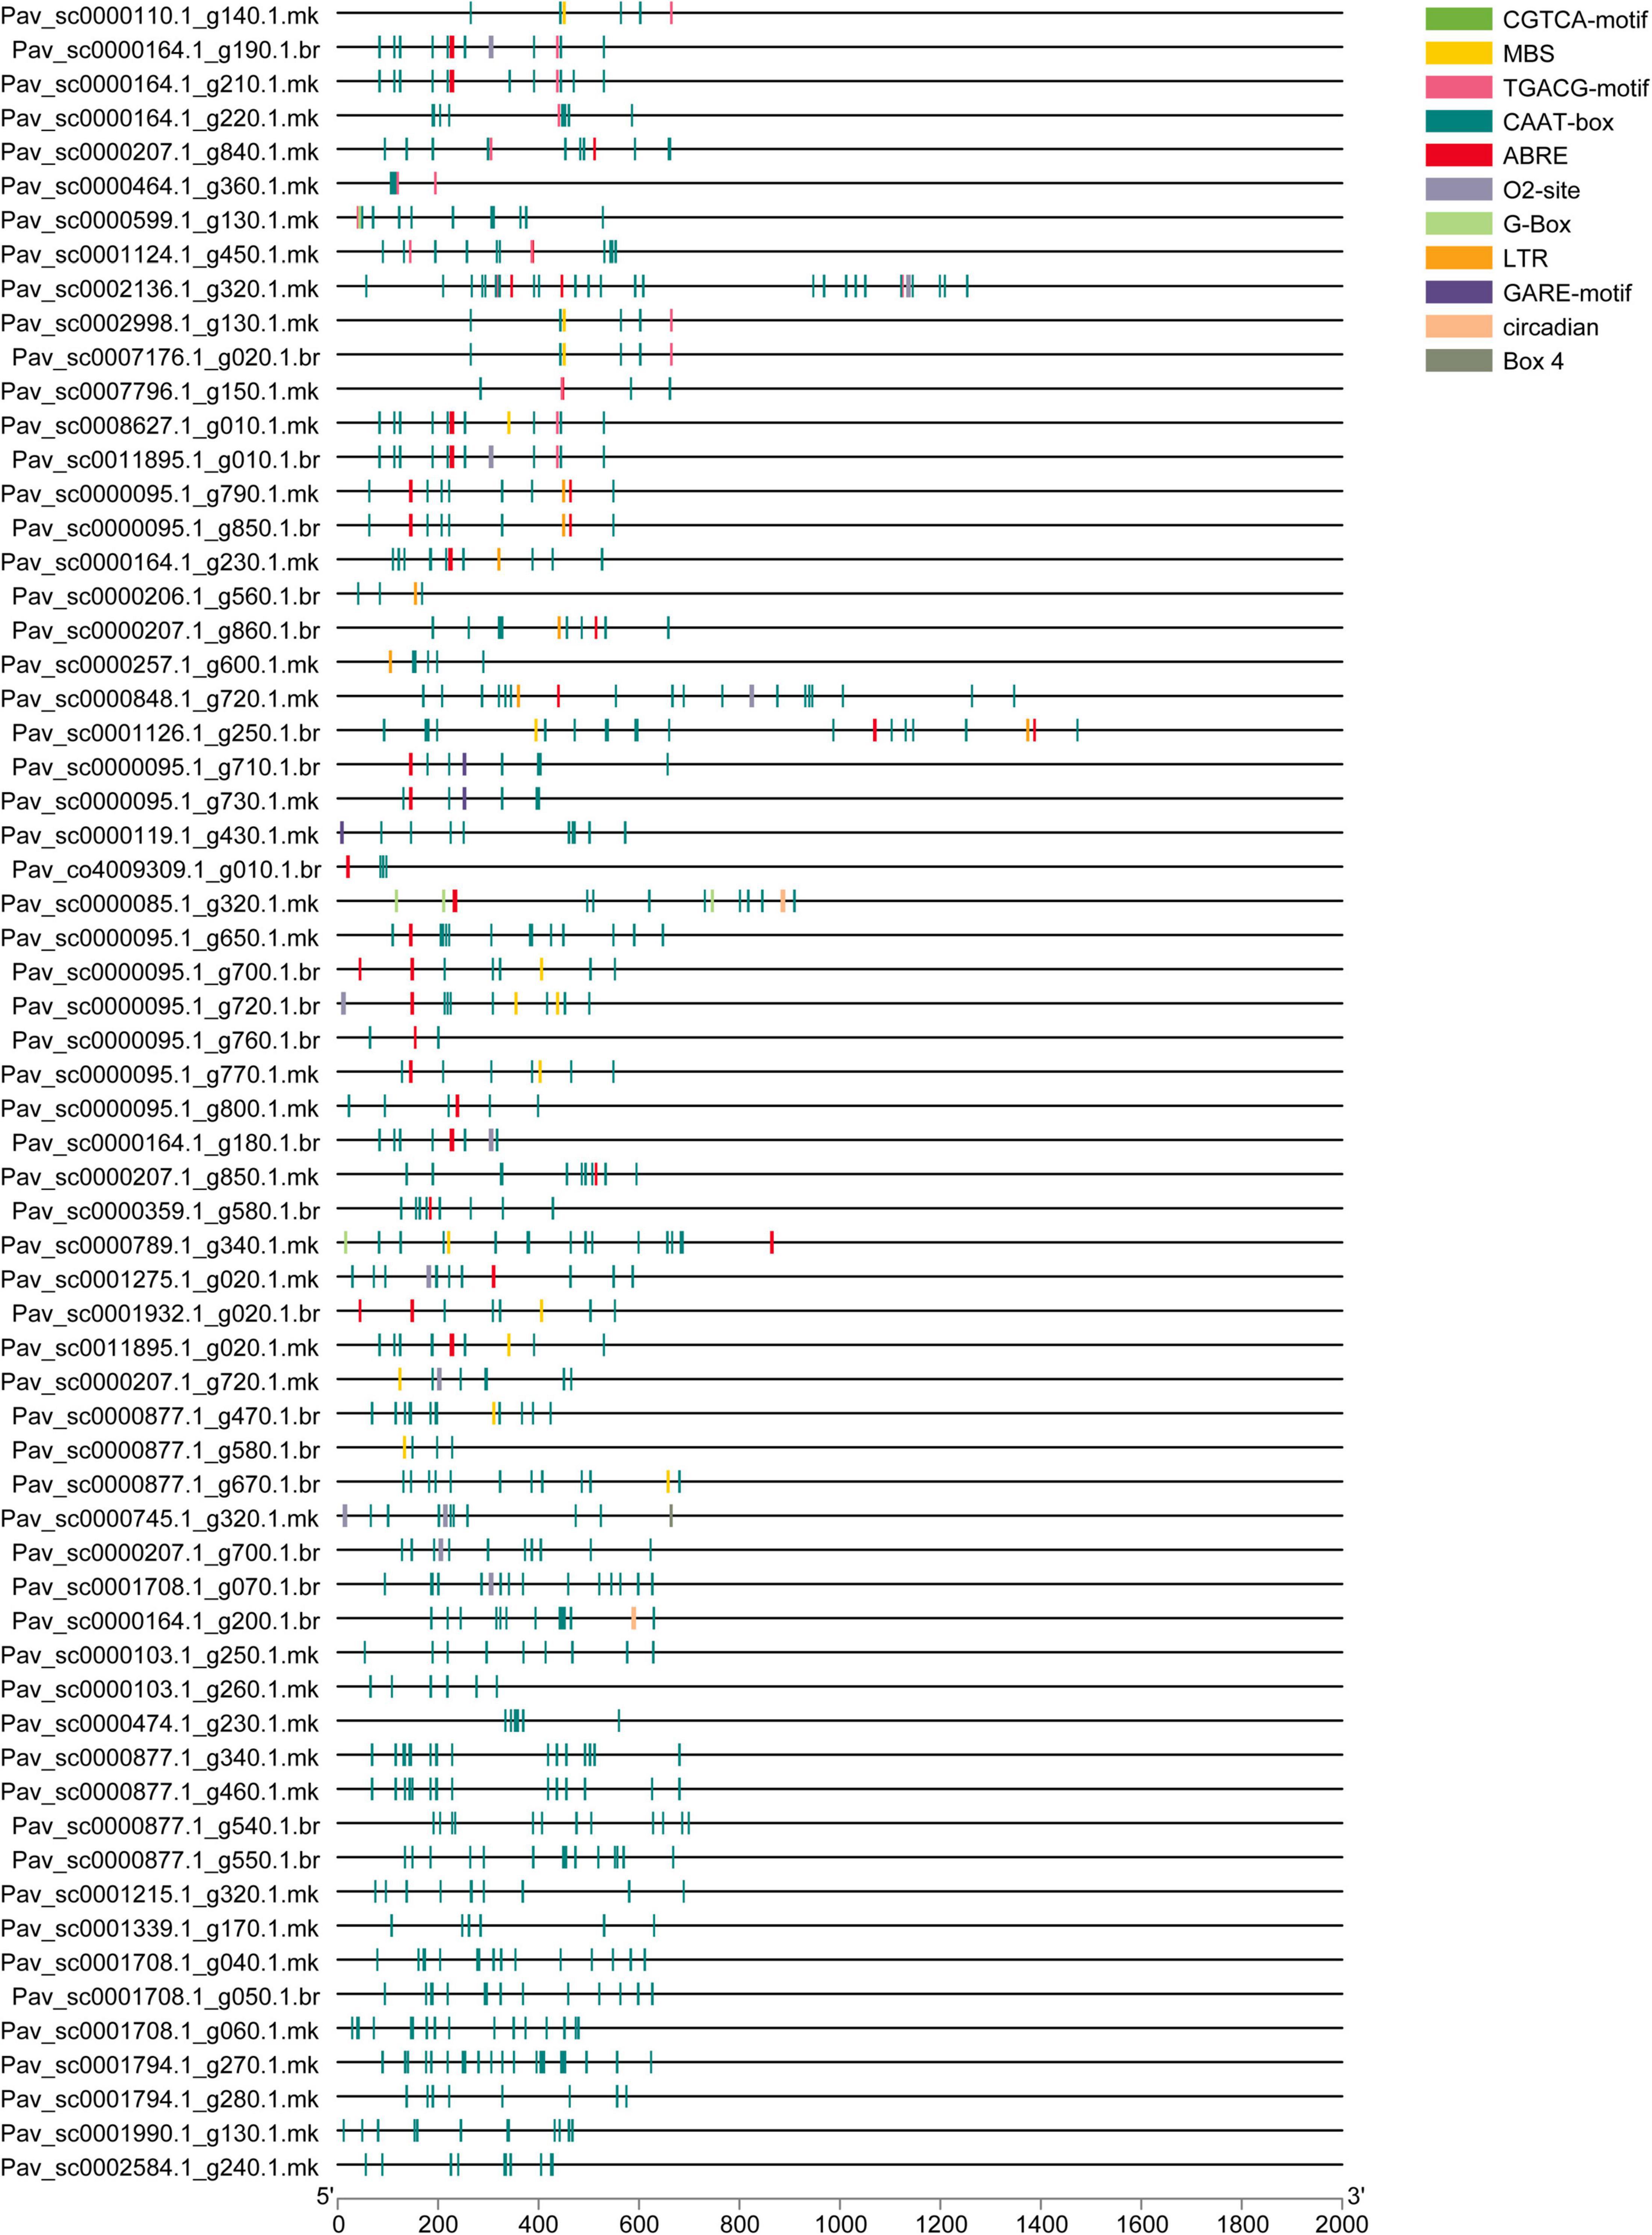
Figure 3. Identified cis-elements in the promoter regions of the PavGST genes. All promoter sequences (2 kb) were assessed. The PavGST genes are depicted on the left side of the figure. The scale bar at the bottom represents the length of promoter sequence.
Mode of Gene Duplications and Ka/ks Analysis in PavGST Genes
Five types of duplication whole genome duplication (WGD), proximal duplication (PD), tandem duplication (TD), dispersed duplication (DSD), and transposed duplication (TRD) were used to better understand the evolutionary history of the GST TFs gene family in sweet cherry. In sweet cherry, 37 pairs of genes were duplicated, along with WGD (three pairs), TRD (four pairs), DSD (11 pairs), TD (10 pairs), and PDs (9 pairs), indicating the gene family’s growth (Figure 4 and Supplementary Table 3). Dispersed duplication (DSD) event participation revealed its crucial role in the expansion of the GST family in sweet cherry. Furthermore, these results lead to the intricate duplication process of the GST family. All duplication mechanisms were incorporated in the development and expansion of PavGST genes (WGDs, DSDs, PDs, TDs, and TRDs). Dispersed duplication (DSD) was identified in 30% of sweet cherry genes, whereas tandem duplication (TD) was found in only 27%, suggesting that dispersed duplication events are more important in the expansion and evolution of the GST gene family than tandem duplication and other events. We estimate the evolutionary age of gene duplication events and selections by computing synonymous (Ks) and the non-synonymous (Ka) rates across all duplicated gene pairs. The results revealed that the Ka/Ks ratio ranged between 2.51 and 0.12 (Figure 5 and Supplementary Table 3). Positive selection was indicated by Ka/Ks ratios of more than 1, purifying selection by Ka/Ks values less than 1, and neutral selection by Ka/Ks = 1. Our study found that the majority of PavGST gene pairs had a Ka/Ks ratio smaller than 1, indicating that these genes are mostly exposed to purifying selection. On the other hand, the Ka/Ks ratio of two duplicated gene pairs is equal to one, indicating that neutral selection occurred (Figure 5 and Supplementary Table 3), but only nine PavGST gene pairs have a ka/ks ratio greater than one, showing that positive selection was dominated. Additionally, the Ka/Ks value was calculated in WGD, TRD, TD, PDs, and DSD. The highest Ka/Ks values were found in Pav sc0000095.1 g790.1.mk (Ka/Ks 2.51), which is situated on Chromosome 4, indicates a complicated evolutionary history for the GST gene family in sweet cherry.
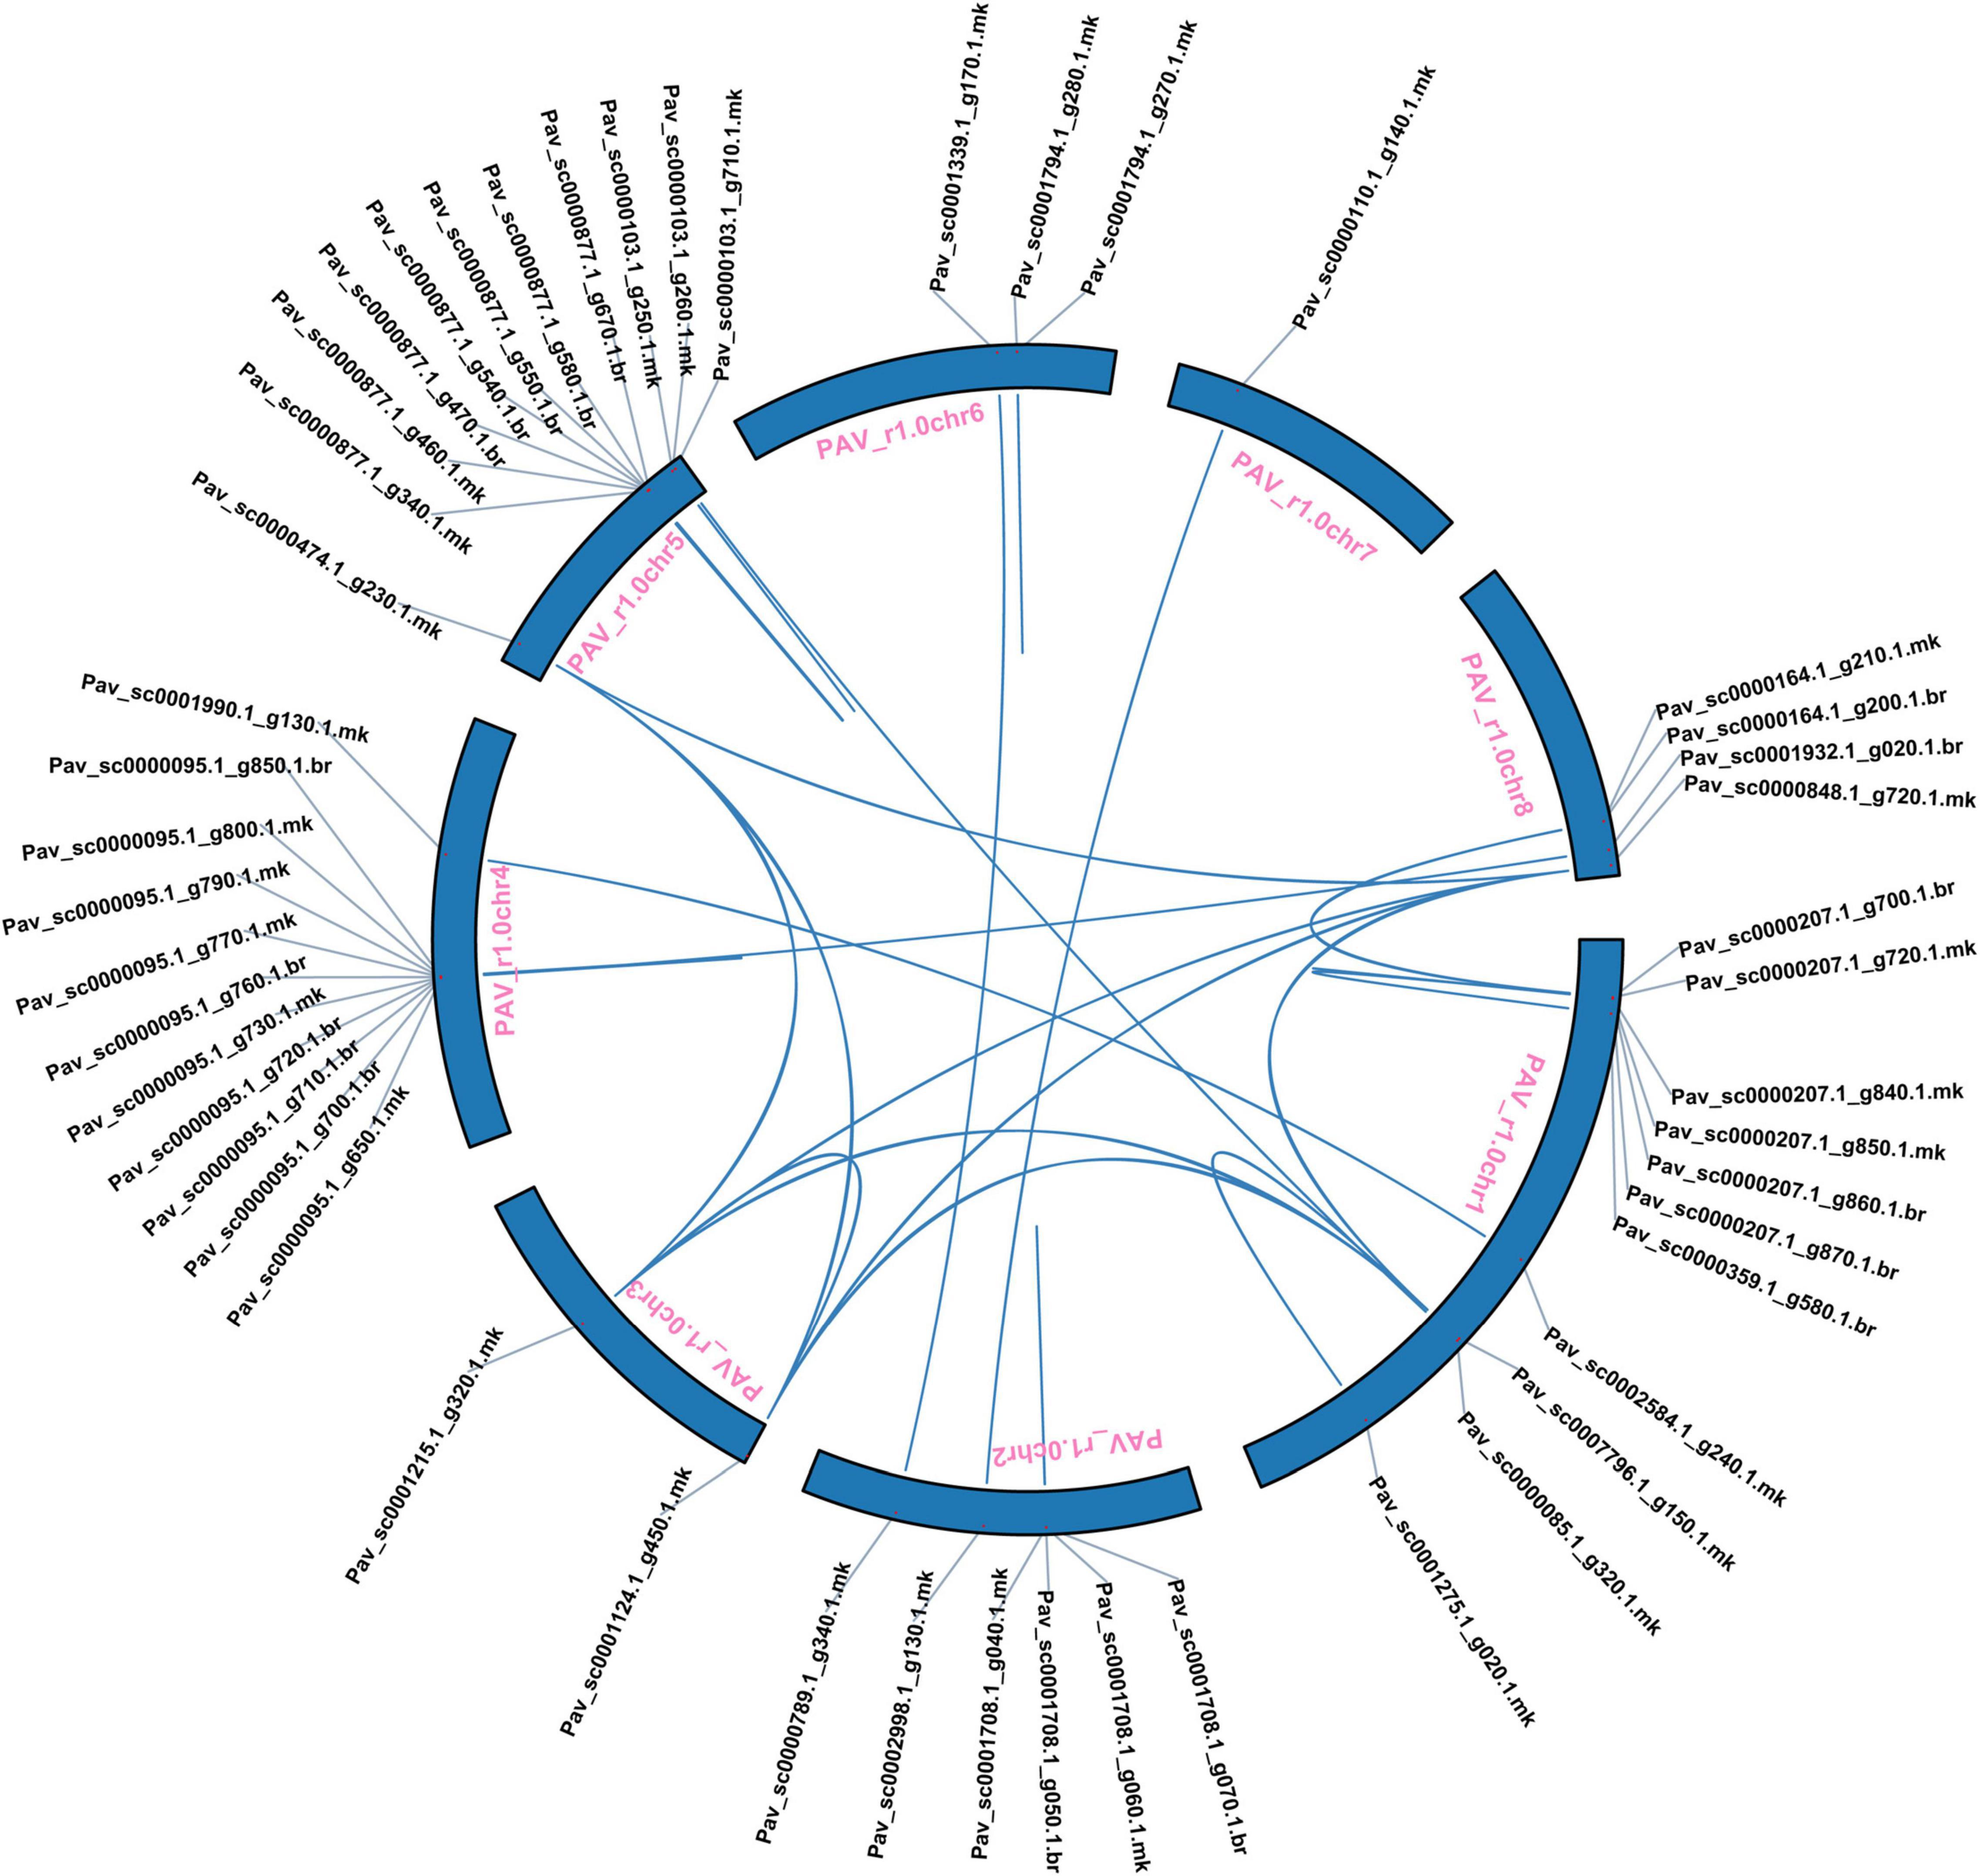
Figure 4. Prunus avium have chromosomal localization and mode of gene duplication. A colorful line links duplicated gene pairs.
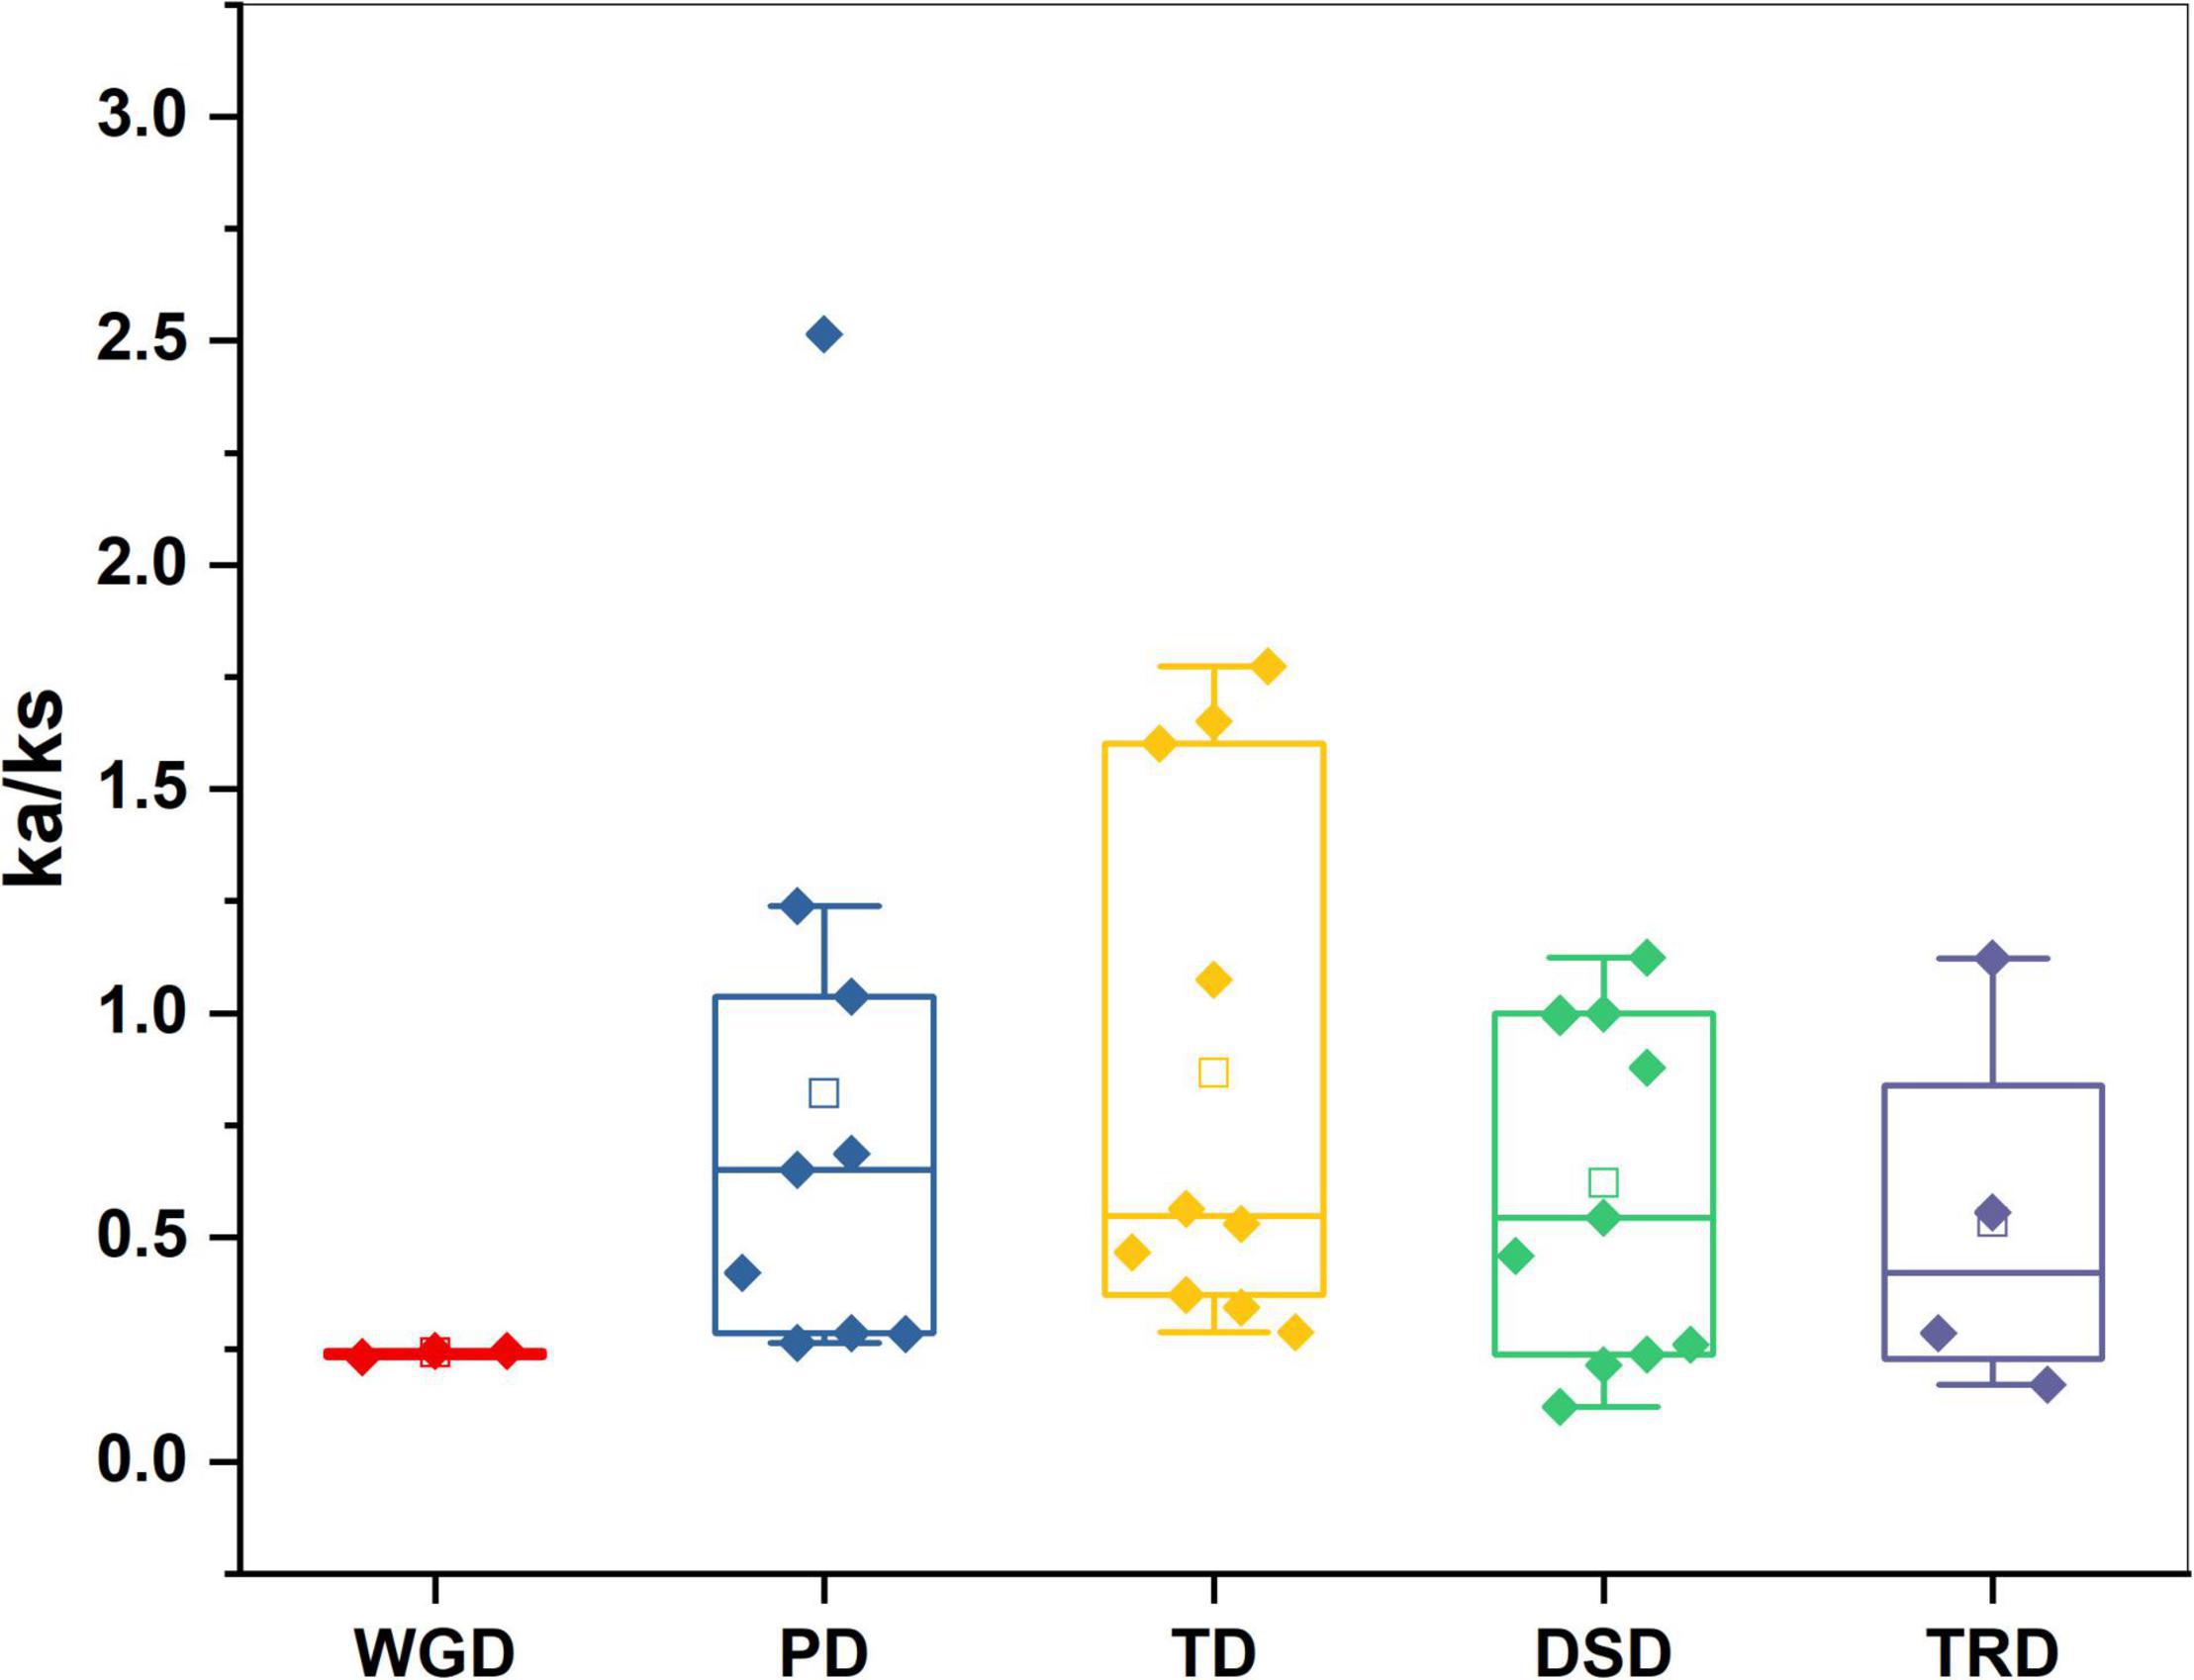
Figure 5. Ka/Ks values of GST genes family in Prunus avium. Comparison of Ka/Ks values for different modes of gene duplications. WGD, whole-genome duplicates; PD, proximal duplicates; TRD, transposed duplicates; TD, tandem duplicates; DSD, dispersed duplicates.
Chromosomal Localization and Synteny Analysis of PavGST Genes
We further investigated the collinearity relationship of GST genes between P. avium (sweet cherry), Pyrus bretschenedri, (Chinese pear), Fragaria vesca (strawberry), P. persica (peach), and P. mume (Japanese apricot) since they all relate to the Rosaceae family and have a mutual ancestor (Figure 6 and Supplementary Table 4). There were 131 orthologous gene pairs identified among the Rosaceae genomes, comprising 30 orthologous gene pairs among sweet cherry and pear, 37 orthologous gene pairs between sweet cherry and peach, 31 orthologous gene pairs among sweet cherry and strawberry, and 33 orthologous gene pairs amid sweet cherry and apricot, implying a strong relationship among genomes of the Rosaceae species (Figure 6 and Supplementary Table 4). These results illustrated that the sweet cherry genome and the other Rosaceae genomes have a collinearity relationship, indicating a possible evolutionary relationship between them. Additionally, collinearity relationship in sweet cherry and pear, maximum orthologous pairs (10) were identified on Chr1 while chr4 had only two orthologous pairs. In all other Rosaceae species, such as sweet cherry and strawberry, Chr1 consists of 10 orthologous pairs, while minimum pairs (2) were identified on Chr4. On the other hand, in the sweet cherry and peach collinearity relationship, Chr1 contained a maximum of 12 pairs while Chr4 had only two orthologous pairs. Moreover, in sweet cherry and Japanese apricot, Chr1 expressed its dominancy and contained a maximum (11) pairs. These results demonstrated that Chr1 went under extreme evolutionary events while Chr4 faced minimum evolutionary events (Figure 6 and Supplementary Table 4).
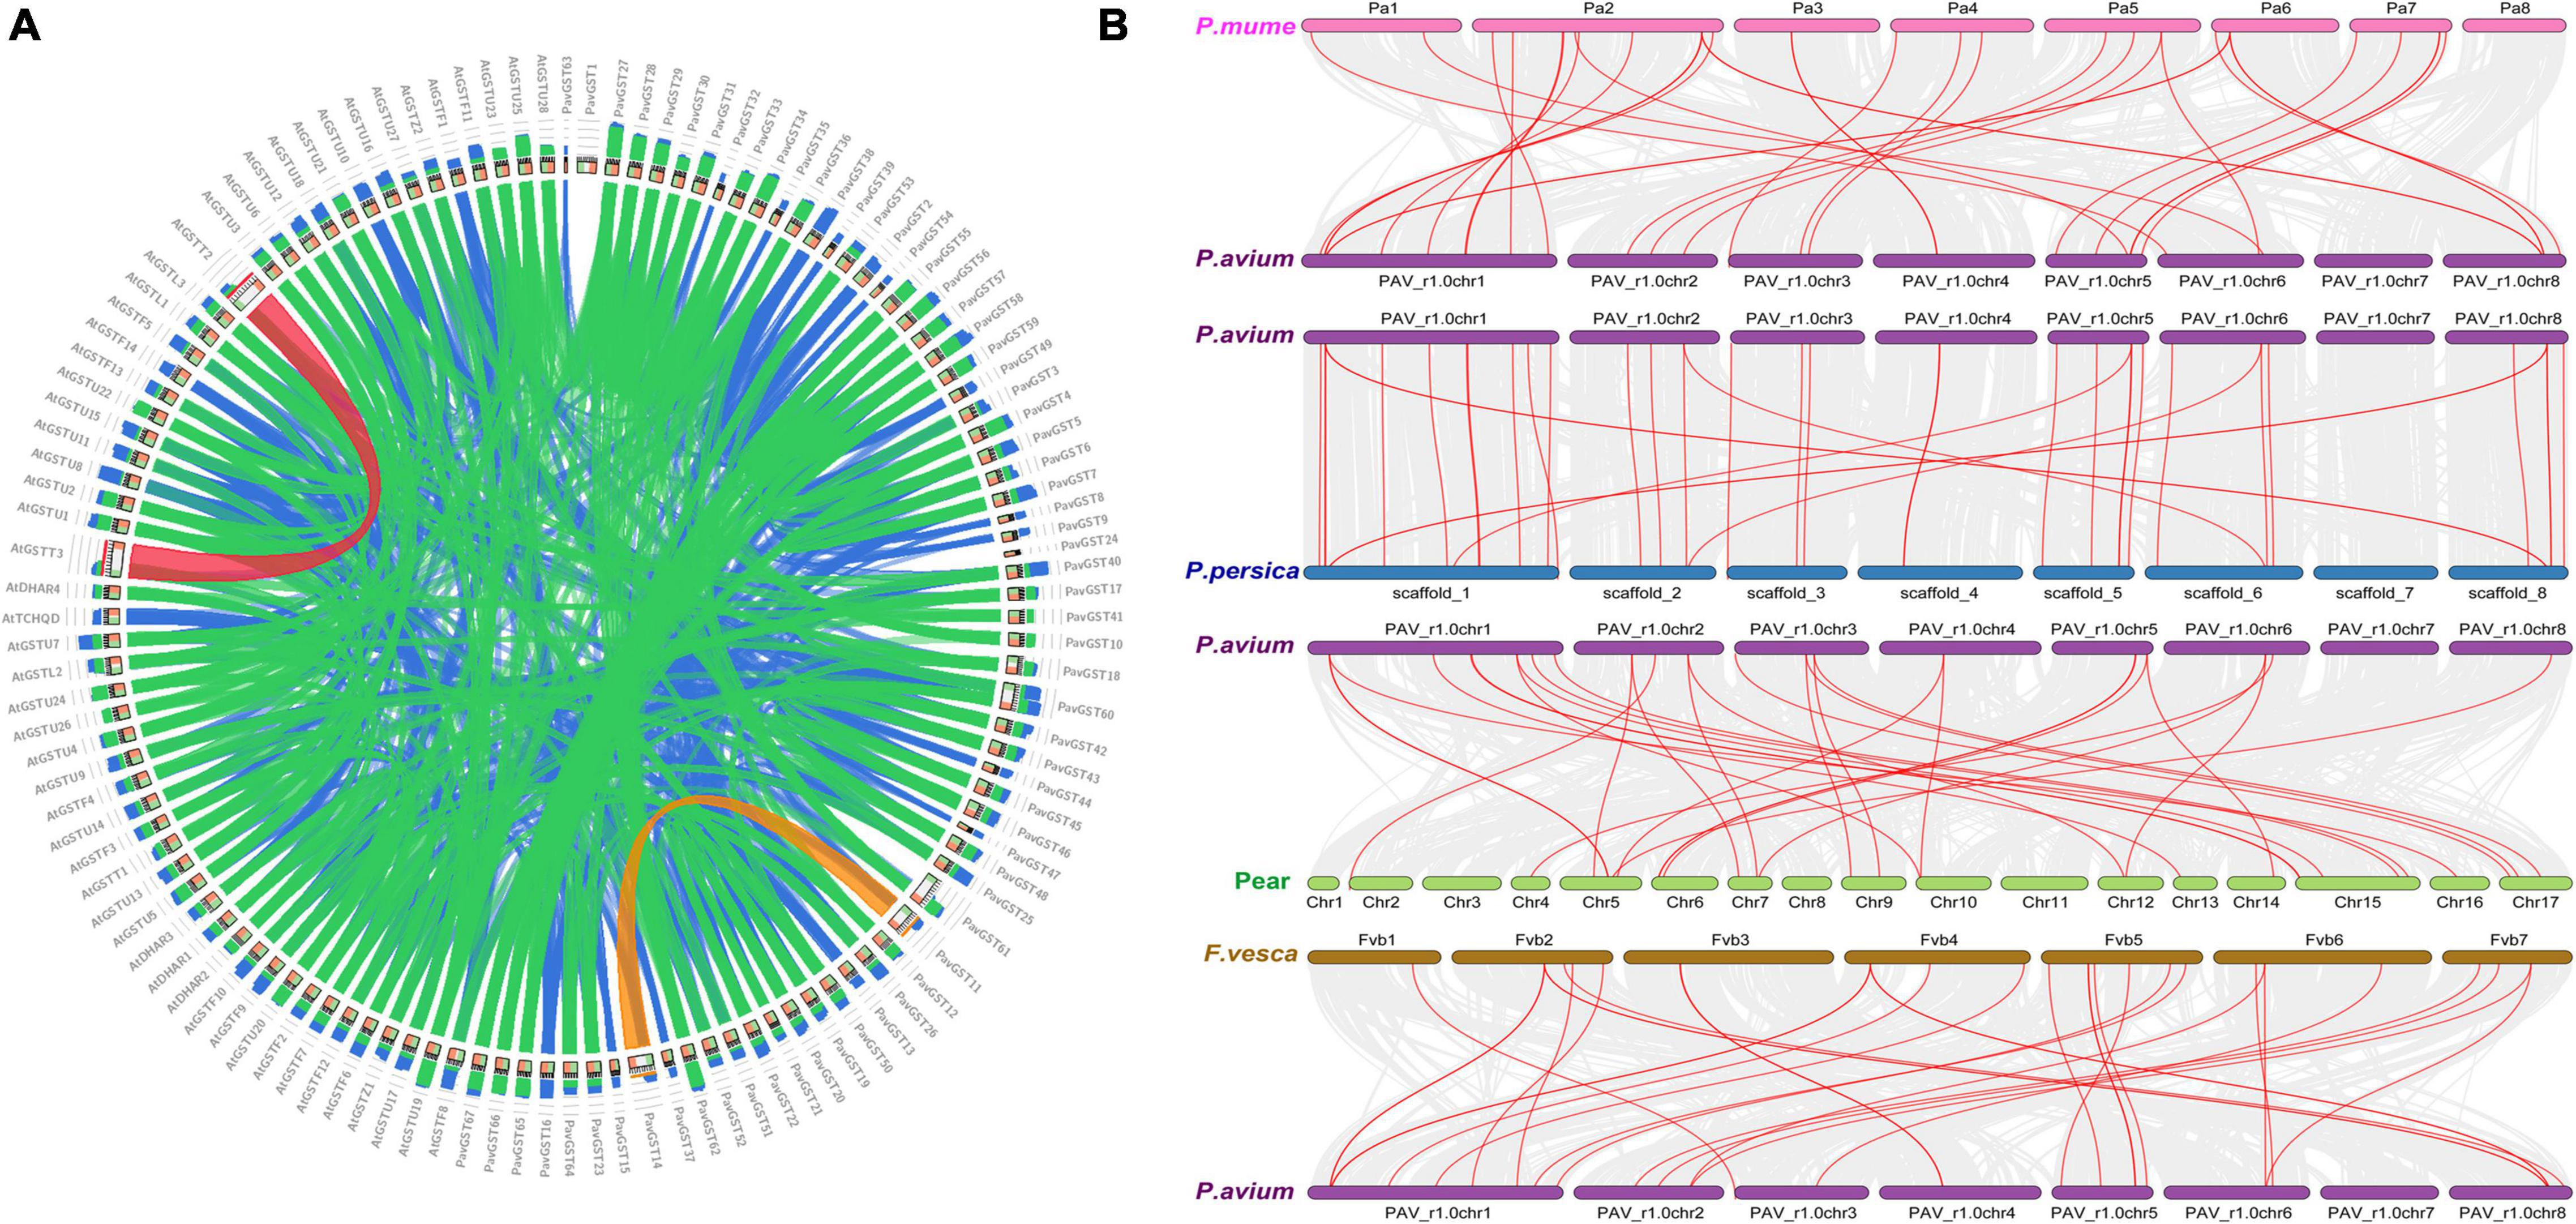
Figure 6. (A) Collinearity relationship among Prunus avium and Arabidopsis thaliana. (B) Collinearity relationship of GST genes in Prunus avium and other Rosaceae species (Prunus persica, Prunus avium, Prunus mume, and Fragaria vesca).
Subsequently, the chromosomal localization of GST genes in P. avium was also examined. 62 PavGST were identified on 8 chromosomes while 5 PavGST genes were located on the scaffold. The highest number of PavGST genes (16) was identified on chr1, while Chr7 had only one PavGST gene. Chr4 and Chr5 contained 11 PavGST genes in the form of clusters, while 7 PavGST members were localized on Chr2 in the cluster formation in the center of the chromosome. Chr3 and Chr6 had 3 and 4 PavGST genes, respectively, and all these GST members were identified in scattered formation in the whole chromosome (Figure 7 and Supplementary Table 1).
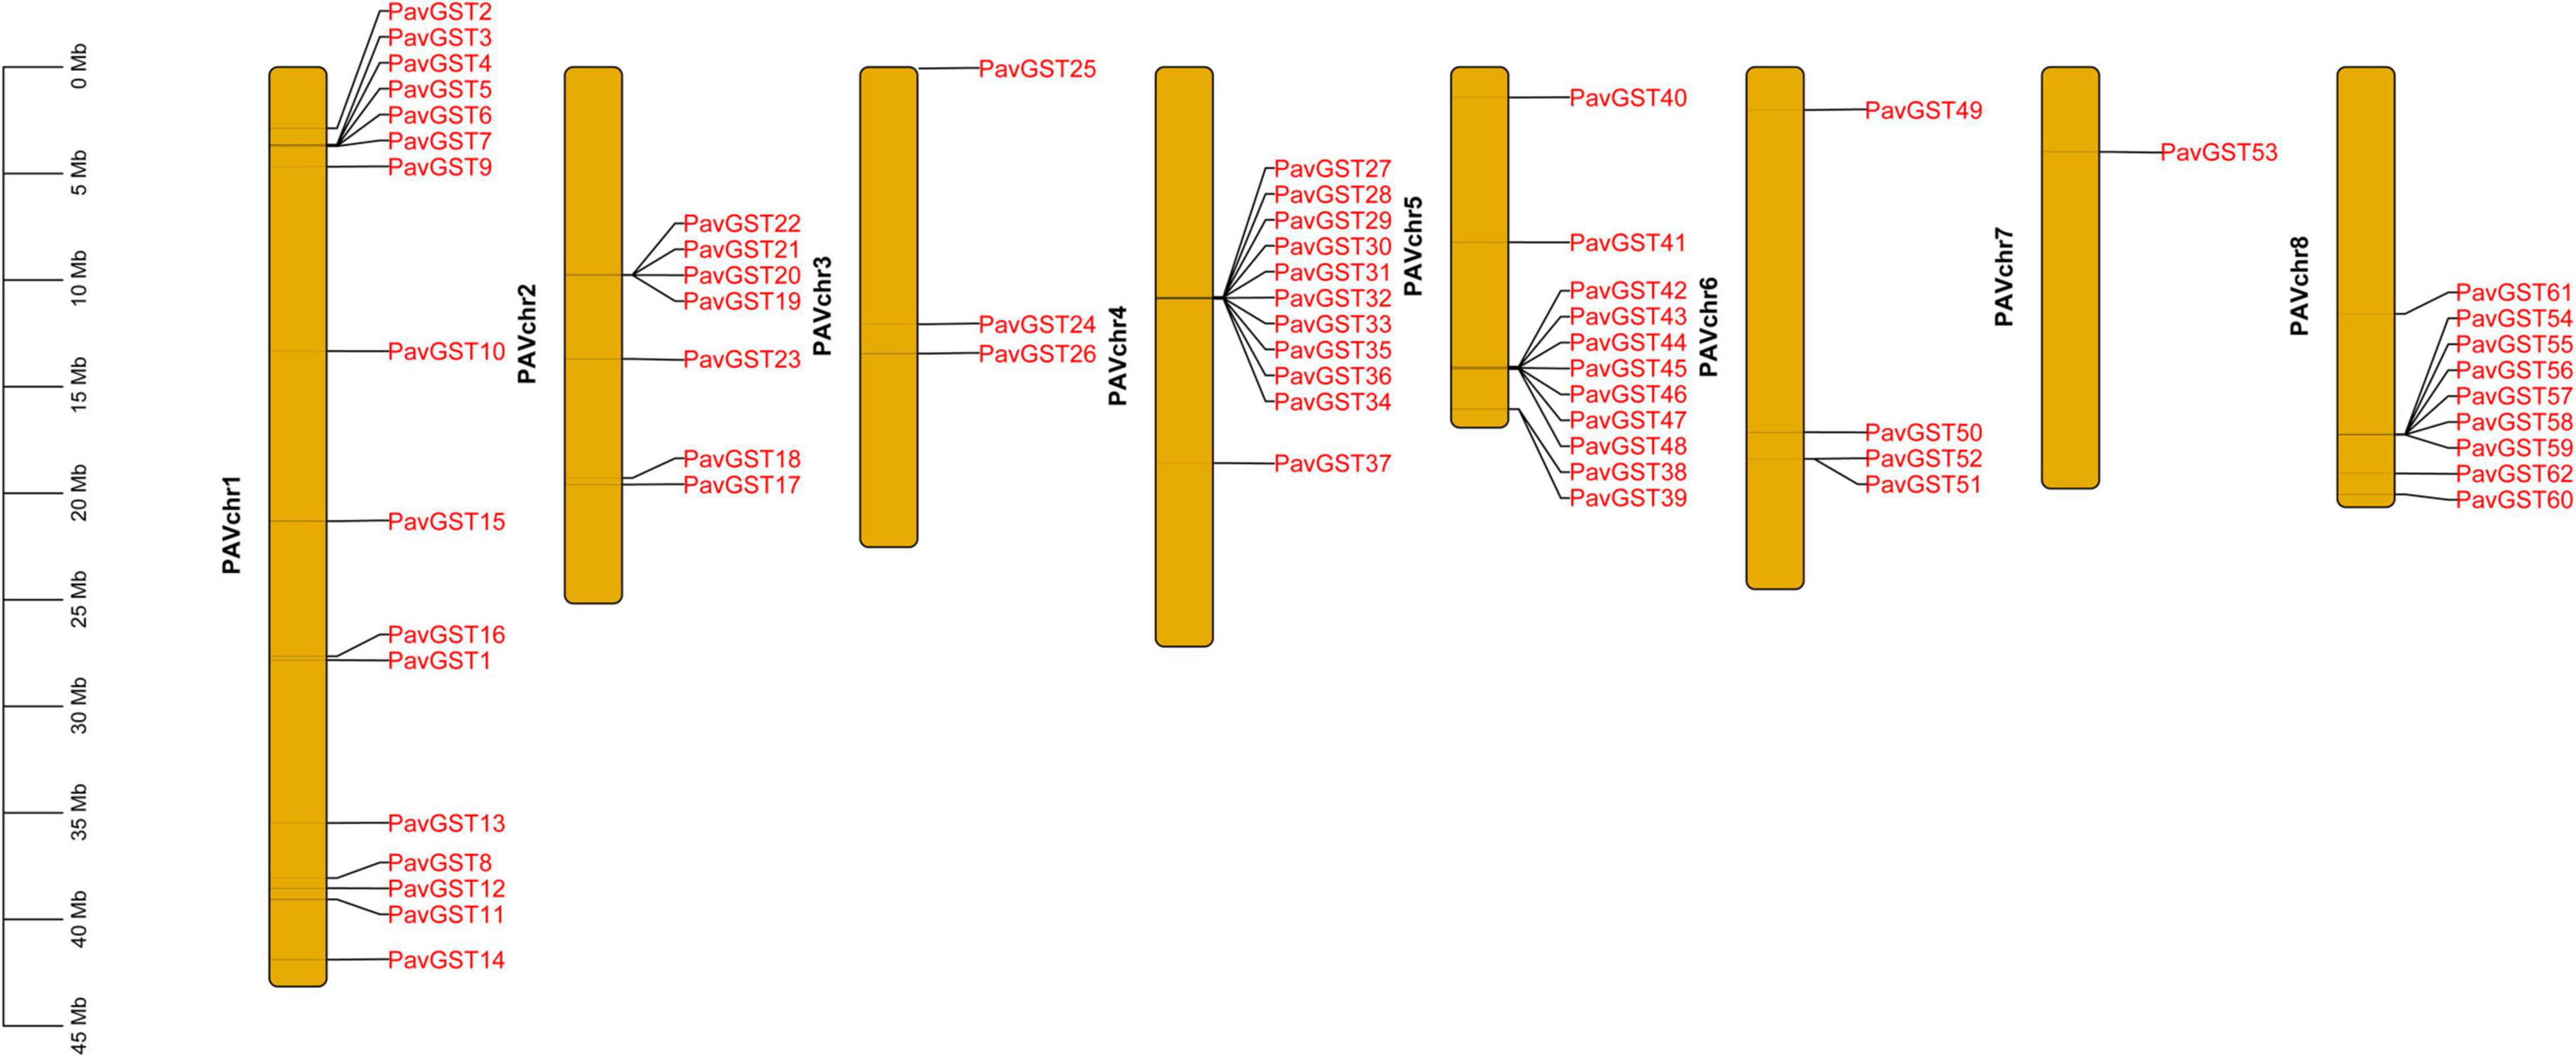
Figure 7. Chromosome localization of PavGST genes on 8 chromosomes and scale represents the length of each chromosome.
Functional Annotation Study of PavGST Genes
Gene ontology (GO) enrichment was evaluated in the biological process, subcellular localization, molecular function, and cellular components, which was beneficial for understanding protein function at the molecular level. As a result, the CELLO2GO tool was used to conduct a GO enrichment study of PavGSTs (Figure 8 and Supplementary Table 5). A total of 15 functional groups were found to be related to cellular components, 8 groups were traced with subcellular localization, eight groups were found to be engaged in molecular functions, and the other 13 groups might well be important in plant biological processes (Figure 8). In molecular functions, the function of ion binding, DNA binding, nucleic acid binding, isomerase activity, oxidoreductase activity, and transferase activity TFs were found in 22.56, 1, 1.94, 18.76, 22.56, and 25.30% of PavGST, respectively (Figure 8), indicating that these genes may control gene transcription and expression via these activities. On the other hand, the biological process GO term showed that PavGST participates in the catabolic process (9.16%), secondary metabolic process (9.05%), response to stress (8.91%), signal transduction (8.76%), and biosynthetic process (7.45%). Go ontology also revealed that PavGST genes are involved in the cellular protein modification process (6.42%), anatomical structure development, and carbohydrate metabolic process (5.46%). Furthermore, the cellular component GO term demonstrated that most of PavGST (14.30%) were found in the intracellular, cytoplasm, cell, and organelle, while plastid, plasma membrane, and nucleus had only 12.15, 6.93, and 2.86%, respectively. Finally, subcellular localization demonstrated that 56, 3, and 2% of PavGST are related to cytoplasmic, chloroplast, and mitochondrial, respectively, while only 1% of PavGST members were found in ER, nuclear, and extracellular (Figure 8).
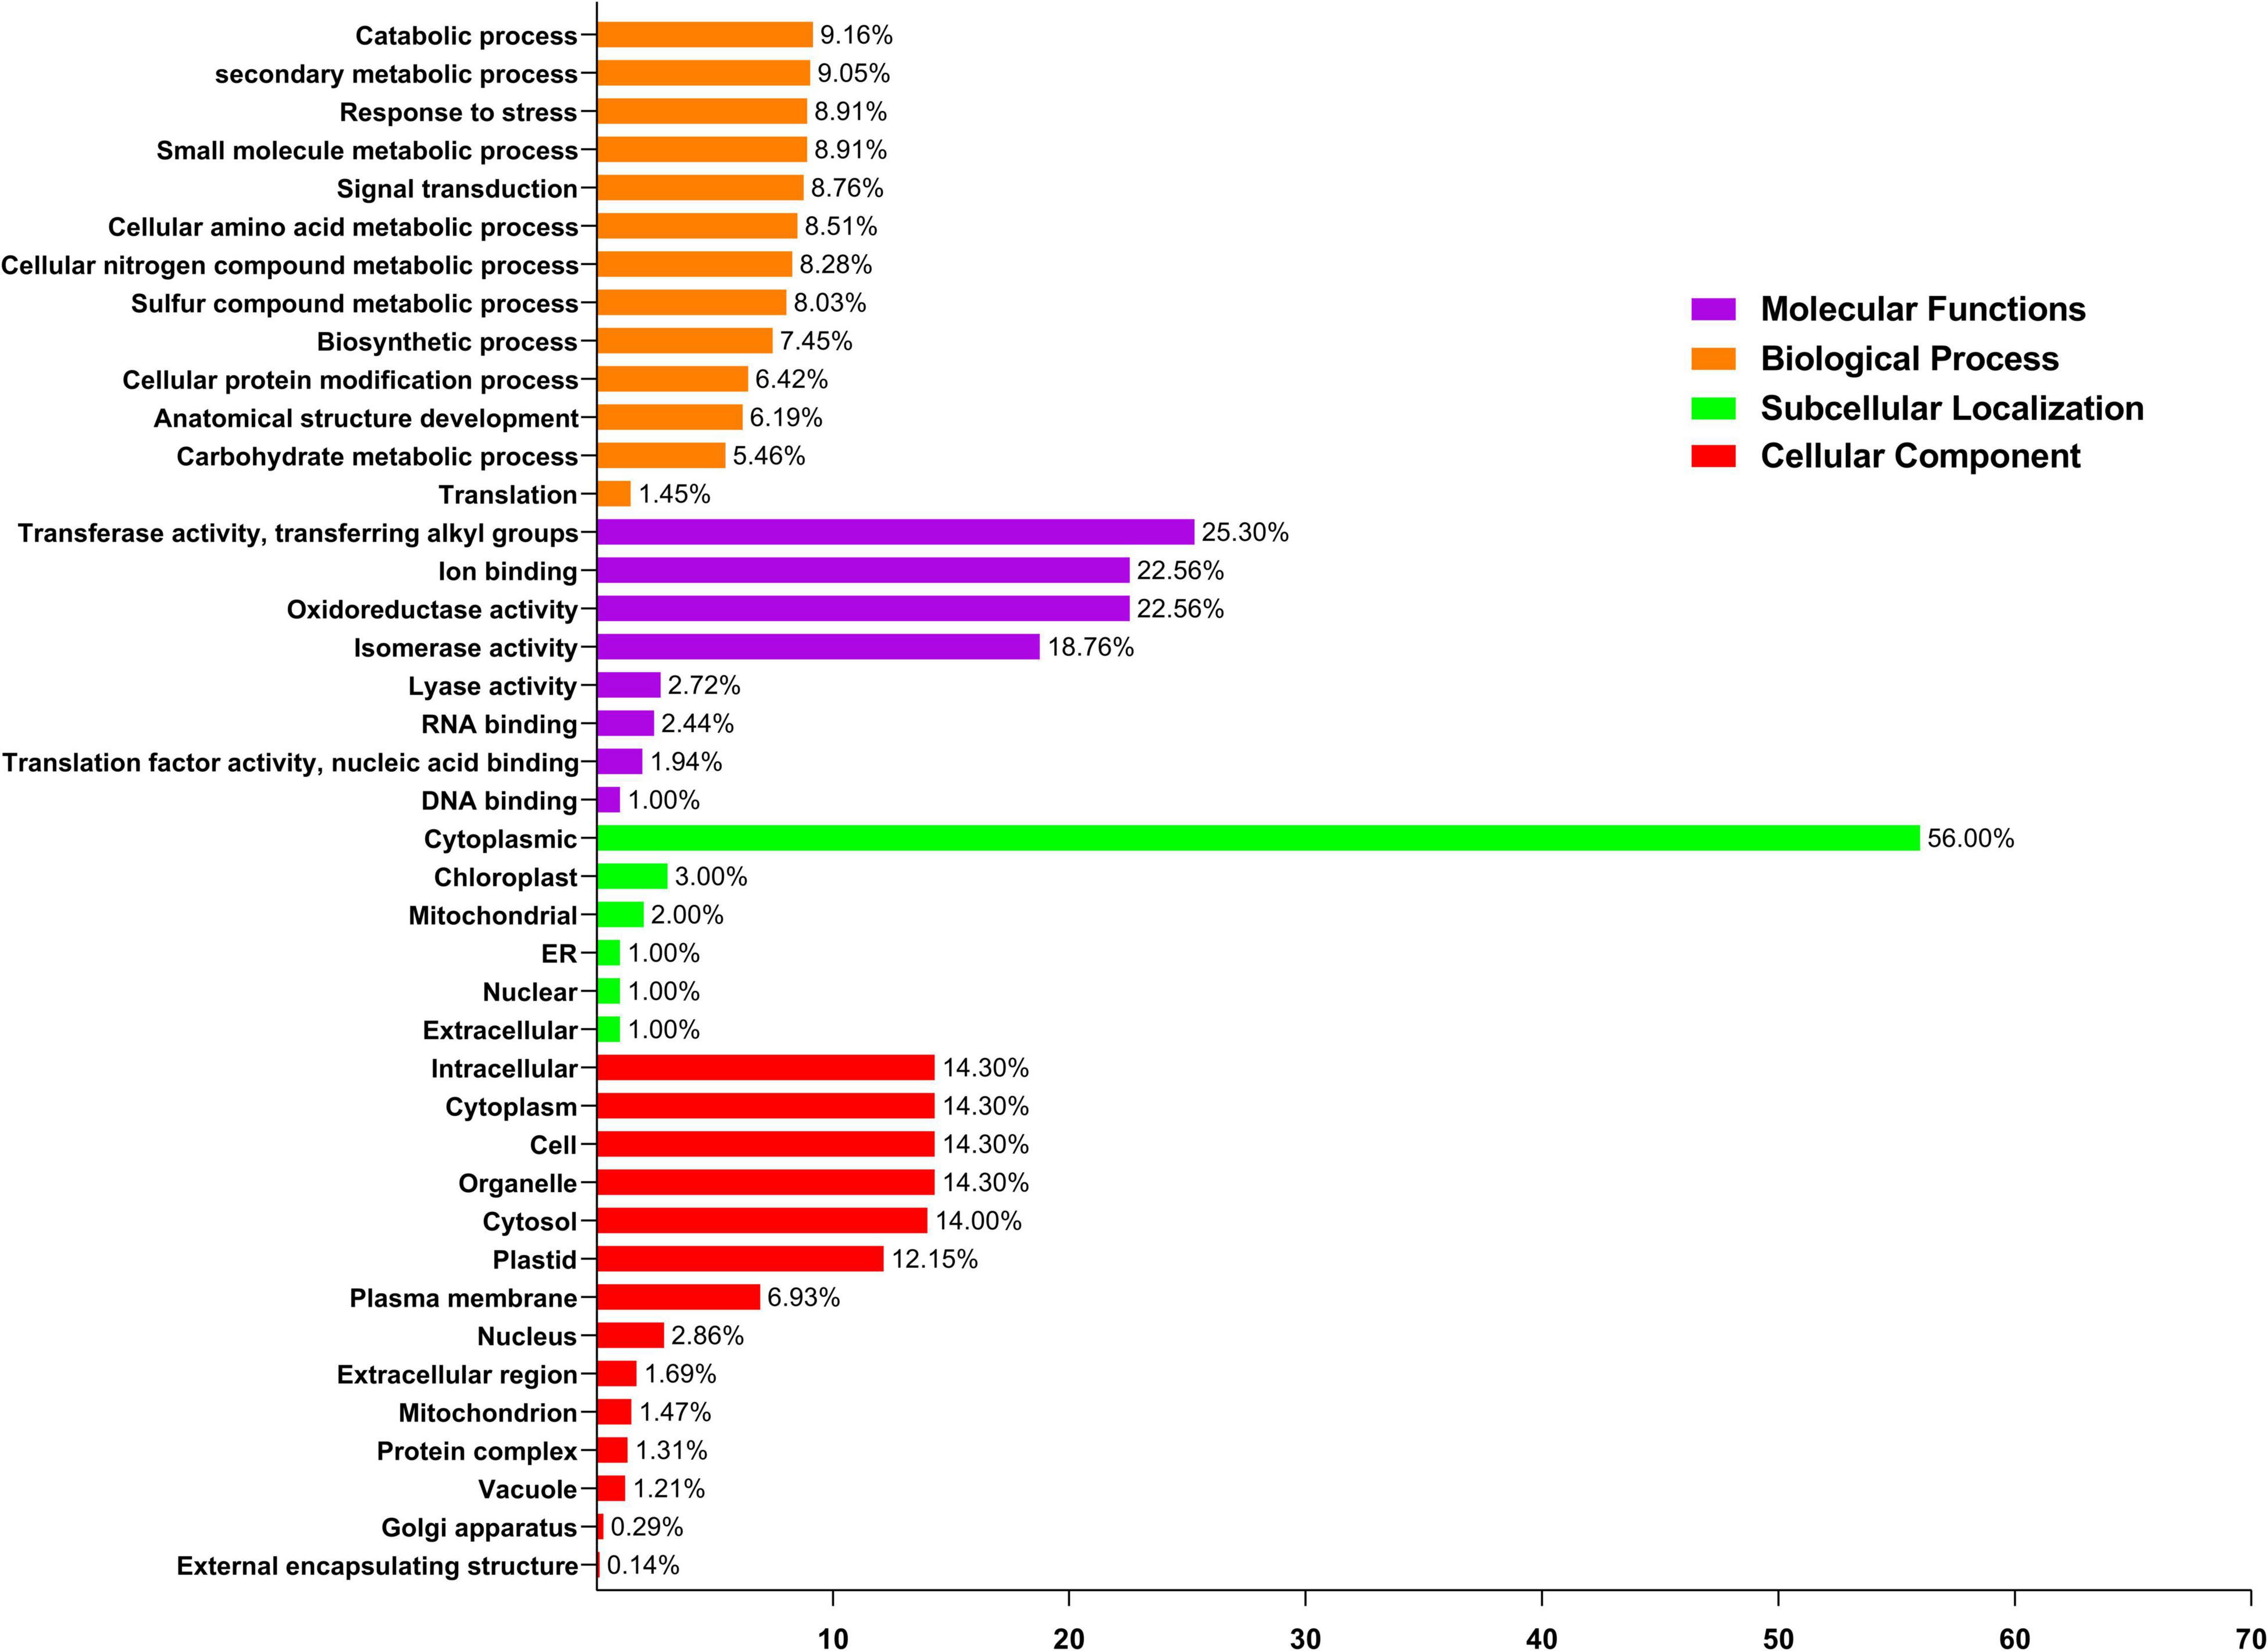
Figure 8. Gene ontology (GO) annotation of PavGST proteins. The GO annotation was performed based on three categories, Molecular function, cellular component, and biological process. The numbers on the bars represent the number of predicted proteins.
Transcriptional Profiling of Sweet Cherry Glutathione S-Transferases Genes
GST is a critical transporter implicated in anthocyanin accumulation, according to several studies (Hu et al., 2016; Luo et al., 2018; Zhao et al., 2020). We utilized RNA-seq data from previous research to investigate the intimate link between PavGSTs and anthocyanin metabolic pathways. The gene expression was examined using fragments per kilo base million (FPKM) measurements. Transcriptomic data was used to analyze the expression patterns of PavGST genes in various cultivars (Bing, Rainers, and Lapins). Distinct cultivars exhibited different expression patterns for GSTs genes (Figure 9 and Supplementary Table 6). Based on expression patterns of PavGST members were classified into three groups (Supplementary Table 6). The first group was upregulated in all cultivars with 14 members (20.89%) in which some members were highly expressed in all stages like Pav_sc0001196.1_g1310.1.mk and Pav_sc0001124.1_g450.1.mk were extremely expressed in all cultivars while some members like Pav_sc0000599.1_g130.1.mk and Pav_sc0001196.1_g2210.1.mk and exhibited their extreme expression in specific cultivars like in Lapins and Rainers and expressed a little bit lower expression in Bing. These findings demonstrated that several PavGST members are cultivar-specific since they are strongly expressed in specific cultivars as compared to others. On other hand, the same phenomenon was identified in the second group; 14 members (20.89%) were only expressed in specific cultivars and remained silent in remaining cultivars like Pav_sc0000164.1_g210.1.mk, Pav_sc0001126.1_g250.1.br, Pav_sc0007176.1_g020.1.br, and Pav_sc0000164.1_g200.1.br expressed their expression in only in Bing but remain silent in other cultivars. The same was also noted in Pav_sc0001215.1_g320.1.mk, Pav_sc0011895.1_g020.1.mk, and Pav_sc0000095.1_g730.1.mk, which only exceedingly expressed in Lipins and remains silent in other cultivars. Different expression patterns indicated the diverse activities of PavGST genes in the respective pathways, hence offering a guide for identifying functional genes. The remaining 39 members (58.23% expression) have not been discovered in any cultivar and are remained silent (Figure 9 and Supplementary Table 6). These results revealed that these PavGST members might have some other particular functions in sweet cherry.
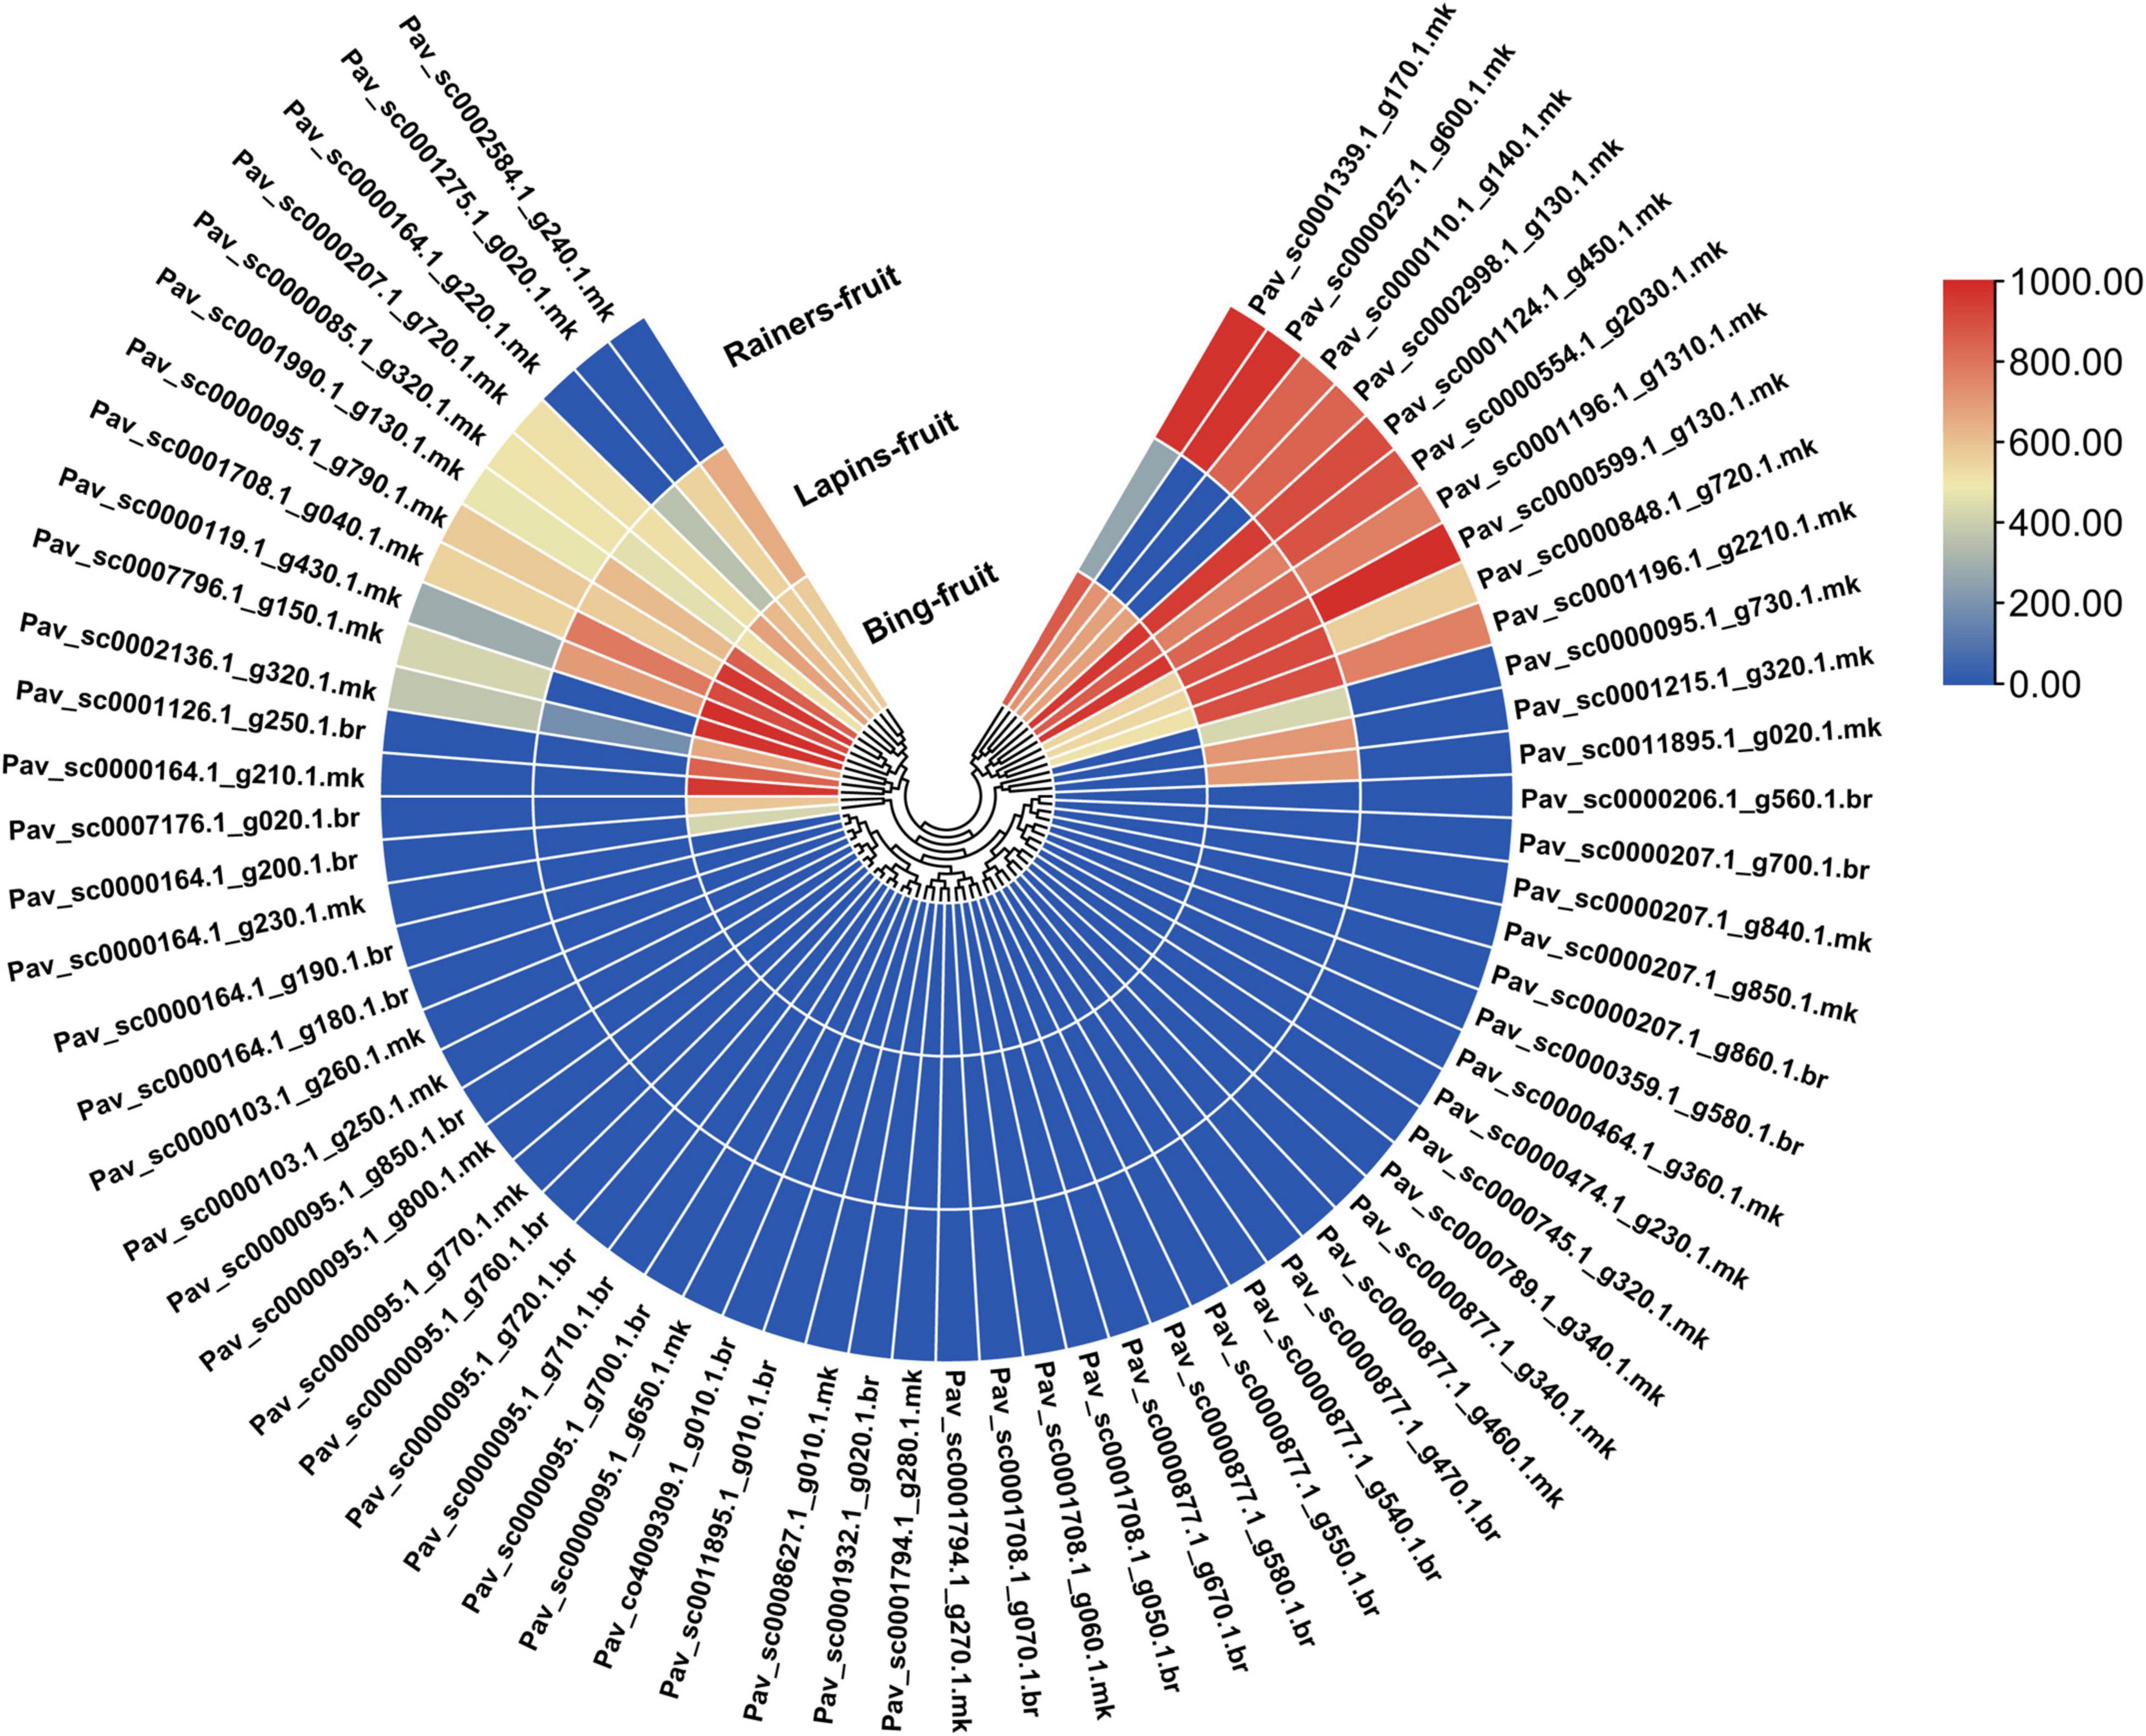
Figure 9. Transcriptomic evaluation of 67 PavGST genes in the fruit of three sweet cherry cultivars (Bing, Lapin, Rainer). Different colors revealed expression intensity.
Anthocyanin Content Accumulation
Anthocyanin is a key pigment in plants and getting more interest from researchers due to its extensive wide range of color, prominent beneficial health effect, and higher antioxidant activities. Moreover, we further measured the anthocyanin contents in the peal and flesh of sweet cherry fruit after applying the LED treatment for different time durations (30H, 50H, 80H, 100H). The results revealed the enhancement pattern for anthocyanin accumulation in the peel of the fruit when it was treated with LED light. As the duration of LED light increased the anthocyanin content also increased (Figure 10B). A significant difference was observed in all treatments as compared with control and also same results were identified between treatments (Figure 10B). Additionally, a slight change in anthocyanin contents was observed in the flesh of the fruit. All treatments demonstrated meaningful differences as compared with control except the 30H treatment. Maximum anthocyanin was noticed at 100H as compared with control (Figure 10A).
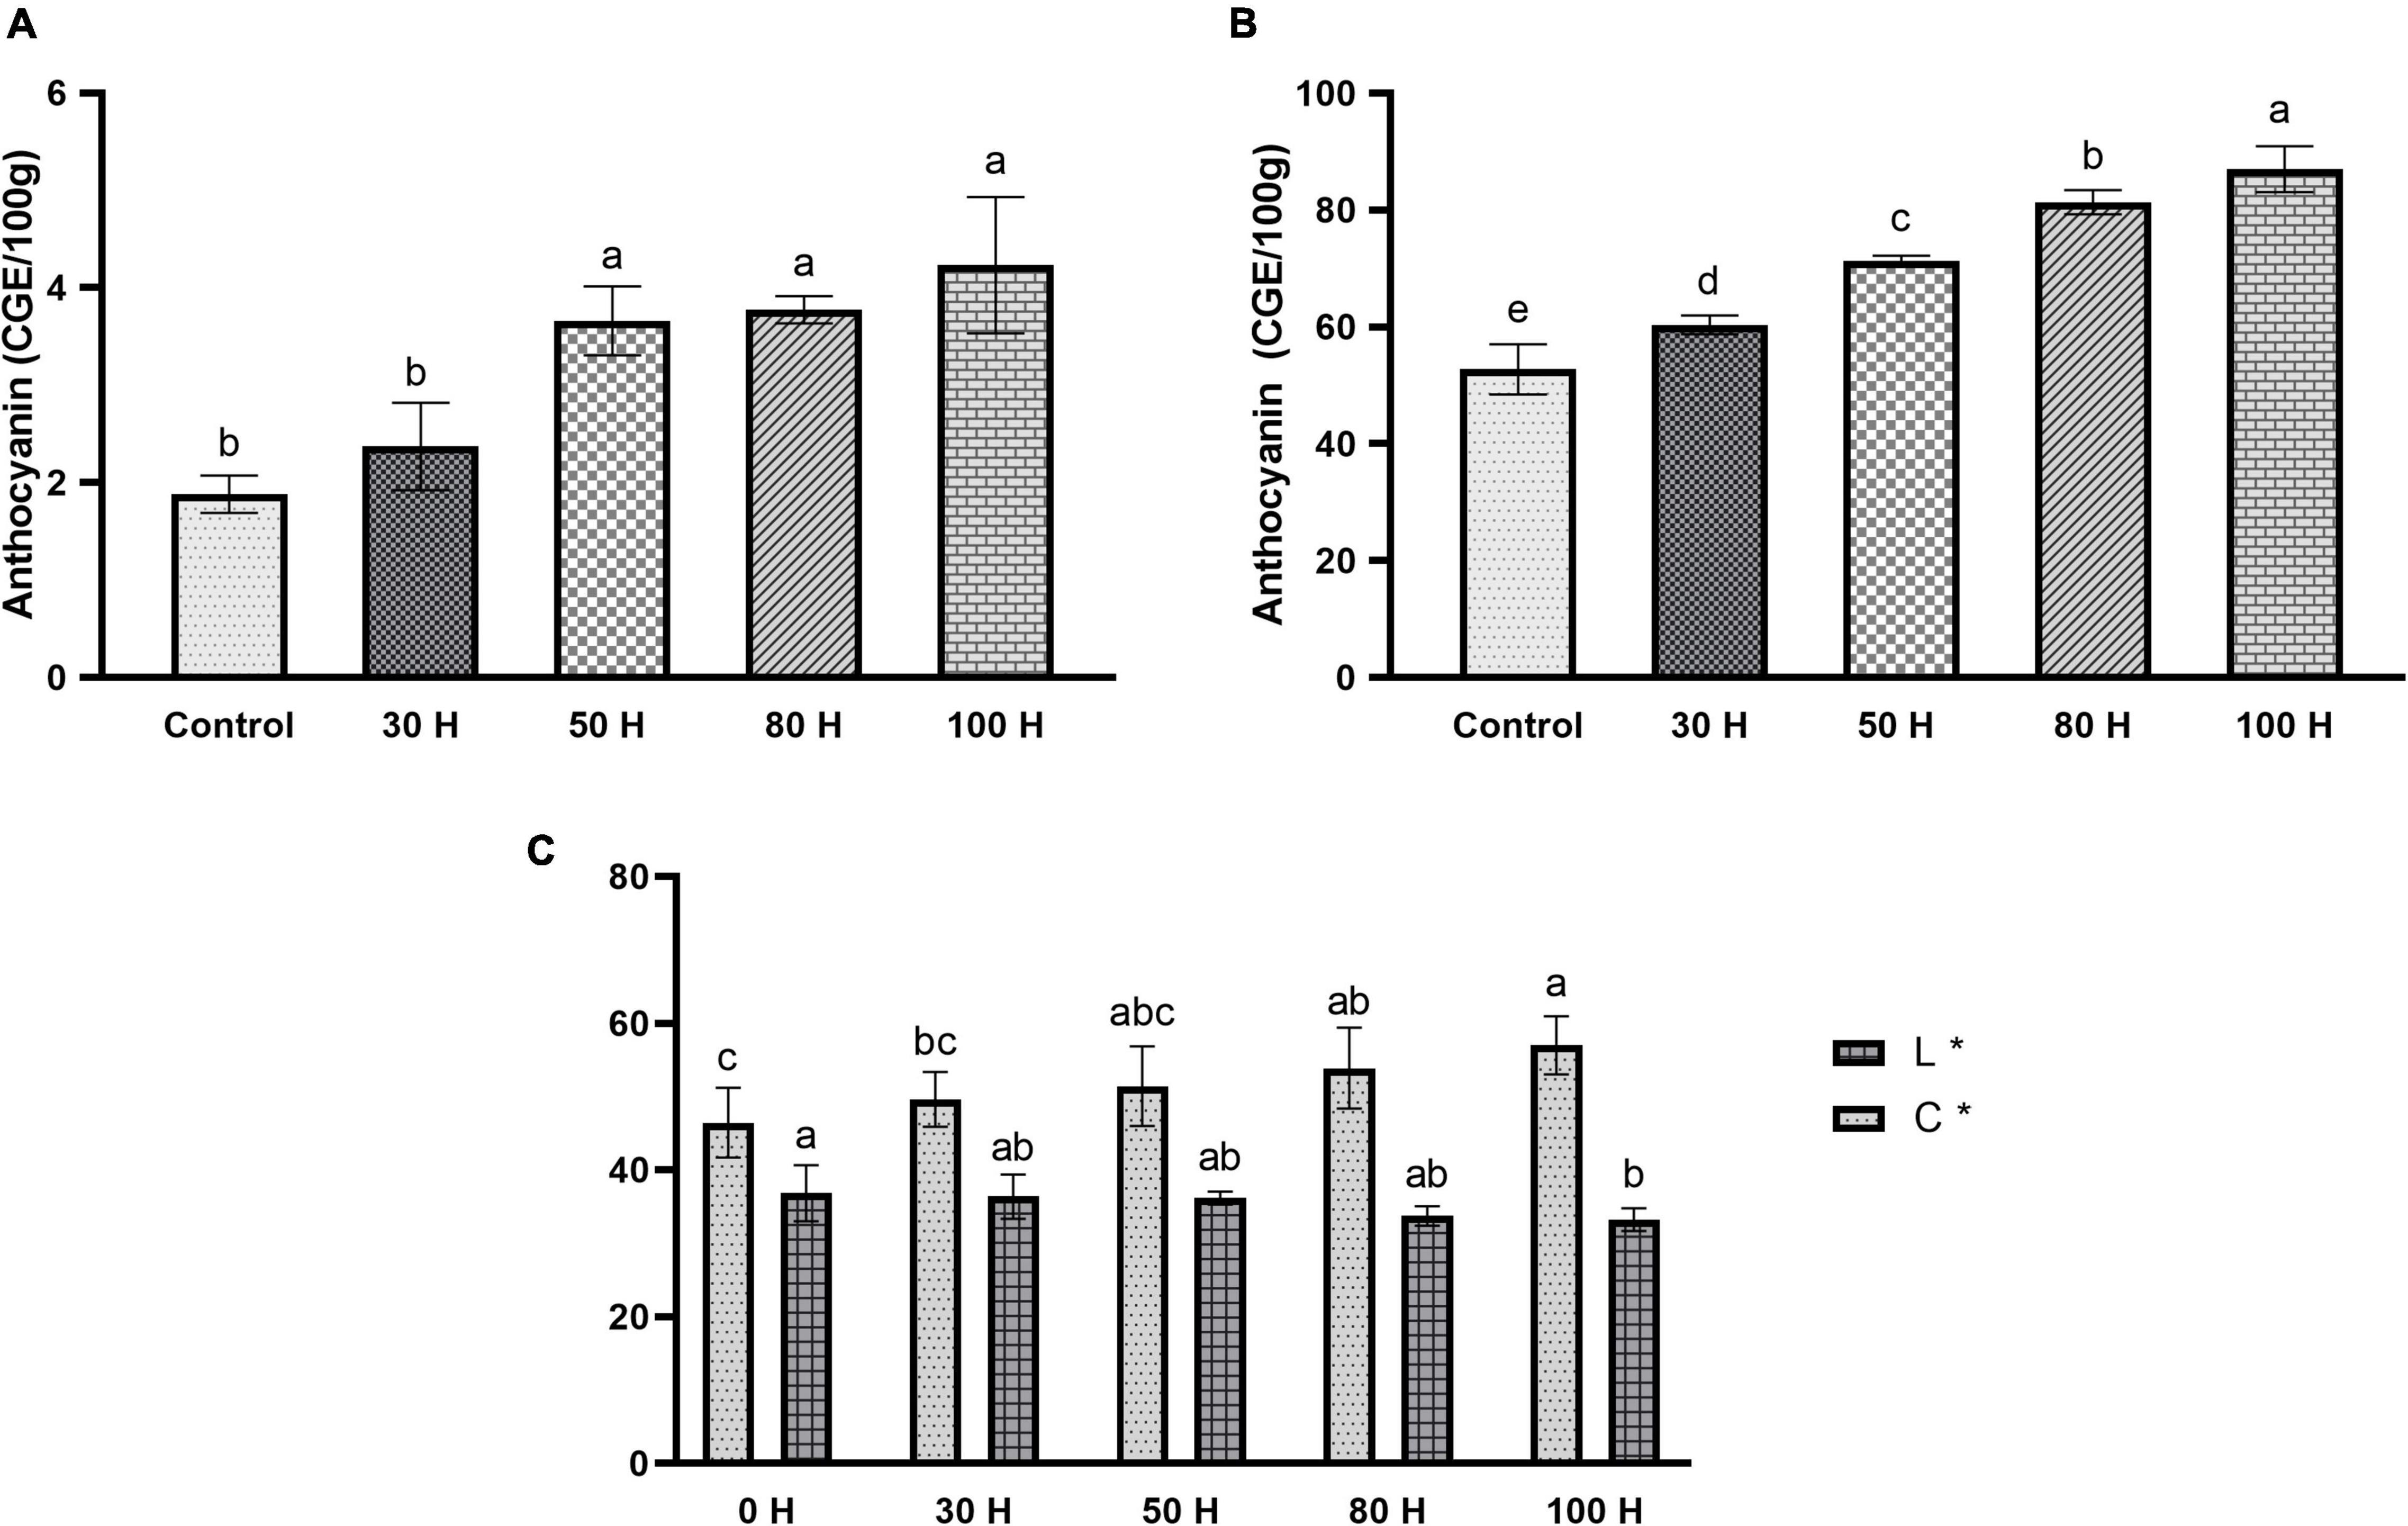
Figure 10. (A) Effect of LED light on anthocyanin contents in pulp (CGE/100 g) in sweet cherry cv. “Van.” (B) Effect of LED light on anthocyanin contents in peel CGE/100 g) in sweet cherry cv. “Van.” (C) Effect of LED light on color enhancement (L*, C*) sweet cherry cv. “Van.” Data are average ± SE. Different letters represent the significant difference between different time periods at 0.05 probability level (LSD test).
Fruit Color and Antioxidant Evaluation
Antioxidants perform a key role in health-enhancing biochemical pathways. Moreover, our results revealed the enhancement pattern in antioxidant contents. The scavenging activity of fruit extract against DPPH was concentration-dependent. Different concentrations expressed different free radical scavenging activity by DPPH. At 50 μlconcentration, maximum activity was found in 100H treatment as compared to control while other treatments also showed a significant difference as compared with control (Figure 11). However, using 200 μl concentrations, a significant difference was found in all treatments as compared to control, as well as between treatments also. Maximum activity was observed in the 100H treatment as compared with control while the minimum was noticed in the 30H treatment. However, other treatments also revealed significant differences as compared with control while at 100 μl concentration all treatments showed significant results as compared with control (Figure 11). Additionally, color intensity (C * value) and lightness (L * value) in sweet cherry “cv. Van” is shown in Figure 10C. Color saturation is displayed by the chroma index (C *). Higher values are denoted by the increment of intense red color.
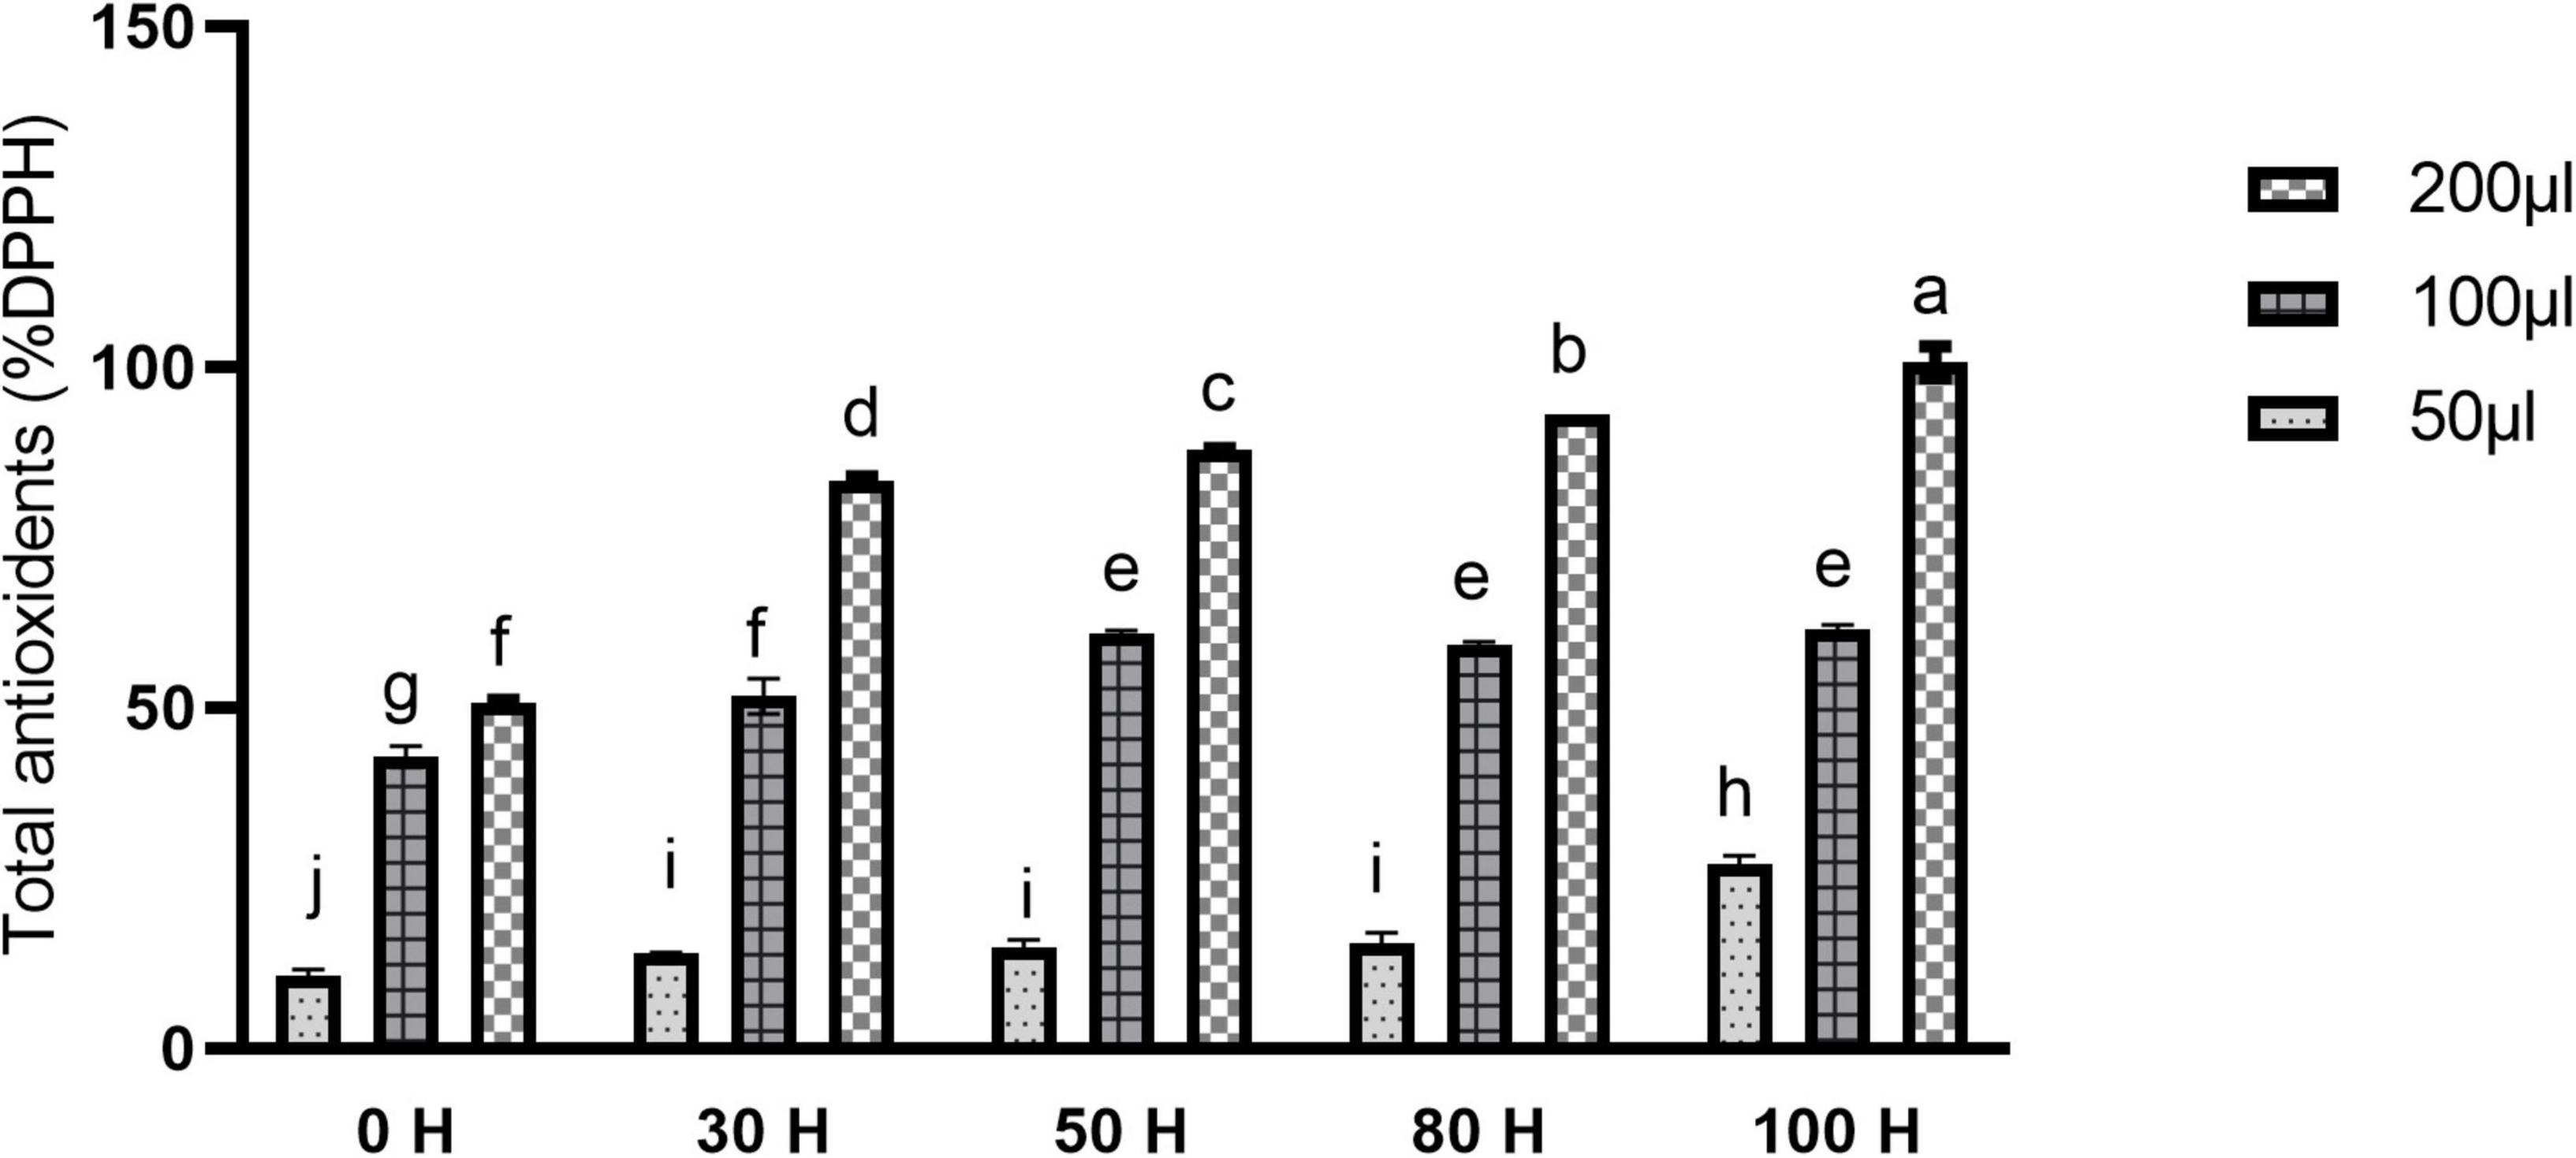
Figure 11. Effect of LED light on Total antioxidants (%DPPH) in sweet cherry cv. “Van.” Data are average ± SE. Different letters represent significant difference between different time periods at 0.05 probability level (LSD test).
Expression Analysis of PavGSTs Through Quantitative Real-Time PCR
Sun light is the most crucial factor for plant development and adequate phytochemical accumulation. However, due to continual gloomy, rainy days, greenhouse structures, and covers, the intensity of sunshine in the glasshouse is often insufficient for plants to develop properly and synthesize phytochemicals (Bian et al., 2015). In a regulated context, artificial LED light has been strategically implemented to enhance plant food quality, particularly the concentration of phenolic chemicals (Bian et al., 2015). Plant phytochemical concentration is affected by light quality (Kopsell and Kopsell, 2008). LED light has been shown to boost anthocyanin in tomatoes (Giliberto et al., 2005) and buckwheat seedlings (Azad et al., 2020). The GST gene family plays a vital role in anthocyanin accumulation (Fang et al., 2020). For validation, four LED treatments (30H, 50H, 80H, 100H) were applied to Van cultivar and were compared with the untreated control. 12 different PavGST transcripts belonging to different subclasses (DHAR, phi, tau, theta, and lambda) were selected and validated using qRT-PCR (Figure 12). For the Tau subclass, we found that Pav_sc0000164.1_g200.1.br (PavGST56) and Pav_sc0011895.1_g020.1.mk (PavGST67) were the most highly expressed in all four treatments as compared to control while Pav_sc0002136.1_g320.1.mk (PavGST14), Pav_sc0001708.1_g040.1.mk (PavGST19) and Pav_sc0000207.1_g720.1.mk (PavGST4) showed mild positive expression pattern as compared to untreated control. For the phi subclass, we found that two transcripts (Pav_sc0001124.1_g450.1.mk (PavGST25), Pav_sc0000848.1_g720.1.mk (PavGST60) were more highly expressed in the 80H and 100 H while Pav_sc0001215.1_g320.1.mk (PavGST26), and Pav_sc0007796.1_g150.1.mk (PavGST16) expressed slightly positive expression pattern as compared to control (Figure 12).
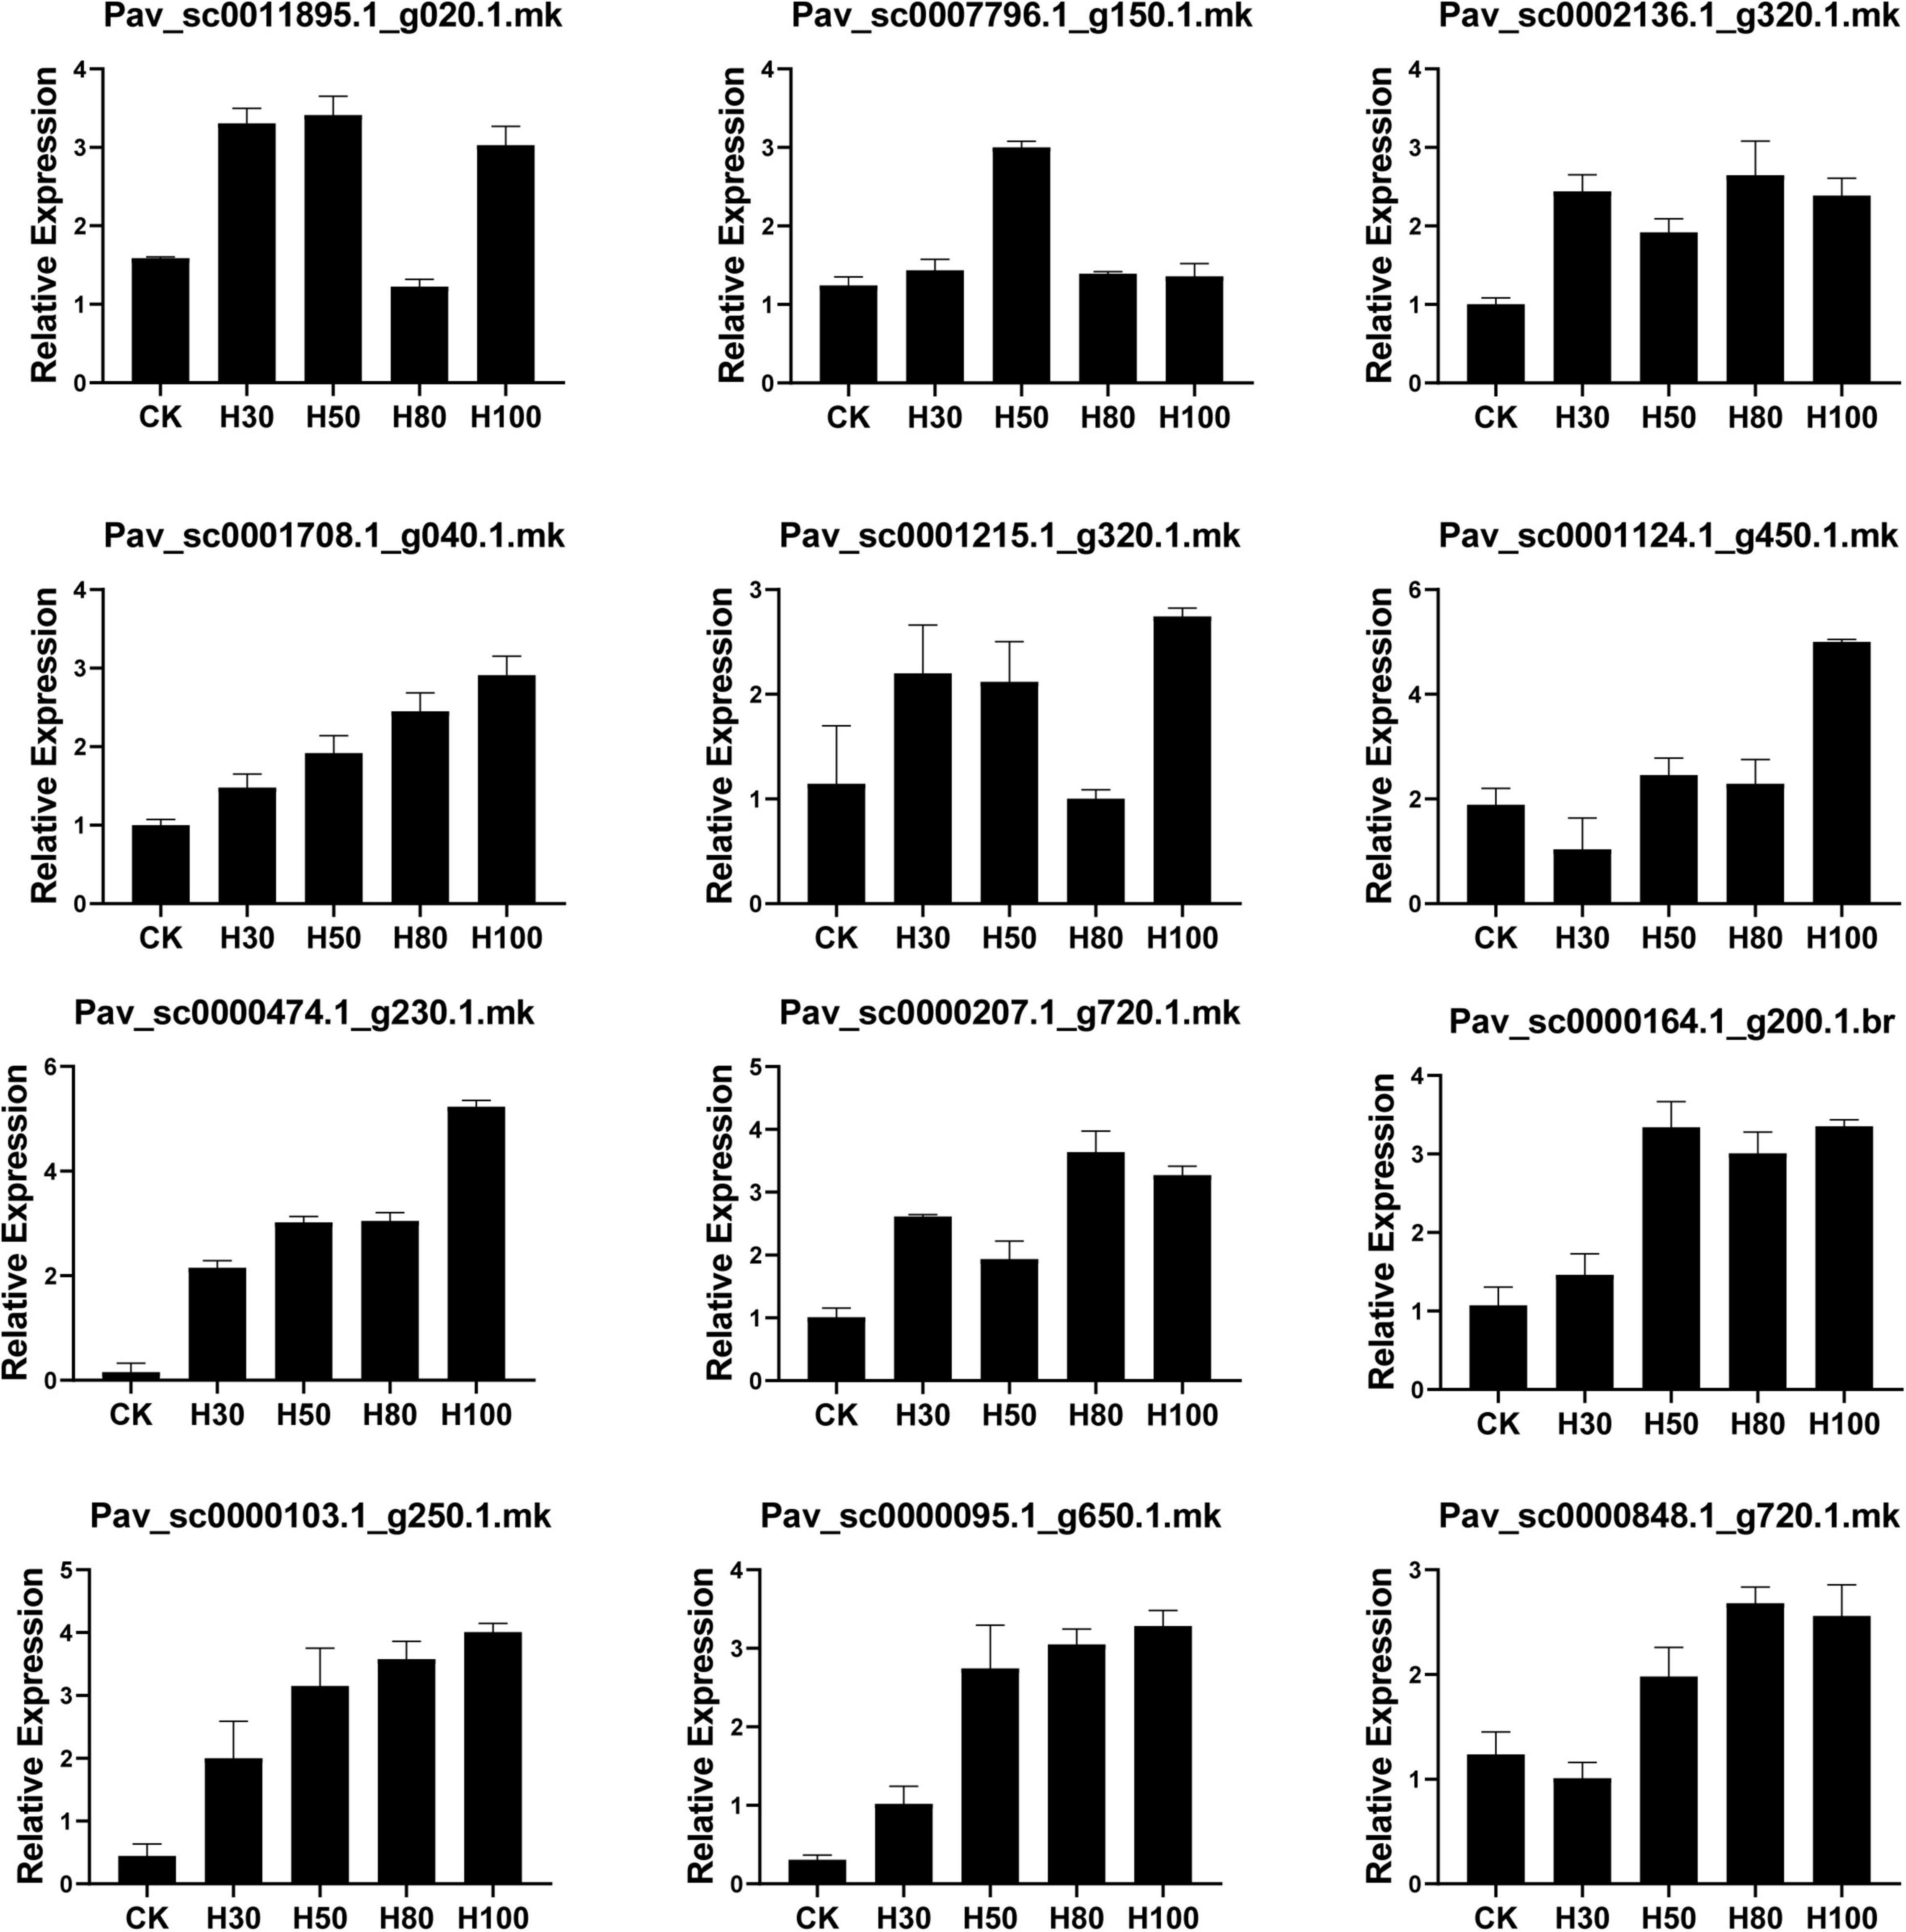
Figure 12. Relative expression behavior of PavGST genes through qRT-PCR on the different time duration of LED implementation on fruit. Mean ± SE of three biological replicates (each having three technical replicates).
Moreover, Pav_sc0000474.1_g230.1.mk (PavGST40-Phi), Pav_sc0000103.1_g250.1.mk (PavGST38-Tau) and Pav_sc0000095.1_g650.1.mk (PavGST27-Tau) showed some interesting expression pattern, (Figure 12) which illustrated that these PavGST genes did not express in control treatment but after applying the LED light, all these three-member expressed extensive expression. RNA seq analysis also exhibited the silent behavior of these three genes in all cultivars. These results illustrated that these genes play a vital role in anthocyanin accumulation under the specific artificial LED light. The results also revealed that the GST gene family play a key role in anthocyanin accumulation in sweet cherry.
Discussion
In the cytoplasm, anthocyanins are synthesized by flavonoid metabolic pathways and then transported to vacuoles for storage (Gu et al., 2019). Earlier research has demonstrated the intracellular transport mechanism for anthocyanin. GST mediation, vesicle trafficking, or membrane transport are all required for anthocyanins to infiltrate vacuoles from the cytoplasm (Zhao, 2015). GSTs are versatile enzymes that play a role in the production of secondary metabolites. The role of GSTs for anthocyanin accumulation has been investigated in many plants like Arabidopsis (Sun et al., 2012), strawberry (Lin et al., 2020), peach (Zhao et al., 2020), litchi (Hu et al., 2016), cyclamen (Kitamura et al., 2012), apple, and pear (Zhao et al., 2021). GST is a supergene family found in higher plants that are subdivided into subclasses F, U, Z, T, L, EF1B, GHR, DHAR, and TCHQD (Nianiou-Obeidat et al., 2017). Numerous GSTs have been identified in plants so far, including 64 GSTs in Arabidopsis (Sappl et al., 2009), 52 GSTs in apple (Zhao et al., 2021), 82 GSTs in radish (Gao et al., 2020), 42 GSTs in pear (Zhao et al., 2021), 139 GSTs in litchi (Hu et al., 2016), 50 GSTs in peach (Zhao et al., 2020), and 29 GSTs in strawberry (Luo et al., 2018). GSTs have been found in a variety of plant species in recent years, and the number and content of GST family members vary across species. Nevertheless, no genome-wide identification and characterization of the GST gene family in P. avium has been revealed.
Our research offers a comprehensive and systematic whole-genome evolutionary investigation of GST (Vaish et al., 2018) members derived from sweet cherry genomes. There were a total of 67 GST genes found in the P. avium (Supplementary Table 1). Our phylogenetic findings suggest that sweet cherry genomes have undergone gene acquisition. PavGST genes were found to be present in each of the seven main GST subfamilies (Tau, DHAR, Lambda, Zeta, Phl, Theta, and TCHQD) that were identified by phylogenetic analysis (Figure 1) and concluded to be identical to other plant species which were studied previously (Csiszár et al., 2014; Islam et al., 2018; Wang et al., 2018). The Tau subfamily contained the highest PavGST member. The same phenomenon was also confirmed in apples (Fang et al., 2020). Moreover, the number of amino acids of GST proteins ranged from 61 to 527 kDa with an average of 219.42kDa (Supplementary Table 1) which revealed a significant variation among PavGST members. However, the differences across clades might be associated with the different functionalities and diversity of conserved motif structure and exons/introns. The properties of GSTs’ gene structure were retained in apple, Populus, sweet, and potato (Lan et al., 2009; Ding et al., 2017; Islam et al., 2018). It is also important to note that intron and exon variants play a crucial influence in gene evolution (Xu et al., 2011; Jo and Choi, 2015; Mustafin and Khusnutdinova, 2015). The 67 GST genes in this research have varying numbers of introns and exons, suggesting the heterogeneity of sweet cherry GST genes. The PavGST genes had varied intron numbers from 1 (PavGST29, PavGST31, PavGST10) to 12 (PavGST11) while exon numbers varied from 1 (PavGST54, PavGST8, and PavGST39) – 10 (PavGST53 and PavGST64; Figure 2). Additionally, the majority of the genes in the same subfamily exhibited comparable motif compositions. A total of 20 distinct motifs were discovered among the GST genes of the P. avium and at least one of these is present in each candidate gene. The arrangement and quantity of the 20 different intra-species and inter-species motif types revealed that GST members are functionally diverse (Figure 2). Moreover, the protein functions are thought to be related to its subcellular localization (Dönnes and Höglund, 2004). The function of a protein is thought to be related to its subcellular localization (Dönnes and Höglund, 2004). The bioinformatics examination in this work revealed that the majority of GSTs were found in the cytoplasm (Figure 8 and Supplementary Table 5), which was similar to prior research (Dong et al., 2016; Islam et al., 2017; Kayum et al., 2018). GSTs involved in flavonoid transport have been linked to membranes, including the vacuole and the endoplasmic reticulum (ER; Conn et al., 2008; Kitamura et al., 2010; Gomez et al., 2011; Zhao, 2015). GSTs involved in flavonoid transport have been linked to membranes, including the endoplasmic reticulum (ER) and the vacuole (Conn et al., 2008; Gomez et al., 2011; Zhao, 2015). This divergence might be attributable to a program limitation or the complexities of protein localization (Xiong et al., 2016). Gene duplications are an important process in all plants for producing genetic innovation, which might assist organisms in adapting to environmental change (Alvarez-Buylla et al., 2000; Kondrashov, 2012). Different types of gene duplication, such as TD, PD, DSD, WGD, and TD, significantly contribute to plant-specific gene expansion (Qiao et al., 2018; Si et al., 2019). Typically, whole-genome duplication (WGD), segmental duplication, and tandem duplication events are regarded to be the key driving factor for producing new genes and gene family expansion (Rensing, 2014). We observed that TD and DSD contributed significantly to GST family member expansions in sweet cherry (Figure 4 and Supplementary Table 3). The same phenomenon was observed in apple, rice, G. Arboreum, G. raimondii (Dong et al., 2016), poplar (Lan et al., 2009), and Capsella rubella (He et al., 2016). Gene duplication is crucial not just for expanding genomic content, but also for producing novel gene functions, which may help organisms to adapt to complicated surroundings (Freeling, 2009). In addition, we used CDS to examine the frequencies of ka and ks substitutions (coding sequences). Positive selection is defined as a value larger than 1, purifying selection as a value less than 1, and neutral selection as a value of 1 (Volokita et al., 2011; Zhang et al., 2014). All Ka/Ks ratios of paralogous genes show that GST protein activities may be predominantly determined by purifying selection (Figure 5 and Supplementary Table 3). Mode of duplication events and the ages of genome duplication events show that GSTs evolved through a complex mechanism. The addition or deletion of an exon or intron is critical for the diversification of multigene families. This event might occur as a result of the rearrangement and fusion of several chromosomal segments (Xu et al., 2012).
Light is one of the most important components in plant growth and development since it directly regulates plant morphogenesis, gene expression, metabolism, photosynthesis, and other physiological reactions. Light conditions can alter qualitative and quantitative changes in anthocyanin. Numerous research has been conducted in the past decade to examine the effects of light quality and intensity on plant development and functional chemical yields (Goto, 2012). Anthocyanin is a key pigment in plants and attracting more interest from researchers due to its extensive and wide range of color, prominent beneficial health effect, and higher antioxidant activities. They are also involved in antimicrobial activity and protect the cells from intensive light damage by absorbing blue and ultraviolet light (Seigler, 1998). Insufficient light and nutrient availability decreased the anthocyanin contents in fruits (Youdim et al., 2002; Ohashi-Kaneko et al., 2007). In the current study, led light was applied to the fully mature fruit of “Van” sweet cherry cultivar for different time durations (30H, 50H, 80H, and 100H). The results illustrated the boosted pattern in anthocyanin accumulation in fruit skin and pulp (Figure 10). The same enhancement pattern was observed in strawberries and grapes when treated with LED light (Kim et al., 2005; Kadomura-Ishikawa et al., 2013; Kondo et al., 2014). LED application for a sufficient period may be an effective technique for increasing plant anthocyanin content (Azad et al., 2020). The molecular processes that underlie anthocyanin accumulation caused by LEDs are yet not completely known. Previous research has shown that LED stimulates the expression of anthocyanin biosyntheses structural genes, such as PHYs and CRY, as well as regulatory genes, such as MYB, bHLH, and WRKY (Zhang et al., 2018). Moreover, antioxidants perform a key role in health-enhancing biochemical pathways (Hogewoning et al., 2010) and bioactive compounds like carotenoids, flavonoids, and phenolic which have potential for antioxidant activity (Fernández-Ruiz et al., 2017). LED light also placed a positive impact on antioxidant accumulation in sweet cherry, as well as same enhancement pattern of antioxidant contents was confirmed in Chinese kale sprouts and fruit when treated with blue LED light as compared with control (Galuszka et al., 2005; Qian et al., 2016). Additionally, we also investigated and confirmed transcriptomic data obtained from anthocyanin accumulation to acquire insight into the expression patterns of GSTs in response to the accumulation of anthocyanin using qRT-PCR (Figure 12). In response to LED treatments, a distinct divergence in the expression patterns of PavGSTs was identified among them. Based on the qRT-PCR analysis, Tau members, such as Pav sc0000164.1 g200.1.br (PavGST56), Pav sc0000207.1 g720.1.mk (PavGST4), and Pav sc0011895.1 g020.1.mk (PavGST67), reacted swiftly to LED treatment and exhibited high anthocyanin accumulation. Previous findings also demonstrated that Tau GSTs are involved in the detoxification of xenobiotics, the transmission of signals, and the transport of anthocyanin (Loyall et al., 2000; Thom et al., 2002; Jha et al., 2011). Moreover, two members from the Tau subfamily (Pav_sc0000474.1_g230.1.mk -PavGST40, Pav_sc0000103.1_g250.1.mk -PavGST38) and one from the Phi subfamily (Pav_sc0000474.1_g230.1.mk – PavGST40) only revealed their peak expression under higher LED light treatment which demonstrated that transcription of these PavGST genes is under the control of light. The same phenomenon was also confirmed in Lilium regale (Yamagishi, 2016). The RNA-seq data was carried out on the fruit of three sweet cherry cultivars: Bing, Lapins, and Rainers (Figure 9). These data were used to investigate the spatiotemporal expression profile of GST genes in different cultivars. Pav_sc0001196.1_g1310.1.mk and Pav_sc0001124.1_g450.1.mk genes were abundantly expressed in all cultivars, suggesting that these genes play a key role in anthocyanin accumulation. Additionally, cis-acting elements were critical in regulating the expression of genes and hence influencing plant responses to stress and developmental changes (Narusaka et al., 2003). The cis-regulatory elements analysis revealed that GST genes consist of abiotic/biotic stress-related elements and expression of promoters, including CAAT-Box, ABR, and LTR.
Conclusion
The GST gene family has been identified in a wide variety of plant species and has been associated with several key physiological and developmental activities. In this investigation, 67 GST genes were identified in sweet cherry utilizing genome-wide analysis and grouped into seven subfamilies (TCHQD, Theta, Phi, Zeta, Lambda, DHAR, and Tau). The phylogenetic relationship, gene duplication events, conserved motif composition, collinearity analysis, cis-acting elements, conserved domain, chromosomal localizations, non-synonymous, synonymous ratios, and functional divergence of these PavGST genes were all investigated in detail, providing insight into the functional diversity of GST families. Tissue-specific expression and abiotic stress response studies revealed that the expression patterns of GST genes in sweet cherry are very specialized and diverse. The GST genes were highly upregulated in response to an LED treatment, showing that they play a critical role in the accumulation of anthocyanin in sweet cherries. In the future, this work can be used as a good benchmark for future functional studies and genetic breeding of GST genes in sweet cherry, as well as for the identification of relevant candidate genes for future anthocyanin accumulation studies.
Data Availability Statement
The datasets presented in this study can be found in online repositories. The names of the repository/repositories and accession number(s) can be found in the article/Supplementary Material.
Author Contributions
IS and MM conceived and designed the experiments. IS, MM, IHS, XL, SJ, JW, PA, and MA contributed reagents, materials, and analysis tools. CZ provided guidance on the whole manuscript. All authors read and approved the final manuscript.
Funding
This research was supported by the China Agriculture Research System (CARS-30-5-02) and the National Natural Science Foundation of China (32102347).
Conflict of Interest
The authors declare that the research was conducted in the absence of any commercial or financial relationships that could be construed as a potential conflict of interest.
Publisher’s Note
All claims expressed in this article are solely those of the authors and do not necessarily represent those of their affiliated organizations, or those of the publisher, the editors and the reviewers. Any product that may be evaluated in this article, or claim that may be made by its manufacturer, is not guaranteed or endorsed by the publisher.
Acknowledgments
CZ and MA deserve special recognition for their efforts in reviewing the text and providing direction throughout the project.
Supplementary Material
The Supplementary Material for this article can be found online at: https://www.frontiersin.org/articles/10.3389/fpls.2022.938800/full#supplementary-material
Footnotes
- ^ https://www.rosaceae.org
- ^ http://www.ebi.ac.uk/interpro/
- ^ https://www.genscript.com/tools/pcr-primers-designer
- ^ http://gsds.gao-lab.org/
- ^ https://meme-suite.org/meme/tools/meme
- ^ https://mapinspect.software.informer.com/
- ^ https://bioinformatics.psb.ugent.be/webtools/plantcare/html/
- ^ https://popgenie.org/node/42
- ^ http://services.cbu.uib.no/tools/kaks
- ^ http://gsds.cbi.pku.edu.cn/
- ^ https://www.ncbi.nlm.nih.gov/Structure/lexington/lexington.cgi
- ^ http://hmmer.org
- ^ http://bioinformatics.psb.ugent.be/webtools/plantcare
- ^ http://chibba.agtec.uga.edu/duplication
- ^ https://github.com/qiaoxin/Scripts_for_GB/tree/master/calculate_Ka_Ks_pipeline
- ^ http://gsds.cbi.pku.edu.cn/index.php
References
Aamir, M., Cheng, X., Li, G., Su, X., Abdullah, M., and Cai, Y. (2020). Gene structure, evolution and expression analysis of the P-ATPase gene family in Chinese pear (Pyrus bretschneideri). Computat. Biol. Chem. 88:107346. doi: 10.1016/j.compbiolchem.2020.107346
Abdullah, M., Cao, Y., Cheng, X., Shakoor, A., and Su, X. (2018a). Genome-wide analysis characterization and evolution of SBP genes in Fragaria vesca, Pyrus bretschneideri, Prunus persica and Prunus mume. Front. Genet. 9:64. doi: 10.3389/fgene.2018.00064
Abdullah, M., Cheng, X., Cao, Y., Su, X., Manzoor, M. A., Gao, J., et al. (2018b). Zinc finger-homeodomain transcriptional factors (ZHDs) in upland cotton (Gossypium hirsutum): genome-wide identification and expression analysis in fiber development. Front. Genet. 9:357. doi: 10.3389/fgene.2018.00357
Alvarez-Buylla, E. R., Liljegren, S. J., Pelaz, S., Gold, S. E., Burgeff, C., Ditta, G. S., et al. (2000). MADS-box gene evolution beyond flowers: expression in pollen, endosperm, guard cells, roots and trichomes. Plant J. 24, 457–466. doi: 10.1046/j.1365-313x.2000.00891.x
Azad, M. O. K., Adnan, M., Son, J., Choi, D., and Park, C. H. (2020). Effect of artificial LED on the growth, anthocyanin, chlorophyll and total phenolic content of buckwheat seedling. Biomed. J. Sci. Tech. Res. 13, 10274–10277. doi: 10.26717/BJSTR.2019.13.002467
Bailey, T. L., Johnson, J., Grant, C. E., and Noble, W. S. (2015). The MEME suite. Nucleic Acids Res. 43, W39–W49. doi: 10.1093/nar/gkv416
Benfey, P. N., and Weigel, D. (2001). Transcriptional networks controlling plant development. Plant Physiol. 125, 109–111. doi: 10.1104/pp.125.1.109
Bian, Z. H., Yang, Q. C., and Liu, W. K. (2015). Effects of light quality on the accumulation of phytochemicals in vegetables produced in controlled environments: a review. J. Sci. Food Agric. 95, 869–877. doi: 10.1002/jsfa.6789
Boyer, J., and Liu, R. H. (2004). Apple phytochemicals and their health benefits. Nutr. J. 3, 1–15. doi: 10.1186/1475-2891-3-5
Cao, Y., Han, Y., Meng, D., Abdullah, M., Yu, J., Li, D., et al. (2018). Expansion and evolutionary patterns of GDSL-type esterases/lipases in Rosaceae genomes. Funct. Integr. Genomics 18, 673–684. doi: 10.1007/s10142-018-0620-1
Carreño, J., Martínez, A., Almela, L., and Fernández-López, J. (1995). Proposal of an index for the objective evaluation of the colour of red table grapes. Food Res. Int. 28, 373–377. doi: 10.1016/0963-9969(95)00008-A
Carroll, S. B. (2005). Evolution at two levels: on genes and form. PLoS Biol. 3:e245. doi: 10.1371/journal.pbio.0030245
Chen, C., Chen, H., Zhang, Y., Thomas, H. R., Frank, M. H., He, Y., et al. (2020). TBtools: an integrative toolkit developed for interactive analyses of big biological data. Mol. Plant 13, 1194–1202. doi: 10.1016/j.molp.2020.06.009
Chen, W., Si, G. Y., Zhao, G., Abdullah, M., Guo, N., Li, D. H., et al. (2018). Genomic comparison of the P-ATPase gene family in four cotton species and their expression patterns in Gossypium hirsutum. Molecules 23:1092. doi: 10.3390/molecules23051092
Cheng, X., Li, M., Abdullah, M., Li, G., Zhang, J., Manzoor, M. A., et al. (2019). In silico genome-wide analysis of the pear (Pyrus bretschneideri) KNOX family and the functional characterization of PbKNOX1, an arabidopsis Brevipedicellus orthologue gene, involved in cell wall and lignin biosynthesis. Front. Genet. 10:632. doi: 10.3389/fgene.2019.00632
Chun, Y., Fang, J., Zafar, S. A., Shang, J., Zhao, J., Yuan, S., et al. (2020). MINI SEED 2 (MIS2) encodes a receptor-like kinase that controls grain size and shape in rice. Rice 13:7. doi: 10.1186/s12284-020-0368-9
Conn, S., Curtin, C., Bézier, A., Franco, C., and Zhang, W. (2008). Purification, molecular cloning, and characterization of glutathione S-transferases (GSTs) from pigmented Vitis vinifera L. cell suspension cultures as putative anthocyanin transport proteins. J. Exp. Bot. 59, 3621–3634. doi: 10.1093/jxb/ern217
Csiszár, J., Horváth, E., Váry, Z., Gallé, Á, Bela, K., Brunner, S., et al. (2014). Glutathione transferase supergene family in tomato: salt stress-regulated expression of representative genes from distinct GST classes in plants primed with salicylic acid. Plant Physiol. Biochem. 78, 15–26. doi: 10.1016/j.plaphy.2014.02.010
Daccord, N., Celton, J. M., Linsmith, G., Becker, C., Choisne, N., Schijlen, E., et al. (2017). High-quality de novo assembly of the apple genome and methylome dynamics of early fruit development. Nat. Genet. 49, 1099–1106. doi: 10.1038/ng.3886
Ding, N., Wang, A., Zhang, X., Wu, Y., Wang, R., Cui, H., et al. (2017). Identification and analysis of glutathione S-transferase gene family in sweet potato reveal divergent GST-mediated networks in aboveground and underground tissues in response to abiotic stresses. BMC Plant Biol. 17:225. doi: 10.1186/s12870-017-1179-z
Dixon, D. P., Skipsey, M., and Edwards, R. (2010). Roles for glutathione transferases in plant secondary metabolism. Phytochemistry 71, 338–350. doi: 10.1016/j.phytochem.2009.12.012
Dong, Y., Li, C., Zhang, Y., He, Q., Daud, M. K., Chen, J., et al. (2016). Glutathione S-transferase gene family in Gossypium raimondii and G. arboreum: comparative genomic study and their expression under salt stress. Front. Plant Sci. 7:139. doi: 10.3389/fpls.2016.00139
Dönnes, P., and Höglund, A. (2004). Predicting protein subcellular localization: past, present, and future. Genomics Proteomics Bioinformatics 2, 209–215. doi: 10.1016/s1672-0229(04)02027-3
Edwards, R., Dixon, D. P., and Walbot, V. (2000). Plant glutathione S-transferases: enzymes with multiple functions in sickness and in health. Trends Plant Sci. 5, 193–198. doi: 10.1016/s1360-1385(00)01601-0
Fang, X., An, Y., Zheng, J., Shangguan, L., and Wang, L. (2020). Genome-wide identification and comparative analysis of GST gene family in apple (Malus domestica) and their expressions under ALA treatment. 3 Biotech 10, 1–16. doi: 10.1007/s13205-020-02299-x
Fernández-Ruiz, V., Morales, P., Ruiz-Rodríguez, B. M., and TorijaIsasa, E. (2017). “Nutrients and bioactive compounds in wild fruits through different continents,” in Wild Plants, Mushrooms and Nuts: Functional Food Properties and Applications, pp. 263–314.
Finn, R. D. (2006). Pfam: clans, web tools and services. Nucleic Acids Res. 34, D247–D251. doi: 10.1093/nar/gkj149
Frear, D., and Swanson, H. (1970). Biosynthesis of S-(4-ethylamino-6-isopropylamino-2-s-triazino) glutathione: partial purification and properties of a glutathione S-transferase from corn. Phytochemistry 9, 2123–2132. doi: 10.1016/S0031-9422(00)85377-7
Freeling, M. (2009). Bias in plant gene content following different sorts of duplication: tandem, whole-genome, segmental, or by transposition. Annu. Rev. Plant Biol. 60, 433–453. doi: 10.1146/annurev.arplant.043008.092122
Galuszka, P., Frébortová, J., Luhová, L., Bilyeu, K. D., English, J. T., and Frébort, I. (2005). Tissue localization of cytokinin dehydrogenase in maize: possible involvement of quinone species generated from plant phenolics by other enzymatic systems in the catalytic reaction. Plant Cell Physiol. 46, 716–728. doi: 10.1093/pcp/pci074
Gao, J., Chen, B., Lin, H., Liu, Y., Wei, Y., Chen, F., et al. (2020). Identification and characterization of the glutathione S-transferase (GST) family in radish reveals a likely role in anthocyanin biosynthesis and heavy metal stress tolerance. Gene 743:144484. doi: 10.1016/j.gene.2020.144484
Geer, L. Y., Domrachev, M., Lipman, D. J., and Bryant, S. H. (2002). CDART: protein homology by domain architecture. Genome Res. 12, 1619–1623. doi: 10.1101/gr.278202
Giliberto, L., Perrotta, G., Pallara, P., Weller, J. L., Fraser, P. D., Bramley, P. M., et al. (2005). Manipulation of the blue light photoreceptor cryptochrome 2 in tomato affects vegetative development, flowering time, and fruit antioxidant content. Plant Physiol. 137, 199–208. doi: 10.1104/pp.104.051987
Gomez, C., Conejero, G., Torregrosa, L., Cheynier, V., Terrier, N., and Ageorges, A. (2011). In vivo grapevine anthocyanin transport involves vesicle-mediated trafficking and the contribution of anthoMATE transporters and GST. Plant J. 67, 960–970. doi: 10.1111/j.1365-313X.2011.04648.x
Gorlova, O., Fedorov, A., Logothetis, C., Amos, C., and Gorlov, I. (2014). Genes with a large intronic burden show greater evolutionary conservation on the protein level. BMC Evol. Biol. 14:50. doi: 10.1186/1471-2148-14-50
Goto, E. (2012). “Plant production in a closed plant factory with artificial lighting,” in Proceedings of the 7th International Symposium on Light in Horticultural Systems, Vol. 956, 37–49. doi: 10.17660/ActaHortic.2012.956.2
Gu, K.-D., Wang, C.-K., Hu, D.-G., and Hao, Y.-J. (2019). How do anthocyanins paint our horticultural products? Sci. Hortic. 249, 257–262. doi: 10.1016/j.scienta.2019.01.034
He, Q., Jones, D. C., Li, W., Xie, F., Ma, J., Sun, R., et al. (2016). Genome-wide identification of R2R3-MYB genes and expression analyses during abiotic stress in Gossypium raimondii. Sci. Rep. 6, 1–14. doi: 10.1038/srep22980
Hogewoning, S. W., Trouwborst, G., Maljaars, H., Poorter, H., Van Ieperen, W., and Harbinson, J. (2010). Blue light dose–responses of leaf photosynthesis, morphology, and chemical composition of Cucumis sativus grown under different combinations of red and blue light. J. Exp. Bot. 61, 3107–3117. doi: 10.1093/jxb/erq132
Horton, P., Park, K. J., Obayashi, T., Fujita, N., Harada, H., Adams-Collier, C. J., et al. (2007). WoLF PSORT: protein localization predictor. Nucleic Acids Res. 35, 585–587. doi: 10.1093/nar/gkm259
Hu, B., Jin, J., Guo, A.-Y., Zhang, H., and Luo, J. (2015). Genome analysis GSDS 2.0 : an upgraded gene feature visualization server. Bioinformatics 31, 1296–1297. doi: 10.1093/bioinformatics/btu817
Hu, B., Zhao, J., Lai, B., Qin, Y., Wang, H., and Hu, G. (2016). LcGST4 is an anthocyanin-related glutathione S-transferase gene in Litchi chinensis Sonn. Plant Cell Rep. 35, 831–843. doi: 10.1007/s00299-015-1924-4
Islam, M. S., Choudhury, M., Majlish, A.-N. K., Islam, T., and Ghosh, A. (2018). Comprehensive genome-wide analysis of glutathione S-transferase gene family in potato (Solanum tuberosum L.) and their expression profiling in various anatomical tissues and perturbation conditions. Gene 639, 149–162. doi: 10.1016/j.gene.2017.10.007
Islam, S., Rahman, I. A., Islam, T., and Ghosh, A. (2017). Genome-wide identification and expression analysis of glutathione S-transferase gene family in tomato: gaining an insight to their physiological and stress-specific roles. PLoS One 12:e0187504. doi: 10.1371/journal.pone.0187504
Islam, S., Sajib, S. D., Jui, Z. S., Arabia, S., Islam, T., and Ghosh, A. (2019). Genome-wide identification of glutathione S-transferase gene family in pepper, its classification, and expression profiling under different anatomical and environmental conditions. Sci. Rep. 9:9101. doi: 10.1038/s41598-019-45320-x
Jackson, D., Roberts, K., and Martin, C. (1992). Temporal and spatial control of expression of anthocyanin biosynthetic genes in developing flowers of Antirrhinum majus. Plant J. 2, 425–434. doi: 10.1111/j.1365-313X.1992.00425.x
Jain, M., Ghanashyam, C., and Bhattacharjee, A. (2010). Comprehensive expression analysis suggests overlapping and specific roles of rice glutathione S-transferase genes during development and stress responses. BMC Genomics 11:73. doi: 10.1186/1471-2164-11-73
Jha, B., Sharma, A., and Mishra, A. (2011). Expression of SbGSTU (tau class glutathione S-transferase) gene isolated from Salicornia brachiata in tobacco for salt tolerance. Mol. Biol. Rep. 38, 4823–4832. doi: 10.1007/s11033-010-0625-x
Jiang, S., Chen, M., He, N., Chen, X., Wang, N., Sun, Q., et al. (2019). MdGSTF6, activated by MdMYB1, plays an essential role in anthocyanin accumulation in apple. Hortic. Res. 6:40. doi: 10.1038/s41438-019-0118-6
Jo, B.-S., and Choi, S. S. (2015). Introns: the functional benefits of introns in genomes. Genomics Inform. 13:112. doi: 10.5808/GI.2015.13.4.112
Jung, S., Ficklin, S. P., Lee, T., Cheng, C.-H., Blenda, A., Zheng, P., et al. (2014). The genome database for Rosaceae (GDR): year 10 update. Nucleic Acids Res. 42, D1237–D1244. doi: 10.1093/nar/gkt1012
Kadomura-Ishikawa, Y., Miyawaki, K., Noji, S., and Takahashi, A. (2013). Phototropin 2 is involved in blue light-induced anthocyanin accumulation in Fragaria x ananassa fruits. J. Plant Res. 126, 847–857. doi: 10.1007/s10265-013-0582-2
Kayum, A., Nath, U. K., Park, J.-I., Biswas, M. K., Choi, E. K., Song, J.-Y., et al. (2018). Genome-wide identification, characterization, and expression profiling of glutathione S-transferase (GST) family in pumpkin reveals likely role in cold-stress tolerance. Genes 9:84. doi: 10.3390/genes9020084
Kim, H.-H., Wheeler, R. M., Sager, J. C., Yorio, N. C., and Goins, G. D. (2005). Light-emitting diodes as an illumination source for plants: a review of research at Kennedy space center. Habitation 10, 71–78. doi: 10.3727/154296605774791232
Kim, S.-H., Lee, J.-R., Hong, S.-T., Yoo, Y.-K., An, G., and Kim, S.-R. (2003). Molecular cloning and analysis of anthocyanin biosynthesis genes preferentially expressed in apple skin. Plant Sci. 165, 403–413. doi: 10.1016/S0168-9452(03)00201-2
Kitamura, S., Akita, Y., Ishizaka, H., Narumi, I., and Tanaka, A. (2012). Molecular characterization of an anthocyanin-related glutathione S-transferase gene in cyclamen. J. Plant Physiol. 169, 636–642. doi: 10.1016/j.jplph.2011.12.011
Kitamura, S., Matsuda, F., Tohge, T., Yonekura-Sakakibara, K., Yamazaki, M., Saito, K., et al. (2010). Metabolic profiling and cytological analysis of proanthocyanidins in immature seeds of Arabidopsis thaliana flavonoid accumulation mutants. Plant J. 62, 549–559. doi: 10.1111/j.1365-313X.2010.04174.x
Kitamura, S., Shikazono, N., and Tanaka, A. (2004). TRANSPARENT TESTA 19 is involved in the accumulation of both anthocyanins and proanthocyanidins in Arabidopsis. Plant J. 37, 104–114. doi: 10.1046/j.1365-313x.2003.01943.x
Kondo, S., Tomiyama, H., Rodyoung, A., Okawa, K., Ohara, H., Sugaya, S., et al. (2014). Abscisic acid metabolism and anthocyanin synthesis in grape skin are affected by light emitting diode (LED) irradiation at night. J. Plant Physiol. 171, 823–829. doi: 10.1016/j.jplph.2014.01.001
Kondrashov, F. A. (2012). Gene duplication as a mechanism of genomic adaptation to a changing environment. Proc. R. Soc. B Biol. Sci. 279, 5048–5057. doi: 10.1098/rspb.2012.1108
Kopsell, D. A., and Kopsell, D. E. (2008). Genetic and environmental factors affecting plant lutein/zeaxanthin. Agro Food Ind. Hitech. 19, 44–46.
Lan, T., Yang, Z.-L., Yang, X., Liu, Y.-J., Wang, X.-R., and Zeng, Q.-Y. (2009). Extensive functional diversification of the Populus glutathione S-transferase supergene family. Plant Cell 21, 3749–3766. doi: 10.1105/tpc.109.070219
Lee, T. H., Tang, H., Wang, X., and Paterson, A. H. (2013). PGDD: a database of gene and genome duplication in plants. Nucleic Acids Res. 41, 1152–1158. doi: 10.1093/nar/gks1104
Lescot, M. (2002). PlantCARE, a database of plant cis-acting regulatory elements and a portal to tools for in silico analysis of promoter sequences. Nucleic Acids Res. 30, 325–327. doi: 10.1093/nar/30.1.325
Letunic, I., and Bork, P. (2019). Interactive Tree Of Life (iTOL) v4: recent updates and new developments. Nucleic Acids Res. 47, W256–W259. doi: 10.1093/nar/gkz239
Letunic, I., Doerks, T., and Bork, P. (2012). SMART 7: recent updates to the protein domain annotation resource. Nucleic Acids Res. 40, D302–D305. doi: 10.1093/nar/gkr931
Li, G., Liu, X., Liang, Y., Zhang, Y., Cheng, X., and Cai, Y. (2020). Genome-wide characterization of the cellulose synthase gene superfamily in Pyrus bretschneideri and reveal its potential role in stone cell formation. Funct. Integr. Genomics 20, 723–738. doi: 10.1007/s10142-020-00747-8
Li, Y.-Y., Mao, K., Zhao, C., Zhao, X.-Y., Zhang, H.-L., Shu, H.-R., et al. (2012). MdCOP1 ubiquitin E3 ligases interact with MdMYB1 to regulate light-induced anthocyanin biosynthesis and red fruit coloration in apple. Plant Physiol. 160, 1011–1022. doi: 10.1104/pp.112.199703
Licciardello, C., D’agostino, N., Traini, A., Recupero, G. R., Frusciante, L., and Chiusano, M. L. (2014). Characterization of the glutathione S-transferase gene family through ESTs and expression analyses within common and pigmented cultivars of Citrus sinensis (L.) Osbeck. BMC Plant Biol. 14:39. doi: 10.1186/1471-2229-14-39
Lin, Y., Zhang, L., Zhang, J., Zhang, Y., Wang, Y., Chen, Q., et al. (2020). Identification of anthocyanins-related glutathione S-transferase (GST) genes in the genome of cultivated strawberry (Fragaria× ananassa). Int. J. Mol. Sci. 21:8708. doi: 10.3390/ijms21228708
Liu, Y., Qi, Y., Zhang, A., Wu, H., Liu, Z., and Ren, X. (2019). Molecular cloning and functional characterization of AcGST1, an anthocyanin-related glutathione S-transferase gene in kiwifruit (Actinidia chinensis). Plant Mol. Biol. 100, 451–465. doi: 10.1007/s11103-019-00870-6
Livak, K. J., and Schmittgen, T. D. (2001). Analysis of relative gene expression data using real-time quantitative PCR and the 2– ΔΔCT method. Methods 25, 402–408. doi: 10.1006/meth.2001.1262
Long, M., and Deutsch, M. (1999). Association of intron phases with conservation at splice site sequences and evolution of spliceosomal introns. Mol. Biol. Evol. 16, 1528–1534. doi: 10.1093/oxfordjournals.molbev.a026065
Loyall, L., Uchida, K., Braun, S., Furuya, M., and Frohnmeyer, H. (2000). Glutathione and a UV light–induced glutathione S-transferase are involved in signaling to chalcone synthase in cell cultures. Plant Cell 12, 1939–1950. doi: 10.1105/tpc.12.10.1939
Luo, H., Dai, C., Li, Y., Feng, J., Liu, Z., and Kang, C. (2018). Reduced anthocyanins in petioles codes for a GST anthocyanin transporter that is essential for the foliage and fruit coloration in strawberry. J. Exp. Bot. 69, 2595–2608. doi: 10.1093/jxb/ery096
Maars, K., Alfenito, M., Lloyd, A., and Walbot, V. (1995). A glutathione S transferase involved in vacuolar transfer encoded by the maize gene Bronw2. Nature 375, 397–400. doi: 10.1038/375397a0
Manzoor, M. A., Li, G., Abdullah, M., Han, W., Wenlong, H., Yang, Z., et al. (2021a). Genome-wide investigation and comparative analysis of MATE gene family in Rosaceae species and their regulatory role in abiotic stress responses in Chinese pear (Pyrus bretschneideri). Physiol. Plant. 173, 1163–1178.
Manzoor, M. A., Li, G., Abdullah, M., Han, W., Wenlong, H., Yang, Z., et al. (2021b). Genome-wide investigation and comparative analysis of MATE gene family in Rosaceae species and their regulatory role in abiotic stress responses in Chinese pear (Pyrus bretschneideri). Physiol. Plant. 173, 1163–1178. doi: 10.1111/ppl.13511
Manzoor, M. A., Manzoor, M. M., Li, G., Abdullah, M., Han, W., Wenlong, H., et al. (2021c). Genome-wide identification and characterization of bZIP transcription factors and their expression profile under abiotic stresses in Chinese pear (Pyrus bretschneideri). BMC Plant Biol. 21:413. doi: 10.1186/s12870-021-03191-3
Manzoor, M. A., Sabir, I. A., Shah, I. H., Wang, H., Yu, Z., Rasool, F., et al. (2021d). Comprehensive comparative analysis of the GATA transcription factors in four Rosaceae species and phytohormonal response in Chinese Pear (Pyrus bretschneideri) fruit. Int. J. Mol. Sci. 22:12492. doi: 10.3390/ijms222212492
McGonigle, B., Keeler, S. J., Lau, S.-M. C., Koeppe, M. K., and O’keefe, D. P. (2000). A genomics approach to the comprehensive analysis of the glutathione S-transferase gene family in soybean and maize. Plant Physiol. 124, 1105–1120. doi: 10.1104/pp.124.3.1105
Mueller, L. A., Goodman, C. D., Silady, R. A., and Walbot, V. (2000). AN9, a petunia glutathione S-transferase required for anthocyanin sequestration, is a flavonoid-binding protein. Plant Physiol. 123, 1561–1570. doi: 10.1104/pp.123.4.1561
Mustafin, R., and Khusnutdinova, E. (2015). The role of introns in evolution. Uspekhi Fziologicheskikh Nauk 46, 93–104.
Narusaka, Y., Nakashima, K., Shinwari, Z. K., Sakuma, Y., Furihata, T., Abe, H., et al. (2003). Interaction between two cis-acting elements, ABRE and DRE, in ABA-dependent expression of Arabidopsis rd29A gene in response to dehydration and high-salinity stresses. Plant J. 34, 137–148. doi: 10.1046/j.1365-313x.2003.01708.x
Nianiou-Obeidat, I., Madesis, P., Kissoudis, C., Voulgari, G., Chronopoulou, E., Tsaftaris, A., et al. (2017). Plant glutathione transferase-mediated stress tolerance: functions and biotechnological applications. Plant Cell Rep. 36, 791–805. doi: 10.1007/s00299-017-2139-7
Ohashi-Kaneko, K., Takase, M., Kon, N., Fujiwara, K., and Kurata, K. (2007). Effect of light quality on growth and vegetable quality in leaf lettuce, spinach and komatsuna. Environ. Control Biol. 45, 189–198. doi: 10.2525/ecb.45.189
Pérez-Díaz, R., Madrid-Espinoza, J., Salinas-Cornejo, J., González-Villanueva, E., and Ruiz-Lara, S. (2016). Differential roles for VviGST1, VviGST3, and VviGST4 in proanthocyanidin and anthocyanin transport in Vitis vinifera. Front. Plant Sci. 7:1166. doi: 10.3389/fpls.2016.01166
Pérez-Rodríguez, P., Riano-Pachon, D. M., Corrêa, L. G. G., Rensing, S. A., Kersten, B., and Mueller-Roeber, B. (2010). PlnTFDB: updated content and new features of the plant transcription factor database. Nucleic Acids Res. 38, D822–D827. doi: 10.1093/nar/gkp805
Qian, H., Liu, T., Deng, M., Miao, H., Cai, C., Shen, W., et al. (2016). Effects of light quality on main health-promoting compounds and antioxidant capacity of Chinese kale sprouts. Food Chem. 196, 1232–1238. doi: 10.1016/j.foodchem.2015.10.055
Qiao, X., Li, M., Li, L., Yin, H., Wu, J., and Zhang, S. (2015). Genome-wide identification and comparative analysis of the heat shock transcription factor family in Chinese white pear (Pyrus bretschneideri) and five other Rosaceae species. BMC Plant Biol. 15:12. doi: 10.1186/s12870-014-0401-5
Qiao, X., Li, Q., Yin, H., Qi, K., Li, L., Wang, R., et al. (2019). Gene duplication and evolution in recurring polyploidization–diploidization cycles in plants. Genome Biol. 20, 1–23. doi: 10.1186/s13059-019-1650-2
Qiao, X., Yin, H., Li, L., Wang, R., Wu, J., Wu, J., et al. (2018). Different modes of gene duplication show divergent evolutionary patterns and contribute differently to the expansion of gene families involved in important fruit traits in pear (Pyrus bretschneideri). Front. Plant Sci. 9:161. doi: 10.3389/fpls.2018.00161
Qiu, P. (2003). Recent advances in computational promoter analysis in understanding the transcriptional regulatory network. Biochem. Biophys. Res. Commun. 309, 495–501. doi: 10.1016/j.bbrc.2003.08.052
Qu, L.-J., and Zhu, Y.-X. (2006). Transcription factor families in Arabidopsis: major progress and outstanding issues for future research. Curr. Opin. Plant Biol. 9, 544–549. doi: 10.1016/j.pbi.2006.07.005
Rensing, S. A. (2014). Gene duplication as a driver of plant morphogenetic evolution. Curr. Opin. Plant Biol. 17, 43–48. doi: 10.1016/j.pbi.2013.11.002
Riaz, M. W., Lu, J., Shah, L., Yang, L., Chen, C., Mei, X. D., et al. (2021). Expansion and molecular characterization of AP2/ERF gene family in wheat (Triticum aestivum L.). Front. Genet. 12:632155. doi: 10.3389/fgene.2021.632155
Sabir, I. A., Manzoor, M. A., Shah, I. H., Liu, X., Zahid, M. S., Jiu, S., et al. (2022). MYB transcription factor family in sweet cherry (Prunus avium L.): genome-wide investigation, evolution, structure, characterization and expression patterns. BMC Plant Biol. 22:2. doi: 10.1186/s12870-021-03374-y
Sappl, P. G., Carroll, A. J., Clifton, R., Lister, R., Whelan, J., Harvey Millar, A., et al. (2009). The Arabidopsis glutathione transferase gene family displays complex stress regulation and co-silencing multiple genes results in altered metabolic sensitivity to oxidative stress. Plant J. 58, 53–68. doi: 10.1111/j.1365-313X.2008.03761.x
Sarma, A. D., and Sharma, R. (1999). Anthocyanin-DNA copigmentation complex: mutual protection against oxidative damage. Phytochemistry 52, 1313–1318. doi: 10.1016/S0031-9422(99)00427-6
Seigler, D. (1998). Plants With Saponins and Cardiac Glycosides. Plant Secondary Metabolism. Dordrecht: Kluwer Academic Publishers. doi: 10.1007/978-1-4615-4913-0_24
Sheehan, D., Meade, G., Foley, V. M., and Dowd, C. A. (2001). Structure, function and evolution of glutathione transferases: implications for classification of non-mammalian members of an ancient enzyme superfamily. Biochem. J. 360, 1–16. doi: 10.1042/0264-6021:3600001
Shirasawa, K., Isuzugawa, K., Ikenaga, M., Saito, Y., Yamamoto, T., Hirakawa, H., et al. (2017). The genome sequence of sweet cherry (Prunus avium) for use in genomics-assisted breeding. DNA Res. 24, 499–508. doi: 10.1093/dnares/dsx020
Si, W., Hang, T., Guo, M., Chen, Z., Liang, Q., Gu, L., et al. (2019). Whole-genome and transposed duplication contributes to the expansion and diversification of TLC genes in maize. Int. J. Mol. Sci. 20:5484. doi: 10.3390/ijms20215484
Sneddon, T. P., Li, P., and Edmunds, S. C. (2012). GigaDB: announcing the GigaScience database. Gigascience 1:11. doi: 10.1186/2047-217X-1-11
Steyn, W. J., Wand, S., Holcroft, D., and Jacobs, G. (2002). Anthocyanins in vegetative tissues: a proposed unified function in photoprotection. N. Phytol. 155, 349–361. doi: 10.1046/j.1469-8137.2002.00482.x
Sun, Y., Li, H., and Huang, J.-R. (2012). Arabidopsis TT19 functions as a carrier to transport anthocyanin from the cytosol to tonoplasts. Mol. Plant 5, 387–400. doi: 10.1093/mp/ssr110
Tamura, K., Peterson, D., Peterson, N., Stecher, G., Nei, M., and Kumar, S. (2011). MEGA5: molecular evolutionary genetics analysis using maximum likelihood, evolutionary distance, and maximum parsimony methods. Mol. Biol. Evol. 28, 2731–2739. doi: 10.1093/molbev/msr121
Thom, R., Cummins, I., Dixon, D. P., Edwards, R., Cole, D. J., and Lapthorn, A. J. (2002). Structure of a tau class glutathione S-transferase from wheat active in herbicide detoxification. Biochemistry 41, 7008–7020. doi: 10.1021/bi015964x
Thompson, J. D., Gibson, T. J., Plewniak, F., Jeanmougin, F., and Higgins, D. G. (1997). The CLUSTAL_X windows interface: flexible strategies for multiple sequence alignment aided by quality analysis tools. Nucleic Acids Res. 25, 4876–4882. doi: 10.1093/nar/25.24.4876
Vaish, S., Awasthi, P., Tiwari, S., Tiwari, S. K., Gupta, D., and Basantani, M. K. (2018). In silico genome-wide identification and characterization of the glutathione S-transferase gene family in Vigna radiata. Genome 61, 311–322. doi: 10.1139/gen-2017-0192
Verde, I., Abbott, A. G., Scalabrin, S., Jung, S., Shu, S., Marroni, F., et al. (2013). The high-quality draft genome of peach (Prunus persica) identifies unique patterns of genetic diversity, domestication and genome evolution. Nat. Genet. 45, 487–494. doi: 10.1038/ng.2586
Vogt, T., Pollak, P., Tarlyn, N., and Taylor, L. P. (1994). Pollination-or wound-induced kaempferol accumulation in petunia stigmas enhances seed production. Plant Cell 6, 11–23. doi: 10.1105/tpc.6.1.11
Volokita, M., Rosilio-Brami, T., Rivkin, N., and Zik, M. (2011). Combining comparative sequence and genomic data to ascertain phylogenetic relationships and explore the evolution of the large gdSL-lipase family in land plants. Mol. Biol. Evol. 28, 551–565. doi: 10.1093/molbev/msq226
Wang, D., Zhang, Y., Zhang, Z., Zhu, J., and Yu, J. (2010). KaKs_calculator 2.0: a toolkit incorporating gamma-series methods and sliding window strategies. Genomics Proteomics Bioinformatics 8, 77–80. doi: 10.1016/S1672-0229(10)60008-3
Wang, H., Cao, G., and Prior, R. L. (1996). Total antioxidant capacity of fruits. J. Agric. Food Chem. 44, 701–705. doi: 10.1021/jf950579y
Wang, L., Qian, M., Wang, R., Wang, L., and Zhang, S. (2018). Characterization of the glutathione S-transferase (GST) gene family in Pyrus bretschneideri and their expression pattern upon superficial scald development. Plant Growth Regul. 86, 211–222. doi: 10.1007/s10725-018-0422-4
Wang, Y., Tang, H., Debarry, J. D., Tan, X., Li, J., Wang, X., et al. (2012). MCScanX: a toolkit for detection and evolutionary analysis of gene synteny and collinearity. Nucleic Acids Res. 40, 1–14. doi: 10.1093/nar/gkr1293
Winkel-Shirley, B. (2001). Flavonoid biosynthesis. A colorful model for genetics, biochemistry, cell biology, and biotechnology. Plant Physiol. 126, 485–493. doi: 10.1104/pp.126.2.485
Xiong, E., Zheng, C., Wu, X., and Wang, W. (2016). Protein subcellular location: the gap between prediction and experimentation. Plant Mol. Biol. Rep. 34, 52–61. doi: 10.1007/s11105-015-0898-2
Xu, G., Guo, C., Shan, H., and Kong, H. (2011). Divergence of duplicate genes in exon – intron structure. Proc. Natl. Acad. Sci. U.S.A. 109, 1187–1192. doi: 10.1073/pnas.1109047109
Xu, G., Guo, C., Shan, H., and Kong, H. (2012). Divergence of duplicate genes in exon–intron structure. Proc. Natl. Acad. Sci. U.S.A. 109, 1187–1192.
Yamagishi, M. (2016). A novel R2R3-MYB transcription factor regulates light-mediated floral and vegetative anthocyanin pigmentation patterns in Lilium regale. Mol. Breed. 36, 1–14. doi: 10.1007/s11032-015-0426-y
Youdim, K. A., Mcdonald, J., Kalt, W., and Joseph, J. A. (2002). Potential role of dietary flavonoids in reducing microvascular endothelium vulnerability to oxidative and inflammatory insults. J. Nutr. Biochem. 13, 282–288. doi: 10.1016/s0955-2863(01)00221-2
Zdobnov, E. M., and Apweiler, R. (2001). InterProScan – an integration platform for the signature-recognition methods in InterPro. Bioinformatics 17, 847–848. doi: 10.1093/bioinformatics/17.9.847
Zhang, W., Yan, H., Chen, W., Liu, J., Jiang, C., Jiang, H., et al. (2014). Genome-wide identification and characterization of maize expansin genes expressed in endosperm. Mol. Genet. Genomics 289, 1061–1074. doi: 10.1007/s00438-014-0867-8
Zhang, Y., Jiang, L., Li, Y., Chen, Q., Ye, Y., Zhang, Y., et al. (2018). Effect of red and blue light on anthocyanin accumulation and differential gene expression in strawberry (Fragaria× ananassa). Molecules 23:820. doi: 10.3390/molecules23040820
Zhao, J. (2015). Flavonoid transport mechanisms: how to go, and with whom. Trends Plant Sci. 20, 576–585. doi: 10.1016/j.tplants.2015.06.007
Zhao, Y., Dong, W., Zhu, Y., Allan, A. C., Lin-Wang, K., and Xu, C. (2020). PpGST1, an anthocyanin-related glutathione S-transferase gene, is essential for fruit coloration in peach. Plant Biotechnol. J. 18, 1284–1295. doi: 10.1111/pbi.13291
Zhao, Y.-W., Wang, C.-K., Huang, X.-Y., and Hu, D.-G. (2021). Genome-wide analysis of the glutathione S-transferase (GST) genes and functional identification of MdGSTU12 reveals the involvement in the regulation of anthocyanin accumulation in apple. Genes 12:1733. doi: 10.3390/genes12111733
Zhu, J.-H., Li, H.-L., Guo, D., Wang, Y., Dai, H.-F., Mei, W.-L., et al. (2016). Transcriptome-wide identification and expression analysis of glutathione S-transferase genes involved in flavonoids accumulation in Dracaena cambodiana. Plant Physiol. Biochem. 104, 304–311. doi: 10.1016/j.plaphy.2016.05.012
Keywords: Glutathione S-transferases, Prunus avium, phylogeny, expression analysis, anthocyanin
Citation: Sabir IA, Manzoor MA, Shah IH, Liu X, Jiu S, Wang J, Alam P, Abdullah M and Zhang C (2022) Identification and Comprehensive Genome-Wide Analysis of Glutathione S-Transferase Gene Family in Sweet Cherry (Prunus avium) and Their Expression Profiling Reveals a Likely Role in Anthocyanin Accumulation. Front. Plant Sci. 13:938800. doi: 10.3389/fpls.2022.938800
Received: 08 May 2022; Accepted: 16 June 2022;
Published: 12 July 2022.
Edited by:
Tanveer Alam Khan, Leibniz Institute of Plant Genetics and Crop Plant Research (IPK), GermanyReviewed by:
Sagheer Ahmad, Guangdong Academy of Agricultural Sciences, ChinaMuhammad Arif, Nankai University, China
Muhammad Ahsan Altaf, Hainan University, China
Copyright © 2022 Sabir, Manzoor, Shah, Liu, Jiu, Wang, Alam, Abdullah and Zhang. This is an open-access article distributed under the terms of the Creative Commons Attribution License (CC BY). The use, distribution or reproduction in other forums is permitted, provided the original author(s) and the copyright owner(s) are credited and that the original publication in this journal is cited, in accordance with accepted academic practice. No use, distribution or reproduction is permitted which does not comply with these terms.
*Correspondence: Caixi Zhang, acaizh@sjtu.edu.cn
†These authors have contributed equally to this work and share first authorship