
- 1 Centre of Behavioural and Cognitive Sciences, University of Allahabad, Allahabad, India
- 2 Department of Clinical Psychology, National Institute of Mental Health and Neurosciences, Bangalore, India
- 3 Department of Neurosurgery, National Institute of Mental Health and Neurosciences, Bangalore, India
- 4 Department of Biostatistics, National Institute of Mental Health and Neurosciences, Bangalore, India
We investigated age-related differences in neuropsychological performance in 400 Indian school children (5–15 years of age). Functions of motor speed, attention, executive functions, visuospatial functions, comprehension, learning, and memory were examined. Growth curve analysis was performed. Different growth models fitted different cognitive functions. Neuropsychological task performance improved slowly between 5 and 7 years, moderately between 8 and 12 years and slowly between 13 and 15 years of age. The overall growth patterns of neuropsychological functions in Indian children have been discussed with the findings reported on American children. The present work describes non-linear, heterogeneous, and protracted age trends of neuropsychological functions in Indian children and adolescents.
Introduction
The developmental stages of childhood and adolescence are characterized by both the development of the brain and cognitive processes. Brain development and cognitive maturation occur in parallel during childhood and adolescence (Casey et al., 2000). Cortical changes include myelination, dendritic pruning, changes in neuronal density, and connections (Munakata et al., 2004; Casey et al., 2005a). Cross-sectional studies have reported a developmental shift of brain activity from diffuse to focused (Durston et al., 2006). The cortex matures in a sequence that parallels cognitive development. Brain regions mediating motor and sensory functions mature first, followed by temporal and parietal areas (which primarily mediate language and spatial skills). Association areas (such as the prefrontal cortex and lateral temporal regions) mature last; these areas integrate information from sensory–motor regions and modulate processes like attention and working memory (Sowell et al., 2003; Gogtay et al., 2004).
Different developmental trajectories have been reported for different cognitive functions. Mature cognition is marked by the ability to filter out irrelevant information and actions and process the relevant information. This ability continues to develop throughout the first two decades of life (Casey et al., 2002). For example, working memory and cognitive control develop throughout late childhood and adolescence and continue to mature until young adulthood (Casey et al., 2005b). The age range of 6–9 years was found to be an active period for the development of cognitive control functions such as task switching, error monitoring, attentional disengagement, and response inhibition (Gupta and Kar, 2009). Tests of working memory have demonstrated three active stages of maturation: early childhood, middle childhood, and early adolescence (Brocki and Bohlin, 2004). Executive control improves during the age range of 4–7 and 8–10 years (Reuda et al., 2005).
Neuropsychological measures aim to study brain–behavior relationship and are sensitive to changes in brain organization. Child neuropsychological data provide evidence on the abnormal development of brain and behavior, though this evidence needs to be supported by normative data (Spreen et al., 1995). A few studies have examined the development of cognitive functions using neuropsychological tests (Korkman et al., 2001; Waber et al., 2007). Cross-sectional data based on neuropsychological assessment of participants aged 6–18 years in the US have suggested that there is a rapid and early maturation (6–10 years) of neuropsychological functions (such as fine motor dexterity, fluency, working memory, set shifting, and comprehension) and that this maturation slowly levels off by 10–12 years of age and neuropsychological performance shows a deceleration in late adolescence (Waber et al., 2007). Another study on American children employed NEPSY for assessment (a test which has been developed for children between 5 and 12 years of age) and reported that cognitive functions such as attention, fluency, working memory, and response inhibition develop rapidly between 5 and 8 years and at a more moderate rate between 9 and 12 years, with stronger age effects before 9 years (Korkman et al., 2001). However, no such data is available on Indian children. It should be noted that the interpretation of developmental patterns observed in different studies across populations might also be influenced by differences in the tests and the parameters employed to examine various neuropsychological domains in each of the respective studies.
Developmental trajectories of cognitive functions have mostly been studied with western population. Neuropsychological growth profiles of children across various domains have also been reported by a couple of studies in the west, but most of the studies have focused on specific cognitive functions and have not reported a generic growth trend across functions for a particular population. Neuropsychological growth profile has not been reported for Indian population. Data on developmental trajectories are important as they inform about developmental patterns of brain functions and have strong clinical implications in terms of early identification of cognitive dysfunction, treatment outcomes, cognitive rehabilitation, and spontaneous functional recovery in children.
The structures and processes of the mind develop primarily in response to unique experiential and socialization forces that are quite different in different cultures, particularly in widely separated cultures that have had little contact with each other (Tomasello, 2000). Children in India and US grow up in different environments with respect to the socialization process, schooling, and educational input, parental stimulation, and collective versus individualistic thought. Due to cross cultural variability and differences related to environment and schooling, the normative developmental patterns of brain functioning based on behavioral assessments carried out in the West may not directly explain the same for the Indian population. Developmental patterns may vary across populations due to various factors such as environmental stimulation, education system, and parenting styles, etc., which need to be taken into account with a much larger sample with adequate manipulations of each of these variables.
Western children seem to progress through development at a different pace than non-western children as observed in our study versus those done with US based children. As a product of the interaction of environment with nervous system the child acquires basic skills and knowledge of the culture and internalizes behavioral patterns from the particular social context. Children’s opportunities to acquire specific memory and cognitive skills from schooling and from their general experience in a particular environment affect cognitive development (Stevenson et al., 1978). Differences in performance have been observed with 2–3 years of schooling (Nisbett and Norenzayan, 2002). School environment in the west allows for greater exploration as compared to more structured environment from a very young age in non-western countries particularly in India. Cognitive development requires sensory stimulation, high variability in sensory experiences leads to high levels of cognitive development. School age years are sensitive to environmental influence including educational input. This is a period of acquisition of new skills such as reading, writing, calculation, attention, which makes schooling one of the important determinants of rapid brain and cognitive development and in turn gets influenced by the ongoing cognitive development. In study on Zambian children educational experience did not show a consistent influence in performance though the age groups tested were 9 and 11 years also taking a small sample of 20–25 children in each age group (Mulenga et al., 2001). However, environment and experiences could shape the nature of growth patterns of neuropsychological functions and may have selective effects on certain cognitive domains.
One of the longitudinal studies on African American children reported that the effect of environmental factors on cognitive development is selective and specific rather than a general effect (Farah et al., 2008). It is not simply that better environments predict better cognitive development. For example, memory development was found to be related to parental nurturance and not environmental stimulation whereas language development was related to environmental stimulation and not nurturance. However, we do not have a systematically collected longitudinal data for the causal influence of environmental stimulation on brain functions for the Indian population. We have addressed the factors such as nutritional status, behavior problems and education system and controlled for these variables in the current study. Studies in future need to systematically examine the effect environmental factors on neuro-cognitive development. In the current study we ensured a representative population to look at the growth patterns of neuro-cognitive functions.
In addition, most of the data on development of neuro-cognitive functions has been either on infants or old age individuals and much less on school-going children. Even though it is known that much of the cognitive development as well as the brain maturation occur postnatally. Both cross-sectional and longitudinal imaging studies on children and adolescents have reported that regions associated with sensory and motor processes mature first followed by association areas involved in top down control of thought and action (Casey et al., 2005b). School age is marked by rapid developmental changes particularly higher cognitive functions.
The current study examined age-related differences in neuropsychological performance and the overall growth patterns of neuropsychological domains and functions such as attention, motor speed, fluency, working memory, planning, visuospatial functions, learning, and memory, in normal children aged 5–15 years in a cross-sectional design. Previous studies on brain and cognitive development have also employed a cross-sectional design (Klinberg et al., 2002; Durston et al., 2004). We employed growth curve analysis to study the overall growth patterns of neuropsychological functions. Non-linear regression analysis was employed to further strengthen the findings with respect to neuro-cognitive performance as predicted by age in children and adolescents. A comprehensive neuropsychological assessment was conducted using the “NIMHANS neuropsychological battery for children” (Kar et al., 2004). Tests included in the battery were either originally developed for or standardized on children in the West. Data on growth patterns of neuropsychological functions served the additional purpose of developing normative data for the battery. The insights into the normative neuropsychological development would be useful to understand the nature of cognitive development and its relationship with brain development. Such normative data provide a point of reference for developmental and clinical studies.
The data on growth patterns of neuropsychological functions was derived based on neuropsychological test performance of children. We believe that neuro-cognitive functions would show a gradual developmental pattern with age rather than discrete transition points. We employed growth modeling to analyze the growth patterns of neuro-cognitive functions. Analysis of variance treats age as a discrete variable whereas growth curve modeling using non-linear regression analysis could be used to predict the effect of age as a continuous variable on neuro-cognitive task performance. Multivariate analysis was also performed to examine age-related differences. However, growth modeling was preferred as it allowed to examine all the age levels as predictors of neuro-cognitive performance by subjecting the data to non-linear regression analysis and not to limit the inquiry at differences between two discrete age levels. In such a case, regression analysis was taken as a suitable method to enhance the amount of information about the developmental trajectories of neuro-cognitive performance in children and adolescents.
We hypothesized that age-related differences would be observed across the wide age range of 5–15 years. We expected gradual and continuous developmental pattern across neuro-cognitive functions rather than discrete age effects as transition points in the age range of 5–15 years. It was hypothesized that primary sensorimotor functions like motor speed would show an early maturation but higher cognitive functions such as executive functions, visuospatial functions, learning, and memory may show age-related differences until 15 years of age. It was hypothesized that the growth patterns would be heterogeneous, showing different developmental patterns for different neuropsychological domains. It was also expected that the neuropsychological performance would not follow a linear trend of improvement with age. Growth curve analysis was most appropriate to test these hypotheses.
Materials and Methods
Participants
Four hundred normal school-going children in the age range of 5–15 years participated in the study. Children were taken from three schools, with English being the medium of instruction. All the schools were medium level schools as they were neither government schools nor elite schools but those which have children from all socio-economic strata. Children from the lower-middle, middle, and upper-middle socio-economic strata (as per the school records) attending these schools in Bangalore city participated in the study. Random sampling method was followed. Education system was similar across all the three schools. They were comparable with respect to learning environment, opportunities, exposure, and facilities. In each school, children at the appropriate age level were randomly selected for the study. Each age level consisted of 33–34 children, except the age levels of 14 and 15 years, with 50 children each. Children in each age level were taken from three schools with approximately equal number of boys and girls. Consent was first obtained from the school authorities and from the class teacher for each participant. Informed consent was also obtained from the parents of all the participants. Those children whose parents did not give consent to participate in the study, were not taken for the study.
Participants in each age level were matched with respect to age, gender, grade level, handedness, nutritional status, and intelligence. None of the children had a history of major physical or neurological problems. The children’s behavior questionnaire (CBQ) Form B (teacher report; Rutter, 1967) was employed to screen out children with behavior problems. Twenty-four children falling above the cut-off score of nine were excluded. All of the children were right handed (Edinburgh Handedness Inventory, Oldfield, 1971). Anthropometric assessment with the indices of height for age and weight for height was taken as a measure of nutritional status. It is well documented that nutrition affects brain and cognitive development (Kar et al., 2008). Four children who were 2 SD below the median as per the National Centre for Health and Statistics-standards of growth and development (World Health Organization, 1983) were excluded.
Intelligence was assessed using the Colored Progressive Matrices (Raven et al., 1998; 5–11 years) and the Standard Progressive Matrices (Raven et al., 2000; 12–15 years). All the participants were average or above average with respect to intellectual functions. The “NIMHANS neuropsychological battery for children” was administered. It is a psychometric instrument and has norms for each test at each age level. Participants were tested in school setting in a quiet room with adequate light. Developmental trajectories have been discussed with reference to the actual performance and not the norms. The test–retest reliability of all the tests falls in the range of 0.53–0.83. The tests were age appropriate and their construct validity was well established.
NIMHANS Neuropsychological Battery for Children
The neuropsychological battery consisted of the following tests:
Motor speed
1. The Finger Tapping Test (Reitan, 1970) is a measure of motor speed in which performance tends to be worse in the hand contralateral to a lesion (Bornstein, 1985). The test can distinguish patients with motor dysfunction of cortical–subcortical origin from normal performance (Shimoyama et al., 1990). In children, age has a stronger effect on this test than does education (Bornstein, 1985). The subject was asked to tap the mounting key on a finger tapping instrument as rapidly as possible using the index finger of the preferred hand. A comparable set of measurements was obtained with the non-preferred hand. Five trials were given for each hand, with each trial lasting for 10 s. The average number of taps for each hand comprised the score.
Attention
2. The Color Cancelation Test (Kapur, 1974) is a measure of visual scanning and sustained attention. This test has been used with normal children and those with attention deficit hyperactivity disorder. It is sensitive to behavioral deficits in sustained attention (Kapur, 1974). This test consists of 150 circles in red, blue, yellow, black, and gray. The participants were required to cancel only the yellow and red circles as fast as possible. The time taken to complete the test comprised the score.
3. The Color Trails Test (D’Elia et al., 1996) is a measure of focused attention. Children aged 5–16 years show a steady age-dependant progression on this test. It is sensitive to the effects of frontal damage (Williams et al., 1995). In the Color Trails Test 1, the participant was asked to serially connect the numbers 1–25 printed in two colors without regard to the color. In the Color Trails Test 2, the participants were required to connect the numbers serially from 1 to 25, alternating between pink and yellow circles and disregarding the numbers in circles of the alternate color. The time taken to complete each part comprised the score.
Executive functions
4. The Design Fluency Test (Jones-Gotman and Milner, 1977) is a measure of the ability to produce novel designs. Patients with right frontal damage have difficulty on this test (Jones-Gotman, 1991). Children show improvement in scores as their age increases. The participants were required to generate and draw as many abstract designs as possible in 5 min. They were given a novel output score and a perseverative score.
5. The Porteus Maze Test (Porteus, 1965) is a measure of planning and foresight (i.e., choosing, rejecting, and adopting alternative courses of conduct or thought). This test consisted of 12 mazes that increase in complexity across age levels. The participant was required to trace the maze from the starting point to the goal while following certain rules. The administration and scoring protocols given by Porteus were followed. Test age was calculated on the basis of the credits earned. The basal age was assumed to be 4 years on this test, as the present test battery starts from the 5-year age level. Two trails per year in terms of age were allowed on the 5 to 11-year mazes. At each of these mazes, success on the first trial got an addition of 1 year, while success in the second trial an addition of half year to the basal age of 4 years. Four trials were allowed per age on the 12 and 14-year mazes. If both tests for 12 and 14 year mazes are passed the number of trials given in each test were added together and additional credit was given.
6. The N back Test (verbal) is a measure of verbal working memory based on the concept proposed by Smith and Jonides (1995). Activation is observed in the posterior parietal cortex, the inferior frontal gyrus and the supplementary motor area in the left hemisphere during this task (Smith and Jonides, 1995). The test consists of a list of phonemes and two separate conditions, the 1 back, and the 2 back conditions. In the 1 back condition participants were required to say yes to consecutively similar phonemes being read out loud at the rate of one per second. The 2 back condition required the participants to say yes every time two similar phonemes were separated by a different phoneme. The number of correct responses in each condition comprised the score.
7. The N back task (visual) is a measure of visuospatial working memory, executive control, and the maintenance of spatial information. Activations in the middle frontal gyrus, the superior and inferior frontal gyrus, the superior and inferior parietal, and the anterior, and posterior cingulate have been reported on this task (Carlson et al., 1998). It consisted of 36 cards in each condition (1 back and 2 back). Each card had a dot in a specific location. In the 1 back task, the subject had to decide whether the location of the dot on the present card matched the location of the dot on the previous card. For the 2 back task, the subject had to decide whether the location of the dot on the present card matched the location of the dot on the card that was presented two cards before the present card. The number of correct responses in each part comprised the score.
Visuospatial functions
8. The Motor-Free Visual Perception test (Collarrusso and Hammill, 1972) is a measure of visuo-perceptual ability comprising visual discrimination, visual closure, figure-ground, perceptual matching, and visual memory. This test had 36 items that tested visual discrimination, visual closure, figure-ground, perceptual matching, and visual memory. The test consists of abstract shapes printed on top on a card with four response options in the form of shapes or features of shapes printed below for all except the visual memory items (for which the response options were presented on a separate sheet). The participants were required to point to one of the four alternatives, which he/she thought was the correct response. Examiner was required to score the response as correct or wrong (score of “1” for a correct response and “0” for a wrong response). The number of correct responses for all the 36 items comprised the score.
9. The Picture Completion Test (Malin, 1969) is from an adaptation of the Wechsler’s intelligence scale for Indian children. It is a measure of both visuo-conceptual ability and visual organization (Lezak, 1995). The test consisted of 20 cards with pictures of different objects with a missing feature. The participants were required to name or point out to the missing feature. The number of correct responses comprised the score.
10. The Block Design Test (Malin, 1969) is a measure of visuo-constructive ability. Block design has been found to be associated with increased glucose metabolism in the right posterior parietal region (Chase et al., 1984). This test consisted of 10 designs to be constructed using four to nine blocks in a specified time limit. Points were earned on the basis of time taken to complete each item, and the total number of points comprised the score.
Comprehension, learning, and memory
11. The Token Test (De Renzi and Vignolo, 1962) is a measure of verbal comprehension. Factor analytic validation indicates that it measures complex language abilities and comprehension (Spreen and Strauss, 1998). It is sensitive to language impairment (Ewing-Cobbs et al., 1987). The token test consisted of tokens in two shapes (circle and square), two sizes (large and small), and five colors (red, blue, yellow, green, and white). Thirty-six commands were read out loud, one by one. The subject had to follow the command by manipulating the tokens. One point was given for each correctly performed item. A correct response after one error earned a score of 0.5. Two errors were deemed as a failure.
12. Rey’s Auditory Verbal Learning test (RAVLT; Maj et al., 1993) is a measure of verbal learning and memory (with immediate and delayed recall). A deficit in delayed recall has been associated with left and bilateral temporal lobe epilepsy (Elger et al., 1997). Non-linear age effects on RAVLT have been reported during middle childhood (Vakil et al., 1998). This test consisted of a list of 15 words presented five times with an immediate recall after each of the five trials. A delayed recall was measured after a delay of 30 min filled with other non-verbal tests.
13. The Memory for Designs Test (Jones-Gotman, 1986) is a measure of visual learning and memory. The right temporal region has a role in the memory of visual patterns (Scoville and Milner, 1954). This test consisted of 18 abstract designs, each printed on a separate card. The number of designs presented varied with age. Five learning trials were given, followed by a delayed recall after an hour filled with verbal tests. The learning rate with respect to the number of correct designs on each trial and a delayed recall score were obtained.
Children were individually assessed in two to three sessions of 40 min each in a well-lit quiet room, with 5 min rests between sessions. The data included in this manuscript were obtained in compliance with the regulations of the Ethic Committee, National Institute of Mental Health and Neurosciences, Bangalore, India.
Results
Statistical Analysis
Descriptive statistics (such as the means and percentile scores) were calculated for each of the test scores across the 11 age levels (5–15 years). One-way analysis of variance was performed to analyze the differences in performance between boys and girls. Results indicated that, except for motor speed of the left hand (a test in which boys scored higher than girls), there were no statistically significant gender-related differences for any of the test scores. Gender differences were further analyzed using multivariate analysis to look at the interaction between gender and age and the effect of this interaction on neuropsychological performance. Analysis of variance was performed to analyze the differences in performance between boys and girls. Results indicated that, except for motor speed of the left hand (a test in which boys scored higher than girls) there were no statistically significant gender-related differences for any of the test scores. Gender differences were further analyzed using multivariate analysis to look at the interaction between gender and age and its effect on task performance. The age × gender interaction effect was not found to be significant and thus post hoc tests could not be performed. However, when age was taken as a covariate (effect of age was partialed out) results indicated significant main effects of gender for sustained attention, and visuo-constructive ability, in addition to motor speed (left hand). Since, gender was not found to modify the effect of age-related differences on neuropsychological performance; hence, gender was not treated separately for growth curve analysis and the scores of boys and girls in each age level were combined for further analysis.
ANOVA and Tukey HSD post hoc tests were computed for each test score to examine the effect of age on neuropsychological performance. A main effect of age was found to be significant for all the scores. The post hoc comparisons indicated varied patterns of differences among age levels (Table 1). The transition points of improvement across the 11 age levels differed across neuropsychological functions. Even though we could see the growth trend in mean scores we could not establish the differences in performance in different age groups. This was due to small differences noticed during the initial age groups or at asymptotes in the later age groups. The slow early or late growth masked the trends in the ANOVA results. In order to further examine the growth patterns and the nature of progression of scores we employed growth modeling and computed non-linear regression analysis to derive the predicted values on each task for each age level.
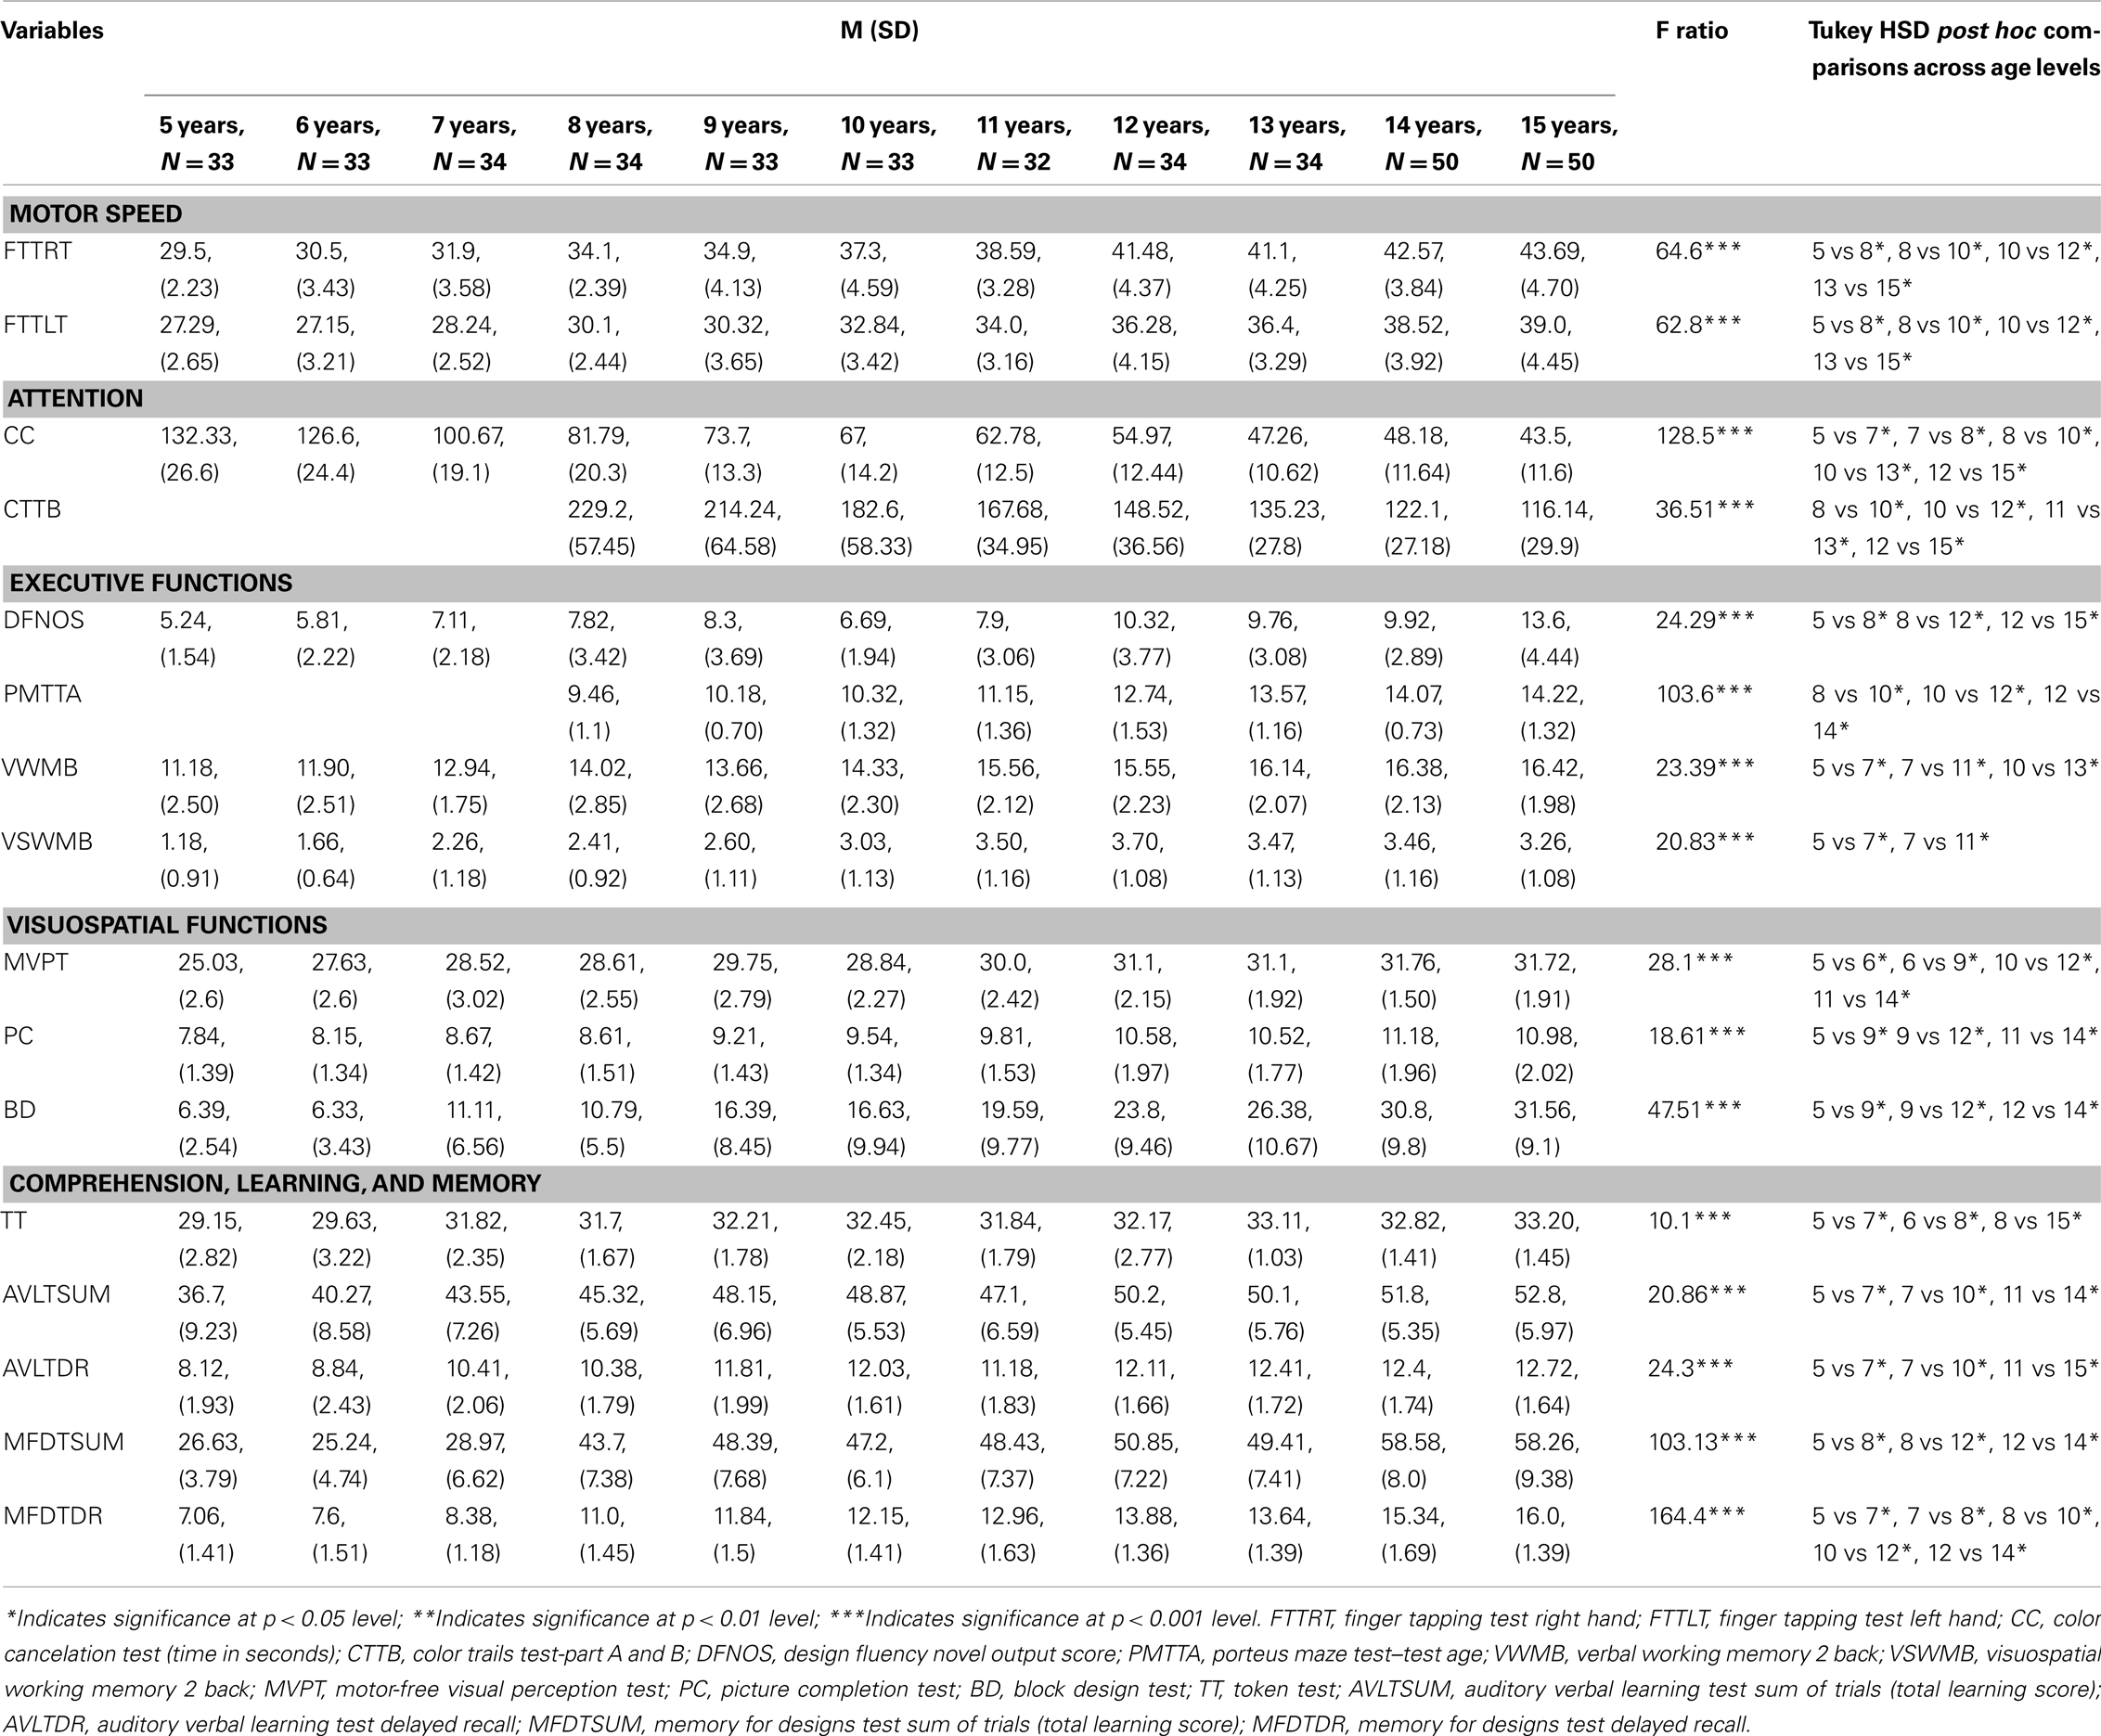
Table 1. Mean comparisons of neuropsychological test scores across the 11 age levels.
Growth curve analysis was carried out to study the growth trends of neuropsychological functions. Traditionally, growth curve analysis has been used to monitor individual development over time, and the parameter estimates resulting from the curve fitting procedure are used for comparisons between different groups of children. Growth curve analysis has been used with cross-sectional data (Crowder, 1989). It is most often used to analyze longitudinal records on individuals, but it can be applied to cross-sectional data (Zemel and Johnston, 1994; De Onis et al., 2001). When growth models are employed with cross-sectional data certain issues need to addressed, for example, adequate representation of the age range, sampling error, and sample size (Zemel and Johnston, 1994). We have taken care of these issues with adequate representation of age ranges with 11 age levels, efforts to minimize sampling error as much as possible and adequate sample size.
Each growth model has its unique property, such as asymptotic curve, decaying, exponential increase/decrease, etc. The rate of increase and decrease depends on estimated model parameters computed based on the empirical data. Percentile points were used to generate the growth curve.
The curve fitting process fits equations of approximating curves to the raw data in order to achieve minimum discrepancy with the observed data. A process of quantitatively estimating the trend of the outcomes, known as curve fitting, becomes necessary. Both linear and non-linear regression models were taken for curve fitting. Both follow the same idea (i.e., to relate a response to a vector of predictor variables). A non-linear estimation would estimate whether the dependent variable, the test scores in the present study, is a function of the independent variable (i.e., age). Whenever linear regression models are inadequate to represent the relationships between independent and dependent variables, non-linear regression models are appropriate (Katkowsky, 1990). Non-linear regression models have been applied to a variety of situations (such as the normal growth of infants, the growth of tumors and the effect of treatment on the growth of tumors (Kolkiewicz, 1998). In the current study we also assumed non-linear growth patterns of neuro-cognitive functions as brain and cognitive maturation may not follow a linear step by step developmental pattern. Curve estimation procedures have been used to examine the growth of cognitive functions between 4 and 11 years of age (Bornholt et al., 2004). Studies on the development of biological systems (such as height and tumors) have employed growth curve modeling. Growth curve analysis provides the advantage of estimating non-linear change. We assumed that there were non-linear patterns of change in neuropsychological performance with age, and growth curve analysis was best suited for this objective.
The goodness of fit of the linear and non-linear growth models to the observed data was computed. Non-linear regression models gave a better fit (R2 value ≥ 0.80) for all the scores than the linear regression models (R2 value ≤ 0.50). Models from four families of non-linear growth models (sigmoidal family: weibull and logistic models, exponential family: exponential fit and logarithmic fit models, growth family: exponential association and yield density family: reciprocal model) showed a better fit to the data from the neuropsychological tests. Therefore, only non-linear growth models were employed to study the growth trends of neuropsychological performance as a function of age. The weibull and logistic models follow an S-shaped pattern of change. That is, change is slow at the beginning but gradually accelerates and once a momentum is achieved, change becomes fast and remains until the end state. These growth curves begin with a slow growth, followed by a period of moderate growth, and then back to a period of slow growth. Weibull model has a three parameter growth function: (a) lower asymptote at the starting level; (b) upper asymptote at the mature level; and (c) point of inflection which is the point of maximum growth. This is interpreted as slow initial growth followed by rapid growth before it slows down toward the end point (Horgan, 1995; Horgan and Stubbs, 2003). On the contrary models from the exponential family presuppose that change will occur exponentially through time until it reaches a ceiling. The logarithmic fit model begins with a period of rapid increase, followed by a period where the growth slows down, but it continues to increase without bound. The main difference between logarithmic fit model and the exponential growth model is that the latter begins with a slow growth and then shows a rapid increase.
The curve coefficients were used to compute the goodness of fit of the model for the 50th percentile function. Table 2 presents the estimates of goodness of fit of the respective models for each of the test scores. The estimated model parameters were computed based on the empirical data. Selection of the model for each test score depended on the goodness of fit (represented by R2 value) of the model to the observed data. The predicted values for the 50th percentile function were derived for each observed score on each test across each age level using non-linear regression analysis. The predicted and the observed values for each test score at each age for the 50th percentile function were compared in terms of the degree of concordance. The model with the highest R2 value and with >80% of concordance with the observed data on the 50th percentile was employed to plot the age trends.
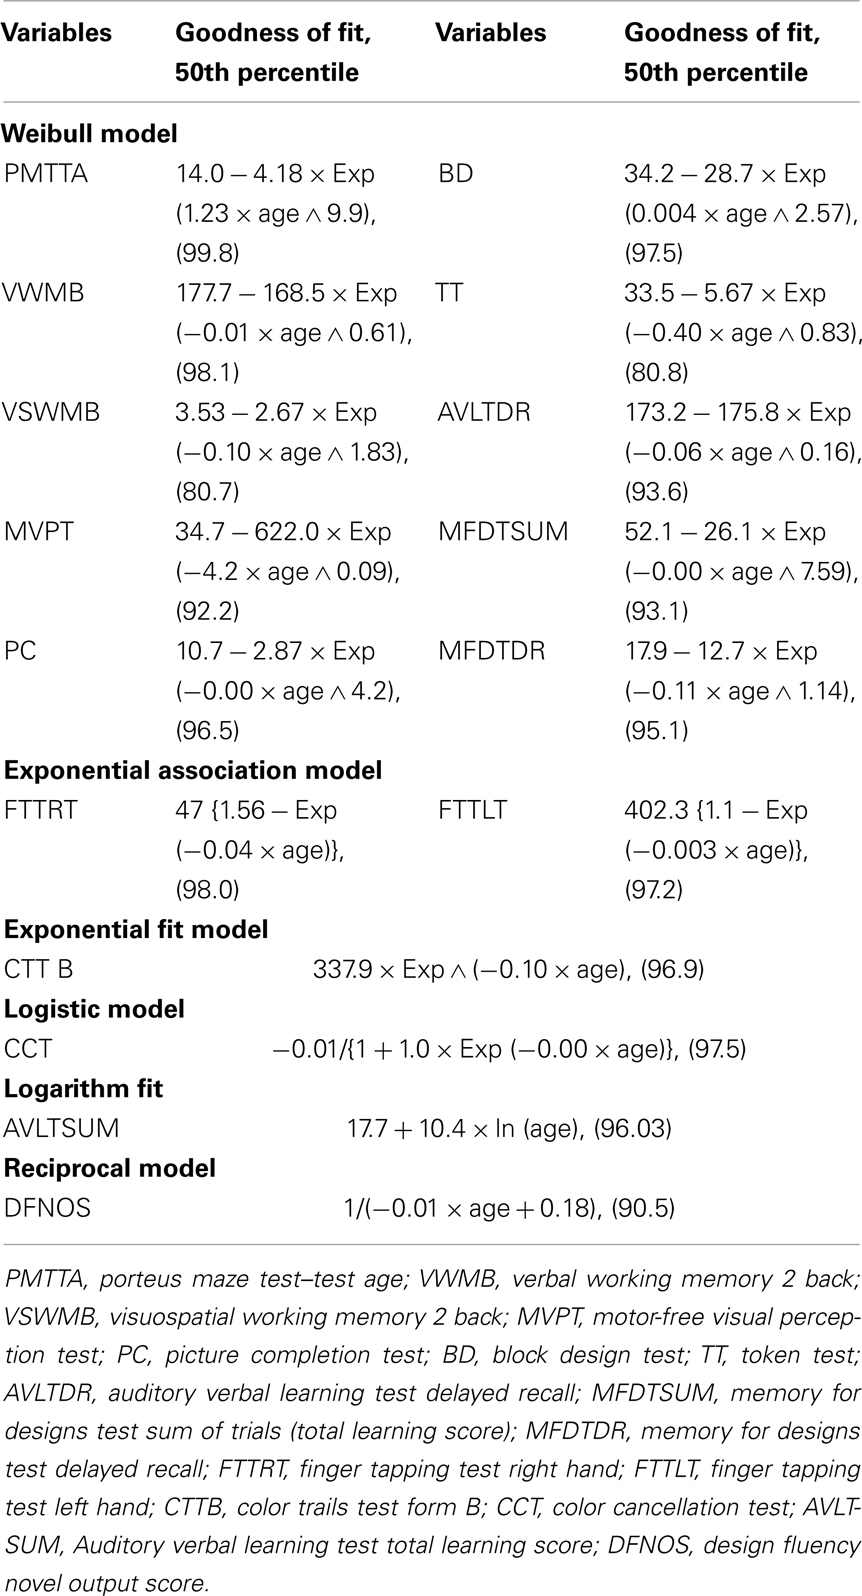
Table 2. Goodness of fit for the variables that followed different growth models.
Figures 1–5 present the growth curves (with predicted and actual mean scores along with the dispersion points) of six functions, i.e., visual construction, motor speed, focused attention, sustained attention, fluency, and verbal learning across the 11 age levels as exemplars of the six growth models that fitted the observed data across cognitive domains. The × axis presents the 11 age levels and the y axis presents the actual and predicted mean values. Results are discussed with reference to the estimated growth curves and post hoc comparisons for each of the test scores.
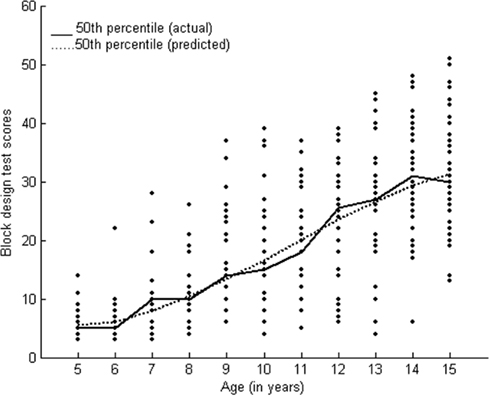
Figure 1. Presents an exemplar of the Weibull growth curve for the function of visual construction.
Growth patterns of neuropsychological functions that fitted the weibull model
Weibull model  signifies slow initial growth followed by monotonic increase in growth rate to reach an inflection point. After this, the growth rate approaches a final value asymptotically (Katkowsky, 1990). The weibull growth model represents a slow growth trend in the early ages followed by a steady age-related progression. Table 2 presents the parameters and goodness of fit of all the test scores that fitted the weibull model. Figure 1 presents the growth curve for visual construction as an exemplar of the weibull model to show the nature of age trends depicted by a sigmoidal growth model.
Porteus maze test score (R2 = 99.8), a measure of planning depicted a slow initial growth between 8 and 10 years followed by a steady growth also found through the post hoc comparisons. Verbal and visuospatial working memory (R2 = 98.1 and 80.7 respectively; n back task 2 back) showed a similar trend with intermittent differences across 5–13 years of age. Visual perception (R2 = 92.2), and visual construction (R2 = 97.5) also showed a sigmoid growth across 5–15 years of age. Verbal comprehension (R2 = 80.8) showed a change in performance between 5 and 7 years and no significant difference between 8 and 14 years. Verbal memory showed rapid improvement during middle childhood and visual memory (R2 = 93.1 and 95.1 respectively) showed a steady improvement between 7 and 14 years of age.
Growth patterns of neuropsychological functions that fitted the exponential association and exponential fit models
Exponential Models are characterized by a monotonic growth from some fixed value to an asymptote, which signify a steady growth (Olinick, 1978). The relative growth of a dependent variable to the independent variable remains constant. Exponential models represent a regular growth pattern proportionate with age-related changes. The major difference between the exponential association and exponential fit models is that the former signifies greater activity toward the end. Motor speed showed a fair goodness of fit (R2 right hand = 98.0; left hand = 97.2) to Exponential Association Model (y = a(b − exp(−c × age)); Table 2). Figure 2 presents the growth curve for motor speed (right hand) as an exemplar of the exponential association growth model. Motor speed (both right and left hand) showed age-related improvement from 8 to 15 years of age.
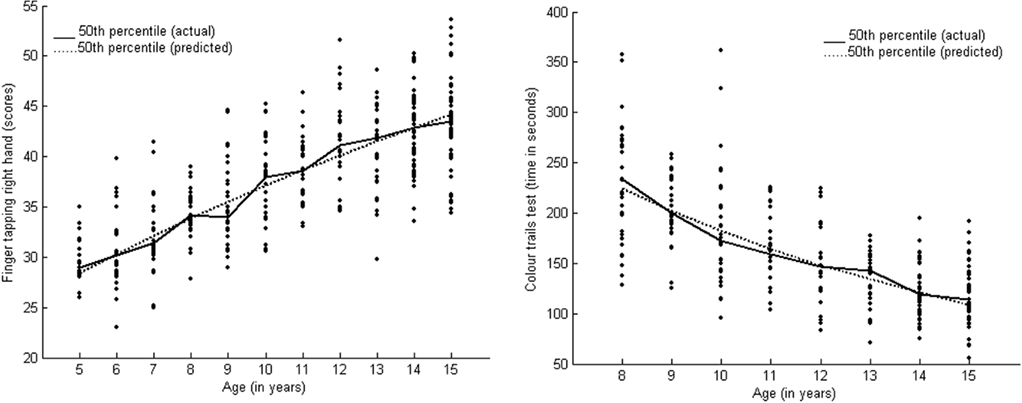
Figure 2. Presents exemplars of the exponential association (motor speed for right hand) and exponential fit (focused attention) growth curves.
The Color Trails Test (Trail B) score, a measure of focused attention, fitted well with the exponential fit model (y = a × exp(−b × age)) (R2 = 96.9). Table 2 presents the parameters and goodness of fit and Figure 2 presents the growth curve for focused attention. Improvement was observed in terms of decreasing response times with an increase in age during middle childhood and adolescence.
Growth patterns of neuropsychological functions that followed the logistic model
The Logistic Model has been developed as a model of population growth. It is an S-shaped curve, showing an increase in scores up to a certain point. It has a lower asymptote of zero and a finite upper asymptote (Katkowsky, 1990). Logistic model represents a growth pattern which is slow initially and is followed by a steady progressive growth pattern until a certain point in age after which it may slow down again but does not end in a regressive trend. The growth pattern of sustained attention (color cancelation test) fitted well with the Logistic Model (y = a/[1 + b × exp(−c × age)]) with three parameters (R2 = 97.5; Table 2). Post hoc results also showed consistent improvement across 7–15 years. Figure 3 presents the growth curve for sustained attention.
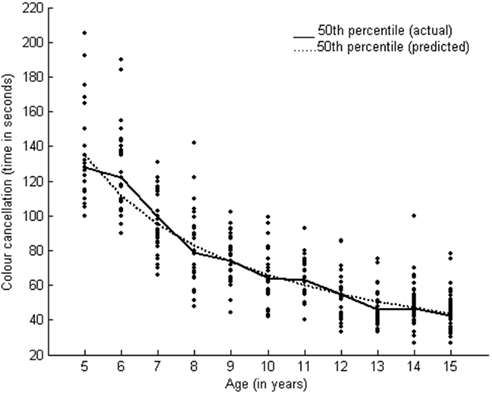
Figure 3. Presents an exemplar of the logistic growth curve for sustained attention.
Growth patterns of neuropsychological functions that followed the logarithm fit and reciprocal models
The Logarithm Fit and Reciprocal Models belong to the Exponential Family. These models have a convex or a concave curve. Some models in this group have an inflection point and a maximum or minimum. Performance on verbal learning followed the Logarithm Fit Model (y = a + b × ln(age)) (R2 = 94.1). Logarithm fit and reciprocal models represent slow growth patterns throughout the age range. Table 2 presents the parameters and goodness of fit. Figure 4 presents the growth curve for verbal learning. Growth patterns for verbal learning showed rapid initial growth followed by a plateau by the age of 13 years.
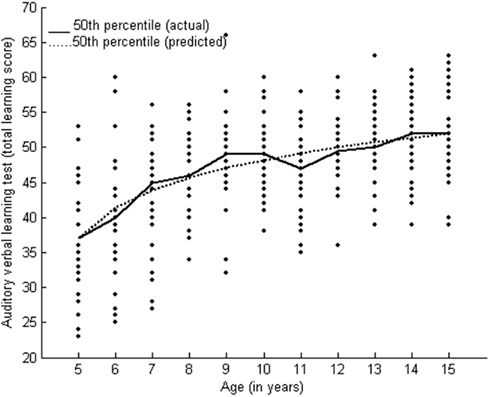
Figure 4. Presents an exemplar of logarithmic fit growth curve for verbal learning.
Design fluency followed the Reciprocal Model with two parameters (y = 1/a{age + b}). Table 2 presents the parameters and goodness of fit (R2 = 90.5) for the novel output score of design fluency test. A very slow rate of improvement was found on design fluency. Post hoc results also showed age-related improvement at 9 years of age and at 15 years of age. Growth curve analysis and post hoc results indicated varied growth patterns in the development of neuropsychological functions from early childhood to adolescence. Figure 5 presents the growth curve for design fluency which indicates a slow age-related improvement in performance.
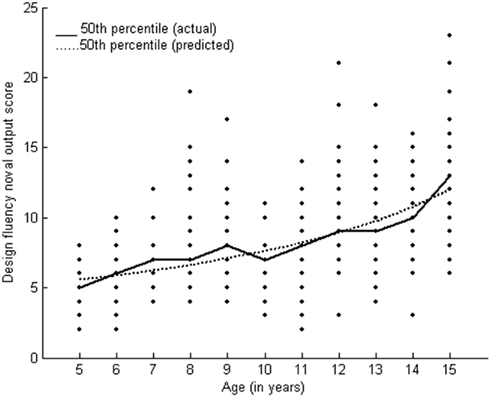
Figure 5. Presents an exemplar of the reciprocal growth curve for design fluency.
Discussion
The present study has empirically derived the overall growth patterns of neuropsychological functions in childhood and early adolescence. To our knowledge, this is the first study reporting growth profiles of neuropsychological functions across a wide age range in Indian children. The strength of the study is that it provides a comprehensive empirical account of growth patterns of neuro-cognitive functions. Such data are available for western population which may not represent the developmental patterns of the cognitive functions outside the western world. Moreover the insights about non-linear, protracted, and progressive growth patterns of neuro-cognitive functions add to the strength of the data.
Non-Linear Growth Trends
Non-linear models have proven fruitful in developmental psychology. We found a non-linear relationship between age and neuropsychological test scores across 5–15 years of age. Non-linear age trends suggest that the age-related differences in task performance are not uniform. Most of the functions showed a slow initial growth; however, a few functions showed a rapid growth at a young age, and very few showed a plateau in the younger age range. Most of the functions showed age-related differences in performance during adolescence. We have observed age-related differences in middle childhood (8–11 years) for some functions (like working memory, visuospatial functions, learning, and comprehension). Connectionist models of cognitive development (such as language acquisition) are examples of non-linearities (Elman, 2005). Performance on measures of fluency has shown significant improvement between 10 and 12 years. Verbal memory has shown improvement between 8 and 10 years but not after 13 years (Korkman et al., 2001). Our findings are consistent with reports of a non-linear relationship between age and attention and memory in children (4–11 years; Bornholt et al., 2004).
Non-linear relationship between age and neuropsychological performance has parallels in the nature of brain development. Neurodevelopmental events follow non-linear trends (Giedd et al., 1996; Sowell et al., 2001). A neuroimaging study on normal participants (4- to 21-year-olds) found non-linear changes in cortical gray and white matter across different brain regions (Giedd et al., 1999; Paus, 2005). Maturational changes in brain–behavior relationships involving the fronto-cortical and subcortical circuits continue to occur until adolescence.
Heterogeneous Growth Trends
The findings of the present study could be discussed with respect to overall growth patterns of neuropsychological domains/functions, as depicted by the growth curve models. Each growth model has its unique property, such as asymptotic curve, decaying, exponential increase/decrease, etc. The rate of increase and decrease depends on estimated model parameters computed based on the empirical data. In addition, developmental trajectories can also be interpreted in terms of age-related differences. Neuropsychological test scores fitted different growth models that signify the following growth patterns: (i) slow initial growth followed by speedy and consistent growth before it slows down (the Weibull model), (ii) growth that is proportionate to age (exponential models), (iii) rapid initial growth followed by a plateau (the logarithm fit model), and (iv) slow growth trend (the reciprocal model).
Motor speed followed the exponential growth model which signifies improvement proportionate to age. This growth pattern is consistent with reports that fine motor control and coordination (governed by the premotor cortex) are not fully developed until adolescence (Diamond, 2000).
The function of sustained attention followed logistic model which signifies a sigmoidal growth function that is, slow initial growth followed by speedy and consistent growth before it slows down. We found significant differences in performance between 7 and 12 years and at 15 years of age, as described by the post hoc tests. Developmental studies on sustained attention have reported a consistent improvement in performance during late childhood (Enns and Akhtar, 1989). Focused attention followed the exponential model, depicting a growth pattern that is proportionate to age. We found a significant reduction in response times between 10 and 15 years of age. Some studies have reported that focused attention is mature by 10 years of age (Rebok et al., 1997; Klenberg et al., 2001). We found differences in performance even at 15 years of age using post hoc tests.
Executive functions (fluency, planning, working memory) showed heterogeneous growth patterns. Planning and working memory followed the Weibull, three parameter growth functions and fluency followed the reciprocal model. Although executive functions are interrelated, their developmental sequences are separate from one another (Klenberg et al., 2001). Executive functions show a slow and prolonged maturation until adolescence (Fuster, 1997). A rapid improvement in executive functions was reported up to 12 years of age in the Australian population (Anderson et al., 2001). Some evidence has shown a rapid development of executive attention during 4–7 years of age (Posner and Rothbart, 2005). Design fluency followed the reciprocal model that signifies a slow growth pattern. This is consistent with reports showing improvement in design fluency until adolescence (Klenberg et al., 2001). Tasks requiring active use of strategy and self-monitoring may represent higher cognitive functions that mature later (Shute and Huertas, 1990). Working memory undergoes changes throughout the childhood years (Luciana and Nelson, 1998; Gathercole, 1999). We found a significant change in performance on the n back task observed in older children, a finding that is consistent with another study showing improvement between 11 and 13 years compared to 8–10 years of age (Khetrapal et al., 2008). Another study that used growth curve analysis showed a more rapid change in performance on working memory between 10 and 15 years of age (Demetriou et al., 2002).
Visuospatial functions followed the Weibull growth function. No significant increase in scores was found between 5 and 7 years followed by a significant difference between 7 and 11 years and between 11 and 14 years of age. The prolonged development of visuospatial functions could be related to the maturation of parietal association cortices involved in visuospatial functions (Fuster, 1997).
Verbal comprehension followed the Weibull growth model. Significant difference in performance was observed between 5 and 7 years and between 7 and 12 years of age. Non-linear development of language comprehension and production has been highlighted in the review on connectionist models of cognitive development by Elman (2005). The study by Korkman et al. (2001) using a test of comprehension of instructions, comparable to the Token test used in the current study has also reported developmental improvement in verbal comprehension until 12 years of age.
Learning and memory showed different growth patterns. Verbal learning followed the logarithmic growth function whereas verbal memory and visual learning and memory followed the Weibull growth function. We found improvement in performance on verbal learning in children 8–11 years of age, followed by a plateau. The rate of learning has been reported to mature by 10–12 years of age on the California Verbal Learning Test (a list learning test similar to RAVLT), showing a decline in scores after 12 years of age (Waber et al., 2007). Non-linear age effects on RAVLT (with greater improvement during middle childhood) have been reported (Vakil et al., 1998). Verbal memory showed age-related differences in the initial ages 5–7 years and also between 11 and 15 years of age. Development of the rate of learning may saturate early, but memory continues to mature during adolescence. Visual learning showed a significant increase in the rate of learning between 6 and 9 years of age. Visual memory showed a significant change in performance during adolescence as well.
Cognitive functions within a domain followed a similar growth trend. For example, visuospatial functions such as visual perception, visual construction and visual conceptual reasoning, as well as verbal and visual memory followed the Weibull model of growth. Executive functions, visuospatial functions, and memory are higher order functions and they depicted slow initial growth followed by a steady growth pattern. In comparison, rapid initial growth followed by a steady improvement was observed for sustained attention, verbal learning, and fluency.
Protracted Growth Trends
Developmental changes in cortical regions have been found to correlate with extended cognitive development reflected in behavioral responses. Cross-sectional and longitudinal studies of childhood and adolescence have reported that the fine tuning of cortical systems happens with the extended development of association regions (such as the prefrontal cortex; Casey et al., 2005a). We have also found a protracted trend of age-related differences with respect to the higher cognitive functions (such as working memory, focused attention, fluency, planning, visuospatial functions, and learning and memory); these are primarily mediated by regions like the prefrontal cortex, posterior parietal and lateral and medial temporal cortices, as well as functions like motor speed. A protracted developmental trend supports the notion of experience-based modifications in cognition and behavior. For example, executive attention networks can be influenced by interventions (Posner et al., 2008) and that this may be possible due to the progressive and continued development of attention during childhood.
Higher order integration across cognitive domains with different developmental trajectories seems to be characterized by longer periods of improvement as compared to the more regular transition points that were observed for primary sensory–motor functions like motor speed. Cognitive functions such as motor speed and visual perception also showed non-linear, progressive and continued growth patterns until 15 years of age as opposed to development of sensory–motor functions at an early age. Rapid initial growth of functions like attention and learning might aid in the development of higher cognitive functions.
There have been a few similar recent studies on neuro-cognitive performance on children in the United States (Korkman et al., 2001; Waber et al., 2007). There are similarities and certain differences in the findings with respect to the overall developmental patterns of neuro-cognitive functions. Although most of the cognitive domains tested are similar as the current study (such as motor speed, fluency, comprehension, executive functions, list learning), with some tests that are similar and some neuropsychological tests employed in these studies are different. The studies on American children and the present study on Indian children have found a more protracted developmental trend and a moderate rate of development between 10 and 12 years of age for most of the neuropsychological domains. Findings across studies also show differences that need to be tested further. One is related to the gender differences observed. In the American studies, girls were better at motor dexterity and boys at perceptual analysis, whereas we found statistically significant gender difference only with respect to motor speed for left hand (boys having an advantage over girls). Certain similarities and differences in the nature of overall growth patterns were observed between the findings of the present study on Indian population and those reported based on the assessments of children in the US. Age effects were found to be more pronounced in the age range of 5–8 years as compared to 9–12 years among the children in the US (Korkman et al., 2001). However, we find less number of differences between 5 and 8 years of age range across different functions as depicted from the growth curves as well the post hoc analysis of age effects. We found more prominent differences between 8 and 13 years of age range as compared to 5–8 years. We found that primarily neuropsychological functions followed the Weibull (S-shaped) growth function. Functional maturation (indexed by neuropsychological performance) seems to occur slowly in the early years (5–7 years of age) and becomes rapid during middle childhood and moderate in late childhood and early adolescence in Indian children. Similarities in growth patterns were observed for the functions of fluency (tested with design fluency across studies), learning rate on list learning test, verbal memory, spatial working memory and visual construction (Waber et al., 2007). Continued development of verbal memory until adolescence not much improvement in learning over trials was observed in both the populations (US and Indian). Continued development of verbal memory is attributed to prolonged development of strategies which is also dependent on development of executive functions. Visual construction assessed using the block design test has shown a steady rate of developmental improvement across the studies. These similarities/differences need not be attributed to test specific effects as five tests (design fluency, token test, finger tapping, block design, and list learning employed in the current study) were similar between our study and the one by Korkman et al. (2001) and these tests have shown a generic difference in the nature of growth patterns between the two populations as mentioned above.
The generic difference in the nature of growth patterns between children in the West and India could be related to differences with respect to socialization, schooling and pattern of formal instruction in school age children particularly to explain the slow initial growth pattern. The socialization process in India does not emphasize on individualism, discourages exploration, emphasis is on conformity and obedience. With respect to schooling, it starts as early as 3 years of age with formal instruction in literacy skills with mostly the first language as well as the second language which is English. Teacher to student ratio is low and so individual attention is difficult with 60–70 children in a class. Individual critical thinking, exploration, analytical thinking is generally not encouraged. Children are made to learn facts but not how to combine facts. These abilities develop slowly and are encouraged much later in middle childhood in schools and at home. Thus environmental affordance to develop higher cognitive functions is less. Variables such as schooling, parental input, etc., were not manipulated in previous studies on neuropsychological development as well as our study rather a representative sample was taken to minimize the variance with respect to differences in formal instruction and environmental stimulation. Differences have been reported with respect to spatial language, picture perception, and environmental cues with respect to spatial cognition particularly between traditional and technologically developed cultures (Montello, 1995). Recent studies on children in the US have reported linear increase in spatial cognition in children and adolescents as compared to a slow initial growth patterns followed by a steady rate of improvement with age among Indian children. This finding is based on the same task used across studies (block design task). Waber et al. (2007) have also reported the effect of age being modified by gender and income level for a few functions such as the age effects for reasoning and dexterity for preferred hand being modified by gender and for set shifting, dexterity for preferred hand and total score on list learning test by income level. Protracted development of executive functions across populations may be related to common findings with respect to prolonged development of neural networks mediating executive functions. Rapid development of most of the functions in young children in the west could be related to the explorative nature of early schooling style of the west. The school experience encourages children to analyze, conceptualize, and generalize. Schooling with respect to opportunities and methods of acquiring specific cognitive skills affects cognitive development more than the difference in culture or social class (Stevenson et al., 1978).
The continued and prolonged development of executive functions across various populations such as US, Zambian, Finnish, and Australian children and adolescents (Korkman et al., 2001; Mulenga et al., 2001; Waber et al., 2007; Crone, 2009) including our study and the neural networks mediating these functions has implications for training. Most of the studies have found prolonged development of executive functions. However, our findings with respect to prolonged developmental improvement for most of the neuropsychological functions has implications for training across domains at an early age (preschool years) which could prepare the children for better learning, acquisition of various skills and regulation of attention and executive control. A protracted developmental trend supports the notion of experience-based modifications in cognition and behavior.
Notwithstanding the caution due to the cross-sectional data, one could speculate that factors such as nutrition, education system, level of stimulation at home/school and parenting could influence functional maturation and result in the differences in developmental trends. Differences in the nature of the tests could have contributed to the divergence in the data from the two countries. Hence, a direct comparison of the developmental patterns would be difficult. However, a much larger investigation with manipulations with respect to cultural variables, socio-economic status, and home environment, parenting styles, and their effect on cognitive development across different populations is suggested. An even more representative population with respect to socio-economic strata could not be followed in the current study as it would have required a much larger sample. Another limitation of the present study is that we could not examine the specific effects of environmental influences on the growth patterns of neuropsychological functions which would need a careful consideration of various factors such as environmental stimulation, home environment, parenting style etc., with a smaller age range but a larger sample in each age level. A complete understanding about the nature of growth patterns of neuropsychological functions as observed in the present study could rather be achieved with a normative study on brain development in Indian population as well as the effect of environmental and cultural factors on neuro-cognitive development.
Conclusion
The present study is the first one to provide normative data on developmental trajectories based on neuropsychological performance in Indian population using growth curve modeling. Results indicate that improvements in neuropsychological performance occur as age advances but are not in tandem with increase in age, suggesting non-linear development. Development across cognitive domains occurs during middle and late childhood, as well as adolescence. Neuropsychological performance seems to mature slowly in the early years and then improves rapidly in middle childhood and early adolescence in Indian children. The insights regarding non-linear, heterogeneous, and protracted growth patterns of cognitive functions can be extended to examine links between maturational trends in behavior and the developing brain. A longitudinal design would help to validate the trends observed.
Conflict of Interest Statement
The authors declare that the research was conducted in the absence of any commercial or financial relationships that could be construed as a potential conflict of interest.
Acknowledgments
We are grateful to the children and their parents for their participation. Help and guidance from Dr. Mohan, Indian Statistical Institute, Bangalore for the growth curve analysis is deeply acknowledged. The authors also acknowledge the help in terms of very valuable comments and suggestions provided by Prof. Michael Posner and Prof. M. Rothbart, University of Oregon, USA. We are also grateful to Prof. Narayanan Srinivasan, Centre for behavioural and cognitive sciences, University of Allahabad, India, for his help and suggestions for the manuscript.
References
Anderson, V. A., Anderson, P., Northam, E., Jacobs, R., and Catroppa, C. (2001). Development of executive functions through late childhood and adolescence in an Australian sample. Dev. Neuropsychol. 20, 385–406.
Bornholt, L. J., Spencer, F. H., Ouvrier, R. A., and Fisher, I. H. (2004). Cognitive screening for young children: development and diversity in learning contexts. J. Child Neurol. 19, 313–317.
Bornstein, R. A. (1985). Normative data on selected neuropsychological measures from a non-clinical sample. J. Clin. Psychol. 41, 651–659.
Brocki, K. C., and Bohlin, G. (2004). Executive functions in children aged 6 to 13: a dimensional and developmental study. Dev. Neuropsychol. 26, 571–593.
Carlson, S., Martinkauppi, S., Rama, P., Salli, E., Korvenoja, A., and Aronen, H. J. (1998). Distribution of cortical activation during visuospatial N-back tasks as revealed by functional magnetic resonance imaging. Cereb. Cortex 8, 743–752.
Casey, B. J., Galvan, A., and Hare, T. A. (2005a). Changes in cerebral functional organization during cognitive development. Curr. Opin. Neurobiol. 15, 239–244.
Casey, B. J., Tottenham, N., Liston, C., and Durston, S. (2005b). Imaging the developing brain: what have we learned about cognitive development? Trends Cogn. Sci. (Regul. Ed.) 9, 104–110.
Casey, B. J., Giedd, J. N., and Thomas, K. M. (2000). Structural and functional brain development and its relation to cognitive development. Biol. Psychol. 54, 241–257.
Casey, B. J., Tottenham, N., and Fossella, J. (2002). Clinical, imaging, lesion, and genetic approaches toward a model of cognitive control. Dev. Psychobiol. 40, 237–254.
Chase, T. N., Fedio, P., Foster, N. L., Brooks, R., Di Chiro, G., and Mansi, L. (1984). Wechsler adult intelligence scale performance. Cortical localization by fluorodeoxyglucose F 18-positron emission tomography. Arch. Neurol. 41, 1244–1247.
Collarrusso, R. P., and Hammill, D. D. (1972). Motor-Free Visual Perception Test. Helsinki: Academic Therapy Publications.
Crone, E. A. (2009). Executive functions in adolescence: inferences from brain and behavior. Dev. Sci. 12, 825–830.
Crowder, M. J. (1989). A multivariate distribution with Weibull connections. J. R. Stat. Soc. 51, 93–107.
D’Elia, L. F., Satz, P., Uchiyama, C. L., and White, T. (1996). Color Trails Test. Odessa, FL: Psychological Assessment Resources, Inc.
De Onis, M., Dasgupta, P., Saha, S., Sengupta, D., and Blössner, M. (2001). The National Center for Health Statistics reference and the growth of Indian adolescent boys. Am. J. Clin. Nutr. 74,248–253.
De Renzi, E., and Vignolo, L. (1962). The token test: a sensitive test to detect receptive disturbances in aphasics. Brain 85, 665–678.
Demetriou, A., Christou, C., Spanoudis, G., and Platsidou, M. (2002). The development of mental processing: efficiency, working memory and thinking. Monograph Soc. Res. Child Dev. 67, 1–155.
Diamond, A. (2000). Close interrelation of motor development and cognitive development and of the cerebellum and prefrontal cortex. Child Dev. 71, 44–56.
Durston, S., Davidson, M. C., Tottenham, N., Galvan, A., Spicer, J., Fossella, J. A., and Casey, B. J. (2006). A shift from diffuse to focal cortical activity with development. Dev. Sci. 9, 1–8.
Durston, S., Tottenham, N., Galvan, A., and Casey, B. J. (2004). Longitudinal functional MRI of the development of cognitive control. Abstr. Soc. Neurosci. 319, 18.
Elger, C. E., Grunwald, T., Lehnertz, K., Kutas, M., Helmstaedter, C., Brockhaus, A., Van Roost, D., and Heinze, H. J. (1997). Human temporal lobe potentials in verbal learning and memory processes. Neuropsychologia 35, 657–667.
Elman, J. L. (2005). Connectionist models of cognitive development: where next? Trends Cogn. Sci. (Regul. Ed.) 9, 111–117.
Enns, J. T., and Akhtar, N. (1989). A developmental study of filtering in visual attention. Child Dev. 60, 1188–1199.
Ewing-Cobbs, L., Lewin, H. S., Eisenberg, H. M., and Fletcher, J. M. (1987). Language functions following closed head injury in children and adolescents. J. Clin. Exp. Neuropsychol. 9, 575–592.
Farah, M. J., Betancourt, L., Shera, D. M., Savage, J. H., Giannetta, J. M., Brodsky, N. L., Malmud, E. K., and Hurt, H. (2008). Environmental stimulation, parental nurturance, and cognitive development in humans. Dev. Sci. 11, 793–801.
Gathercole, S. E. (1999). Cognitive approaches to the development of short term memory. Trends Cogn. Sci. (Regul. Ed.) 3, 410–418.
Giedd, J. N., Blumenthal, J., Jeffries, N. O., Castellanos, F. X., Liu, H., Zijdenbos, A., Paus, T., Evans, A. C., and Rapoport, J. L. (1999). Brain development during childhood and adolescence: a longitudinal MRI study. Nat. Neurosci. 2, 861–863.
Giedd, J. N., Vaituzis, A. C., Hamburger, S. D., Lange, N., Rajapakse, J. C., Kaysen, D., Vauss, Y. C., and Rapoport, J. L. (1996). Quantitative MRI of the temporal lobe, amygdala, and hippocampus in normal human development: ages 4-18 years. J. Comp. Neurol. 366, 223–230.
Gogtay, N., Giedd, J. N., Lusk, L., Hayashi, K. M., Greenstein, D., Vaituzis, A. C., Nugent, T. F. III, Herman, D. H., Clasen, L. S., Toga, A. W., Rapoport, J. L., and Thompson, P. M. (2004). Dynamic mapping of human cortical development during childhood through early adulthood. Proc. Natl. Acad. Sci. U.S.A. 101, 8174–8179.
Gupta, R., and Kar, B. R. (2009). Development of attentional processes in children with ADHD and normally developing children. Prog. Brain Res. 176, 259–576.
Horgan, G. W. (1995). Growth Curve modeling. Available at: www.bioss.ac.uk/smart/unix/mgrow/slides/frames.htm
Horgan, G. W., and Stubbs, J. (2003). Predicting basal metabolic rate in the obese is difficult. Eur. J. Clin. Nutr. 57, 335–340.
Jones-Gotman, M. (1986). Memory for designs: the hippocampal contribution. Neuropsychologia 24, 193–203.
Jones-Gotman, M. (1991). Localization of lesions by neuropsychological testing. Epilepsia 32, S41–S52.
Jones-Gotman, M., and Milner, B. (1977). Design fluency: the invention of nonsense drawings after focal cortical lesions. Neuropsychologia 15, 653–674.
Kapur, M. (1974). Measurement of Organic Brain Dysfunction. Ph.D thesis, Submitted to Bangalore University, Bangalore.
Kar, B. R., Rao, S. L., and Chandramouli, B. A. (2008). Cognitive development in children with chronic protein energy malnutrition. Behav. Brain Funct. 4, 31.
Kar, B. R., Rao, S. L., Chandramouli, B. A., and Thennarasu, K. (2004). NIMHANS Neuropsychological Battery for Children-Manual. Bangalore: NIMHANS Publication Division.
Khetrapal, N., Kar, B. R., and Srinivasan, N. (2008). Development of visuo-spatial working memory. Psychol. Stud. (Mysore) 53, 171–174.
Klenberg, L., Korkman, M., and Lahti-Nuuttila, P. (2001). Differential development of attention and executive functions in 3 to 12 year old Finnish children. Dev. Neuropsychol. 20, 407–428.
Klinberg, T., Frossberg, H., and Westerberg, H. (2002). Increased brain activity in frontal and parietal cortex underlies the development of visuospatial working memory capacity during childhood. J. Cogn. Neurosci. 14, 1–10.
Kolkiewicz, A. W. (1998). “Nonlinear regression,” in Encyclopedia of Biostatistics, Vol. 4, eds P. Armitage, and T. Colton (New York, NY: Wiley), 3015–3020.
Korkman, M., Kemp, S. L., and Kirk, U. (2001). Effects of age on neurocognitive measures of children ages 5-12 years: a cross-sectional study on 800 children from the United States. Dev. Neuropsychol. 20, 331–354.
Luciana, M., and Nelson, C. A. (1998). The functional emergence of prefrontally-guided working memory systems in 4-8 year old children. Neuropsychologia 36, 273–293.
Maj, M., D’Elia, L., Satz, P., and Janssen, R. (1993). Evaluation of two new neuropsychological tests designed to minimize cultural bias in the assessment of HIV-1seropositive persons: a WHO study. Arch. Clin. Neuropsychol. 8, 123–135.
Malin, A. J. (1969). Malin’s Intelligence Scale for Indian Children (MISIC). Indian J. Ment. Retard. 4, 15–25.
Montello, D. R. (1995). “How significant are cultural differences in spatial cognition,” in Spatial Information Theory: A Theoretical Basis for Gis, eds A. U. Frank, and W. Kuhn (Berlin: Springer-Verlag), 485–500.
Mulenga, K., Ahonen, T., and Aro, M. (2001). Performance of Zambian children on the NEPSY: a pilot study. Dev. Neuropsychol. 20, 375–383.
Munakata, Y., Casey, B. J., and Diamond, A. (2004). Develop,mental cognitive neuroscience: progress and potential. Trends Cogn. Sci. (Regul. Ed.) 8, 122–128.
Nisbett, R. E., and Norenzayan, A. (2002). “Culture and cognition,” in Steven’s Handbook of Experimental Psychology, 3rd Edn, ed. D. L. Medin (New York, NY: John Wiley & Sons), 561–597.
Oldfield, R. C. (1971). The assessment and analysis of handedness: the Edinburgh inventory. Neuropsychologia 9, 97–113.
Olinick, M. (1978). An Introduction to Mathematical Models in the Social and Life Sciences. London: Addison-Wesley.
Paus, T. (2005). Mapping brain maturation and cognitive development during adolescence. Trends Cogn. Sci. (Regul. Ed.) 9, 60–68.
Posner, M. I., Rothbart, M., and Reuda, M. R. (2008). “Brain mechanisms and learning of high level skills,” in The Educated Brain. eds A. M. Battro, K. W. Fischer, and P. J. Lena (Cambridge: Cambridge University Press), 151–165.
Posner, M. I., and Rothbart, M. K. (2005). Influencing brain networks: implications for education. Trends Cogn. Sci. (Regul. Ed.) 9, 99–103.
Raven, J., Raven, J. C., and Court, J. H. (1998). Colored Progressive Matrices. Oxford: Oxford Psychologists Press.
Raven, J., Raven, J. C., and Court, J. H. (2000). Standard Progressive Matrices. Oxford: Oxford Psychologists Press.
Rebok, G. W., Smith, C. B., Pascualvaca, D. M., Mirsky, A. F., Anthony, B. J., and Kellam, S. G. (1997). Developmental changes in attentional performance in urban children from eight to thirteen years. Child Neuropsychol. 3, 28–46.
Reitan, R. M. (1970). Sensorimotor functions, intelligence and cognition, and emotional status in subjects with cerebral lesions. Percept. Mot. Skills 31, 275–284.
Reuda, M. R., Rothbart, M. K., McCandliss, B. D., Saccommano, L., and Posner, M. I. (2005). Training, maturation and genetic influences on development of executive functions. Proc. Natl. Acad. Sci. U.S.A. 102, 14932–14936.
Rutter, M. A. (1967). Children’s behaviour questionnaire for completion by teachers: preliminary findings. J. Child Psychol. Psychiatry 8, 1–11.
Scoville, W. B., and Milner, B. (1954). Loss of recent memory after bilateral hippocampal lesions. J. Neurol. Neurosurg. Psychiatr. 20, 11–21.
Shimoyama, I., Ninchoji, T., and Uemura, K. (1990). The finger tapping test. Arch. Neurol. 47, 681–684.
Shute, G. E., and Huertas, V. (1990). Developmental variability in frontal lobe function. Dev. Neuropsychol. 6, 1–11.
Smith, E. E., and Jonides, J. (1995). “Working memory in humans: neuropsychological evidence,” in Cognitive Neurosciences, ed. M. S. Gazzaniga (Cambridge, MA: MIT Press), 1009–1020.
Sowell, E. R., Peterson, B. S., Thompson, P. M., Welcome, S. E., Henkenius, A. L., and Toga, A. W. (2003). Mapping cortical change across the human life span. Nat. Neurosci. 6, 309–315.
Sowell, E. R., Thompson, P. M., Tessner, K. D., and Toga, A. W. (2001). Mapping continued brain growth and gray matter density reduction in dorsal frontal cortex: inverse relationships during post-adolescent brain maturation. J. Neurosci. 21, 8819–8829.
Spreen, O., Risser, A. H., and Edgell, D. (1995). Developmental Neuropsychology. New York: Oxford University Press, 3–77.
Spreen, O., and Strauss, E. (1998). A Compendium of Neuropsychological Tests, 2nd Edn. New York: Oxford University Press.
Stevenson, H. W., Parker, T., Wilkinson, A., Bonnevaux, B., and Gonzalez, M. (1978). Schooling, environment, and cognitive development: a cross-cultural study. Monogr. Soc. Res. Child Dev. 43, 1–92.
Vakil, E., Blachstein, H., and Sheinman, M. (1998). Rey AVLT: development of norms for children and sensitivity of different measures to age. Child Neuropsychol. 4, 161–177.
Waber, D. P., De Moor, C., Forbes, P. W., Almli, C. R., Botterson, K. N., Leonard, G., Milovan, D., Paus, T., and Rumsey, J. (2007). The NIH MRI study of normal brain development: performance of a population based sample of healthy children aged 6-18 years on a neuropsychological battery. J. Int. Neuropsychol. Soc. 13, 1–18.
Williams, J., Rickert, V., Hogan, J., Zolten, A. J., Satz, P., D’Elia, L. F., Asarnow, R. F., Zaucha, K., and Light, R. (1995). Children’s colour trails. Arch. Clin. Neuropsychol. 10, 211–223.
Keywords: cognitive development, growth patterns, non-linear growth models, neuropsychological measures
Citation: Kar BR, Rao SL, Chandramouli BA and Thennarasu K (2011) Growth patterns of neuropsychological functions in indian children. Front. Psychology 2:240. doi: 10.3389/fpsyg.2011.00240
Received: 28 February 2011; Accepted: 02 September 2011;
Published online: 01 November 2011.
Edited by:
Frederic Dick, University of California San Diego, USAReviewed by:
Frank Daniel Baughman, The University of Western Australia, AustraliaArielle Borovsky, University of California San Diego, USA
Copyright: © 2011 Kar, Rao, Chandramouli and Thennarasu. This is an open-access article subject to a non-exclusive license between the authors and Frontiers Media SA, which permits use, distribution and reproduction in other forums, provided the original authors and source are credited and other Frontiers conditions are complied with.
*Correspondence: Bhoomika R. Kar, Centre for Behavioural and Cognitive Sciences, University of Allahabad, Psychology Building, Allahabad 211002, India. e-mail: bhoomika2000@yahoo.com; bhoomika@cbcs.ac.in