
- Mouse Imaging Centre, Hospital for Sick Children, Toronto, ON, Canada
The integrinβ3 (ITGβ3) gene has been associated with both autism and the serotonin system. The purpose of this study was to examine the volumetric differences in the brain of an ITGβ3 homozygous knockout mouse model compared with a corresponding wild-type mouse using high resolution magnetic resonance imaging and detailed statistical analyses. The most striking difference found was an 11% reduction in total brain volume. Moreover, 32 different regions were found to have significantly different relative volumes (percentage total brain volume) in the ITGβ3 mouse. A number of interesting differences relevant to autism were discovered including a smaller corpus callosum volume and bilateral decreases in the hippocampus, striatum, and cerebellum. Relative volume increases were also found in the frontal and parieto-temporal lobes as well as in the amygdala. Particularly intriguing were the changes in the lateral wings of the dorsal raphe nuclei since that nucleus is so integral to the development of many different brain regions and the serotonin system in general.
Introduction
Autism Spectrum Disorder (ASD) is a developmental disorder that is characterized by three behavioral symptoms: repetitive/restrictive behaviors, communication deficits, and social deficits. The prevalence of ASD in school children from kindergarten to grade 11 has been reported to be 0.79%, with classic autism accounting for 0.25% (Lazoff et al., 2010). There has also been a significant linear increase in the prevalence of autism over the time period examined in that study (Lazoff et al., 2010), although the cause of that increase is still unclear. ASD is a genetic disorder, with a 90% concordance rate with identical twins, and a 15–20% risk of autism in siblings (Steffenburg et al., 1989; Bailey et al., 1995; Lamb, 2011). Currently, the Simon’s foundation autism gene database lists 250+ genes that have been associated with autism (Basu et al., 2009). Thus, both the genetics and behavioral aspects of the disorder are quite heterogeneous, and no single gene accounts for more than 2% of ASD cases (Abrahams and Geschwind, 2010). Autism is a highly heterogeneous disorder in humans. Autistic symptoms range from mild to severe in the three diagnostic criteria, and two autistic children might display vastly different phenotypes (Munson et al., 2008; Richler et al., 2010). There is also a lack of consistency in the human neuroanatomical findings. Looking at a specific gene, which has been shown to be associated with autism, allows one to investigate specific changes for a certain subset of autism.
The integrinβ3 (ITGβ3) gene is a subunit of the platelet- and megakaryocyte-specific heterodimeric fibrogen receptor and the widely expressed heterodynamic vitrogen receptor (Weiss et al., 2006a) located on chromosome 17. The role of the ITGβ3 gene in the brain is to control platelet function, cell-adhesion, and cell signaling (Weiss et al., 2006a). The ITGβ3 gene has been shown to be associated with both autism susceptibility (Weiss et al., 2006a; Napolioni et al., 2011) and whole brain serotonin levels (Weiss et al., 2004, 2006a). Further, ITGβ3 is also linked with an additional autism susceptibility gene, namely SLC6A4, the serotonin transporter (SERT) gene (Weiss et al., 2006b; Coutinho et al., 2007; Mei et al., 2007; Ma et al., 2010). Serotonin is a monoamine neurotransmitter that is involved in behaviors such as mood, aggression, sleep, pain sensitivity, cognition, learning, and memory (Sodhi and Sanders-Bush, 2004). Hyperserontonia is one of the oldest and most well replicated findings in autism patients, originally found in ∼30% of autism patients (Schain and Freedman, 1961). Additionally, whole blood serotonin has been identified as a marker in a number of other brain disorders such as bipolar disorder (Hughes et al., 1996), attention deficit hyperactivity disorder (ADHD; Hughes et al., 1996), mental retardation (Partington et al., 1973), and obsessive compulsive disorder (OCD; Hanna et al., 1991). While there is certainly evidence supporting ITGβ3 involvement in other disorders, particularly due to its effect on the serotonin system, it clearly has a strong relationship to autism (Weiss et al., 2006a; Coutinho et al., 2007; Ma et al., 2010; Napolioni et al., 2011).
Serotonin has also been shown to play a role in brain development prior to the time it assumes a role as a neurotransmitter in the mature brain (Lauder, 1990; Chubakov et al., 1993; Whitaker-Azmitia et al., 1996). Serotonin neurons in the brain are one of the most widely distributed neuronal systems (Sodhi and Sanders-Bush, 2004); serotonin neurons stem from four nuclei within the brain stem, the main two being the dorsal and median raphe nuclei. The dorsal raphe nuclei project axons widely to most areas of the cortex, while the medial raphe nuclei preferentially project to specific areas, such as the dentate gyrus, posterior cingulate, and entorhinal areas, as well as the parietal cortex (Kosofsky and Molliver, 1987). A number of the genes that have been associated with ASD have been linked to the serotonin system (Chugani, 2011).
Magnetic resonance imaging (MRI) in human subjects and animal models has been used quite extensively for examining volume changes in the brain. In human autism research a number of meta-analyses on human brain images have highlighted several areas of interest (Stanfield et al., 2008; Frazier and Hardan, 2009; Radua et al., 2011; Via et al., 2011). Stanfield et al. reported that the total brain, cerebral hemispheres, cerebellum, and caudate nucleus were increased in volume, whereas the corpus callosum was reduced in volume (Stanfield et al., 2008). Other more recent meta-analyses have highlighted regional differences in areas that are important for social cognition: namely the hippocampus, amygdala, and corresponding white matter tracts involved in language (Radua et al., 2011; Via et al., 2011). There are many inconsistencies in the results from multiple areas in the brain, however, and the meta-analyses describe many confounding factors, such as the genetic variability in the sample, environmental factors, IQ, and the use of high- vs. low-functioning autistic subjects. The finding of decreased volume or thinning in the corpus callosum is the most consistent finding in human autism (Stanfield et al., 2008; Frazier and Hardan, 2009). Using an animal model, such as the mouse, eliminates some of these confounding factors, as the background genetics and living environment can be controlled more easily. The link to autism in the mouse, however, is often based on the genetics and not the behavior as it is defined in the human population. Autistic behaviors in the mouse are hard to define and are as heterogeneous as they are in humans (Moy et al., 2006, 2007). Using MRI one can detect specific and highly reproducible measurements of relatively subtle volumetric differences, which are shown to be consistent with stereological findings (Lerch et al., 2008a; Spring et al., 2010). These studies have provided maps of the left/right asymmetries in the brain (Spring et al., 2010), sexual dimorphisms (Spring et al., 2007), and learning and memory changes (Lerch et al., 2011b). This same technique has also been applied to human disease models in the mouse, such as Huntington’s disease (Lerch et al., 2008a) and Alzheimer’s disease (Lerch et al., 2005, 2008b). Recently multiple studies have looked at autism related mouse models in order to probe some of the volumetric changes found in human autism in specific genetic backgrounds (Ellegood et al., 2010, 2011; Horev et al., 2011).
An ITGβ3 knockout (KO) mouse was created originally to assess the human bleeding disorder Glanzmann thrombasthenia (Hodivala-Dilke et al., 1999). Due to ITGβ3 being related to platelet function, the KO mice have deficits in platelet aggregation and clot retraction, prolonged bleeding times, and cutaneous and gastrointestinal bleeding. There is also an increase in fetal mortality for the homozygotic mice (Hodivala-Dilke et al., 1999). Recently, the ITGβ3 KO mouse model has been used to assess the behavioral deficits of the model (Carter et al., 2011). The ITGβ3 mouse showed no deficits in activity level during the open field test, or anxiety behavior during the elevated plus maze. However, they did show increased grooming behavior (a repetitive behavior) and in the three chamber social apparatus (Nadler et al., 2004; Yang et al., 2011) the ITGβ3 mice did not show a preference for social novelty (indicative of a social deficit). These behaviors define two of the three core deficits in autism. Note, however, that there is considerable overlap between the repetitive behaviors seen in OCD and autism in humans, and therefore, this increased grooming may be attributable to both an OCD and autistic phenotype.
The purpose of this study was to examine the volumetric differences in the brain of an ITGβ3 homozygous KO mouse model when compared to its corresponding wild-type (WT) mouse using high resolution MRI and detailed statistical analyses to determine the effect of ITGB3 on brain morphometry.
Materials and Methods
Specimen Preparation
Twenty-four male mice were purchased from Jackson Labs (Bar Harbor, Maine, USA), 12 ITGβ3 homozygous KO mice (JAX #004669), and 12 WT mice (JAX #101045). All mice were on a mixed C57BL/6 and 129 background. These mice were sacrificed at postnatal day 60. Initially the mice were anesthetized with ketamine/xylazine and intracardially perfused with 30 mL of 0.1 M PBS containing 10 U/mL heparin (Sigma) and 2 mM ProHance (a Gadolinium contrast agent) followed by 30 mL of 4% paraformaldehyde (PFA) containing 2 mM ProHance. Perfusions were performed with a Pharmacia minipump at a rate of approximately 100mL/h. After perfusion, mice were decapitated and the skin, lower jaw, ears, and the cartilaginous nose tip were removed. The brain within the skull was incubated in 4% PFA +2 mM ProHance overnight at 4°C then transferred to 0.1 M PBS containing 2 mM ProHance and 0.02% sodium azide for at least 7 days but not more than 2 months prior to MRI scanning (Spring et al., 2007).
Two of these 24 mice were excluded from the study. One WT mouse was found dead the morning of the perfusion and one ITGβ3 KO was discovered on the MRI scan to have a large hemorrhage. Therefore, the total number of mice used for this study was eleven per group.
Magnetic Resonance Imaging
A 7.0 Tesla MRI scanner (Varian Inc., Palo Alto, CA) with a 40 cm inner bore diameter was used to acquire the anatomical images. A custom-built 16-coil solenoid array was used to image 16 samples in parallel (Lerch et al., 2011a). Parameters used in the scans were optimized for high efficiency and gray/white matter contrast. A T2 weighted 3D fast spin echo (FSE) sequence was used with TR = 2000 ms, echo train length = 6, TEeff = 42 ms, field-of-view (FOV) of 25 mm × 28 mm × 14 mm, and matrix size of 450 × 504 × 250, which yielded an isotropic (3D) resolution of 56 μm. In the first phase-encode dimension, consecutive k-space lines were assigned to alternating echoes to move discontinuity-related ghosting artifacts to the edges of the FOV (Thomas et al., 2004). This sequence involves oversampling in the phase-encode direction by a factor of 2 to avoid interference of the ghosts with the main image giving a FOV of 28 mm that was subsequently cropped to 14 mm after reconstruction. Total imaging time was 11.7 h.
Registration and Analysis
To examine the neuroanatomical changes in the brains of the ITGβ3 KO mice compared to their corresponding WT, all 22 brains were linearly and subsequently non-linearly registered together such that a deformation field was created for each mouse which takes it from native space to the common registered space. All the scans are then resampled following this transform and averaged to create a population average, which represents the average neuroanatomy of the study sample. All registrations were performed using a combination of the mni_autoreg tools (Collins et al., 1994) and ANTS (Avants et al., 2010). The result of this registration process is to have all the MRI scans deformed into exact alignment with one another in an unbiased fashion. This allows for the analysis of the deformations, the goal of which is to model how the deformation fields relate to genotype (Nieman et al., 2006; Lerch et al., 2008a). The Jacobian determinants of the deformation fields are then calculated as measures of volume difference at each voxel (3D pixel). Significant volume changes can then be calculated in two ways. First, regional measurements can be calculated by warping a pre-existing classified MRI atlas onto the population average (Dorr et al., 2008). This allows the volume of 62 different structures, which include the cortical lobes, large white matter structures, ventricles, cerebellar structures, brain stem regions, and the olfactory bulbs (Dorr et al., 2008); volumes can be expressed in two different ways, absolute volume (in mm3) and relative volume (percentage of total brain volume). Relative volume measurements are useful in cases where the two groups have overall brain volume differences. Second, individual voxel measurements can be calculated from comparisons of the Jacobian determinants in a specific voxel between the ITGβ3 and WT. Again, this can also be calculated as an absolute and relative measure of volume. Multiple comparisons in this study were controlled for using either the False Discovery Rate (FDR; Genovese et al., 2002) for the regional comparisons, and Threshold Free Cluster Enhancement (TFCE; Smith and Nichols, 2009) for the voxel-wise whole brain comparisons.
Results
An 11% reduction in total brain volume was found, reflected in 53 of 62 brain regions being significantly smaller (Figure 1). The volume comparisons reported here, therefore, were measured as a relative volume (i.e., a percentage of total brain volume). Thirty-two regions were significantly different at an FDR of <0.05 when the relative volumes were compared. Selected regions are found in Table 1.
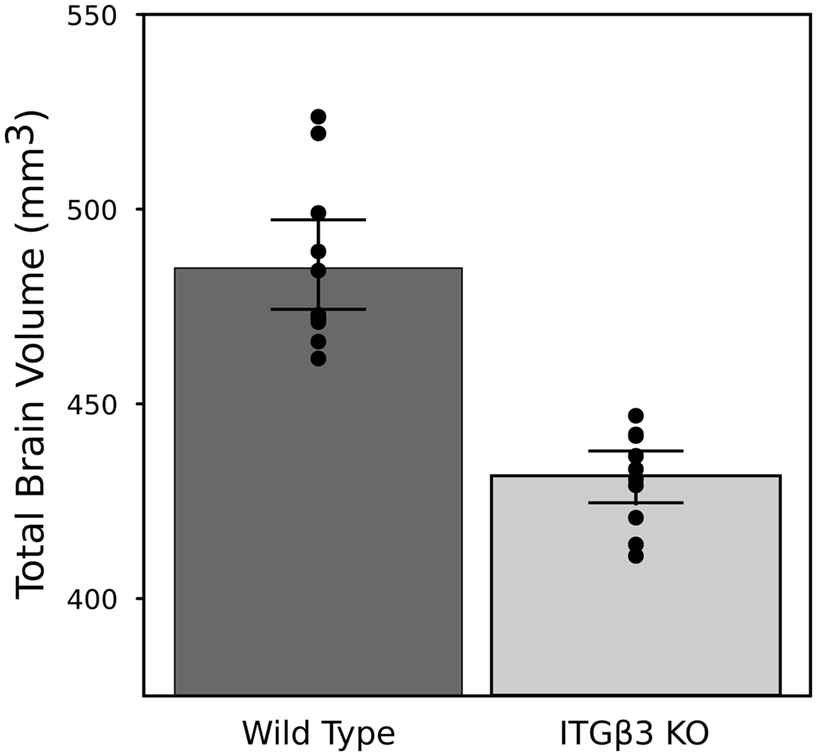
Figure 1. Highlights the difference in overall brain volume between the ITGβ3 KO mouse model and the corresponding WT. The points represent the individual brain volumes, and the error bars represent the 95% confidence interval.
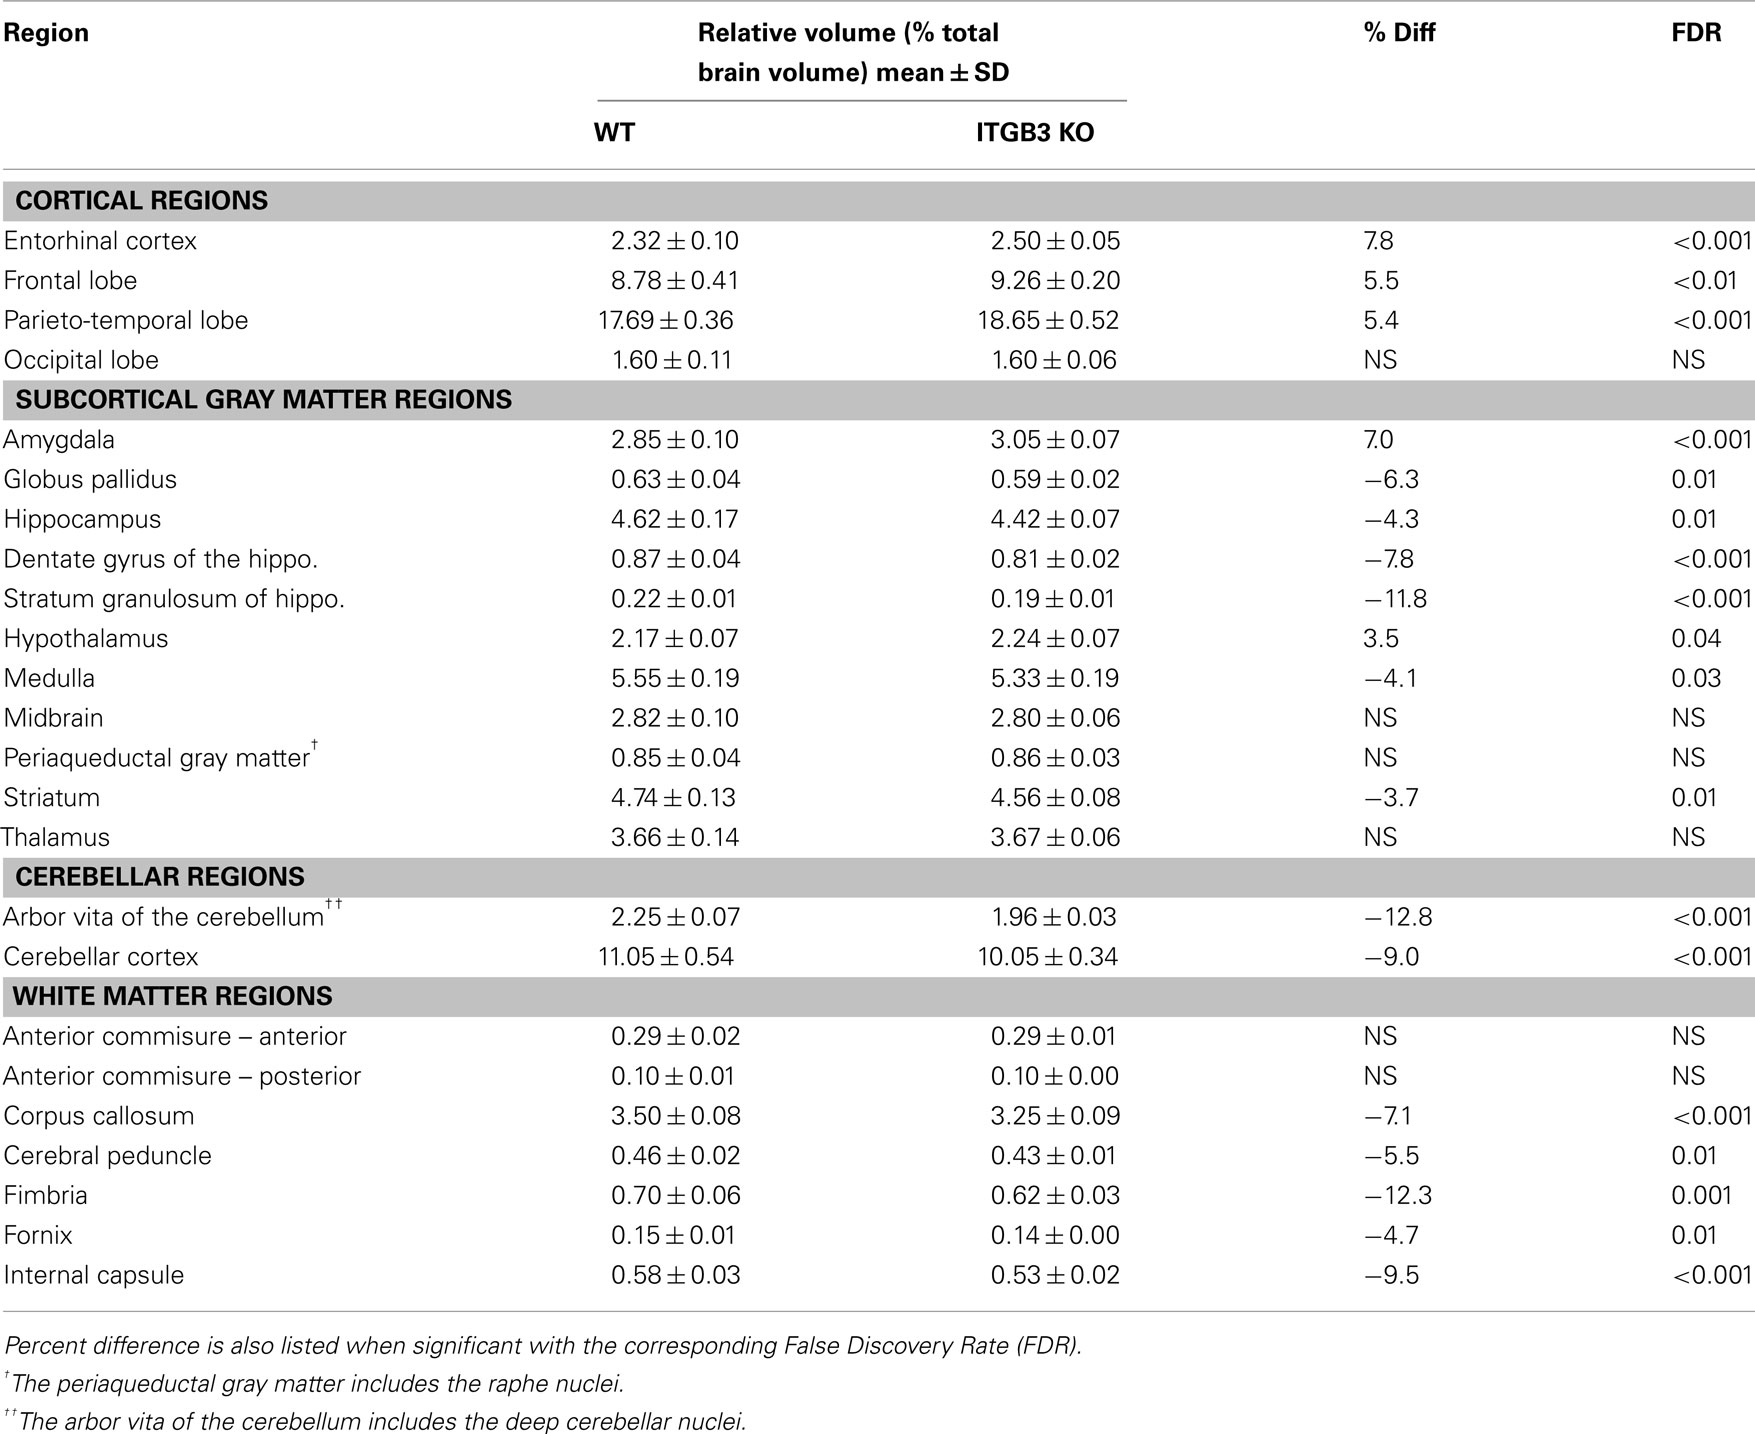
Table 1. Relative volume measurements (mean ± SD) of selected regions in the ITGβ3 KO compared to the corresponding WT.
A series of coronal images highlighting the relative voxel-wise differences between the brains of the ITGβ3 KO mouse and the corresponding WT can be seen in Figure 2. These maps were created by thresholding the effect size measurement by the TFCE corrected p-value of 0.05; thus only effect sizes of significance are displayed. Numerous changes can be seen throughout the brains where the relative volume is larger (red) or smaller (blue). In the hippocampus, for example, there are drastic bilateral changes around the midline (Figures 2B–D). Further, a bilateral decrease can be seen in the dorsal raphe nuclei (Figure 2F). It should be noted that the dorsal raphe nuclei are included within the periaqueductal gray matter region in our atlas (Table 1).
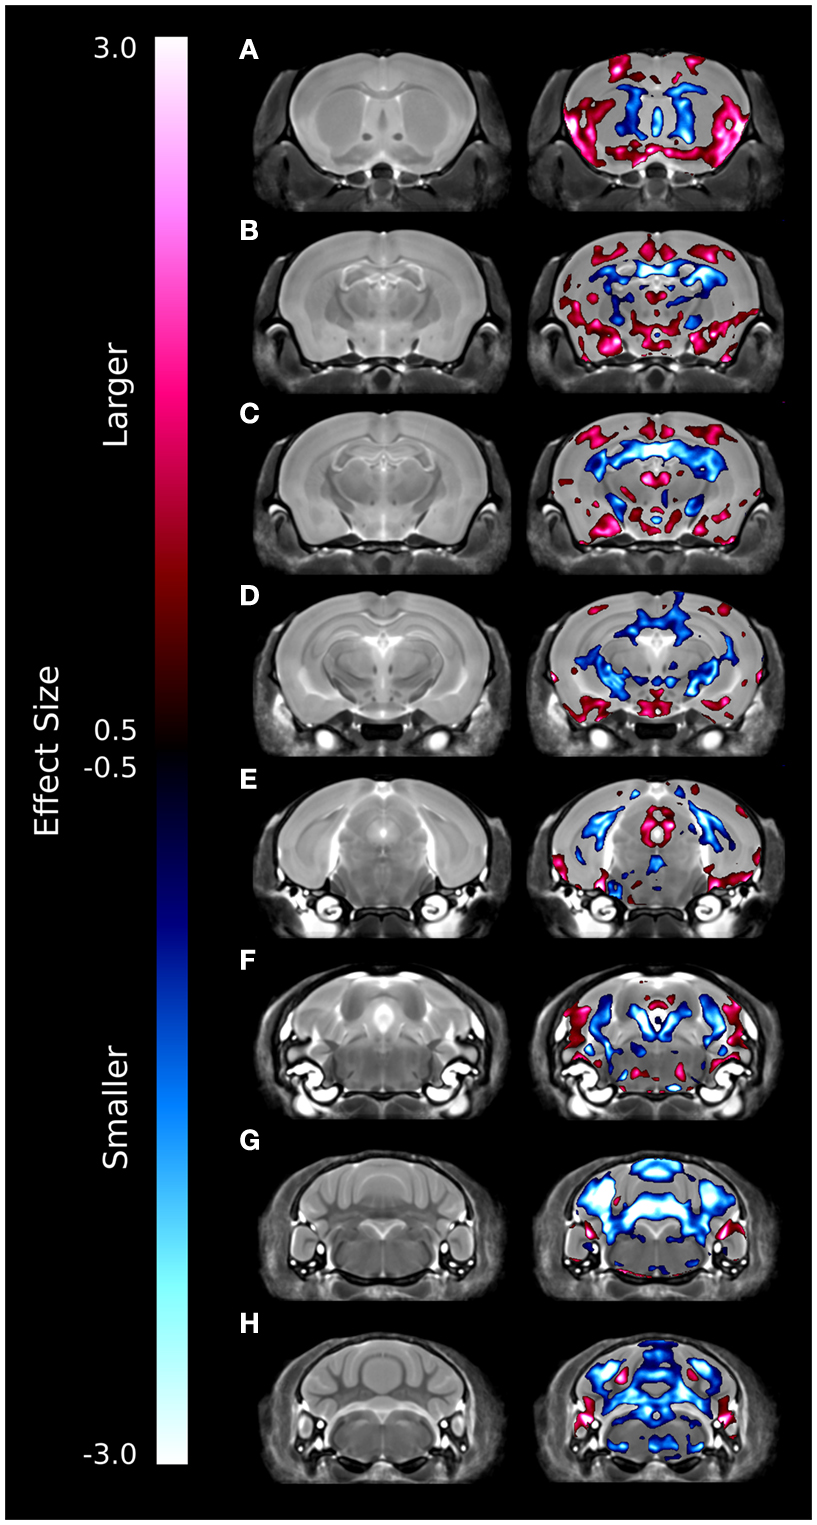
Figure 2. Coronal slices highlighting the differences between the ITGβ3 mouse and the WT. The slices are arranged from anterior (A) to posterior (H). These maps were created by thresholding the effect size measurement by the TFCE multiple comparison correction; therefore only effects sizes of significance (TFCE corrected p value < 0.05) are displayed. Anything displayed in blue indicates a smaller volume in the ITGβ3 mouse and anything displayed in red indicates a larger volume in the ITGβ3 mouse.
Two specific structures are highlighted in Figure 3: the corpus callosum (Figure 3A) and the periaqueductal gray matter (Figure 3B). The corpus callosum in the ITGβ3 KO mouse had an absolute volume difference of ∼3 mm3 or −17%, and a relative volume decrease of ∼7%. Volume changes of the corpus callosum along the midline seem to be localized in the posterior or splenium (Figure 3A). The periaqueductal gray matter had a −10% absolute volume difference which was consistent with the overall change in total brain volume, and thus showed no significant relative volume differences. However in two regions within the periaqueductal gray matter there are competing differences (Figure 3B). In the central section of this region there is a relative volume decrease of a size comparable to the decrease located in the dorsal raphe nuclei, which was also seen in Figure 2F. These competing volume differences account for the lack of relative volume difference and highlight the importance of the additional voxel-wise measurements.
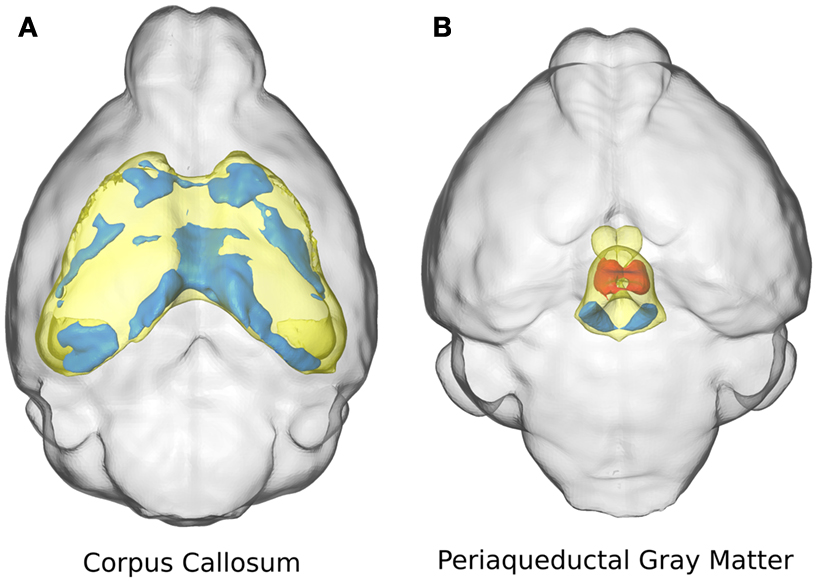
Figure 3. The relative volume differences in the corpus callosum (A) and the periaqueductal gray matter (B) are highlighted. The specified anatomical regions are displayed in yellow. Significant relative volume increases are displayed in red while significant volume decreases are displayed in blue.
A large bilateral decrease in the lateral wings of the dorsal raphe nuclei are visualized in Figure 4, indicating the connection between the ITGβ3 gene and the development of the serotonin system. The bar graph in Figure 4 displays the difference within the indicated voxel.
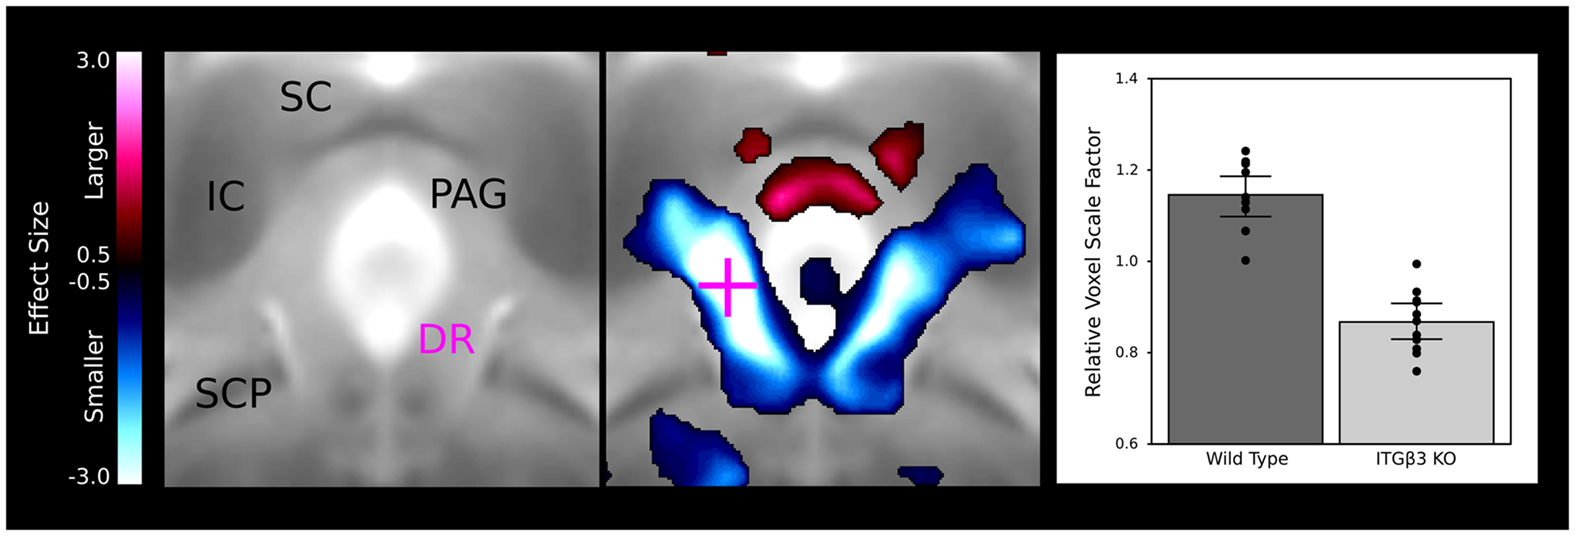
Figure 4. The dorsal raphe nuclei in the ITGβ3 show a large decrease in the lateral wings located within the periaqueductal gray matter. The relative volume changes in the highlighted voxel (pink cross) are displayed in the bar graph on the left. IC, inferior colliculus; SC, superior colliculus; PAG, periaqueductal gray matter; SCP, superior cerebellar peduncle; and DR, dorsal raphe nuclei.
The hippocampal changes seem to be localized in specific regions (Figure 5), for example there is a large bilateral decrease in the CA1 region of the hippocampus. The differences also seem to follow the dentate gyrus and stratum granulosum more than the hippocampus, which is also evident in the relative volume differences for the three structures (Table 1).
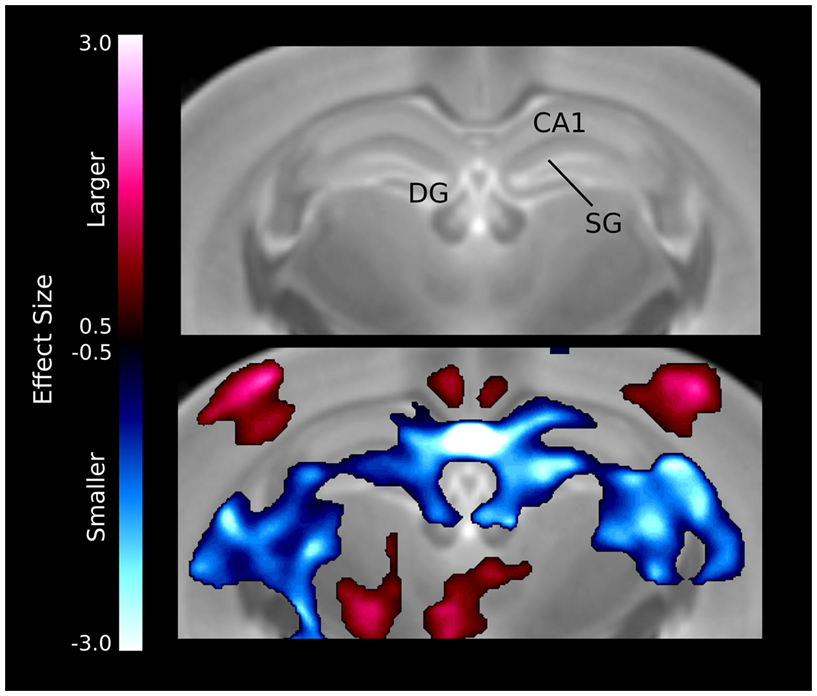
Figure 5. Volume differences in the hippocampus. The differences are localized around the midline CA1 region as well as the dentate gyrus (DG) and stratum granulosum (SG).
The strongest differences in the cerebellum can be seen in Figure 6, which was thresholded to show only the voxels with the largest differences. Interestingly, differences are localized to two of the deep cerebellar nuclei, namely the fastigial nuclei (red arrows) and the nucleus interpositus (yellow arrow). Also there was a large decrease in the anterior cerebellar vermis (green arrow).
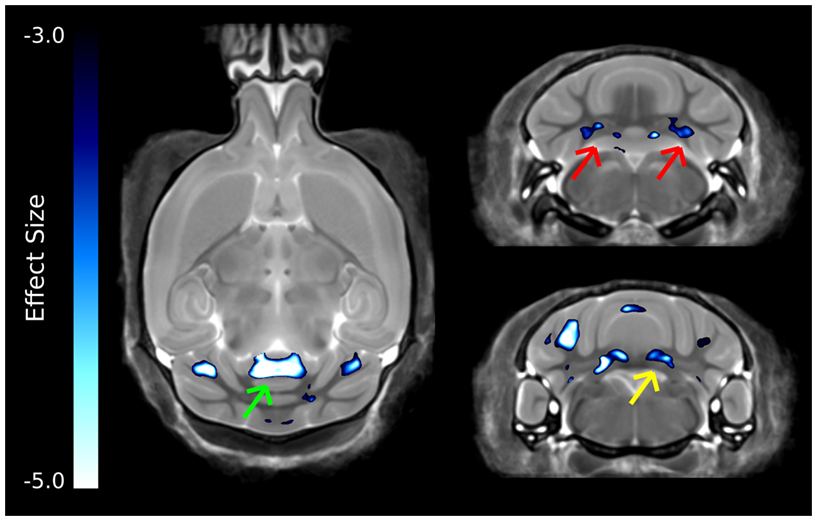
Figure 6. The most highly significant changes in the cerebellum. These differences have effect sizes smaller (i.e., more significant) than −3.0. Highlighted in this figure are strong changes in the anterior cerebellar vermis (green arrow), fastigial nucleus (red arrows), and nucleus interpositus (yellow arrows).
Discussion
The most striking difference between the ITGβ3 mouse and its corresponding WT was the large difference in total brain volume (Figure 1). The 11% decrease in brain volume was larger than previous studies in mouse models related to autism. In the Neuroligin3 R451C knockin (NL3 KI) an 8% decrease in total brain volume was found (Ellegood et al., 2011). In mouse models of fragile X syndrome (FXS) and 16p11.2 deletion/duplication syndrome, both of which are relevant to autism, no significant total brain volume differences were found (Ellegood et al., 2010; Horev et al., 2011). Furthermore, neuroanatomy differences in the ITGβ3 were more widespread. Relative volume measurements in the ITGβ3 mouse found 30 of the 62 regions to be significantly different at and FDR of <5%. In the other autism studies, significant relative volume measurements at an FDR of <5% were found in 14 regions in the NL3 KI mouse, 11 in the 16p11.2 deletion, 0 in the 16p11.2 duplication, and 1 in the FXS model (Ellegood et al., 2010, 2011; Horev et al., 2011). Contrary to what is found in the ITGβ3, a well replicated finding in human autism is an increase in total brain volume. Although, the ITGβ3 mice used in this study were adult animals, and the human brain overgrowth is reported in children, which has been hypothesized to have an age-dependent effect (Amaral et al., 2008; Stanfield et al., 2008; Anagnostou and Taylor, 2011). In spite of this smaller overall brain volume, relative volume increases in the cortical gray matter were found, specifically in the frontal (+5.5%, FDR < 0.01) and parieto-temporal lobe (+5.4%, FDR < 0.001), as well as in the entorhinal cortex (+7.8%, FDR < 0.001). No significant volume change were found in the occipital lobe (−0.1%, FDR = 0.98). Interestingly, the frontal and parieto-temporal lobes are reported to be increased in the autistic children compared to controls. A similar increase was not found in the occipital lobe (Courchesne et al., 2011).
Neuroanatomical observations in autism has shown reduced neuronal cell size and increased cellular packing density in the hippocampus, subiculum, entorhinal cortex, amygdala, mammilary body, anterior cingulated gyrus, and septum (Bauman and Kemper, 2005). Of these seven regions with notable cellular differences in human autism five had significant relative volume differences in the ITGβ3 mouse, hippocampus (−4%), subiculum (−5%), entorhinal cortex (+8%), amygdala (+7%), and mammilary bodies (+10%); one had no significant difference, the septum; and one was not examined as the cingulate gyrus is included within our corpus callosum region. The reduced neuronal cell size and increased pack density may only account for those regions that were smaller in the ITGβ3 mouse, however. The reported neuroanatomical assessment of these structures could certainly be the cause of these volume difference seen in the ITGβ3 brains. However, it would require an extensive histological examination to determine what the specific driving force is behind these changes, which was beyond the scope of this study. Similarly, within the hippocampus the CA1 regions were noted after golgi staining to have a decrease complexity and the extent of dendritic arbors (Bauman and Kemper, 2005), this could be the reason for the bilateral decrease found in the CA1, shown in Figure 5. The entorhinal cortex has also been linked to schizophrenia and found to be reduced in volume (Falkai et al., 2000). Schizophrenia and autism have a number of overlapping genetic findings (neurexin1 for example; Voineskos et al., 2012), so there might be a similar mechanism causing the difference, although an increase in the size of the entorhinal cortex was found in the ITGβ3 mouse.
Many white matter structures were smaller in the ITGβ3 mouse. Sixteen of the 23 white matter structures in the atlas had significantly smaller relative volumes compared to the WT at FDR < 10%. White matter differences have become common findings in human autism, with the theory that children with autism undergo a period of abnormal white matter development (Ecker et al., 2012). White matter deficits in autism have often been thought of as atypical or under-connectivity (Geschwind and Levitt, 2007), and therefore the large decreases found in the white matter in this model would add weight to that finding. The corpus callosum, the largest most well formed white matter structure in the mouse, had an absolute volume decrease of 17% compared to the WT, which corresponded to a relative volume decrease of 7.1%. This is consistent with a number of volumetric findings in human autism (Cody et al., 2002; Stanfield et al., 2008; Verhoeven et al., 2010). This difference has also been seen in the Neuroligin3 R451C knockin (NL3 KI) mouse model, also associated with autism (Ellegood et al., 2011). In the NL3 KI mouse, the changes in the corpus callosum along the midline were localized in the posterior region, which is consistent with the ITGβ3 mouse seen in Figure 3A. These differences in the posterior part of the corpus callosum have also been reported in human autism populations (Egaas et al., 1995; Piven et al., 1997).
A number of regions affected in the ITGβ3 mouse are closely related to the serotonin system and human autism. Perhaps the most interesting finding was the bilateral decrease in the lateral wings of the dorsal raphe nuclei (Figure 4). The initial formation of the serotonergic neurons is in the brain stem, specifically in the raphe nuclei (Takahashi et al., 1986). From these nuclei the serotonin neurons project to a number of different areas in the brain (Sodhi and Sanders-Bush, 2004). Changes in these nuclei, therefore, could have long lasting effects on many other regions of the brain. Specifically, a number of serotonergic projections from the raphe nuclei travel to the cortex, which could be the cause of the relative volume increases in three of the four cortical structures (Table 1). Also, one of the serotonergic projections to the hippocampus originates from the lateral wings of the dorsal raphe nuclei (Jacobs and Azmitia, 1992), which is the exact area outlined in Figure 4. The smaller dorsal raphe nuclei, therefore, may be causing a corresponding decrease in size in the hippocampus. The hippocampus has also been long reported as a region of interest in autism (Aylward et al., 1999). In this current study, the hippocampal region as a whole is divided into three regions, namely the dentate gyrus, the stratum granulosum, and the residual hippocampus. The residual hippocampus in the ITGβ3 mouse has a relative volume decrease of −4.3%, the dentate gyrus decreased by −7.8%, and the stratum granulosum decreased by −11.8%. The dentate gyrus and stratum granulosum are more affected than the residual hippocampus, and this is also seen in Figure 5. Yan et al. (1997) determined that a reduction of serotonin in the early postnatal period could result in changes in the morphology of the dentate granule cells, particularly in the synaptic spine density. In fact dendritic spine density was reduced by 27% in all ages in that study. This change in the morphology in the dentate granule cells may account for the stronger effect in dentate gyrus than the rest of the hippocampus, but it remains to be seen whether that is the only effect causing the difference.
The cerebellum has also been implicated in human autism, in particular the cerebellar vermis (Courchesne et al., 1988), which has been found to be underdeveloped or decreased in size. Further, a number of changes have been found in the cellular organization of the cerebellum, with reported findings of reductions in the density of Purkinje cells (Palmen et al., 2004; Bauman and Kemper, 2005). Volumetric changes in the cerebellum have been studied quite extensively using MRI in human autism often finding increases in the overall volume of the cerebellum, which was reported to be consistent with the total brain volume change (Amaral et al., 2008). This is in contrast to what was found in the ITGβ3 mouse where the cerebellar changes are quite drastic, with relative volume decreases in the arbor vita of the cerebellum (the white matter part, which included the deep cerebellar nuclei) of −12.8% and the cerebellar cortex of −9.0%. While the cerebellum as a whole was drastically different in the ITGβ3 mouse, a very strong decrease was found in the size of the anterior cerebellar vermis (Figure 6, green arrow). Furthermore, a number a large changes were also localized to two of the deep cerebellar nuclei (Figure 6), namely the fastigial nuclei (red arrows) and the nucleus interpositus (yellow arrow). These two deep cerebellar nuclei were also implicated in FXS (Ellegood et al., 2010), but in that study the difference was more subtle.
Behaviorally, the ITGβ3 KO mouse shows a lack of preference for social novelty (Carter et al., 2011), in the study by Carter et al. (2011) they state that it would be tempting to label this deficit as a hippocampal-associated memory deficit and they indicate that previous work has suggested that social memory may be more dependent on the amygdala and the olfactory bulbs (Ferguson et al., 2001; Adolphs, 2009; Carter et al., 2011). With the differences reported here in the amygdala, hippocampus, and olfactory bulbs (+8% relative volume), it may in fact be a combination of all three regions that is causing this change in social novelty. Also reported in that study was an increase in grooming behavior in novel environments (Carter et al., 2011), and while it may be tempting to label this as an OCD phenotype, there is a considerable amount of overlap between the repetitive behaviors seen in OCD and autism in humans (Zandt et al., 2009). Clinically, the distinction is often based on the sophistication of the compulsion or obsession, which may be inaccessible in the mouse (Zandt et al., 2007). The ITGβ3 could be modeling aspects of both conditions and yield insight into the genetic basis of repetitive behaviors. The increased grooming behavior was thought to implicate a cortico-striatal circuit in mice, and has been reported previously in mouse models of OCD (Welch et al., 2007; Shmelkov et al., 2010). In the Shmelkov et al. (2010) study, the mice had abnormalities in the striatal anatomy, specifically a decrease in volume, and an over activation of the orbitofrontal cortex. Similarly, the striatum in the ITGβ3 KO mouse was also decreased by −3.7% in relative volume and may be the cause of this increased grooming seen in both models. A larger relative volume of the frontal cortex was also found in the ITGβ3 mice (+5.5%), which could be due to the over activation reported in the orbitofrontal cortex in the OCD mice.
Future histological examination of these mice is required to answer some of the open ended questions left by this study. Specifically, what is reason behind the smaller dorsal raphe nuclei? Is it a cellular loss that is causing the difference? Is there a loss in the number of projections from the nuclei? With regards to the hippocampus, are the decreases in the dentate gyrus caused by the morphological change in the synaptic spine density as was hypothesized? Or is there an unknown factor contributing to this difference? The strong changes in the deep cerebellar nuclei are intriguing, specifically as they are related to previous findings in a Fragile X mouse model. In that study it was hypothesize that neuronal loss may contribute to the changes in the nuclei (Ellegood et al., 2010), is that the same for the ITGβ3 mouse model?
In summary, the ITGβ3 mouse model has a number of interesting changes which are related to both autism and the serotonin system in general, and based on the behavioral findings in these mice may also have relevance to other brain disorders, such as OCD. The ITGβ3 KO mouse also appears to have a more severe anatomical phenotype that previously examined mouse models related to autism. The changes in the lateral wings of the dorsal raphe nuclei are particularly intriguing, since that nucleus is so integral to the development of many different brain regions. Further investigation on the cause of some of these differences is required; however, this study was an important first step in the investigation of the neuroanatomy of the ITGβ3 mouse model.
Conflict of Interest Statement
The authors declare that the research was conducted in the absence of any commercial or financial relationships that could be construed as a potential conflict of interest.
Acknowledgments
The authors would like to acknowledge Dr. Paul Arnold, for useful discussions on obsessive compulsive disorder in humans and the mouse. Further, we acknowledge the Ontario Mental Heath Foundation (OMHF) for salary support (Jacob Ellegood). This research was also conducted with the support of the Canadian Institute for Health Research (CIHR) and the Ontario Brain Institute (OBI). OBI was created to become an internationally recognized center of excellence in brain and neuroscience research. This independent non-profit corporation, funded partially by the Ontario government, is dedicated to improving approaches to the prevention, early diagnosis, treatment and management of neurological, and psychiatric disorders. The opinions, results, and conclusions are those of the authors and no endorsement by the Ontario Brain Institute is intended or should be inferred.
References
Abrahams, B. S., and Geschwind, D. H. (2010). Connecting genes to brain in the autism spectrum disorders. Arch. Neurol. 67, 395–399.
Adolphs, R. (2009). The social brain: neural basis of social knowledge. Annu. Rev. Psychol. 60, 693–716.
Amaral, D. G., Schumann, C. M., and Nordahl, C. W. (2008). Neuroanatomy of autism. Trends Neurosci. 31, 137–145.
Anagnostou, E., and Taylor, M. J. (2011). Review of neuroimaging in autism spectrum disorders: what have we learned and where we go from here. Mol. Autism 2, 4.
Avants, B. B., Yushkevich, P., Pluta, J., Minkoff, D., Korczykowski, M., Detre, J., and Gee, J. C. (2010). The optimal template effect in hippocampus studies of diseased populations. Neuroimage 49, 2457–2466.
Aylward, E. H., Minshew, N. J., Goldstein, G., Honeycutt, N. A., Augustine, A. M., Yates, K. O., Barta, P. E., and Pearlson, G. D. (1999). MRI volumes of amygdala and hippocampus in non-mentally retarded autistic adolescents and adults. Neurology 53, 2145–2150.
Bailey, A., Le Couteur, A., Gottesman, I., Bolton, P., Simonoff, E., Yuzda, E., and Rutter, M. (1995). Autism as a strongly genetic disorder: evidence from a British twin study. Psychol. Med. 25, 63–77.
Basu, S. N., Kollu, R., and Banerjee-Basu, S. (2009). AutDB: a gene reference resource for autism research. Nucleic Acids Res. 37, D832–D836.
Bauman, M. L., and Kemper, T. L. (2005). Neuroanatomic observations of the brain in autism: a review and future directions. Int. J. Dev. Neurosci. 23, 183–187.
Carter, M. D., Shah, C. R., Muller, C. L., Crawley, J. N., Carneiro, A. M., and Veenstra-Vanderweele, J. (2011). Absence of preference for social novelty and increased grooming in integrin beta3 knockout mice: initial studies and future directions. Autism Res. 4, 57–67.
Chubakov, A. R., Tsyganova, V. G., and Sarkisova, E. F. (1993). The stimulating influence of the raphe nuclei on the morphofunctional development of the hippocampus during their combined cultivation. Neurosci. Behav. Physiol. 23, 271–276.
Chugani, D. C. (2011). “Neurotransmitters,” in Autism Spectrum Disorders, eds D. G. Amaral, G. Dawson, and D. H. Geschwind (New York: Oxford University Press), 566–575.
Cody, H., Pelphrey, K., and Piven, J. (2002). Structural and functional magnetic resonance imaging of autism. Int. J. Dev. Neurosci. 20, 421–438.
Collins, D. L., Neelin, P., Peters, T. M., and Evans, A. C. (1994). Automatic 3D intersubject registration of MR volumetric data in standardized talairach space. J. Comput. Assist. Tomogr. 18, 192–205.
Courchesne, E., Campbell, K., and Solso, S. (2011). Brain growth across the life span in autism: age-specific changes in anatomical pathology. Brain Res. 1380, 138–145.
Courchesne, E., Yeung-Courchesne, R., Press, G. A., Hesselink, J. R., and Jernigan, T. L. (1988). Hypoplasia of cerebellar vermal lobules VI and VII in autism. N. Engl. J. Med. 318, 1349–1354.
Coutinho, A. M., Sousa, I., Martins, M., Correia, C., Morgadinho, T., Bento, C., Marques, C., Ataide, A., Miguel, T. S., Moore, J. H., Oliveira, G., and Vicente, A. M. (2007). Evidence for epistasis between SLC6A4 and ITGB3 in autism etiology and in the determination of platelet serotonin levels. Hum. Genet. 121, 243–256.
Dorr, A. E., Lerch, J. P., Spring, S., Kabani, N., and Henkelman, R. M. (2008). High resolution three-dimensional brain atlas using an average magnetic resonance image of 40 adult C57Bl/6J mice. Neuroimage 42, 60–69.
Ecker, C., Suckling, J., Deoni, S. C., Lombardo, M. V., Bullmore, E. T., Baron-Cohen, S., Catani, M., Jezzard, P., Barnes, A., Bailey, A. J., Williams, S. C., and Murphy, D. G. (2012). Brain anatomy and its relationship to behavior in adults with autism spectrum disorder: a multicenter magnetic resonance imaging study. Arch. Gen. Psychiatry 69, 195–209.
Egaas, B., Courchesne, E., and Saitoh, O. (1995). Reduced size of corpus callosum in autism. Arch. Neurol. 52, 794–801.
Ellegood, J., Lerch, J. P., and Henkelman, R. M. (2011). Brain abnormalities in a neuroligin3 R451C knockin mouse model associated with autism. Autism Res. 4, 368–376.
Ellegood, J., Pacey, L. K., Hampson, D. R., Lerch, J. P., and Henkelman, R. M. (2010). Anatomical phenotyping in a mouse model of fragile X syndrome with magnetic resonance imaging. Neuroimage 53, 1023–1029.
Falkai, P., Schneider-Axmann, T., and Honer, W. G. (2000). Entorhinal cortex pre-alpha cell clusters in schizophrenia: quantitative evidence of a developmental abnormality. Biol. Psychiatry 47, 937–943.
Ferguson, J. N., Aldag, J. M., Insel, T. R., and Young, L. J. (2001). Oxytocin in the medial amygdala is essential for social recognition in the mouse. J. Neurosci. 21, 8278–8285.
Frazier, T. W., and Hardan, A. Y. (2009). A meta-analysis of the corpus callosum in autism. Biol. Psychiatry 66, 935–941.
Genovese, C. R., Lazar, N. A., and Nichols, T. (2002). Thresholding of statistical maps in functional neuroimaging using the false discovery rate. Neuroimage 15, 870–878.
Geschwind, D. H., and Levitt, P. (2007). Autism spectrum disorders: developmental disconnection syndromes. Curr. Opin. Neurobiol. 17, 103–111.
Hanna, G. L., Yuwiler, A., and Cantwell, D. P. (1991). Whole blood serotonin in juvenile obsessive-compulsive disorder. Biol. Psychiatry 29, 738–744.
Hodivala-Dilke, K. M., Mchugh, K. P., Tsakiris, D. A., Rayburn, H., Crowley, D., Ullman-Cullere, M., Ross, F. P., Coller, B. S., Teitelbaum, S., and Hynes, R. O. (1999). Beta3-integrin-deficient mice are a model for Glanzmann thrombasthenia showing placental defects and reduced survival. J. Clin. Invest. 103, 229–238.
Horev, G., Ellegood, J., Lerch, J. P., Son, Y. E., Muthuswamy, L., Vogel, H., Krieger, A. M., Buja, A., Henkelman, R. M., Wigler, M., and Mills, A. A. (2011). Dosage-dependent phenotypes in models of 16p11.2 lesions found in autism. Proc. Natl. Acad. Sci. U.S.A. 108, 17076–17081.
Hughes, C. W., Petty, F., Sheikha, S., and Kramer, G. L. (1996). Whole-blood serotonin in children and adolescents with mood and behavior disorders. Psychiatry Res 65, 79–95.
Jacobs, B. L., and Azmitia, E. C. (1992). Structure and function of the brain serotonin system. Physiol. Rev. 72, 165–229.
Kosofsky, B. E., and Molliver, M. E. (1987). The serotoninergic innervation of cerebral cortex: different classes of axon terminals arise from dorsal and median raphe nuclei. Synapse 1, 153–168.
Lamb, J. A. (2011). “Whole genome linkage and association analyses,” in Autism Spectrum Disorders, eds D. G. Amaral, G. Dawson, and D. H. Geschwind (New York: Oxford University Press), 669–689.
Lauder, J. M. (1990). Ontogeny of the serotonergic system in the rat: serotonin as a developmental signal. Ann. N. Y. Acad. Sci. 600, 297–313; discussion 314.
Lazoff, T., Zhong, L., Piperni, T., and Fombonne, E. (2010). Prevalence of pervasive developmental disorders among children at the English Montreal School Board. Can. J. Psychiatry 55, 715–720.
Lerch, J. P., Carroll, J. B., Spring, S., Bertram, L. N., Schwab, C., Hayden, M. R., and Henkelman, R. M. (2008a). Automated deformation analysis in the YAC128 Huntington disease mouse model. Neuroimage 39, 32–39.
Lerch, J. P., Pruessner, J., Zijdenbos, A. P., Collins, D. L., Teipel, S. J., Hampel, H., and Evans, A. C. (2008b). Automated cortical thickness measurements from MRI can accurately separate Alzheimer’s patients from normal elderly controls. Neurobiol. Aging 29, 23–30.
Lerch, J. P., Pruessner, J. C., Zijdenbos, A., Hampel, H., Teipel, S. J., and Evans, A. C. (2005). Focal decline of cortical thickness in Alzheimer’s disease identified by computational neuroanatomy. Cereb. Cortex 15, 995–1001.
Lerch, J. P., Sled, J. G., and Henkelman, R. M. (2011a). MRI phenotyping of genetically altered mice. Methods Mol. Biol. 711, 349–361.
Lerch, J. P., Yiu, A. P., Martinez-Canabal, A., Pekar, T., Bohbot, V. D., Frankland, P. W., Henkelman, R. M., Josselyn, S. A., and Sled, J. G. (2011b). Maze training in mice induces MRI-detectable brain shape changes specific to the type of learning. Neuroimage 54, 2086–2095.
Ma, D. Q., Rabionet, R., Konidari, I., Jaworski, J., Cukier, H. N., Wright, H. H., Abramson, R. K., Gilbert, J. R., Cuccaro, M. L., Pericak-Vance, M. A., and Martin, E. R. (2010). Association and gene-gene interaction of SLC6A4 and ITGB3 in autism. Am. J. Med. Genet. B Neuropsychiatr. Genet. 153B, 477–483.
Mei, H., Cuccaro, M. L., and Martin, E. R. (2007). Multifactor dimensionality reduction-phenomics: a novel method to capture genetic heterogeneity with use of phenotypic variables. Am. J. Hum. Genet. 81, 1251–1261.
Moy, S. S., Nadler, J. J., Magnuson, T. R., and Crawley, J. N. (2006). Mouse models of autism spectrum disorders: the challenge for behavioral genetics. Am. J. Med. Genet. C Semin. Med. Genet. 142C, 40–51.
Moy, S. S., Nadler, J. J., Young, N. B., Perez, A., Holloway, L. P., Barbaro, R. P., Barbaro, J. R., Wilson, L. M., Threadgill, D. W., Lauder, J. M., Magnuson, T. R., and Crawley, J. N. (2007). Mouse behavioral tasks relevant to autism: phenotypes of 10 inbred strains. Behav. Brain Res. 176, 4–20.
Munson, J., Dawson, G., Sterling, L., Beauchaine, T., Zhou, A., Elizabeth, K., Lord, C., Rogers, S., Sigman, M., Estes, A., and Abbott, R. (2008). Evidence for latent classes of IQ in young children with autism spectrum disorder. Am. J. Ment. Retard. 113, 439–452.
Nadler, J. J., Moy, S. S., Dold, G., Trang, D., Simmons, N., Perez, A., Young, N. B., Barbaro, R. P., Piven, J., Magnuson, T. R., and Crawley, J. N. (2004). Automated apparatus for quantitation of social approach behaviors in mice. Genes Brain Behav. 3, 303–314.
Napolioni, V., Lombardi, F., Sacco, R., Curatolo, P., Manzi, B., Alessandrelli, R., Militerni, R., Bravaccio, C., Lenti, C., Saccani, M., Schneider, C., Melmed, R., Pascucci, T., Puglisi-Allegra, S., Reichelt, K. L., Rousseau, F., Lewin, P., and Persico, A. M. (2011). Family-based association study of ITGB3 in autism spectrum disorder and its endophenotypes. Eur. J. Hum. Genet. 19, 353–359.
Nieman, B. J., Flenniken, A. M., Adamson, S. L., Henkelman, R. M., and Sled, J. G. (2006). Anatomical phenotyping in the brain and skull of a mutant mouse by magnetic resonance imaging and computed tomography. Physiol. Genomics 24, 154–162.
Palmen, S. J., Van Engeland, H., Hof, P. R., and Schmitz, C. (2004). Neuropathological findings in autism. Brain 127, 2572–2583.
Partington, M. W., Tu, J. B., and Wong, C. Y. (1973). Blood serotonin levels in severe mental retardation. Dev. Med. Child Neurol. 15, 616–627.
Piven, J., Bailey, J., Ranson, B. J., and Arndt, S. (1997). An MRI study of the corpus callosum in autism. Am. J. Psychiatry 154, 1051–1056.
Radua, J., Via, E., Catani, M., and Mataix-Cols, D. (2011). Voxel-based meta-analysis of regional white-matter volume differences in autism spectrum disorder versus healthy controls. Psychol. Med. 41, 1539–1550.
Richler, J., Huerta, M., Bishop, S. L., and Lord, C. (2010). Developmental trajectories of restricted and repetitive behaviors and interests in children with autism spectrum disorders. Dev. Psychopathol. 22, 55–69.
Schain, R. J., and Freedman, D. X. (1961). Studies on 5-hydroxyindole metabolism in autistic and other mentally retarded children. J. Pediatr. 58, 315–320.
Shmelkov, S. V., Hormigo, A., Jing, D., Proenca, C. C., Bath, K. G., Milde, T., Shmelkov, E., Kushner, J. S., Baljevic, M., Dincheva, I., Murphy, A. J., Valenzuela, D. M., Gale, N. W., Yancopoulos, G. D., Ninan, I., Lee, F. S., and Rafii, S. (2010). Slitrk5 deficiency impairs corticostriatal circuitry and leads to obsessive-compulsive-like behaviors in mice. Nat. Med. 16, 598–602.
Smith, S. M., and Nichols, T. E. (2009). Threshold-free cluster enhancement: addressing problems of smoothing, threshold dependence and localisation in cluster inference. Neuroimage 44, 83–98.
Sodhi, M. S., and Sanders-Bush, E. (2004). Serotonin and brain development. Int. Rev. Neurobiol. 59, 111–174.
Spring, S., Lerch, J. P., and Henkelman, R. M. (2007). Sexual dimorphism revealed in the structure of the mouse brain using three-dimensional magnetic resonance imaging. Neuroimage 35, 1424–1433.
Spring, S., Lerch, J. P., Wetzel, M. K., Evans, A. C., and Henkelman, R. M. (2010). Cerebral asymmetries in 12-week-old C57Bl/6J mice measured by magnetic resonance imaging. Neuroimage 50, 409–415.
Stanfield, A. C., Mcintosh, A. M., Spencer, M. D., Philip, R., Gaur, S., and Lawrie, S. M. (2008). Towards a neuroanatomy of autism: a systematic review and meta-analysis of structural magnetic resonance imaging studies. Eur. Psychiatry 23, 289–299.
Steffenburg, S., Gillberg, C., Hellgren, L., Andersson, L., Gillberg, I. C., Jakobsson, G., and Bohman, M. (1989). A twin study of autism in Denmark, Finland, Iceland, Norway and Sweden. J. Child. Psychol. Psychiatry 30, 405–416.
Takahashi, H., Nakashima, S., Ohama, E., Takeda, S., and Ikuta, F. (1986). Distribution of serotonin-containing cell bodies in the brainstem of the human fetus determined with immunohistochemistry using antiserotonin serum. Brain Dev. 8, 355–365.
Thomas, D. L., De Vita, E., Roberts, S., Turner, R., Yousry, T. A., and Ordidge, R. J. (2004). High-resolution fast spin echo imaging of the human brain at 4.7 T: implementation and sequence characteristics. Magn. Reson. Med. 51, 1254–1264.
Verhoeven, J. S., De Cock, P., Lagae, L., and Sunaert, S. (2010). Neuroimaging of autism. Neuroradiology 52, 3–14.
Via, E., Radua, J., Cardoner, N., Happe, F., and Mataix-Cols, D. (2011). Meta-analysis of gray matter abnormalities in autism spectrum disorder: should Asperger disorder be subsumed under a broader umbrella of autistic spectrum disorder? Arch. Gen. Psychiatry 68, 409–418.
Voineskos, A. N., Lett, T. A., Lerch, J. P., Tiwari, A. K., Ameis, S. H., Rajji, T. K., Muller, D. J., Mulsant, B. H., and Kennedy, J. L. (2012). Neurexin-1 and frontal lobe white matter: an overlapping intermediate phenotype for schizophrenia and autism spectrum disorders. PLoS ONE 6, e20982. doi:10.1371/journal.pone.0020982
Weiss, L. A., Kosova, G., Delahanty, R. J., Jiang, L., Cook, E. H., Ober, C., and Sutcliffe, J. S. (2006a). Variation in ITGB3 is associated with whole-blood serotonin level and autism susceptibility. Eur. J. Hum. Genet. 14, 923–931.
Weiss, L. A., Ober, C., and Cook, E. H. Jr. (2006b). ITGB3 shows genetic and expression interaction with SLC6A4. Hum. Genet. 120, 93–100.
Weiss, L. A., Veenstra-Vanderweele, J., Newman, D. L., Kim, S. J., Dytch, H., Mcpeek, M. S., Cheng, S., Ober, C., Cook, E. H. Jr., and Abney, M. (2004). Genome-wide association study identifies ITGB3 as a QTL for whole blood serotonin. Eur. J. Hum. Genet. 12, 949–954.
Welch, J. M., Lu, J., Rodriguiz, R. M., Trotta, N. C., Peca, J., Ding, J. D., Feliciano, C., Chen, M., Adams, J. P., Luo, J., Dudek, S. M., Weinberg, R. J., Calakos, N., Wetsel, W. C., and Feng, G. (2007). Cortico-striatal synaptic defects and OCD-like behaviours in Sapap3-mutant mice. Nature 448, 894–900.
Whitaker-Azmitia, P. M., Druse, M., Walker, P., and Lauder, J. M. (1996). Serotonin as a developmental signal. Behav. Brain Res. 73, 19–29.
Yan, W., Wilson, C. C., and Haring, J. H. (1997). Effects of neonatal serotonin depletion on the development of rat dentate granule cells. Brain Res. Dev. Brain Res. 98, 177–184.
Yang, M., Silverman, J. L., and Crawley, J. N. (2011). Automated three-chambered social approach task for mice. Curr. Protoc. Neurosci. 8, Unit 8.26.
Zandt, F., Prior, M., and Kyrios, M. (2007). Repetitive behaviour in children with high functioning autism and obsessive compulsive disorder. J. Autism Dev. Disord. 37, 251–259.
Keywords: magnetic resonance imaging, autism, serotonin, ITGB3, voxel based morphometry, volume measurements, brain
Citation: Ellegood J, Henkelman RM and Lerch JP (2012) Neuroanatomical assessment of the integrin β3 mouse model related to autism and the serotonin system using high resolution MRI. Front. Psychiatry 3:37. doi: 10.3389/fpsyt.2012.00037
Received: 01 February 2012; Accepted: 09 April 2012;
Published online: 26 April 2012.
Edited by:
Aristotle Voineskos, Centre for Addiction and Mental Health, CanadaReviewed by:
Paul Croarkin, Mayo Clinic, USAJerome Joseph Maller, Monash Alfred Psychiatry Research Centre, Australia
Copyright: © 2012 Ellegood, Henkelman and Lerch. This is an open-access article distributed under the terms of the Creative Commons Attribution Non Commercial License, which permits non-commercial use, distribution, and reproduction in other forums, provided the original authors and source are credited.
*Correspondence: Jacob Ellegood, Mouse Imaging Centre, Hospital for Sick Children, Toronto Centre for Phenogenomics, 25 Orde Street, Toronto, ON, Canada M5T 3H7. e-mail: jacob@phenogenomics.ca