 Sweta Pattnaik†‡
 Jogesh Murmu
 Ritik Agrawal
 Tanveer Rehman
 Srikanta Kanungo
 Sanghamitra Pati
- Department of Health Research, ICMR-Regional Medical Research Center, Bhubaneswar, Odisha, India
There is a need to provide an overview of the disability burden in India as there are limited studies. The present study aimed to estimate the prevalence and assess the pattern and determinants of disability in India. We analyzed National Family Health Survey-5 data using the “svyset” command in STATA software. We assessed the correlates by multivariable regression and reported an adjusted prevalence ratio (aPR) with a 95% confidence interval (CI). QGIS 3.2.1 software was used for spatial analysis of distributions of different disabilities. The mean (SD) age of 28,43,917 respondents was 30.82 (20.62) years, with 75.83% (n = 21,56,633) and 44.44% (n = 12,63,086) of them being from a rural area and were not educated, respectively. The overall prevalence of disability was 4.52% [(95% CI: 4.48–4.55), n = 1,28,528]. Locomotor disabilities accounted for 44.70% of all disabilities (n = 51,659), followed by mental disabilities (20.28%, n = 23,436). Age 75 years and above (vs. 0–14 years) [aPR: 2.65 (2.50–2.81)], male (vs. female) [aPR: 1.02 (1.0–1.04)], no education (vs. higher education) [aPR 1.62 (1.56–1.68)], unmarried (vs married) [aPR: 1.76 (1.70–1.82)], seeking the care of non-governmental organization (NGO) (vs. other) [aPR: 1.32 (1.13–1.55)] were significant independent determinants. The highest overall prevalence of locomotor was in Lakshadweep/UTs (8.88%) and Delhi (57.03%), respectively. Out of every hundred individuals in India, four have a disability. More intervention strategies should be planned, considering factors like education, residence, health promotion and caste so that the services provided by the government can be available and accessible to everyone in need.
Background
World Health Organization (WHO) defines disability as impairment, limitation, or restriction in activity caused mainly by health issues and environmental factors (1). Worldwide, about one billion (15%) individuals face some form of disability, and 20% have severe functional limitations (2). Since 80% of those with disabilities live in developing nations, it is essential to ensure their inclusion in all aspects of development (3).
Census 2011 and recently held 76th round of the National Sample Survey (NSS) estimates the prevalence of disability was 2.2% in India (4, 5). Over 10 years, India's differently-abled population increased somewhat, growing from 21.9 to 26.8 million from 2001 to 2011, respectively (4). The prevalence of disabilities continues to rise gradually with age and is highest in individuals above 60 (6, 7). In India, by 2050, 323 million (19.1% of the total population) will be 60 years and above (8, 9). India will face significant structural and budgetary hurdles due to the increase in the aging population and people with disabilities.
Functional and physical disability is positively associated with co-existing chronic illnesses (7, 10). The interaction between chronic illness and physical disability has been explored (11). Non-communicable diseases (NCDs) like cardiovascular and musculoskeletal disorders account for 66.5% of disability-adjusted life years (DALYs) in low and middle-income countries (12, 13).
According to the 2019 Global Burden of Disease (GBD) report from 369 countries, road accidents accounted for nearly 5.1% DALYs among people aged 25 to 49. In contrast, ischemic heart disease and stroke were the leading causes of DALYs among people aged 50 to 75. Both contribute to shifting the burden due to “Years lived with disability” because of NCDs and injuries (14). India is undergoing an epidemiologic shift that increases the burden of NCDs (15). As of aging populations and changing lifestyles, NCDs are quickly expanding, the prevalence and likelihood of developing non-communicable diseases would increase exponentially, resulting in an increase in DALYs (16). Increased life expectancy is a result of demographic projection, which also causes a rise in chronic disease onset, that further adversely impacts people's overall health (17). This suggests that DALY is a comprehensive measurement that quantifies specific diseases and injuries in relation to NCD (18).
The “bio-psycho-social model” encompassing one's surroundings, personal attributes, quality of life, and self-sufficiency has shifted disability from a medical to a social model (19). International Classification of Functioning, Disability and Health (ICF) has classified disability into the hearing, visual, speech, mental and locomotor (1). The most common form in India is locomotor disability (20). Locomotor and hearing disabilities are significantly more common in Indian men than in Indian women (21).
A person with a disability (PwD) generally experiences adverse socioeconomic outcomes, poverty and physiologic stress, and inequity in access to essential resources such as education, health care facilities, employment, and social participation (22). Women with disability face challenges with access to reproductive and sexual health services and information (23). As India prepares for the next decennial census and in light of its pledge to the Committee on the Rights of Persons with Disability and Sustainable Development Goals (SDG), there is a need to provide an overview of the disability rates in India (24). Only a tiny portion of the PwD population in India receives government assistance (7). Moreover, there are limited studies that go into depth about the disability. For the first time, the fifth National Family Health Survey (NFHS) (2019–21) included five disability statuses to depict the burden of disability and its associated predictors. This study aimed to estimate the prevalence of disability in India, determine the associated factors and assess the pattern and geographical distribution using data from the most recent NFHS, 2019–2021.
Methods
Study setting
India is the world's second-most populous country (1.3 billion population), with 28 states and eight union territories (UTs). The Department of Empowerment of Persons with Disabilities (Divyangjan) was carved out of the Ministry of Social Justice and Empowerment in 2012 to ensure greater focus on policy matters and to address disability issues effectively. It acts as a nodal department for greater coordination among stakeholders, organizations, state governments and related central ministries. Consequently, the schemes have intended to increase accessibility through the supply of aids and assistive devices and educational and economic empowerment through skill development and financial assistance. India has eight national institutes and 20 composite regional centers, which provide services like early detection and intervention, counseling and medical rehabilitation to PwDs (25).
Study design and study population
We conducted secondary data analysis on the NFHS-5 dataset. Initially, the proposal was submitted to Demographic Health Survey (DHS), after which authorization to use data was obtained. NFHS surveys capture data on the health and welfare of the Indian population through a nationally representative sample. We included all family members in the households surveyed. Transgender data were also provided, but we excluded them from the analysis due to their small population size (n = 180, 0.01%), which could lead to inconsistency in this study.
Sample size and sampling technique
Villages and census enumeration blocks were chosen from districts in rural and urban areas, respectively, through a two-stage sampling procedure. Data collection was done using CAPI (Computer-assisted personal interview) from June 2019 to April 2021 with an inbuilt schedule and proper maintenance of confidentiality of respondents' answers. NFHS-5 methodology, including selecting households and data collection procedures, has been meticulously described and published elsewhere (26). The questionnaire was administered to the head of the family, and a total of 28,43,917 participants of all age groups were included in our study.
Data variables and data sources
The independent variables for assessing the prevalence of disability were sociodemographic and health-seeking behaviors characteristics. Some of the covariates are age (categorized into 0–14, 15–29, 30–44, 45–59, 60–74, and 75 years and above); marital status classified as “married” (those who are currently married), “formerly/ever married” (previously ever married including divorced, widowed, not living together, separated), and “unmarried (never married)”; education according to completed years of schooling (“no education”- those who had no formal schooling, “up to primary”- < 5 years of education, “up to secondary”- 5–9 years, “higher” > 10 years); Below Poverty Level (BPL) card holder; health-seeking behavior (public, private, non-governmental organization (NGO)/trust hospitals/clinics, and others-which included those who sought treatment from pharmacy outlets, home treatment, and treatment from any other source). In NFHS-5, disability was considered present if the participant responded “yes” to the question: “If any household member, including you, have any disability?” Out of those identified as “disability present,” it was further classified into sub-categories “Hearing,” “Speech,” “Visual,” “Mental,” “Locomotor.”
Operational definitions
We have given the operational definitions of various types of disability as per the information provided in the NFHS-5 report in Supplementary File 1.
Statistical analysis
STATA 16 (Stata Corp, College Station, Texas, USA) was used for statistical analysis. Before analyzing, all flagged, missing, and no information cases were removed while recording variables. The NFHS sampling weights were used to justify the differential probabilities of participant selection and ensure the validity of our study findings. The “svyset” command was used to declare the dataset as survey type and to estimate the population's weighted proportion. The burden of disability and its predictors were estimated using the weighted prevalence and reported with a 95% confidence interval (CI). Univariate log-binomial regression was done for all the independent variables with the outcome and reported an unadjusted prevalence ratio (PR) with 95% CI. Other form of disabilities was not specified under the heading “Others” in the categories of disabilities because different types of disabilities were not clearly mentioned in the NFHS-5 dataset. Therefore, they were excluded from the table of types of disabilities, giving a total number of persons with disability (n = 11,998).
Consequently, multivariable regression was done after checking for collinearity among the variables using the variance inflation factor and reported adjusted PR with 95% CI. Variables with p < 0.05 were considered significant. To determine the regional differences in disabilities, we have assessed the overall prevalence of disabilities; along with it, we have shown the nationwide prevalence of the three most prevalent disabilities as per the current study, i.e., locomotor, mental, followed by speech. We have used QGIS 3.2.1 software (Available from: http://qgis.osgeo.org) (27). To make it nationally representative, we have used weighted data for our analysis.
Ethical consideration
There is no risk to participants because the current study is based on secondary, anonymized data obtained from DHS. Informed consent for all the respondents was obtained during the survey. The dataset used is duly acknowledged and cited wherever needed. This study has been scrutinized and declared for exemption for review by IEC as there is less than minimal risk and no linked identifiers bearing Ref: …ICMR-RMRC/IHEC-2022/150.
Results
The analysis includes a total of 28,43,917 respondents of all age groups. The respondents' mean (SD) age was 30.82 ± 20.62 years. Of the total, 26.92% were between the ages of 0 and 14 years (n = 7,65,602), 50.41% were females (n = 14,33,580), 75.83% belonged to rural residents (n = 21,56,633), and 49.99% were married (n = 14,21,809) (Table 1).
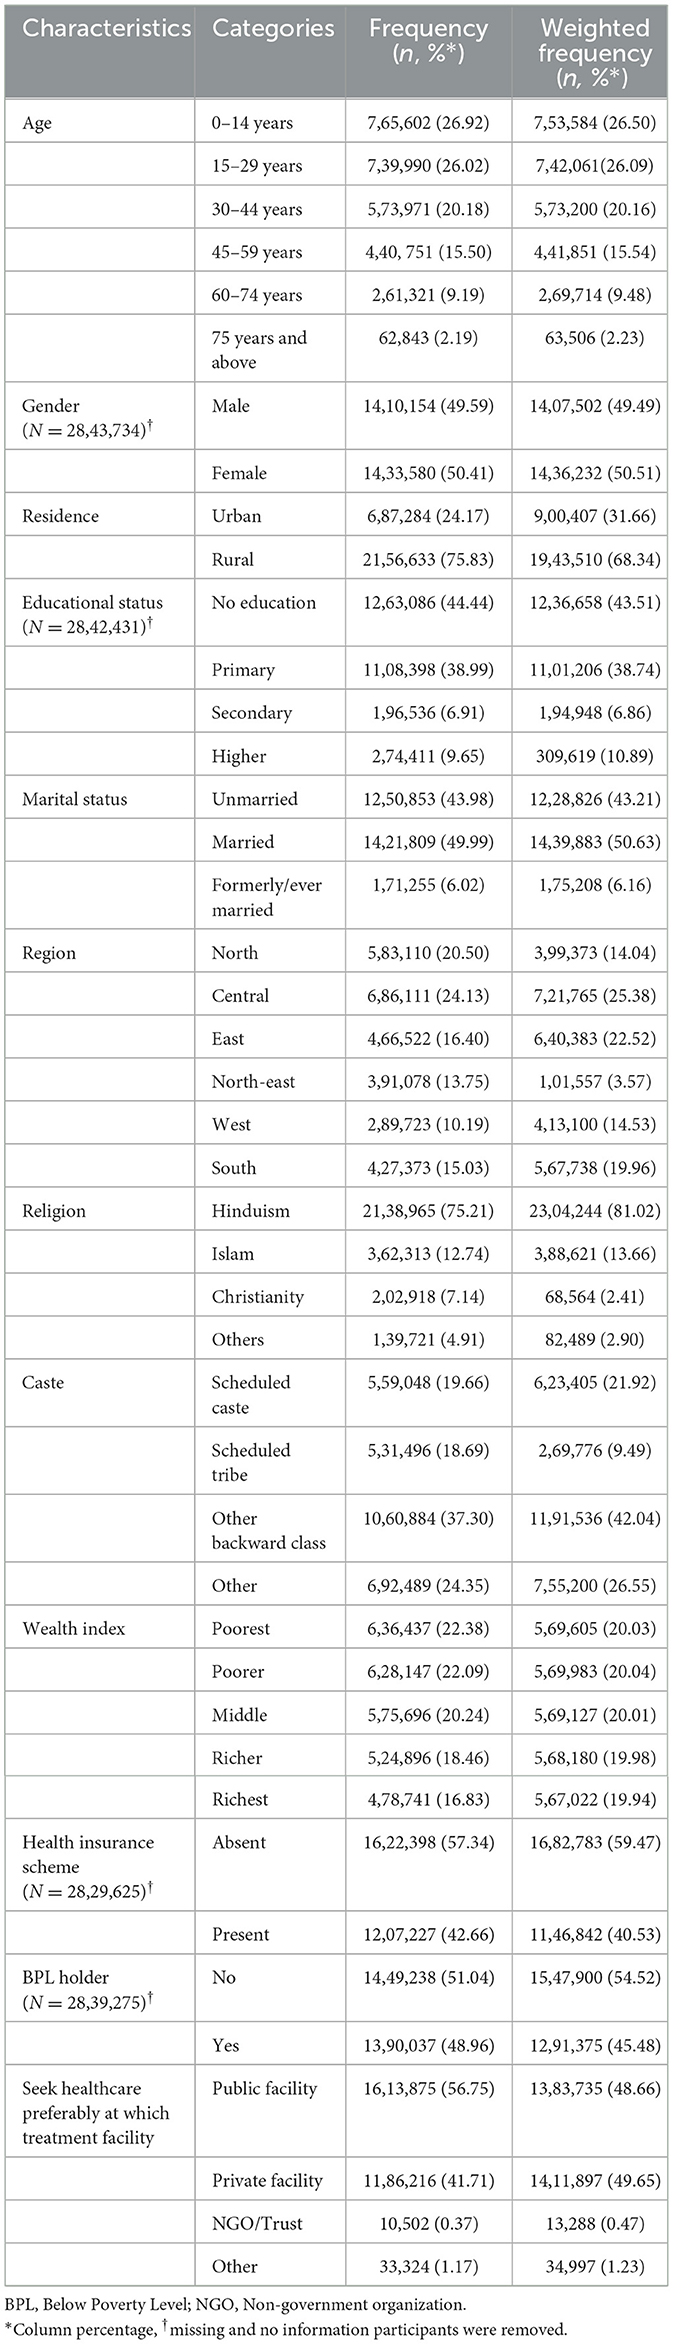
Table 1. Sociodemographic and health-seeking behavioral characteristics of the study population covered in NFHS-5 (N = 28,43,917).
The overall prevalence of disability was 4.52 % [(95% CI: 4.48–4.55), n = 1,28,528] across all age groups in India. The prevalence was highest in the age group of 75 years and above at 6.07% (Table 2).
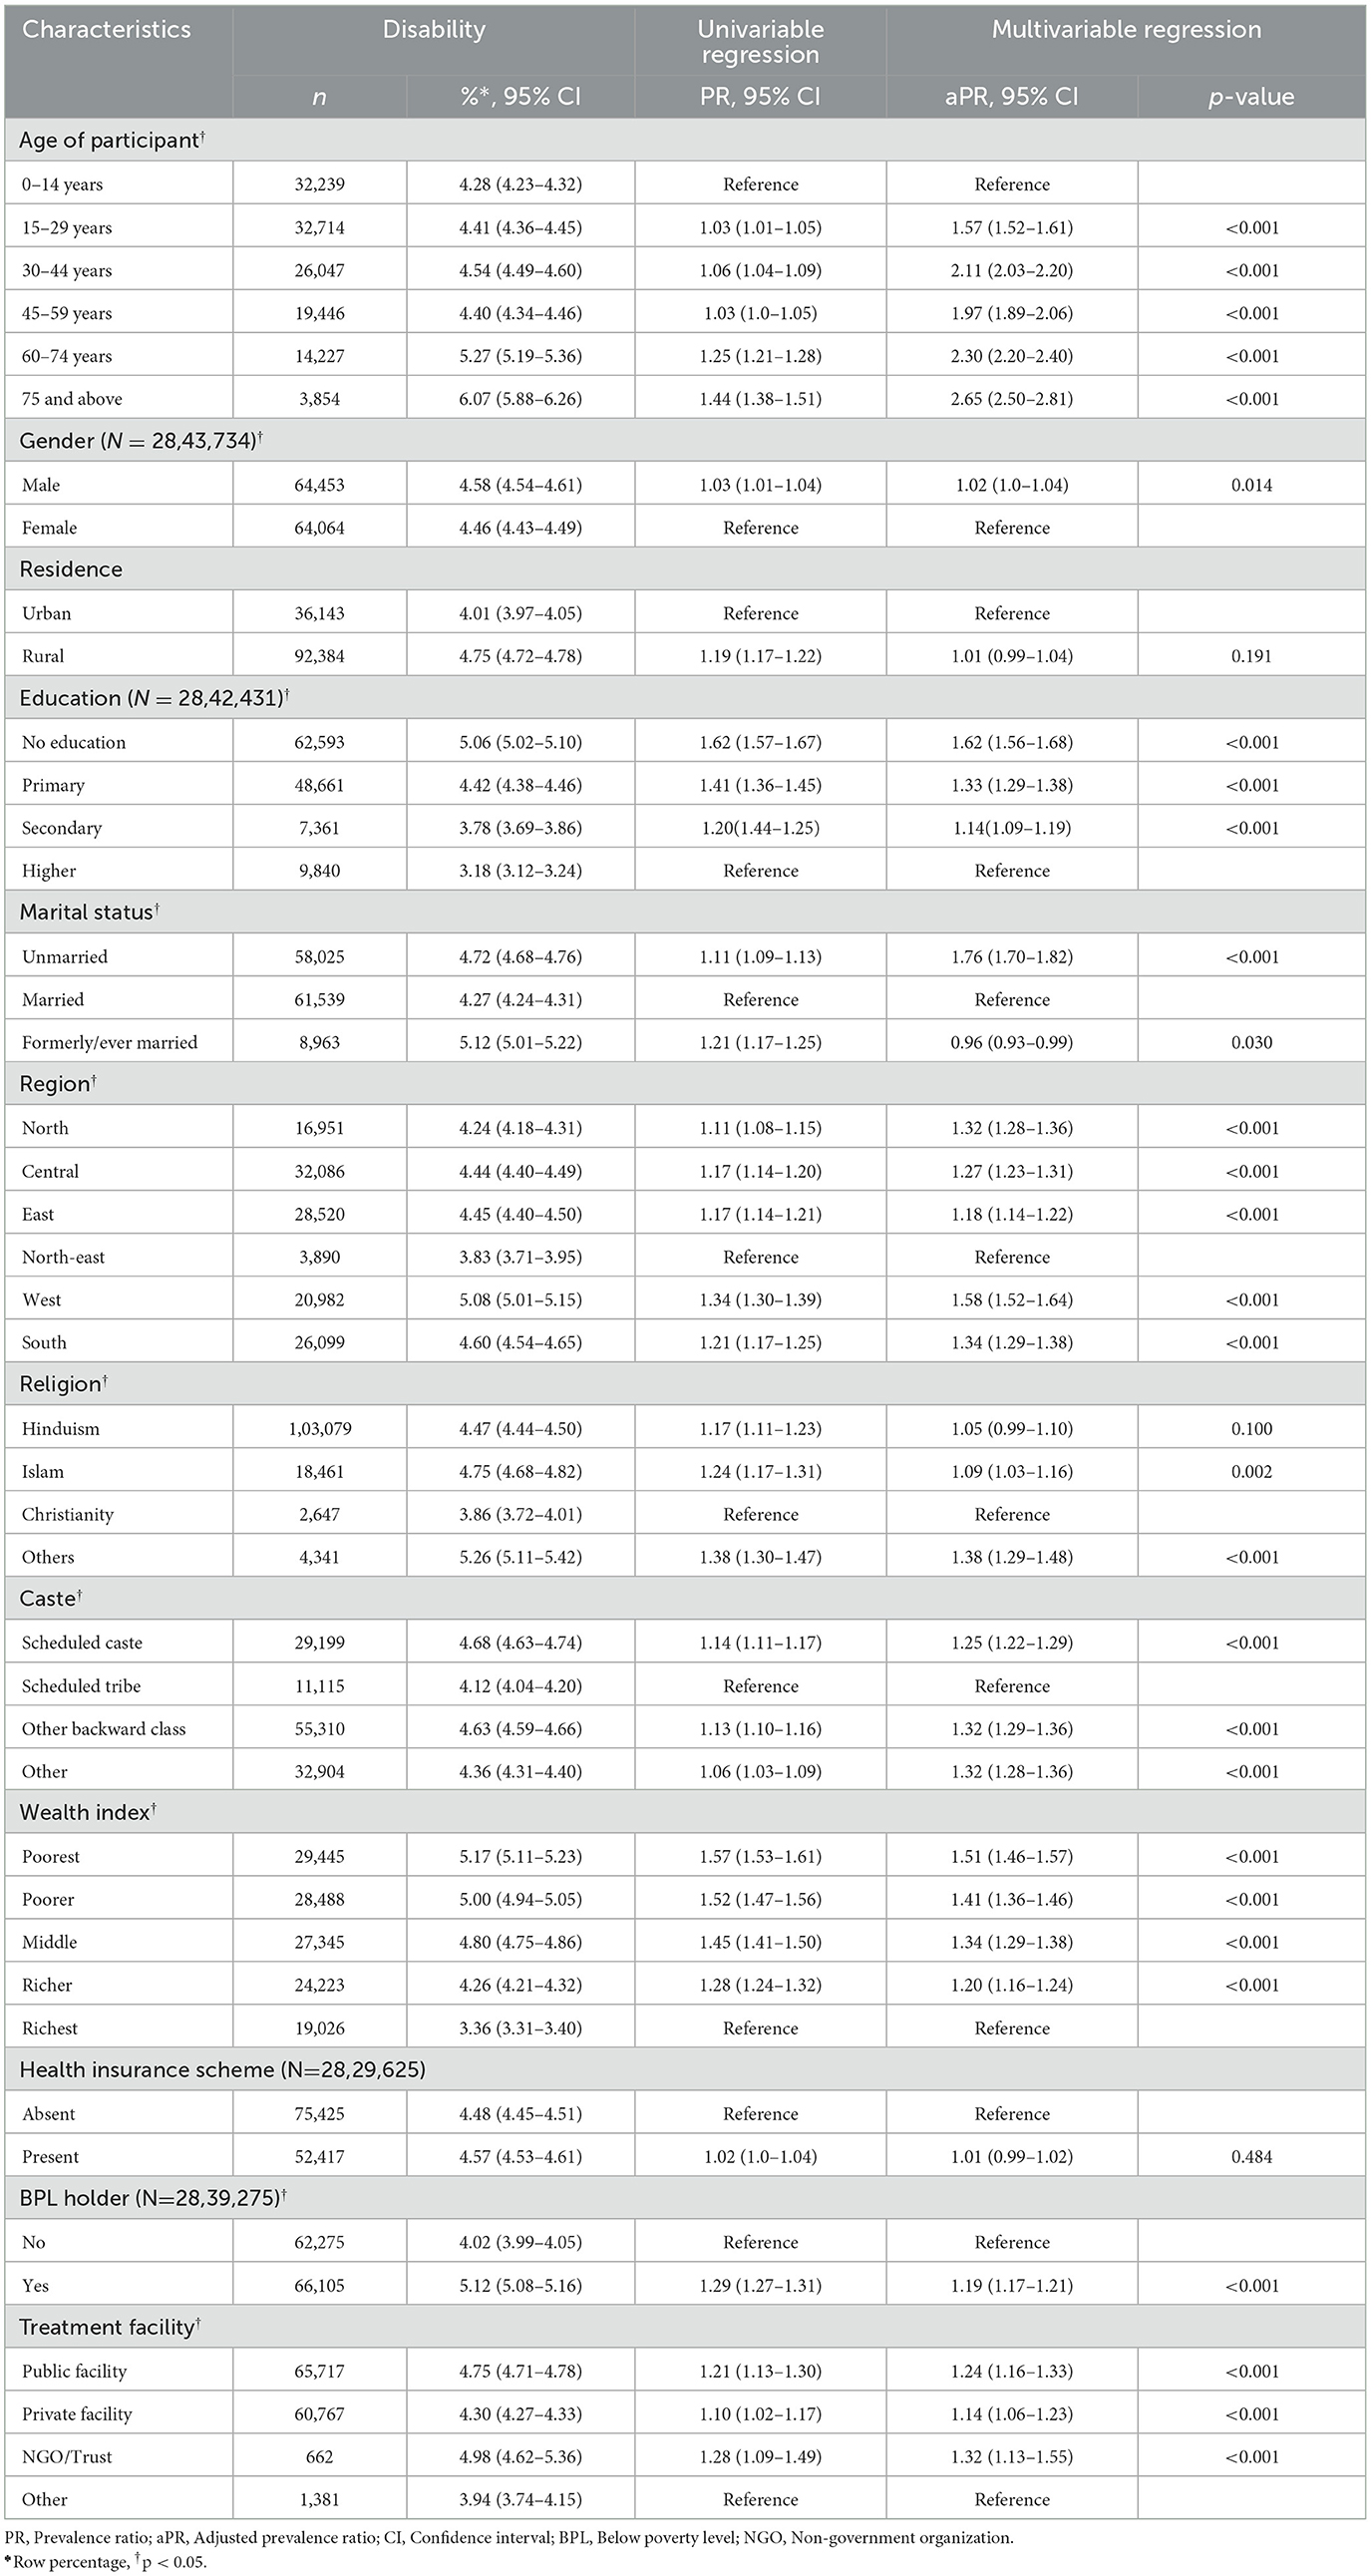
Table 2. Determinants of disability in the study population covered in NFHS-5 (N = 28,43,917).
Respondents aged 75 years and above had twice [aPR: 2.65 (2.50–2.81)] the prevalence of disability compared with 0–14 years (Table 2). Disability was 2% more among males [aPR: 1.02 (1.00–1.04)] than females. Regarding education, disability was 62% more common among those who didn't have any form of schooling [aPR: 1.62 (1.56–1.68)] in contrast to those who have completed higher education. Unmarried people had 76% more disability [aPR: 1.76 (1.70–1.82)] than married people. Respondents from the western region [aPR: 1.58 (1.52–1.64)] have 58% more prevalence of disability compared with the northeast region. People from other backward castes had a 32% more burden of disability compared to people from scheduled tribes [aPR:1.32(1.29–1.36)]. Disability was 51% higher in the poorest wealth quintile [aPR: 1.51 (1.46–1.57)] than in the most affluent. Individuals with disabilities favored NGOs or Trust hospitals/clinics for medical care [aPR: 1.32 (1.13–1.55)] over visiting pharmacies or taking home treatment.
Of the total, locomotor disabilities accounted for 44.70% [(95% CI: 44.31–45.09), n = 51,659] followed by mental [20.28% (95% CI: 19.96–20.59), n = 23,436] and speech disabilities [14.55 % (95% CI:14.27–14.83, n = 16,812] (Figure 1A). The detailed prevalence of individual disabilities is given in Supplementary File 2. The ages of 0–14 and 45–59 years had the highest burden of locomotor disability (45.50%) and mental disability (22.16%), respectively.
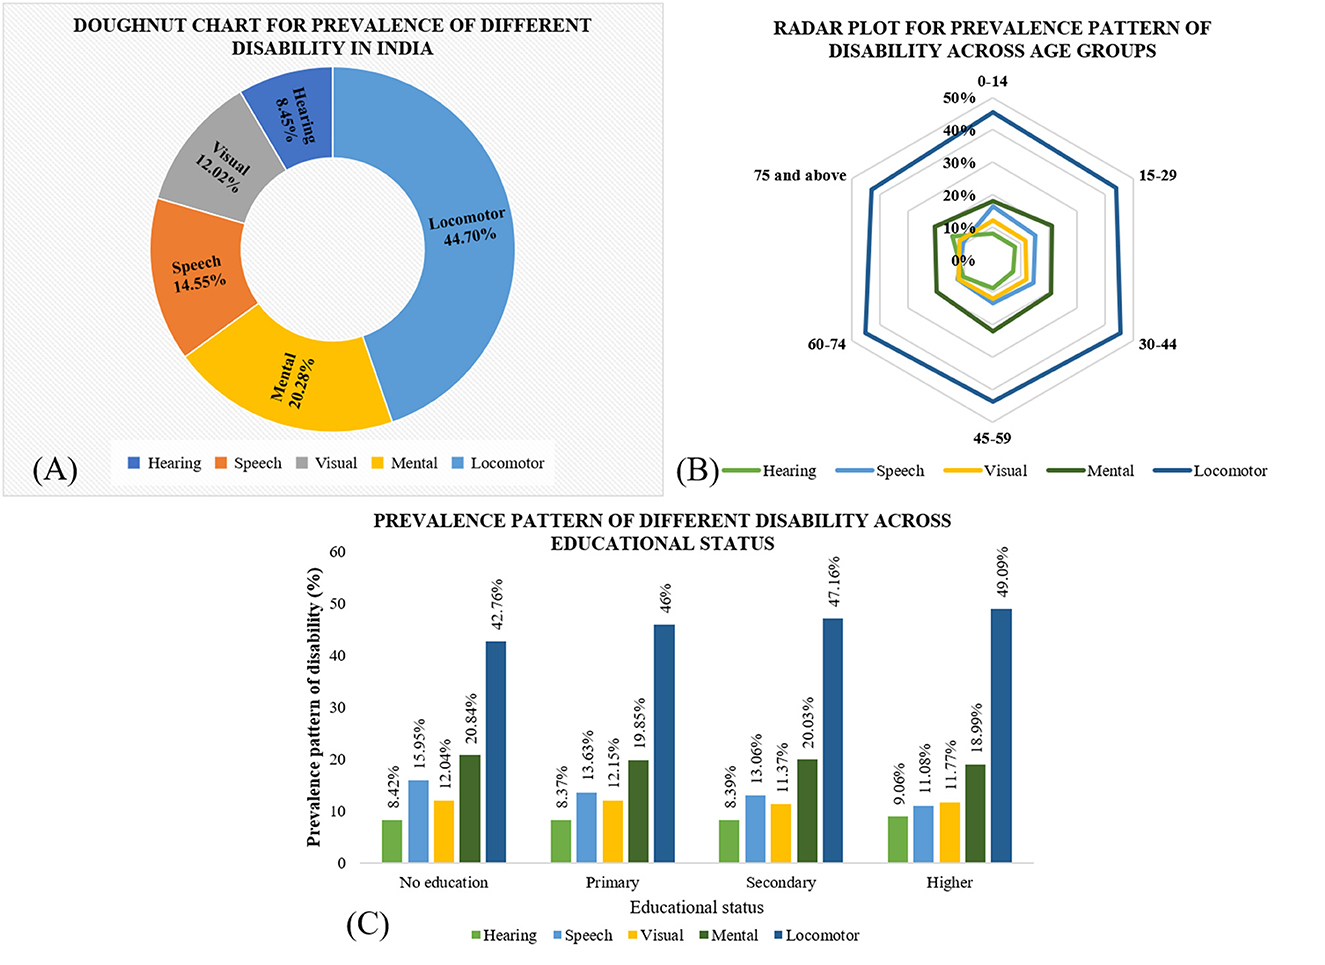
Figure 1. Prevalence of different disabilities across sociodemographic characteristics. (A) Doughnut chart for the prevalence of different disabilities across the population in India based on NFHS-5 (N = 1,15,557). (B) Radar plot showing the prevalence pattern of different disabilities across age groups in India based on NFHS-5 (N = 1,15,557). (C) The prevalence pattern of different disabilities across educational statuses in India based on NFHS-5 (N = 1,15,557).
Using the radar plot, we have represented the association of various types of disability with the age groups. We have given the prevalence of disability in the interval of 10 (0, 10, 20, etc.). E.g., The preponderance of locomotor disability is highest among the 0–14 years age group. The prevalence pattern of various disabilities across the age groups is shown in Figure 1B.
The detailed prevalence pattern of various disabilities across educational status is shown in Figure 1C. Regarding educational attainment, hearing and locomotor disability were higher among those who had completed higher levels of education.
Figures 2A–D shows the burden of disability and its pattern across the states and UTs of India. The overall disability distribution in Figure 2A indicates that it is more prevalent in Lakshadweep, UT (8.88%), followed by Karnataka (5.77%). In the present study, the regional disparities could be because the composition of the population and the individuals with a disability varies in different states. So, the prevalence of disability varies in different states and is found to be higher in Lakshadweep, where the total population is less as compared with other states and UTs. For national representativeness, we have used weighted values for data. Similarly, the prevalence of locomotor disability (Figure 2B) was highest in Delhi (57.03%), followed by Dadra and Nagar Haveli (55.49%). Figure 2C shows the prevalence of mental disabilities, with the highest in Mizoram (42.51%), followed by Goa (41.54%). Figure 2D shows the highest prevalence of speech disability in Sikkim (37.61%), followed by Tripura (23.42%).
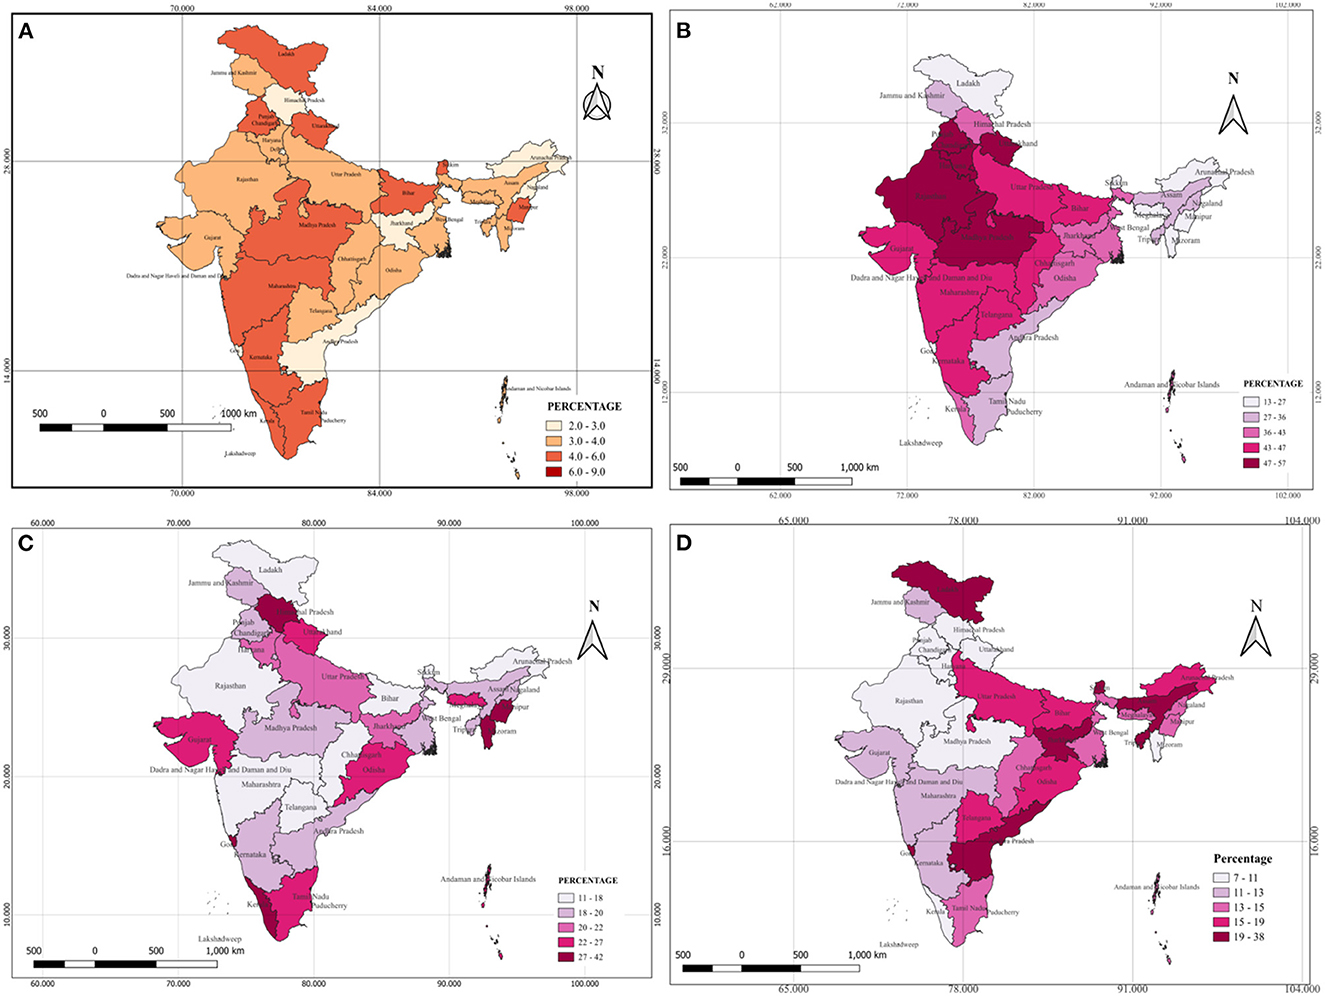
Figure 2. Prevalence patterns of disability in India based on NFHS-5. (A) Overall prevalence pattern of disability in India, NFHS 5. (B) Distribution of locomotor disability in India, NFHS 5. (C) Distribution of mental disability in India, NFHS 5. (D) Distribution of speech disability in India, NFHS 5.
Discussion
The overall prevalence of disability in India based on secondary data analysis of the NFHS-5 survey (2019–21) was 4.52%. Locomotor disabilities accounted for 44.70% of all disabilities, followed by mental and speech disabilities. Age 75 years and above, male, no, unmarried, belonging to the west region, and non-governmental organization were significant independent determinants. The highest prevalence of locomotor, mental, and speech disability was in Delhi, Mizoram and Sikkim, respectively, whereas the overall prevalence was highest in Lakshadweep/UTs.
In the present study, the overall prevalence of disability was 4.52%. The result of this study is consistent with the findings of Myanmar (4.6%) and South Africa (4.9%) (28, 29). Our study reported a higher prevalence than in Zimbabwe (2.9%) and Cambodia (4%). Some countries reported a higher prevalence than the national average, including Jordan (13%) and Zimbabwe (7%) (30, 31). The burden of disability varies country-wise. Most surveys conducted in developed countries concentrated on wider spheres of participation and the need for services. However, most surveys done in LMICs typically emphasize impairment questions. The dynamic interaction between health, environmental, and personal contexts that vary among regions contributes to the occurrence of disabilities (32). Also, sampling technique, type of population involved, sociodemographic characteristics, and population composition varies.
Our finding suggests a higher prevalence of locomotor disability, which is higher than the study conducted in Mumbai (5.57%) (33). The present study highlights that locomotor disability was highest among those aged 0–14 years, which is in contrast to the study's findings, which suggest that it was higher among 40 years or older (34). Although there is limited evidence supporting this, the most likely cause could be the rising prevalence of both acquired and congenital locomotor disability, including rickets, tuberculosis spine, and clubfoot (congenital talipes equinovarus or CTEV) (35).
Age is a significant predictor of disability and is positively associated with disability. The study by Gupta et al. (36) revealed that the prevalence of disability increases with age, with the highest in the age group of 75 years and above (63.8%), which is in harmony with the results of the current study (36). Degenerative health conditions (such as arthritis and spondylosis), chronic health conditions, falls, and injuries are some factors that increase the susceptibility to disability among older age groups (37). Another study found that in the 60–64 age group, only 36% have some disability, and 61% are 75 years and above (36). The difference in this result from the present study could be because of the difference in scales used in disability. And older adults are at high risk of developing intellectual and neurological disorders or substance use problems and are vulnerable to other health-related conditions such as hearing loss and osteoarthritis (38). In older adults, aging causes a variety of psychological issues, which includes: (1) reduced proprioception, (2) diminished ability to adapt to environmental changes, social roles and status, (3) elevated risk of exposure to adverse life effects such as retirement from a job, financial management and death of relative (39).
Our findings suggest that men are more prone to have any disability as compared to women. However, women aged 65–79 years are 3.3% more likely to have functional limitations than men, and with an increase in age of 80 years or older the likelihood of disability increases to 15.5% (40). Despite an increase in the prevalence of disability with age progression, female dominance is seen, which contrasts with our study findings. As a result, it shows an apparent gender disparity in disability prevalence estimates rates. A community-based study in rural Haryana shows that functional disability was lower in men (35.9%) as compared with women (38.8%), which is also a contrast to our findings (36). This disparity may be because males are more likely to encounter accidents and injuries and risk developing NCDs (41). Males' participation in risky activities and physically demanding occupations (mine, electrical and telecommunications, climbing and working, commercial driving, and so on) could also be a possible explanation.
The study by Yadav and Singh (42) suggested that adults between the ages of 20 and 25 had a higher prevalence of disability than children between the ages of 10 and 14. Adults may have a higher prevalence of NCDs due to increased risk of road traffic accidents (RTAs), self-harm, and behavioral changes like alcoholism, tobacco use, and drug abuse (42).
Our study observed that the disability was higher among those with lesser years of schooling. Most disabled people were undereducated, as shown by the study from southwest Turkey and in China among community dwellers, including older individuals, in harmony with our study findings (43, 44). Even though the government mandates a 5% reservation in government-aided institutions and a 4% reserve in government jobs, the prevalence of disability is higher among those with lower levels of education (45). These could result from difficulties related to attitude, a lack of inclusivity, transportation issues, and parents' and caregivers' lack of understanding of the importance of obtaining education for their kids (46). Additionally, prior research has shown that the lowest wealth quintile had a much higher risk of death and disability than their highest wealth counterparts at all ages, which is similar to our current study's finding. Wealth may be a better predictor of scarce financial resources, exacerbated by a loss of employment, retirement, or advancing age (47). People living in poverty may work under hazardous conditions associated with adverse health outcomes, including disability. They may also have limited access to healthcare and education, which puts them at a greater risk of developing disabilities (10, 48).
A study shows that unmarried people tend to suffer more from functional limitations, which is in line with our findings. This observation is also validated by a more comprehensive survey of 57 countries worldwide (49, 50). PwD (cognitive impairment or mobility difficulties) may appeal less to potential partners due to partner selection and independent choices. According to one study, men refuse to marry disabled women despite their awareness of their stigma and discrimination. They desire spouses who can give the physical support they require while overcoming considerable obstacles to fulfilling their roles as a husband, father, and provider (51). This also can result from the spouse abandoning their disabled partner, who can no longer support them as a couple (52).
The prevalence of disability also varies according to region. Topographically the western part was found to be a potential domain for disability in our study. A regional assessment of disability in India revealed that the country's central zone has the highest percentage of total disability, which contrasts with our findings (53). Despite notable advancement in the health index score in a report by NITI Aayog (National Institution for Transforming India) in western states like Maharashtra and Gujarat, the rates of disability were higher in this study (54). However, the level of healthcare infrastructure is not improving in states such as Rajasthan, which has a low health index score. According to a study, most disabled people in Rajasthan and Gujarat receive treatment after the onset of their disability (55). It could be due to the level of services and facilities the state provides, with uncrowded hospitals providing better medical facilities and treatments.
The study conducted in Chennai among minorities suggested that rates of disability were higher among those belonging to Scheduled Tribes and Scheduled Castes (STs and SCs), which is in contrast with our study findings that is, disability was found to be more among those belonging to other backward class (OBCs) (56). These communities continue to face economic discrimination and societal violence in many parts of the country, which frequently leads to violence resulting in the death or injury of victims suggestive of the occurrence of any disability (57).
Our analysis reveals that most people with disabilities have health insurance (58). The Indian government has made provisions for various health insurance schemes for people with disabilities. Two are the Niramaya Health Insurance Scheme and the Swavlamban Health Insurance Scheme. Whilst the latter was discontinued for unspecified reasons, the former provides beneficiaries affordable health insurance (around INR 1 lakh plus additional services) (58, 59). Other initiatives that work for the betterment of PWDs include the Deendayal Disabled Rehabilitation Scheme (DDRS), Sugamya Bharat Abhiyan, Assistance to Disabled Persons for Purchase / Fitting of Aids / Appliances (ADIP), and the Unique Disability ID Project (UDID). Volunteers' proactive participation, extensive collaboration with NGOs, and comprehensive publicity will draw more public attention to these schemes (60). In Bangladesh, a cross-sectional study reported that most participants visited private clinics or hospitals; however, in our research, we discovered that most people with disabilities chose to obtain medical care from NGOs or Trusts, possibly because it was less expensive than going to the private hospital, good quality of care, less waiting time, limited government facility nearby and provision of ancillary services like assistive device (24, 61).
We have also estimated the prevalence and patterns of various types of disabilities (Hearing, Speech, Visual, Mental, and Locomotor) across different sociodemographic statuses, access, and quality of health services that influence the health and wellbeing of the population (62). Consistent with previous research, the current study shows disparities in the prevalence of disability types by age, gender, educational status, region, wealth index, caste, and treatment facility (63).
Policy implications
When we look into the interrelationship between disability and covariates, we find that education is strongly linked with disability. There is a need to shift the emphasis toward health education through Information, Education and Communication (IEC) and Behavior Change Communication (BCC) strategies. The RPWD Act 2016 is a fully-fledged initiative by the Indian government to guarantee equitable services. Community-based rehabilitation (CBR) is an essential component of this strategy. However, a low CBR to PWDs ratio, limited resources, and cultural preferences impede programmes' efficiency. Understanding the burden of disability will be made easier with the help of the recruitment of professionally trained personnel, resource allocation, logistical management, and a CBR database. Despite the government's ongoing efforts, a gap still needs to be bridged. Discrimination, inequality, and social difficulties are still persistent problems. The existing gap can be filled through active education and distribution of disability, how it can be managed, and how it does not make a difference in a society. Dissemination of disability-related initiatives, encouragement of the value of education among those with congenital disabilities, and methods of vocational employment at the grassroots level would be beneficial. Accredited Social Health Activist training and sensitization on raising awareness about disability and discussing it with families will significantly impact it.
Strength and limitations
To the best of our knowledge, this is the first study to estimate the prevalence and determinants of disability across households in India. Because the study is based on nationally representative data from a household survey, it ensures generalizability regarding the prevalence of various disabilities. However, the cross-sectional nature of this study allows it to consider the self-reported incidents as described by the respondents. It can be challenging to assess whether a person has an impairment since it is sometimes in the latent phase, making it difficult to diagnose and hence vulnerable to bias. This study has a few more limitations since the certificate of the disabled respondents has not been checked, and more than one disability is not given separately in the dataset. Furthermore, we have not considered NCD as data were unavailable.
Conclusion
The overall prevalence of disability in India is 4.5%. Locomotor disability is the most common type of disability among the population. More intervention strategies should be planned, considering factors like education, health promotion and caste so that the services provided by the government can be available and accessible to everyone in need.
Data availability statement
Publicly available datasets were analyzed in this study. This data can be found at: https://www.dhsprogram.com/methodology/survey/survey-display-541.cfm.
Author contributions
SPati, SK, and TR: concept and design. SPati, SK, and TR: monitored analysis and critical revision of the manuscript for important intellectual content. SPati, SK, and TR: administrative and technical support. JM, SPatt, and RA: acquisition, statistical analysis or interpretation of data, and drafting of the manuscript. SPati: supervision. All authors reviewed the manuscript.
Acknowledgments
The authors thank the National Family Health Survey (NFHS) for assembling and publishing meticulous, nationally depictive data on various health, biomarkers, and healthcare utilization indicators for the population aged 15–49 years. The authors are also grateful to NFHS's project partners, the International Institute for Population Sciences (IIPS), Mumbai.
Conflict of interest
The authors declare that the research was conducted in the absence of any commercial or financial relationships that could be construed as a potential conflict of interest.
Publisher's note
All claims expressed in this article are solely those of the authors and do not necessarily represent those of their affiliated organizations, or those of the publisher, the editors and the reviewers. Any product that may be evaluated in this article, or claim that may be made by its manufacturer, is not guaranteed or endorsed by the publisher.
Supplementary material
The Supplementary Material for this article can be found online at: https://www.frontiersin.org/articles/10.3389/fpubh.2023.1036499/full#supplementary-material
Abbreviations
aPR, Adjusted Prevalence Ratio; BCC, Behavior change communication; BPL, Below poverty level; CAPI, Computer-assisted personal interview; CI, Confidence Interval; CRPD, Committee on the Rights of Persons with Disability; DHS, Demographic Health Survey; ICF, International Classification of Functioning, Disability, and Health; IEC, Information education communication; IIPS, International Institute for Population Sciences; LMIC, Low-and middle-income countries; NCDs, Non-communicable disease; NFHS, National Family Health Survey; NGO, Non-government organization; NITI Aayog, National Institution for Transforming India; PwD, Persons with Disability; QOL, Quality of Living; SDG, Sustainable Development Goals; UTs, Union Territories.
References
1. WHO. World Health Organization. Geneva: World Report on Child Injury Prevention (2001). Available online at: https://apps.who.int/iris/bitstream/handle/10665/42407/9241545429.pdf (accessed August 23, 2022).
2. Awasthi A, Pandey CM, Dubey M, Rastogi S. Trends, prospects and deprivation index of disability in India: evidence from census 2001 and 2011. Disabil Health J. (2017) 10:247–56. doi: 10.1016/j.dhjo.2016.10.011
3. World Health Organization. Global Disability Action Plan 2014-2021: Better Health for All People with Disability. World Health Organization (2015).
4. NHFDC. Persons with Disabilities (Divyangjan) in India - A Statistical Profile: 2021. NHFDC (2021). Available online at: http://www.nhfdc.nic.in/upload/nhfdc/Persons_Disabilities_31mar21.pdf (accessed August 23 2022).
5. Yadav J, Sharma P. Regional pattern of disabilities and socioeconomic disadvantage among youth in India: a geospatial analysis. Geo J. (2021) 1:1–6. doi: 10.1007/s10708-021-10455-w
6. United Nations Population Division (UN) World World Population Prospects: The 2010 Revision (New York: United Nations 2011). Available online at: http://esa.un.org/unpd/wpp/index.htm (accessed August 23 2022).
7. Kumar S, Pradhan MR, Singh AK. Chronic diseases and their association with disability among the elderly in India. Soc Sci Spectrum. (2017) 3:27–37. doi: 10.1007/s10389-018-0960-2
8. Heikkinen E. What are the Main Risk Factors for Disability in Old Age How Can Disability be Prevented? Copenhagen, WHO Regional Office for Europe (Health Evidence Network Report. (2003). Available online at: http://www.euro.who.int/document/E82970.pdf (accessed August 23 2022).
9. United Nation,. Department of Economic Social Affairs Population Division. World Population Ageing 2017 Report: New York: United Nations. (2017). Available online at: https://www.un.org/en/development/desa/population/publications/pdf/ageing/WPA2017_Report.pdf (accessed August 23 2022).
10. Hairi NN, Bulgiba A, Cumming RG, Naganathan V, Mudla I. Prevalence and correlates of physical disability and functional limitation among community-dwelling older people in rural Malaysia, a middle-income country. BMC Public Health. (2010) 10:1–3. doi: 10.1186/1471-2458-10-492
11. Klijs B, Nusselder WJ, Looman CW, Mackenbach JP. Contribution of chronic disease to the burden of disability. PLoS ONE. (2011) 6:e25325. doi: 10.1371/journal.pone.0025325
12. Prynn JE, Kuper H. Perspectives on disability and non-communicable diseases in low-and middle-income countries, with a focus on stroke and dementia. Int J Environ Res Public Health. (2019) 16:3488. doi: 10.3390/ijerph16183488
13. Raina P, Gilsing A, Mayhew AJ, Sohel N, van den Heuvel E, Griffith LE. Individual and population-level impact of chronic conditions on functional disability in older adults. PLoS ONE. (2020) 15:e0229160. doi: 10.1371/journal.pone.0229160
14. Vos T, Lim SS, Abbafati C, Abbas KM, Abbasi M, Abbasifard M, et al. Global burden of 369 diseases and injuries in 204 countries and territories, 1990–2019: a systematic analysis for the Global Burden of Disease Study 2019. Lancet. (2020) 396:1204–22. doi: 10.1016/S0140-6736(20)30925-9
15. Arokiasamy P, Uttamacharya U, Jain K, Biritwum RB, Yawson AE, Wu F, et al. The impact of multimorbidity on adult physical and mental health in low-and middle-income countries: what does the study on global ageing and adult health (SAGE) reveal? BMC Med. (2015) 13:1–6. doi: 10.1186/s12916-015-0402-8
16. Sudharsanan N, Geldsetzer P. Impact of coming demographic changes on the number of adults in need of care for hypertension in Brazil, China, India, Indonesia, Mexico, and South Africa: a modeling study. Hypertension. (2019) 73:770–6. doi: 10.1161/HYPERTENSIONAHA.118.12337
17. Wister AV, Levasseur M, Griffith LE, Fyffe I. Estimating multiple morbidity disease burden among older persons: a convergent construct validity study to discriminate among six chronic illness measures, CCHS 2008/09. BMC Geriatr. (2015) 15:1–2. doi: 10.1186/s12877-015-0001-8
18. Qiao J, Lin X, Wu Y, Huang X, Pan X, Xu J, et al. Global burden of non-communicable diseases attributable to dietary risks in 1990–2019. J Human Nutr Dietetics. (2022) 35:202–13. doi: 10.1111/jhn.12904
19. Mahmud I, Clarke L, Ploubidis GB. Socio-demographic determinants of the severity of locomotor disability among adults in Bangladesh: a cross-sectional study, December 2010–February 2011. Arch Public Health. (2017) 75:1–0. doi: 10.1186/s13690-017-0217-5
20. Padhyegurjar MS. Factors affecting treatment-seeking behaviour of individuals with locomotor disabilities. Nat J Med Res. (2012) 2:145–8. Available online at: https://njmr.in/index.php/file/article/view/743 (accessed August 23, 2022).
21. Das D, Agnihotri SB. Physical disability: is there a gender dimension? Econ Polit Wkly. (1998) 26:3333–5.
22. Groce N, Trani J. Disability and the Millennium Development Goals. New York, NY: United Nations Publication; United Nation (2011).
23. Ganle JK, Baatiema L, Quansah R, Danso-Appiah A. Barriers facing persons with disability in accessing sexual and reproductive health services in sub-Saharan Africa: a systematic review. PLoS ONE. (2020) 15:e0238585. doi: 10.1371/journal.pone.0238585
24. Dandona R, Pandey A, George S, Kumar GA, Dandona L. India's disability estimates: Limitations and way forward. PLoS ONE. (2019) 14:e0222159. doi: 10.1371/journal.pone.0222159
25. Government of India. Department of Empowerment of Persons with Disabilities (Divyangjan). Annual Report 2020-21. Available online at: https://disabilityaffairs.gov.in//content/upload/uploadfiles/files/MinistrySocialJusticeARENGLISH2020-21Final.pdf (accessed August 23 2022).
26. National National Family Health Survey-(NFHS-5); Ministry of Health and Family Welfare New Delhi and International Institute for Population Sciences Mumbai 2019-20. Mumbai. Available online at: https://sciresol.s3.us-east-2.amazonaws.com/srs-j/bu_journals/GA/pdf/Volume-10/issue-2/GA_v10i2_1.pdf (accessed August 24 2022).
27. QGIS, Development Team (YEAR). QGIS Geographic Information System. Open-Source Geospatial Foundation Project. Available online at: http://qgis.osgeo.org (accessed August 24, 2022).
28. Statistics S. General Household Survey 2015 Statistical Release P0318. Pretoria: Statistics South Africa (2016).
29. Department Department of Population Ministry Ministry of Immigration Population. The 2014 Myanmar Population and Housing Census: The Union Report. Available online at: www.dop.gov.mm (accessed August 24, 2022).
30. Thompson S. The Current Situation of Persons with Disabilities in Jordan', K4D Helpdesk Report. Brighton: Institute of Development Studies (2018).
31. UNICEF. Disabilities 2011 for Zimbabwe. Available online at: www.unicef.org/zimbabwe/disabilities (accessed August 24, 2022).
32. World Health Organization. Summary: World Report on Disability 2011. World Health Organization (2011). Available online at: http://www.ncbi.nlm.nih.gov/pubmed/18245322 (accessed August 24, 2022).
33. Samal J, Meshram FA. A cross sectional study on sickle cell disease among backward communities of Gadchiroli, Maharashtra, India. Indian J Public Health Res Develop. (2014) 5, p117–20. doi: 10.5958/j.0976-5506.5.2.087
34. Mishra K, Siddharth V, Bhardwaj P, Elhence A, Jalan D, Raghav P, et al. The prevalence pattern of locomotor disability and its impact on mobility, self-care, and interpersonal skills in rural areas of Jodhpur District. Nigerian Med J. (2019) 60:156. doi: 10.4103/nmj.NMJ_144_17
35. IGNOU The The People's University. Child with Locomotor, Multiple or Other Disabling Conditions. Available online at: https://egyankosh.ac.in/bitstream/123456789/46061/1/Unit-4.pdf (accessed August 24, 2022).
36. Gupta P, Mani K, Rai S, Nongkynrih B, Gupta S. Author′ s Reply to 155_14 and 233_14: Functional disability among elderly persons in a rural area of Haryana. Indian J Public Health. (2014) 58:293–4. doi: 10.4103/0019-557X.146310
37. Ahluwalia SC, Gross CP, Chaudhry SI, Leo-Summers L, Van Ness PH, Fried TR. Change in comorbidity prevalence with advancing age among persons with heart failure. J Gen Intern Med. (2011) 26:1145–51. doi: 10.1007/s11606-011-1725-6
38. Mental Health of Older Adults. Available online at: https://www.who.int/news-room/fact-sheets/detail/mental-health-of-older-adults (accessed August 24, 2022).
39. Hur K, Choi JS, Zheng M, Shen J, Wrobel B. Association of alterations in smell and taste with depression in older adults. Laryngoscope Investig Otolaryngol. (2018) 3:94–9. doi: 10.1002/lio2.142
40. Lee J, Meijer E, Phillips D, Hu P. Disability incidence rates for men and women in 23 countries: evidence on health effects of gender inequality. J Gerontol A Biol Sci Med Sci. (2021) 76:328–38. doi: 10.1093/gerona/glaa288
41. Sorenson SB. Gender disparities in injury mortality: consistent, persistent, and larger than you'd think. Am J Public Health. (2011) 101:S353–8. doi: 10.2105/AJPH.2010.300029
42. Yadav AK, Singh A. Age-and sex-specific burden of morbidity and disability in India: a current scenario. Eval Health Serv. (2020) 1:11–3. doi: 10.5772/intechopen.89709
43. Kisioglu AN, Uskun E, Ozturk M. Socio-demographical examinations on disability prevalence and rehabilitation status in southwest of Turkey. Disabil Rehabil. (2003) 25:1381–5. doi: 10.1080/09638280310001616303
44. Beydoun MA, Popkin BM. The impact of socio-economic factors on functional status decline among community-dwelling older adults in China. Soc Sci Med. (2005) 60:2045–57. doi: 10.1016/j.socscimed.2004.08.063
45. Government of India. Department of Empowerment of Persons with Disabilities (Divyangjan). The Rights of Persons with Disabilities (RPwD) Act. (2016). Available online at: https://disabilityaffairs.gov.in/content/page/acts.php (accessed January 06 2023).
46. Bakhshi P, Babulal GM, Trani JF. Education of children with disabilities in New Delhi: when does exclusion occur? PLoS ONE. (2017) 12:e0183885. doi: 10.1371/journal.pone.0183885
47. Mahmood SE, Singh A, Zaidi ZH. Disability in the rural areas of Bareilly, India. Indian J Health Sci Biomed Res. (2015) 8:115. doi: 10.4103/2349-5006.174239
48. Groce N, Bailey N, Lang R, Trani JF, Kett M. Water and sanitation issues for persons with disabilities in low-and middle-income countries: a literature review and discussion of implications for global health and international development. J Water Health. (2011) 9:617–27. doi: 10.2166/wh.2011.198
49. Hosseinpoor AR, Stewart Williams J, Jann B, Kowal P, Officer A, Posarac A, et al. Social determinants of sex differences in disability among older adults: a multi-country decomposition analysis using the World Health Survey. Int J Equity Health. (2012) 11:1–8. doi: 10.1186/1475-9276-11-52
50. Savage A, McConnell D. The marital status of disabled women in Canada: a population-based analysis. Scand J Disabil Res. (2016) 18:295–303. doi: 10.1080/15017419.2015.1081616
51. Jalal S, Gabel S. Physical disability, gender, and marriage in jordanian society. Rev Disabil Stud Int J. (2014) 10:1–21. Available online at: https://www.rdsjournal.org/index.php/journal/article/view/33/126
52. Kail BL. Marital status as a moderating factor in the process of disablement. J Aging Health. (2016) 28:139–64. doi: 10.1177/0898264315589572
53. Ariz D. Disabled population in India: a regional analysis. Ann Valahia University Targoviste Geograph Ser. (2018) 18:136–43. doi: 10.2478/avutgs-2018-0015
54. NITI Aayog. Healthy States Progressive India. Round:4 (2019-20). Available online at: http://social.niti.gov.in/hlt-ranking/?round=4 (accessed August 24, 2022).
55. Patel S. A multilevel exploration of treatment seeking behaviour of disabled persons in India. Int J Tropical Med. (2007) 5. doi: 10.5580/2958
56. Thompson S, Rohwerder B Arockiasamy C. Freedom of Religious Belief and People with Disabilities: A Case Study of People with Disabilities from Religious Minorities in Chennai, India, CREID Working Paper 7, Coalition for Religious Equality and Inclusive Development. Brighton: Institute of Development Studies (2021). doi: 10.19088/CREID.2021.003
57. Prasad JB, Patel KK. Disability differential in India: a critical evaluation of caste-wise disability. Mental Illness. (2013) 59:56–68. Available online at: https://www.researchgate.net/publication/281590708_Disability_Differential_in_India_A_Critical_Evaluation_of_Caste-Wise_Disability (accessed January 04, 2023).
58. James JW, Basavarajappa C, Sivakumar T, Banerjee R, Thirthalli J. Swavlamban health insurance scheme for persons with disabilities: an experiential account. Indian J Psychiatry. (2019) 61:369. doi: 10.4103/psychiatry.IndianJPsychiatry_77_19
59. NIRAMAYA. Ministry of Social Justice and Empowerment (MSJE)- National Trust. Available online at: https://thenationaltrust.gov.in/content/scheme/niramaya.php (accessed January 4 2023).
60. NHFDC. National Handicapped Finance and Development Corporation. Persons with Disabilities (Divyangjan) in India - A Statistical Profile. (2021). Available online at: http://www.nhfdc.nic.in/ (accessed January 4 2023).
61. Talukdar JR, Mahmud I, Rashid SF. Primary health care seeking behaviour of people with physical disabilities in Bangladesh: a cross-sectional study. Arch Public Health. (2018) 76:1–9. doi: 10.1186/s13690-018-0293-1
62. Singh GK, Daus GP, Allender M, Ramey CT, Martin EK, Perry C, et al. Social determinants of health in the United States: addressing major health inequality trends for the Nation, 1935-2016. Int J MCH and AIDS (IJMA). (2017) 6:2. doi: 10.21106/ijma.236
63. HHS Implementation Guidance on Data Collection Standards for Race Ethnicity Sex Primary Language Disability Status. (2011). Available online at: http://aspe.hhs.gov/datacncl/standards/aca/4302/index.pdf (accessed August 24, 2022).
Keywords: disability, prevalence, NFHS-5, India, secondary data analysis
Citation: Pattnaik S, Murmu J, Agrawal R, Rehman T, Kanungo S and Pati S (2023) Prevalence, pattern and determinants of disabilities in India: Insights from NFHS-5 (2019–21). Front. Public Health 11:1036499. doi: 10.3389/fpubh.2023.1036499
Received: 04 September 2022; Accepted: 08 February 2023;
Published: 27 February 2023.
Edited by:
Anand Krishnan, All India Institute of Medical Sciences, IndiaReviewed by:
Leeberk Raja Inbaraj, National Institute of Research in Tuberculosis (ICMR), IndiaShamanna B. R., University of Hyderabad, India
Copyright © 2023 Pattnaik, Murmu, Agrawal, Rehman, Kanungo and Pati. This is an open-access article distributed under the terms of the Creative Commons Attribution License (CC BY). The use, distribution or reproduction in other forums is permitted, provided the original author(s) and the copyright owner(s) are credited and that the original publication in this journal is cited, in accordance with accepted academic practice. No use, distribution or reproduction is permitted which does not comply with these terms.
*Correspondence: Sanghamitra Pati,  drsanghamitra12@gmail.com; Srikanta Kanungo, srikantak109@gmail.com
†These authors have contributed equally to this work
‡ORCID: Sweta Pattnaik orcid.org/0000-0002-6888-9980
Jogesh Murmu orcid.org/0000-0001-9428-9113
Ritik Agrawal orcid.org/0000-0001-5345-1559
Tanveer Rehman orcid.org/0000-0003-2377-4394
Srikanta Kanungo orcid.org/0000-0001-5647-0122
Sanghamitra Pati orcid.org/0000-0002-7717-5592