1
Department of Clinical Neurobiology, Interdisciplinary Center for Neurosciences, Heidelberg, Germany
2
Department of Molecular Neuroscience, Max-Planck-Institute for Medical Research, Heidelberg, Germany
Neuronal migration is a key process in the developing and adult brain. Numerous factors act on intracellular cascades of migrating neurons and regulate the final position of neurons. One robust migration route persists postnatally – the rostral migratory stream (RMS). To identify genes that govern neuronal migration in this unique structure, we isolated RMS neuroblasts by making use of transgenic mice that express EGFP in this cell population and performed microarray analysis on RNA. We compared gene expression patterns of neuroblasts obtained from two sites of the RMS, one closer to the site of origin, the subventricular zone, and one closer to the site of the final destination, the olfactory bulb (OB). We identified more than 400 upregulated genes, many of which were not known to be involved in migration. These genes were grouped into functional networks by bioinformatics analysis. Selecting a specific upregulated intracellular network, the cytoskeleton pathway, we confirmed by functional in vitro and in vivo analysis that the identified genes of this network affected RMS neuroblast migration. Based on the validity of this approach, we chose four new networks and tested by functional in vivo analysis their involvement in neuroblast migration. Thus, knockdown of Calm1, Gria1 (GluA1) and Camk4 (calmodulin-signaling network), Hdac2 and Hsbp1 (Akt1-DNA transcription network), Vav3 and Ppm1a (growth factor signaling network) affected neuroblast migration to the OB.
Neuronal migration is a complex, integrated process of cell receptor activation by external stimuli, transduction of stimuli by intracellular pathways and subsequent cytoskeleton remodeling according to the stimuli. It plays a key role in embryonic development (Corbin et al., 2001
; Marin and Rubenstein, 2003
), but also continues in distinct areas of the adult brain (Ayala et al., 2007
; Kempermann et al., 2004
; Zhao et al., 2008
). Neurons migrate to their final position in response to different signaling molecules in the microenvironment. However, intracellular molecular networks eventually control the response to the external signals and the final position of the neurons. Although the initial steps of the signaling cascades involved in migration of distinct neuronal subtypes may differ, it is likely that they eventually converge on common networks.
In mammals there are only two brain areas that persist in generating new neurons throughout postnatal life, the subgranular zone of dentate gyrus in hippocampus and the subventricular zone (SVZ) of the lateral ventricles (Lledo et al., 2006
; Ninkovic and Gotz, 2007
; Zhao et al., 2008
). Neuroblasts originating in the SVZ migrate via the rostral migratory stream (RMS) to the olfactory bulb (OB) where they mature into distinct interneuron subtypes, namely granule and periglomerular cells. Such long-distance migration requires finely tuned control by many factors, including guidance molecules, repellent/attractants as well as trophic factors (Ghashghaei et al., 2007
). The RMS persists throughout adulthood (Ninkovic et al., 2007
) and has been an attractive model for numerous in vitro and in vivo migration studies. Under normal conditions, new neurons are added to the OB, and their function is associated with learning and plasticity in the olfactory system (Alonso et al., 2006
; Saghatelyan et al., 2005
). Under pathological conditions, e.g., ischemia, it has been shown that neurogenesis in the SVZ is enhanced, contributing to the addition of new neurons to brain regions other than the OB (reviewed in Zhang et al., 2007
). Thus, a detailed characterization of the molecular control of RMS neuroblast migration may yield additional insight into mechanisms determining cell motility and maturation under normal and pathological conditions.
Most neuronal migration studies performed so far in mammals were directed at the identification and analysis of single factors involved in migration (Ayala et al., 2007
; Ghashghaei et al., 2007
). As of today, there are no studies aiming at a global in vivo gene analysis and identification of cellular networks underlying neuronal migration. Here we performed a global search for molecular networks mediating neuronal migration in RMS neuroblasts. To this end we isolated pools of neuroblasts from two distinct locations in the RMS, one pool in the immediate vicinity of the SVZ, and a second pool from a more rostral position in the RMS. Thus, the former cell population was from a site close to its origin and the latter had almost reached the final position of this tangential migratory pathway. Using a procedure for RNA isolation from distinct in vivo fluorescent cells (Khodosevich et al., 2007
), we obtained RNA from the two neuroblast populations and analyzed the differential gene expression patterns. In addition to previously described genes expressed in migrating cells, we identified numerous novel genes and pathways mediating migration. Based upon bioinformatics analysis, we selected the cytoskeleton pathway and employed in vitro and in vivo assays to inhibit/downregulate its constituents. The results provided functional evidence that upregulated genes of the cytoskeleton pathway indeed govern neuroblast migration and concurred with the microarray results. Thus, we selected four new networks – calmodulin, MAPK and growth factor (GF) signaling as well as an Akt1-DNA transcription network – and analyzed their relevance for migrating neuroblasts by functional in vivo experiments. For three of them we identified previously unknown molecules mediating intracellular cascades regulating neuroblast migration: Calm1, Camk4, Gria1 (calmodulin-signaling), Hdac2, Hsbp1 (Akt1-DNA transcription), Vav3, Ppm1a (GF signaling).
Animals
For all our experiments, except of microarray analysis and organotypic slice cultures, we used wild-type C57Bl/6 mice. For microarray analysis and organotypic slice cultures we used 5HT3A-EGFP transgenic mice (Inta et al., 2008
). All procedures with animals were performed according to the guidance of Heidelberg University Animal Care Committee.
Materials and Reagents
All chemicals and cell culture reagents were purchased from Sigma-Aldrich (Germany) and Invitrogen (Germany), respectively, unless otherwise specified. The following protein inhibitors and phosphatidylinositols (PIPs) were used in our experiments: Wortmannin and LY294002 (Alexis Biochemicals, USA); PKCζ pseudosubstrate inhibitor myristoylated, Rac1 inhibitor, Akt inhibitor X, Clostridium difficile Toxin A, Raf1 inhibitor and rapamycin (Calbiochem, Germany); phosphatidylinositol-(3,4,5)-P3 (PIP3,4,5), phosphatidylinositol-(3,4)-P2 (PIP3,4) and phosphatidylinositol-(4,5)-P2 (PIP4,5) (Cayman Chemical, USA).
EGFP-N-Wave1 and pTurboFP602-C constructs were a generous gift by Dr Yair Pilpel (MPI, Heidelberg, Germany) and Evrogen (Moscow, Russia), respectively.
All other constructs containing cloned genes were purchased from Biocat (Heidelberg, Germany) or RZPD (Heidelberg, Germany).
The following antibodies were used in our analysis: polyclonal rabbit anti-EGFP antibody, 1:10000 (Molecular Probes, USA), mouse anti-III class β-tubulin, Tuj1, 1:500 (Covance, USA), goat anti-CaM I, 1:200 (Santa Cruz, Germany), goat anti-doublecortin, 1:500 (Santa Cruz, Germany), rabbit anti-Akt1, 1:200 (Cell Signaling, USA), mouse anti-Wave1, 1:1000 (Neuromab, USA), rabbit anti-Cdc42, 1:1000 (Santa Cruz, Germany), rabbit anti-PI3K, 1:2000 (Upstate, USA), mouse anti-Rac1 (Cytoskeleton, USA), Alexa 488-conjugated anti-rabbit and anti-mouse secondary antibodies (Molecular Probes, USA), anti-mouse, anti-rabbit and anti-goat Cy3 coupled secondary antibodies (Jackson Immuno Research Laboratories, USA), anti-mouse and anti-rabbit HRP-conjugated secondary antibodies (Vector, USA).
Obtaining Specific RNA From pRMS and aRMS Regions and Microarray Hybridization
The whole procedure has been described for periglomerular cells (Khodosevich et al., 2007
). Briefly, transgenic 5HT3A-EGFP mice (P15) were transcardially perfused by 1× PBS for 20 s (8 ml/min), 0.5% paraformaldehyde (PFA) for 10 min (8 ml/min) and then by 20% sucrose for 7 min (8 ml/min). After perfusion, the brains were rapidly removed from the skull and frozen on dry ice.
Frozen brains were embedded in Tissue Freezing Medium (Leica Instruments, Germany) at −20°C, and 5–8 μm-thick sagittal brain sections were cut on the cryostat Microm HM500 (MICROM International, Germany). The width of an individual section was smaller than the size of fluorescent neuroblasts, and thus each section constituted a monolayer of cells. Sections were mounted on membrane polyester slides (Leica Microsystems, Germany), briefly thawed and dehydrated by sequential incubation in 50% ethanol for 20 s and n-butanol:ethanol (25:1) for 90 s, followed by 60 s of xylene substitution clearing, to which 1/25 volume of n-butanol had been added. Sections were dried and used for laser microdissection (LMD) on a Leica LMD6000B microscope (Leica Microsystems, Germany). Approximately 3,000–5,000 cells were dissected from 15–30 sagittal brain sections of 5–8 μm from one transgenic 5HT3A-EGFP mouse within 1.5–2 hours. EGFP labeling of neuroblasts in the RMS allowed the microdissection of ensembles of adjacently located fluorescent cells that were harvested into dry 0.2 ml tube caps (Leica Microsystems, Germany). Also, to increase the specificity only bright fluorescent cells were dissected.
Directly following microdissection, the collected 3,000–5,000 cells were lysed in 100 μl of lysis solution [10 mM Tris–HCl (pH 7.9), 50 mM EDTA (pH 7.9), 0.2 M NaCl, 2.2% SDS, 0.5 U/μl AntiRNase (Ambion, USA) and 1,000 μg/ml proteinase K (Ambion, USA)] at 55°C for 3 hours with vigorous shaking. The solution was adjusted to 600 μl by water and purified by phenol, pH 4.2, followed by phenol:chloroform (1:1) extraction. Nucleic acid in aqueous phase was ethanol-precipitated, the pellet was washed and dissolved in 26 μl of water, 3.5 μl of 10× DNase buffer (Ambion, USA) and 1 U of DNase I (Ambion, USA) followed by incubation for 15 min at 37°C and purification by use of RNeasy MinElute Cleanup Kit (QIAGEN, Germany). The resulting RNA (typically 6–9 ng) was concentrated by Eppendorf Concentrator 5301 (Eppendorf, Germany) and analyzed by Bioanalyzer 2100 (Agilent, USA).
RNA Amplification
Total RNA (2–3 ng) was amplified using the MessageAmp II aRNA Amplification Kit (Ambion, USA) according to manufacturer’s recommendations. During the T7 in vitro transcription step, the mixture was incubated at 37°C for 14–16 hours. After each amplification round, the RNA was analyzed by Bioanalyzer 2100 (Agilent, USA). We typically obtained 200–300 ng of amplified RNA after the first, and 100–200 μg after the second amplification round. Amplifications were from three posterior RMS (pRMS) and anterior RMS (aRMS) RNA samples obtained from three 5HT3A-EGFP mice. For microarray hybridization, a second round of RNA amplification was performed with biotinylated nucleotides.
Microarray Data Analysis
Target identification was performed by pairwise cross comparison through Affymetrix GCOS1.4 software. Differently expressed genes were filtered according to Affymetrix comparison statistical algorithms (www.affymetrix.com
). We chose those probesets that had Change Call = Increased (I) and Change p-value <0.002 as significantly increased, and those probesets that had Change Call = Decreased (D) and Change p-value >0.998 as significantly decreased. Probesets had to have also Present calls in both arrays compared. From the chosen probesets, we filtered those which were called I or D and showed Signal Log ratio >1.0 or less than −1.0, respectively. Full analysis of microarray data as well as raw data can be found on http://www.ebi.ac.uk/miamexpress
(accession number is E-MEXP-1430).
Network analysis was done by Ingenuity Pathway Analysis® software (ingenuity.com), Bibliosphere® software of Genomatix (genomatix.de), PathwayArchitect® software of Stratagene (stratagene.com), GOstat (Beissbarth and Speed, 2004
), as well as common pathway databases (KEGG and PID). For network analysis we used either all differentially expressed genes or only upregulated genes.
cDNA Synthesis and Quantitative Real-Time PCR
cDNA synthesis and quantitative real-time PCR (qRT-PCR) were done as described previously (Khodosevich et al., 2007
). mRNA levels detected by qRT-PCR were normalized to mRNA levels for Gapdh.
Boyden Chamber Migration Assay
Anterior SVZ–pRMS areas were dissected from coronal sections of wild-type mice, all aged P1–P3. All steps of tissue processing were in Dissection Media (10× DM: 100 mM MgCl2, 10 mM kynurenic acid, 100 mM HEPES in 1× Hank’s Balanced Salt Solution). Dissected aSVZ–pRMS areas were incubated for 5 min with 30 U of papain (Worthington, USA) and 0.0005% DNase solution, and washed by trypsin inhibitor (Sigma-Aldrich, Germany) with 0.0005% DNase in Neurobasal Media Supplemented [500 ml of Neurobasal Media + 10 ml B27-Supplement + 1.25 ml 200 mM L-glutamate + 5 ml penicillin/streptomycin (100 U/ml)]. Cells were triturated through a fine tip, counted and plated in 100 μl volume of Neurobasal Media Supplemented onto gelatin-coated inserts with 5 μm pore Transwell membranes (Corning, USA), at a density of 50,000 cells/insert. To achieve cell migration through the pores, lower chambers were filled with Neurobasal Media Supplemented containing 10% fetal bovine serum. Different chemicals were added to the upper chamber solution. Cells were allowed to migrate through the pores for 24 hours at 37°C, after which membranes were fixed with 4% PFA and stained with anti-Tuj1 antibodies. From each membrane, five areas were evaluated for Tuj1-positive cells, the cell numbers were summed, and the corresponding numbers were used for comparison. Each experiment was done in triplicate. Data from control and treated cells were analyzed by paired t-test.
Organotypic Cultures
Sagittal slices of approximately the same areas of the P3-old 5HT3A-EGFP animal brains were used for control and chemically treated cultures. After 4 days in culture, slices were fixed in 4% PFA and processed for immunostaining by anti-EGFP antibodies. Neuroblast migration was quantified as the ratio of the EGFP-positive cell area surrounding the SVZ between treated and untreated control slices after 4 days in culture. Cell death in organotypic cultures was estimated by adapting a protocol from Brana et al. (2002)
. Image comparison was done by ImageJ software. At least five slices were used for one experimental condition. Data from control and treated slices were analyzed by paired t-test.
Intracellular Delivery of PIPs
Stock solutions of PIPs and neomycin at 1 mM concentration were prepared in HEPES-buffered saline. PIPs were mixed with a carrier (neomycin) to 10 μM each in Neurobasal Medium, incubated at room temperature for 10 min, followed by 10 s of bath sonication (SONOREX, Bandelin GmbH & Co. KG, Germany). PIP-carrier containing medium was applied to cells in Boyden chamber migration assay and organotypic cultures.
ShRNA Plasmid Cloning and Analysis of shRNA Silencing Efficiency
The target sequences for oligos used to construct short-hairpin RNA (shRNA) expression plasmids as well as their sources are shown in Table 5 in Supplementary Material. Scrambled shRNA sequences were cloned from pSilencer vector (Ambion, USA). Complementary pairs of oligos were cloned into pSuper vector (Oligoengine, USA).
The efficiency of shRNA silencing was tested using qRT-PCR and/or western blot by HEK cell culture transfections in triplicates. ShRNAs that specifically knocked down gene expression to 25% or less were selected for the in vivo silencing experiments. Results of qRT-PCR experiments are shown in Table 5 in Supplementary Material.
After virus production, shRNA knockdown efficiency was tested on intrinsic gene silencing by infection of SVZ–RMS cultures (Table 5 in Supplementary Material).
Cloning of Viral Silencing Plasmids
To generate recombinant AAV vector for in vivo experiments, we substituted the human synapsin 1 promoter and EGFP in the AAV-SEWB vector (Shevtsova et al., 2005
) by the mouse doublecortin promoter and TurboRF602 (red fluorescent marker), respectively, AAV-DRWB. ShRNA silencing cassettes were re-cloned from pSuper vector to AAV-DRWB.
To make recombinant lentiviral plasmids for in vivo experiments, we re-cloned shRNA silencing cassettes from pSuper vector to pFUGW, a lentiviral vector containing EGFP expressed under the ubiquitin promoter (Lois et al., 2002
).
Production of Recombinant Viruses
Recombinant AAV and lentiviruses were produced as previously described (Celikel et al., 2007
).
Measurement of Viral Titer
To measure viral titers, a dilution series across five orders of magnitude of viral stock solutions were used for HEK293 cell infection. Each sample was analyzed in triplicate. After 4 days’ incubation at 37°C, the number of fluorescent cell plaques at the different viral dilutions was measured and viral titer was estimated in fluorescent plague forming units/ml.
Injection of Recombinant Viruses into Mouse Brain
The titer of the injected virus had been adjusted such to be equal for all experiments (107 or 3.3 × 10⁵ U/ml). For all genes a high (107 U/ml) and a low titer (3.3 × 10⁵ U/ml) were tested and comparable results were obtained (ratios of migrating cells was similar). One microliter of recombinant AAV/lentivirus expressing shRNA and fluorescent protein marker was delivered to aSVZ/pRMS area of each hemisphere of P6-old C57BL/6 mouse pups with Hamilton (Hamilton, Switzerland) syringes and special needles for precise animal injections: reduced needle volume, 20 mm length, 26s gauge and 45° tip angle. Seven, 10 or more days after injection for AAV and 4, 7 or more days for lentivirus, the animals were killed, and fluorescent cells in the OB, RMS and SVZ were counted. OB fluorescent cells were evaluated as percentage of the total number of infected cells on the SVZ-RMS-OB route. Total number of infected cells was approximately the same for different viruses. Misinjected mice were excluded from analysis. For each shRNA virus and time point at least five mice were injected. Data were analyzed by paired t-test.
Immunohistochemistry
Sagittal brain sections (60–75 μm) were cut with a vibratome (Leica VT1000S, Leica, Germany). Immunostaining was carried out on free-floating sections. Slices were blocked in 0.5–1% Triton and 1% normal goat serum. Primary and secondary antibodies were described above. Sections were mounted onto slides with Moviol and subsequently analyzed on an upright fluorescent microscope (Zeiss Axioplan 2, Zeiss, Germany).
Western Blot Analysis
For Western blot analysis protein samples were boiled in SDS gel sample buffer. Denatured proteins were separated by SDS-PAGE, transferred onto PVDF membranes and probed with antibodies. For statistical analysis antibody signals were quantified using ImageJ software and values were normalized to the corresponding β-actin signals. Statistical analysis was performed with paired t-test.
Search for Genes Involved in Migration of RMS Neuroblasts
Obtaining specific mRNA for posterior and anterior RMS
Our study employed transgenic 5HT3A-EGFP mice, in which the enhanced green fluorescent protein, EGFP, is expressed from the promoter of the serotonin receptor gene 5HT3A. The unique and faithful expression pattern of the transgene has been reported elsewhere (Inta et al., 2008
). In 5HT3A-EGFP mice, there is strong EGFP expression in the RMS thus allowing the visualization of this long-distance oriented postnatal migratory pathway (Figure 1
A), which represents a unique, robust structure and a valuable source of migrating neurons. Double labeling experiments with cell-type specific markers demonstrated that all EGFP-positive cells in the RMS are neuroblasts since they express doublecortin (neuroblast marker) but not GFAP (astrocyte and stem cell marker) or CNP (oligodendrocyte marker) (Inta et al., 2008
). Since RMS neuroblasts originate in the SVZ from non-migrating cells, expression of migratory genes should be activated during initial migration of the neuroblasts. Although, neuroblasts in the posterior RMS (pRMS, RMS part in the immediate vicinity of the SVZ) already migrate and express some obligatory migratory genes (e.g. coding for cytoskeleton filament constituents), one expects that the signaling underlying active migration in the RMS to be more pronounced in the anterior RMS (aRMS, RMS part near OB). We have evidence that genes involved in differentiation are upregulated mostly after neuroblast arrival to their final position in the OB as indicated by triple comparison of the microarray data from pRMS and aRMS (this study) and immature periglomerular cells (Khodosevich et al., 2007
; Khodosevich and Monyer, unpublished data). Thus, for a whole-transcriptome search of genes involved in postnatal cell migration of a homogenous, well defined cell population, we compared the gene expression pattern of neuroblasts from aRMS(Figures 1
A,B, red oval) and pRMS (Figures 1
A,B, orange oval).
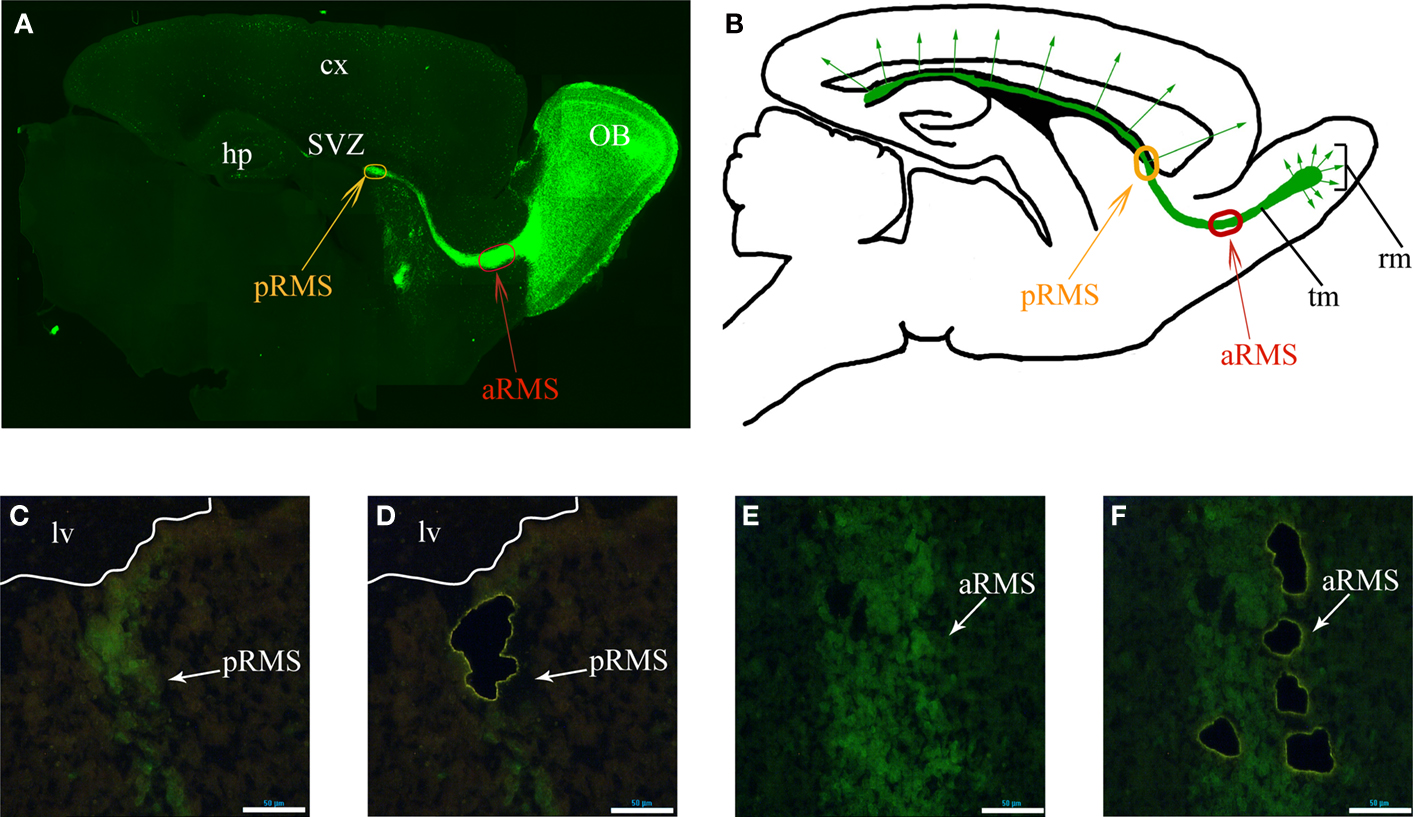
Figure 1. Identified RMS areas serving as source for gene expression analysis. (A) Sagittal view of 5HT3A-EGFP mouse RMS stained with anti-EGFP antibodies. Orange and red ovals indicate the posterior and anterior RMS (pRMS and aRMS), respectively. (B) Scheme of sagittal view of section shown in (A), modified from Inta et al., (2008
). In the RMS neuroblasts migrate tangentially while after reaching the OB they migrate radially. (C–F) Laser microdissection of green cells from pRMS and aRMS. (C) and (D) pRMS before and after EGFP-neuroblast microdissection, respectively. White line is a border of lateral ventricle. (E,F) aRMS before and after EGFP-neuroblast microdissection, respectively. In (C–F) scale bars are 50 μm. Cx – cortex, hp – hippocampus, lv – lateral ventricle, rm – radial migration, tm – tangentional migration.
To isolate EGFP-positive neuroblasts from the two RMS areas, we used the previously described approach for gene expression analysis of in vivo fluorescent cells by LMD (Khodosevich et al., 2007
). After perfusion, fixed brains were frozen and sliced into single cell layer sections. To further improve the specificity of microdissection, only bright green cells were dissected. After neuroblast microdissection (Figures 1
C–F), RNA was isolated by an optimized procedure (Khodosevich et al., 2007
) and used for two rounds of amplification employing a MessageAmp II aRNA Amplification Kit (Ambion, USA). RNA from the second round of amplification was used for microarray hybridization.
Microarray analysis of differentially expressed genes in aRMS versus pRMS
To determine those genes that showed a significant change in expression in the aRMS compared to pRMS, microarray data were analyzed by Affymetrix software using (for details see Supplementary Material) using the following parameters: (1) the gene under analysis had to have present calls in all microarray hybridizations, (2) the adjusted p-value was <0.002 or >0.998 for all probe pairs and (3) the gene had to be up/downregulated in at least six out of nine comparisons (three microarrays of pRMS are compared with three microarrays of aRMS). Whilst these strict criteria might result in some ‘false negatives’, they reduce the generation of ‘false positives’. A total of 1,100 genes were significantly up- or downregulated in neuroblasts of aRMS compared to pRMS, with 650 having a more than two-fold change in all comparisons (see Table 1
for top 20 upregulated genes; for a full list of upregulated genes see Table 1 in Supplementary Material). Most of the downregulated genes in aRMS are likely to have a role in neurogenesis, given that fewer cells undergo cell division at a location in the stream that is further away from the SVZ. Here, we aimed at the identification of genes that are involved in cell migration and thus we concentrated on genes that are upregulated in the aRMS compared to pRMS. Not surprisingly, we could identify genes that belong to gene classes that had been shown to be involved in cell migration (Ghashghaei et al., 2007
; Lledo et al., 2006
; Ridley et al., 2003
; Zheng and Poo, 2007
), including cell adhesion molecules (Pcdh7, Hnt), cell membrane receptors (Epha6, Glrb), GFs (Tgfbi, Fgf12, Pdgfc), signal transduction genes (Errfi1, Ppm1a, Srpk2, Cdc42, Ppm1l, Plcb4, Arpp21, Prkcz), transcription regulating genes (Ets1, Snrpn, Shprh, Sfrs1) and Ca2+-signaling genes (Cadps2, Camk4).
Confirmation of microarray data
To validate the microarray data, we arbitrarily chose 26 genes and analyzed their expression by qRT-PCR (Table 2
). We selected genes with different extent of change in the array analysis. In all tested cases, up- or downregulation determined by the array data was confirmed by qRT-PCR and in most cases comparable ratios were obtained by the two approaches. Furthermore, comparing our results with in situ RNA hybridization data provided by the Allen Mouse Brain Atlas for adult brain (www.brain-map.org
), it became clear that most upregulated genes have stronger in situ mRNA hybridization signals in the RMS whereas downregulated genes have stronger in situ mRNA hybridization signals in the SVZ (Table 2 and Figure 1 in Supplementary Material).
Bioinformatics Analysis of the Upregulated Genes
Differential expression of gene groups
To understand whether the upregulated genes can be categorized into functionally related sets of genes, we sorted them according to GeneOntology and performed an analysis using Ingenuity Pathway Analysis (IPA), Bibliosphere Genomatix and GOstat. We identified many GeneOntology or IPA gene groups, the expression of which had changed during migration from pRMS to aRMS (Table 2 in Supplementary Material). By GeneOntology we analyzed both upregulated and downregulated genes in the aRMS. It is likely that upregulated genes play a role in brain development, cytoskeleton organization and axon guidance. Conversely, many of the identified downregulated genes have been implied in other studies to be involved in cell cycle regulation, cell division, DNA replication and neurogenesis, which is not surprising given that migrating neuroblasts are derived from SVZ precursor cells. IPA was performed only on upregulated genes and led to the identification of gene groups involved in signal transduction – e.g., calcium signaling, GABA receptor signaling – and cell movement – e.g., integrin signaling and formation of plasma membrane projections, actin cytoskeleton signaling and neurite outgrowth.
Identification of canonical pathways
The microarray data were subjected to a search for canonical pathways by IPA and Bibliosphere software as well as available pathway databases, such as KEGG (Kyoto Encyclopedia of Genes and Genomes) (Table 3 in Supplementary Material). Amongst the identified more than 20 canonical pathways (p < 0.001), some were shown to be involved in migration of other neuronal cell types (e.g., calcium signaling and axonal guidance signaling). Interestingly, we also identified canonical pathways that were shown to be involved in the migration of other cell types. For instance, upregulation of the leukocyte extravasation signaling pathway (p << 0.001) had been demonstrated before to be involved in migration of leukocytes from blood vessels to the site of inflammation (Vicente-Manzanares and Sanchez-Madrid, 2004
) (Table 3 in Supplementary Material). Also, the upregulation of ephrin receptor signaling, actin cytoskeleton signaling and ERK/MAPK signaling found in this study had been characterized in many migrating cell types (Pasquale, 2005
).
Microarray Data Validation Probing the Cytoskeleton Pathway
To confirm the reliability of the microarray data, we selected several genes that had been previously shown to be involved in the cytoskeleton reorganization of different cell types and that based on bioinformatics analysis might be the constituents of a generic cytoskeleton network (Figure 2
A). We performed several in vitro and in vivo tests to investigate whether they are indeed involved in neuroblast migration. Based on the microarray data, fourteen upregulated genes (indicated in bold in Table 2
) involved in cytoskeleton signaling were identified, indicating the importance of this pathway for the migrating neuroblasts. The genes include not only kinases and GTPases, but also several actin polymerization regulating genes (Evl, Enah, Arpc2) (Krause et al., 2003
), genes encoding scaffolding proteins contributing to actin branching (Wasf1, Wasl, Cyfip2) (Takenawa and Suetsugu, 2007
) and a gene coding for a membrane adaptor involved in the correct positioning of the actin filament complex to the cell membrane (Plekha1 or TAPP1) (Hogan et al., 2004
). The majority of the members of the cytoskeleton pathway were shown to be involved in cell migration. However, in most previous studies the analysis was confined to one gene only and the experiments were carried out in vitro (e.g., Hogan et al., 2004
; Krause et al., 2003
; Polleux et al., 2002
; Segarra et al., 2006
; Takenawa and Suetsugu, 2007
). Here, we investigated several members of the cytoskeleton pathway and the functional assays do not only validate the microarray data, but in conjunction with previous studies our results highlight the significance of this pathway for the migration of several neuronal and non-neuronal cell types.
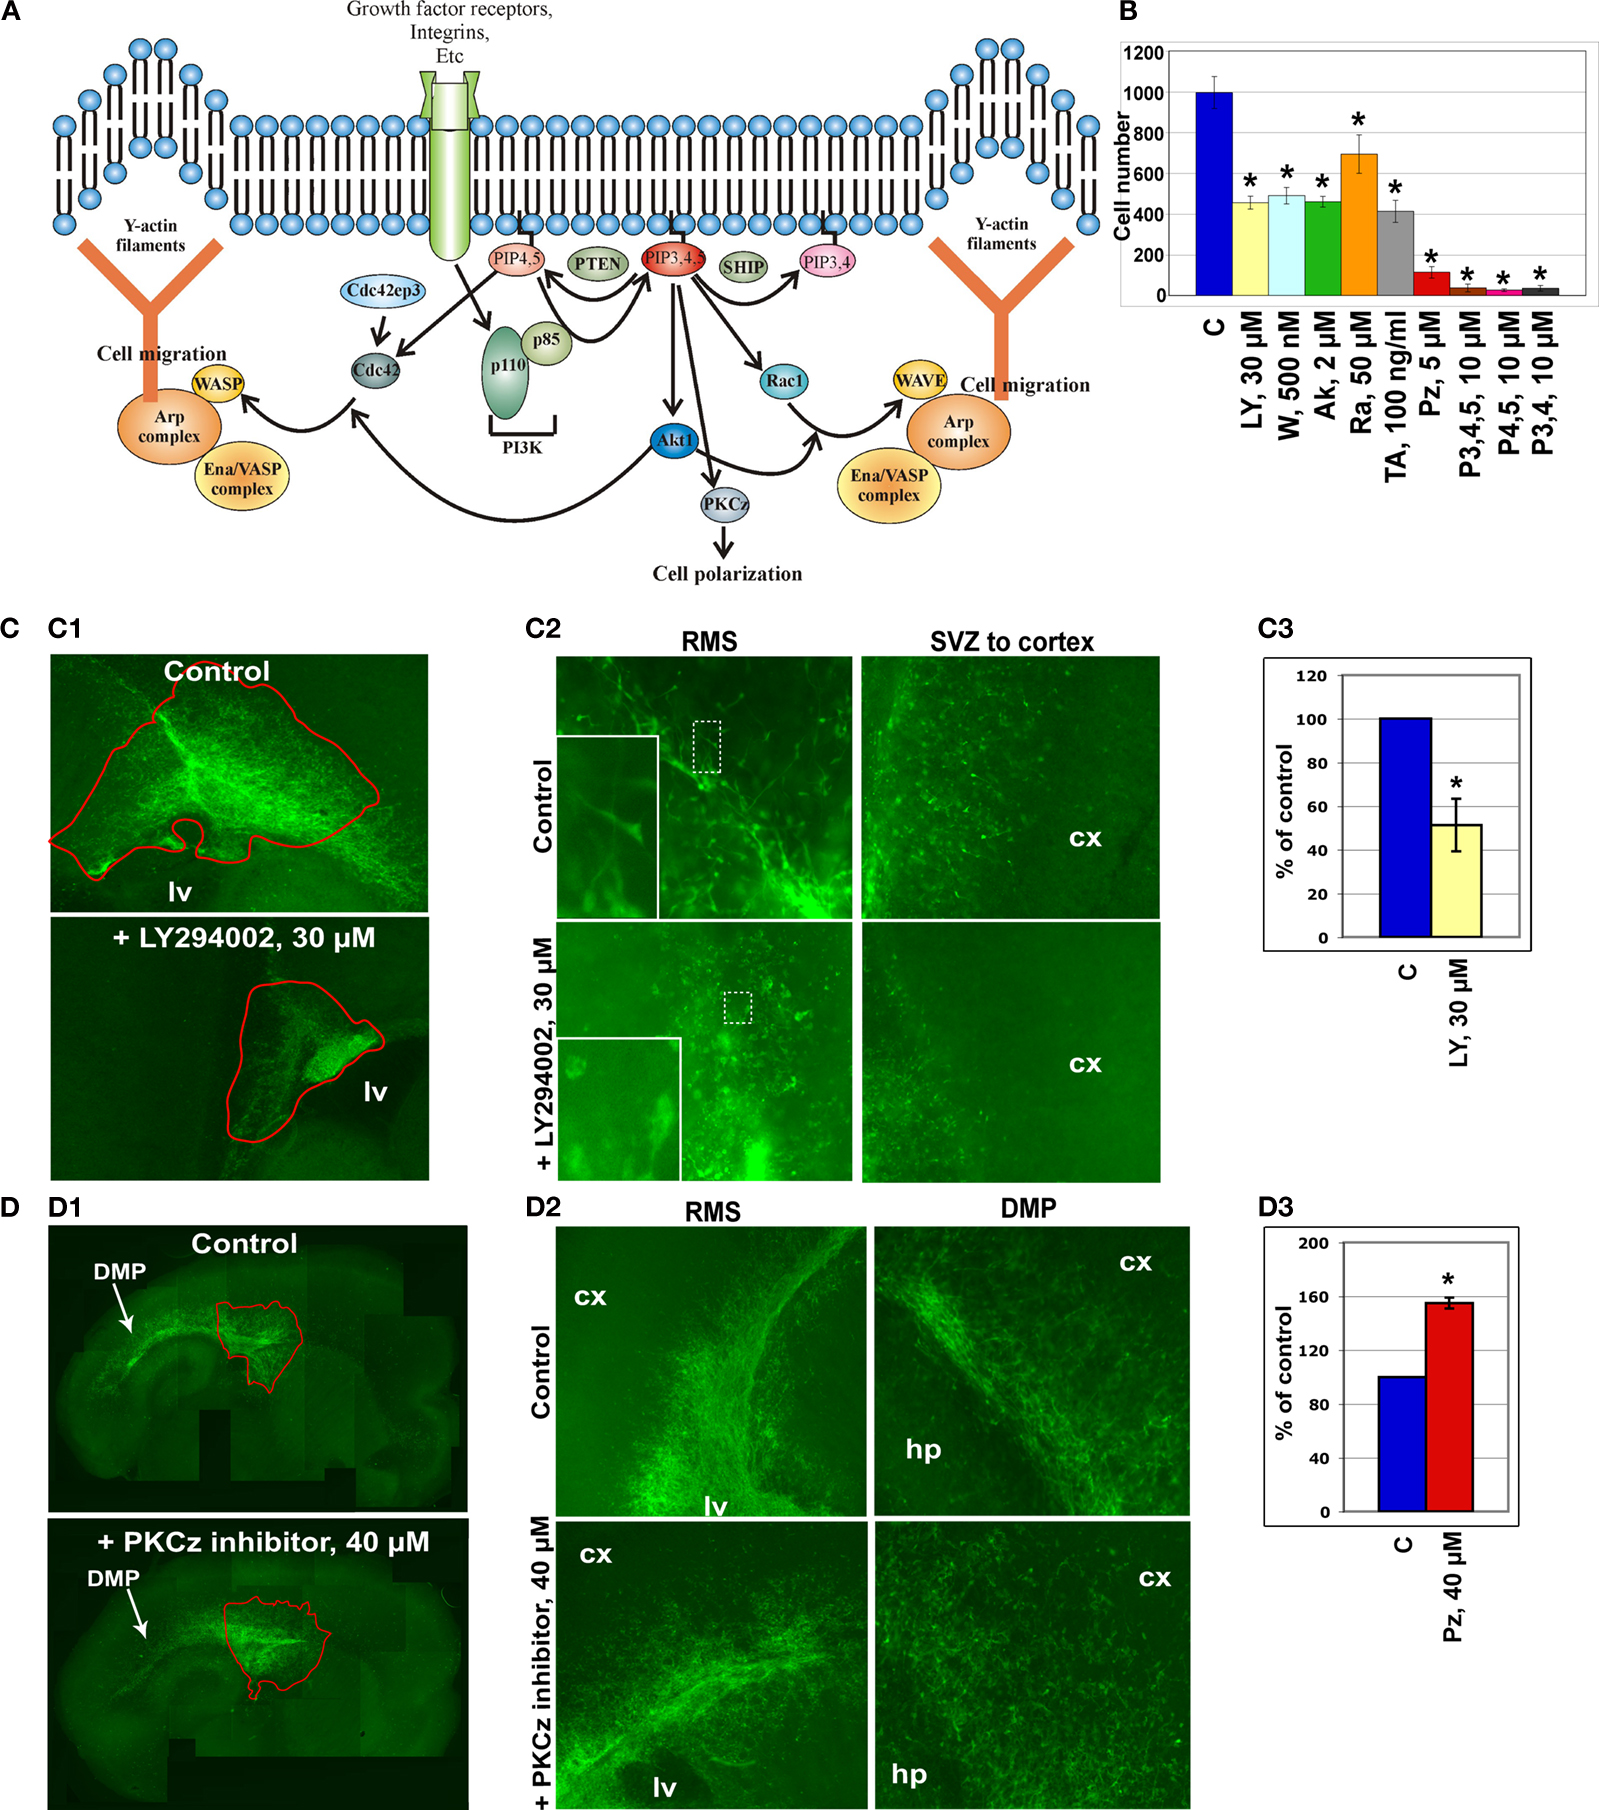
Figure 2. In vitro analysis of the cytoskeleton pathway. (A) Cytoskeleton pathway involved in neuroblast migration resulting from the microarray data analysis. (B) Boyden chamber migrational assay: dissected neuroblasts were plated on a porous membrane, were allowed to migrate for 24 hours and Tuj1-positive cells were then counted (p < 0.001). (C,D) Migration analysis in organotypic cultures obtained from 5HT3A-EGFP mice. (C1) PI3K inhibitor (LY294002) severely disturbed neuroblast migration. Migration was quantified as the ratio of the EGFP-positive neuroblast containing area surrounding the SVZ between untreated (control) and treated (inhibitor) slices (obtained from the same sagittal level) after 4 days in culture (n ≥ 5 slices per condition). (C2) Higher magnifications of RMS and SVZ in control and PI3K inhibitor-treated slices. Insets: note that LY294002-treated neuroblasts have short or no neurite compared to control neuroblasts. (C3) Quantification of the LY294002 effect (n = 5, p < 0.001). (D1) Effect of PKCζ inhibitor. (D2) Directionality of neuroblast migration and, therefore, cell polarization is disturbed after PKCζ inhibitor treatment. Neuroblasts do not migrate in the streams, but migrate in all directions. This is clearly visible in the cortex where there are significantly more neuroblasts in PKCζ inhibitor-treated slices compared to control slices. (D3) Quantification of the PKCζ inhibitor effect (n = 6, p < 0.005) Abbreviations: Ak – Akt1 inhibitor, C – control, cx – cortex, hp – hippocampus, lv – lateral ventricle, LY – PI3K inhibitor LY294002, P3,4,5 – PIP3,4,5; P4,5 – PIP4,5; P3,4 – PIP3,4; PZ – PKCζ inhibitor, Ra – Rac1 inhibitor, TA – Rho GTPases inhibitor Toxin A of C. difficile, W – PI3K inhibitor wortmannin.
Boyden chamber migrational analysis
The first functional test involved studies of neuroblast migration in a Boyden chamber. Neuroblasts were dissected from the SVZ and RMS of wild-type mice, triturated and plated on the membrane in the upper chamber containing different protein inhibitors at previously established concentrations (Figure 2
B).
Inhibitors of PI3K, Akt1, Rac1 and Cdc42 decreased by two-fold and more the number of neuroblasts that migrated to the lower chamber within 24 hours. Phosphatidylinositols (PIPs) phosphatidylinositol-3,4-biphosphate (PIP3,4), phosphatidylinositol-4,5-biphosphate (PIP4,5) and phosphatidylinositol-3,4,5-triphosphate (PIP3,4,5) have been shown to be critical for cell polarity and thus regulate the direction of cell migration (Niggli, 2005
). Indeed, in this assay, PIPs dramatically decreased the number of migrating neuroblasts. A drastic reduction of neuroblast migration was also obtained with a PKCζ inhibitor that decreased it by 10-fold. Inhibitors of other kinases, e.g., mTOR kinase and Raf1 kinase, did not influence neuroblast migration (data not shown). We also show that the tested protein inhibitors did not influence either neuroblast adhesion or apoptosis, although apoptosis can be induced in this system by manumycin A, an inhibitor of the Ras cell survival pathway (data not shown).
Organotypic culture migrational analysis
A second migration assay employed was organotypic slice cultures. Sagittal brain slices (n = 5–7) of 5HT3A-EGFP mice containing the SVZ with the anterior part of the RMS were cultured for 4 days with or without a protein inhibitor or PIPs (Figures 2
C1,D1). PI3K inhibitor, LY294002, significantly decreased cell migration out of the SVZ (p < 0.001) (Figure 2
C1). Neuroblast migration was quantified as the ratio of the EGFP-positive neuroblast-containing area surrounding the SVZ between untreated control and inhibitor-treated slices after 4 days (Figure 2
C1). LY294002 not only decreased cell migration two-fold (Figure 2
C3), but also changed the morphology of migrating neuroblasts: they had either a smaller neurite or no neurite (in Figure 2
C2 compare insets showing representative examples of EGFP-labeled neuroblasts in control and LY294002-treated slices). In LY294002-treated slices a well-delineated stream of migrating RMS neuroblasts was hardly detectable (Figure 2
C2). Other protein inhibitors also decreased the area of neuroblast emigration (to 88 ± 3% for Rho GTPase inhibitor and to 85 ± 8% for Rac1 inhibitor).
Surprisingly, PKCζ inhibitor significantly (p < 0.005) increased the area containing EGFP-positive neuroblasts (Figures 2
D1–D3). Normally, in sagittal organotypic slices neuroblasts migrate largely in the RMS from the SVZ toward the bulb (not shown on Figure 2
D1) and also caudally above the hippocampus in the dorsal migratory pathway (Figure 2
D1, see also Inta et al., 2008
) where the different postnatal migratory pathways are described in detail). After addition of the PKCζ inhibitor, directionality of neuroblast migration was abolished with EGFP-positive neuroblasts migrating in all directions (the total area of emigration in PKCζ inhibitor-treated slices was increased by 60%, Figure 2
D3). Thus, the two streams could be barely identified in PKCζ inhibitor-treated slices (Figure 2
D2) and many cells could be detected in brain areas lacking migrating neuroblasts in control slices. The role of PKCζ in cell polarization had been shown before also for hippocampal neuronal culture (Shi et al., 2003
).
Analysis of neuronal migration in vivo
Finally, we carried out in vivo studies to analyze the involvement of several genes coding for constituents of the cytoskeleton pathway. We injected recombinant AAV viruses expressing a red-fluorescent marker and shRNAs to particular genes of the pathway (Wave1, Akt1, Rac1, Pik3r1 and Prkcz) into the anterior SVZ (aSVZ)/pRMS of wild-type mice (arrow in Figure 3
A) and counted percentage of red cells that reach OB (red oval in Figure 3
A) out of total number of infected cells on SVZ-RMS-OB route 7 and 10 days after virus injection (n = 5–7 injected mice for each time point).
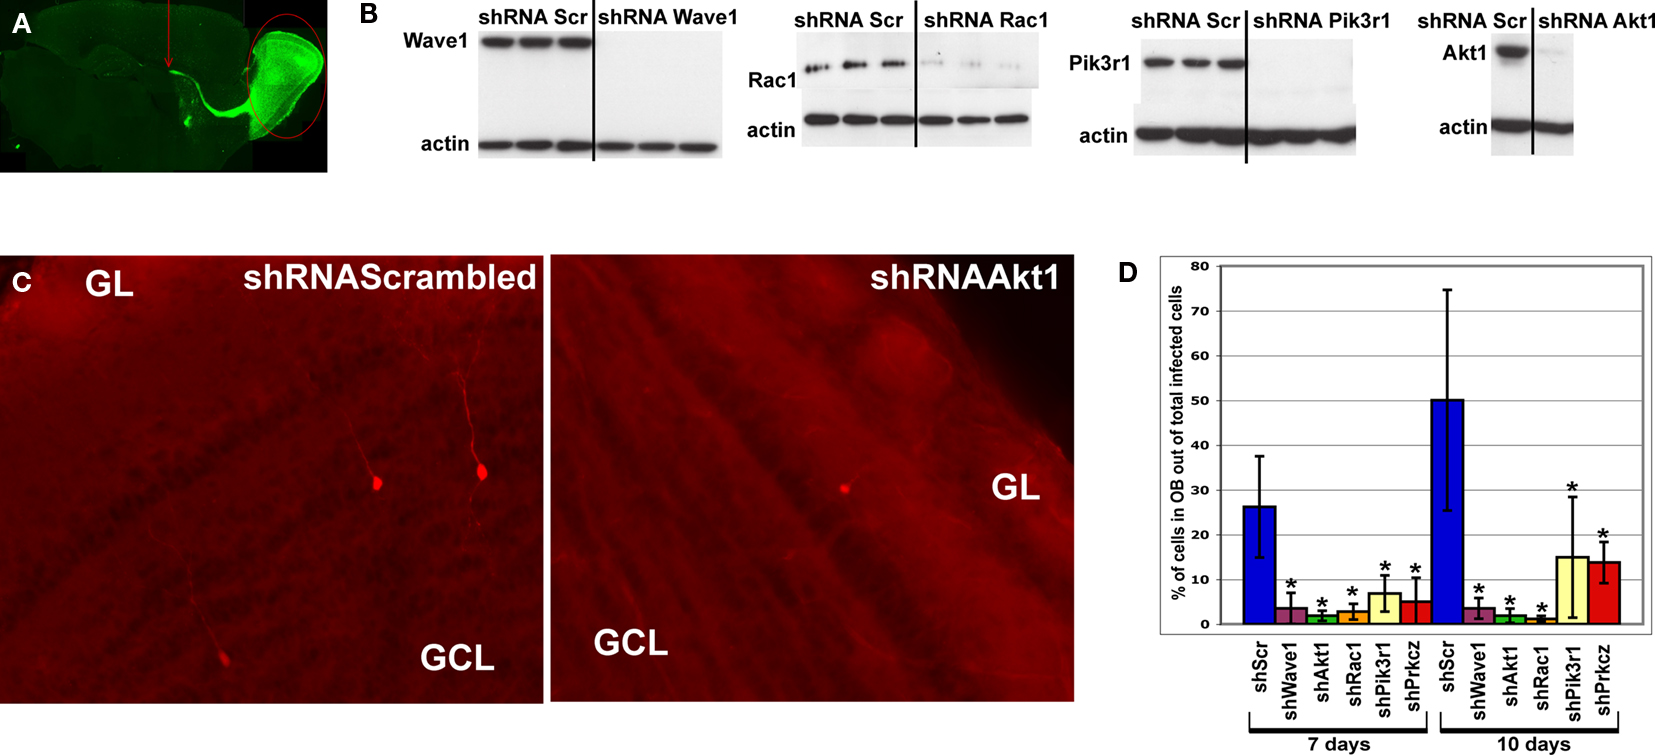
Figure 3. In vivo analysis of the cytoskeleton pathway. (A) Position of injection site (arrow) and destination area of migratory fluorescent cells (oval) after 7 or 10 days post-injection. (B) Western blot analysis of transfected HEK cells illustrating successful knockdown of Wave1, Rac1, Pik3r1 and Akt1. (C) Red fluorescent cells in olfactory bulb infected by shRNAScrambled and shRNAAkt1 viruses. Fewer infected cells were found in OB of shRNAAkt1-injected animals. (D) Percentage of infected cells in olfactory bulb relative to total number of infected cells on SVZ-RMS-OB route after injection of shRNA expressing viruses against genes of the cytoskeleton pathway (*p < 0.005). Gene names are under histogram. GCL – granule cell layer, GL – glomerular layer.
All tested gene-specific shRNAs (Figure 3
B) dramatically decreased the relative number of red cells that migrated to the OB (Figures 3
C,D) compared to virus expressed scrambled shRNA (control) or red fluorescent protein only. Often the effect of the treatment resulting in decreased number of infected neuroblasts in the OB was accompanied by an increase of neuroblasts along the migratory route, visible as labeled cells stacked under the corpus callosum. The phenotypes of animals expressing gene-specific shRNAs are summarized in Table 3
.
Silencing of PKCζ expression caused neuroblasts to change their migration route and arrive into areas where they do not migrate in controls. We found shRNAPKCζ virus-infected cells in entorhinal as well as in piriform cortex, whereas in controls these areas were devoid of infected cells (data not shown). It is likely that in migrating RMS neuroblasts, PKCζ is involved in cell polarization as previously shown for hippocampal neurons (Shi et al., 2003
).
In Vivo Analysis of Novel Networks Upregulated in Migrating RMS Neuroblasts
The thorough functional analysis carried out for the members of the cytoskeleton pathway provides evidence that the upregulated genes identified by the microarray study are indeed important for migrating RMS neuroblasts, and that the analysis can be extended to other genes and pathways. There were numerous novel candidate networks comprising genes that were significantly upregulated in migrating neuroblasts (p-values ranging from 10−10 to 10−42), meriting further attention (Table 4 in Supplementary Material). Four networks were chosen for functional in vivo studies: calmodulin-signaling network, Akt1-DNA transcription network, GF signaling network and MAPK signaling network (Figures 4
A,B and 5
A,B, respectively, and Table 4 in Supplementary Material). These networks were chosen for further analysis firstly because associated p-values were high and secondly they comprised members that instigated our curiosity given that other studies had revealed their significance for neuronal processes not necessarily involved in migration. For instance calmodulin is known to be involved in calcium signaling and has been shown to play a role in numerous neuronal processes, including plasticity or neurotransmitter release (Xia and Storm, 2005
). Furthermore, these networks comprise members that are also constituents of the above described and analyzed cytoskeleton pathway – e.g., Akt1 is a member of both the cytoskeleton and the Akt1-DNA transcription pathways. The occurrence of some genes in different pathways allows grouping them together in a large neuronal migratory signaling complex.
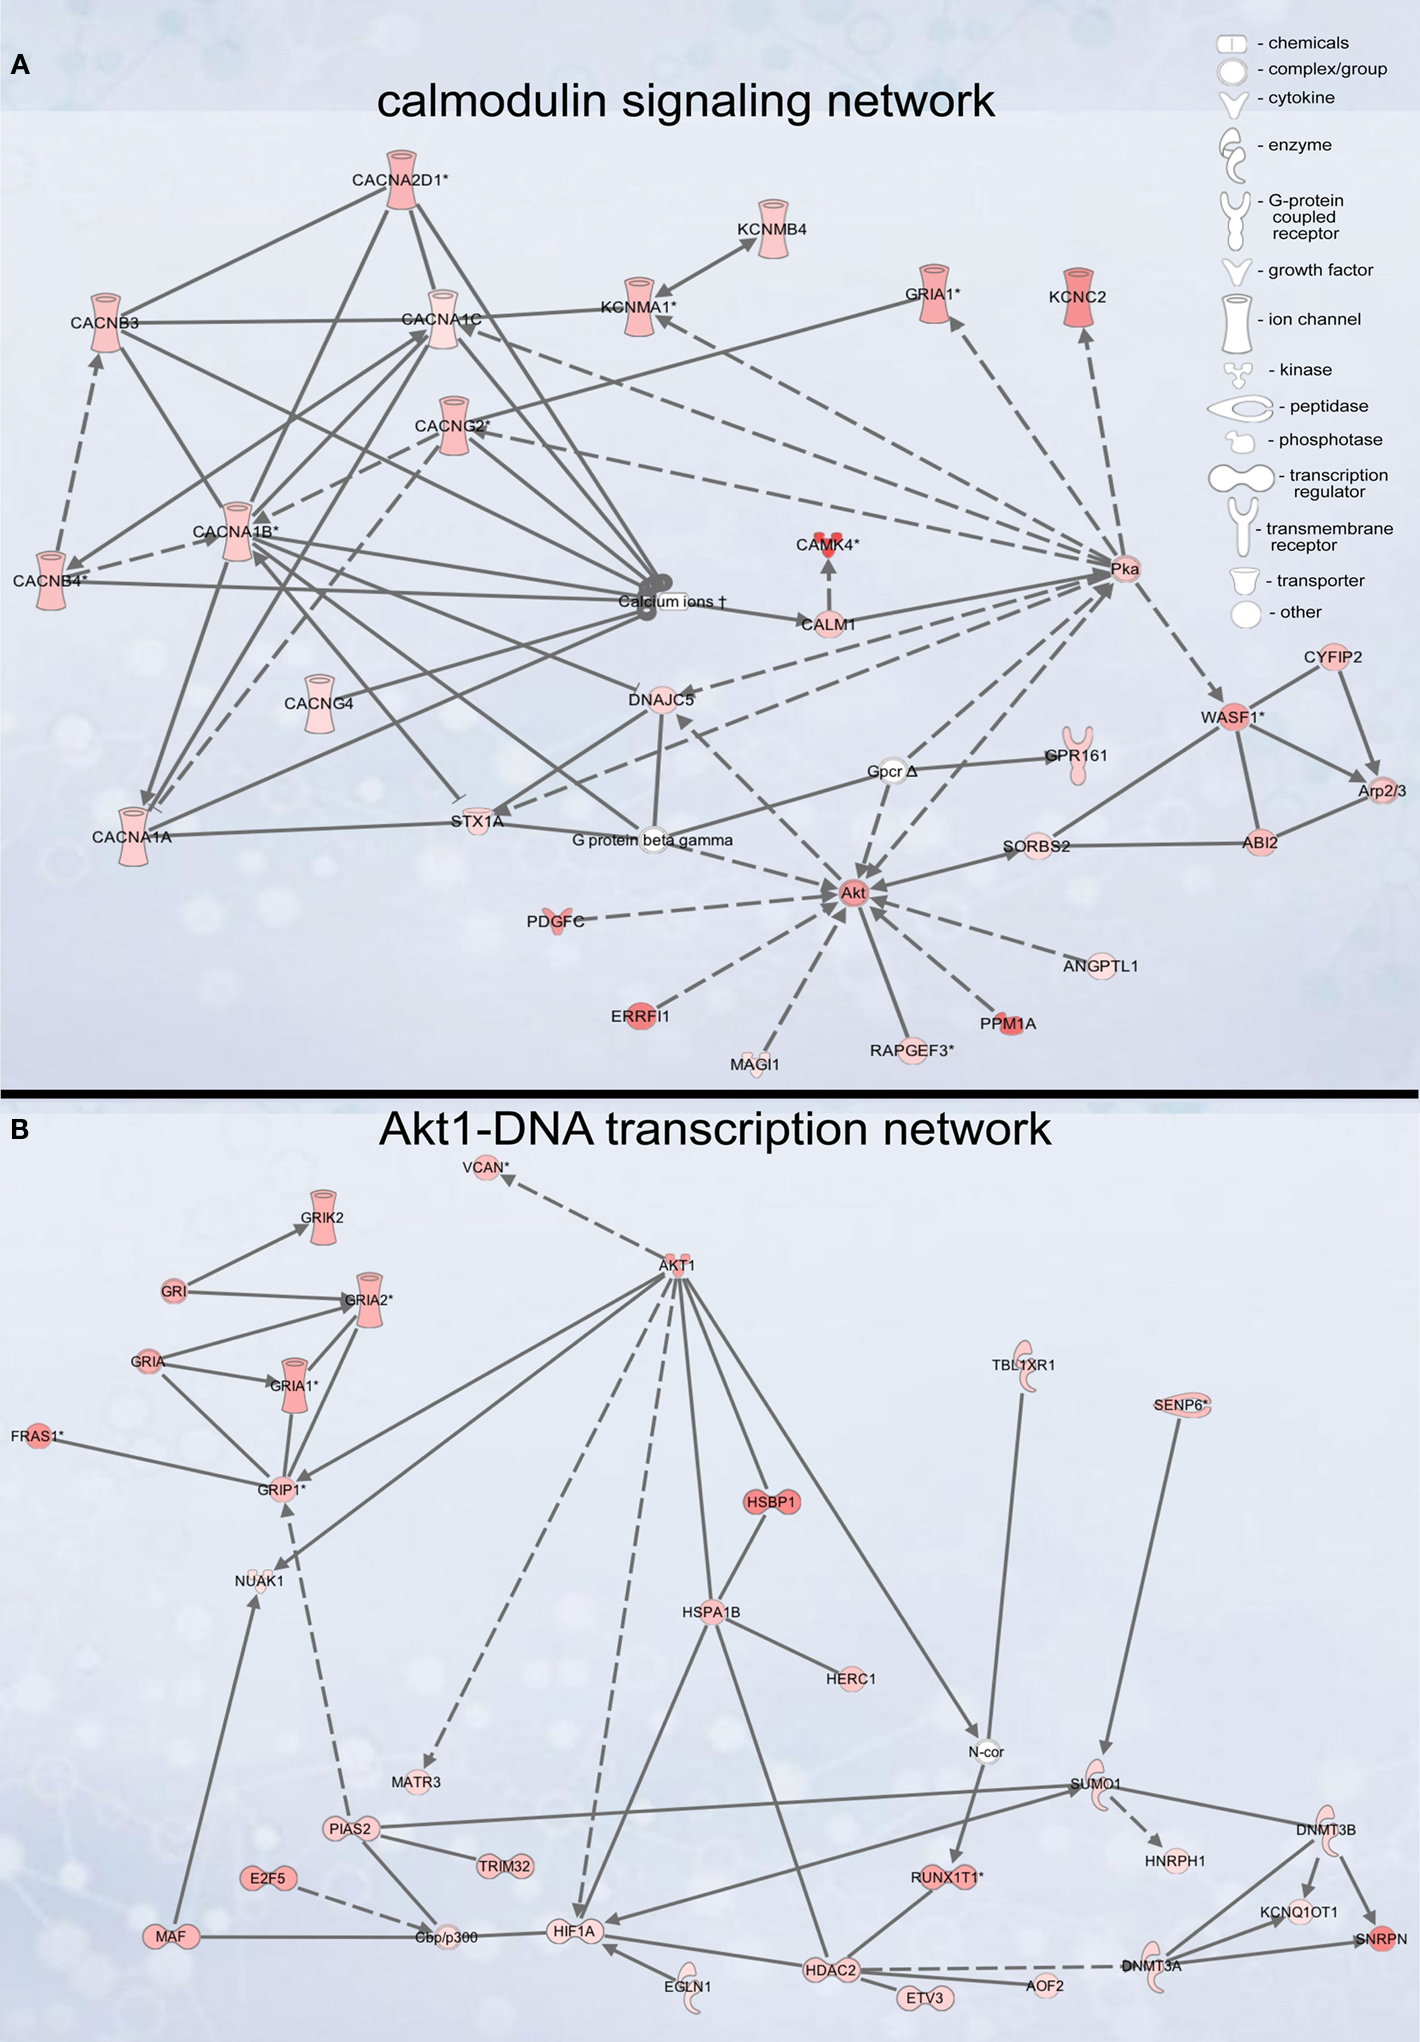
Figure 4. Signaling networks upregulated in migrating neuroblasts. (A) Calmodulin-signaling network. (B) Akt1-DNA transcription network. Networks were identified by Ingenuity Pathway Analysis and subsequently modified using Bibliosphere, PathwayArchitect, GO and pathway databases. The intensity of the red color indicates the extent of gene upregulation. Connecting lines with arrowheads indicate activation of proteins, without arrowheads protein–protein interaction. Continuous and dashed lines are direct and indirect activation/interaction, respectively. Node description is indicated in the right upper corner.
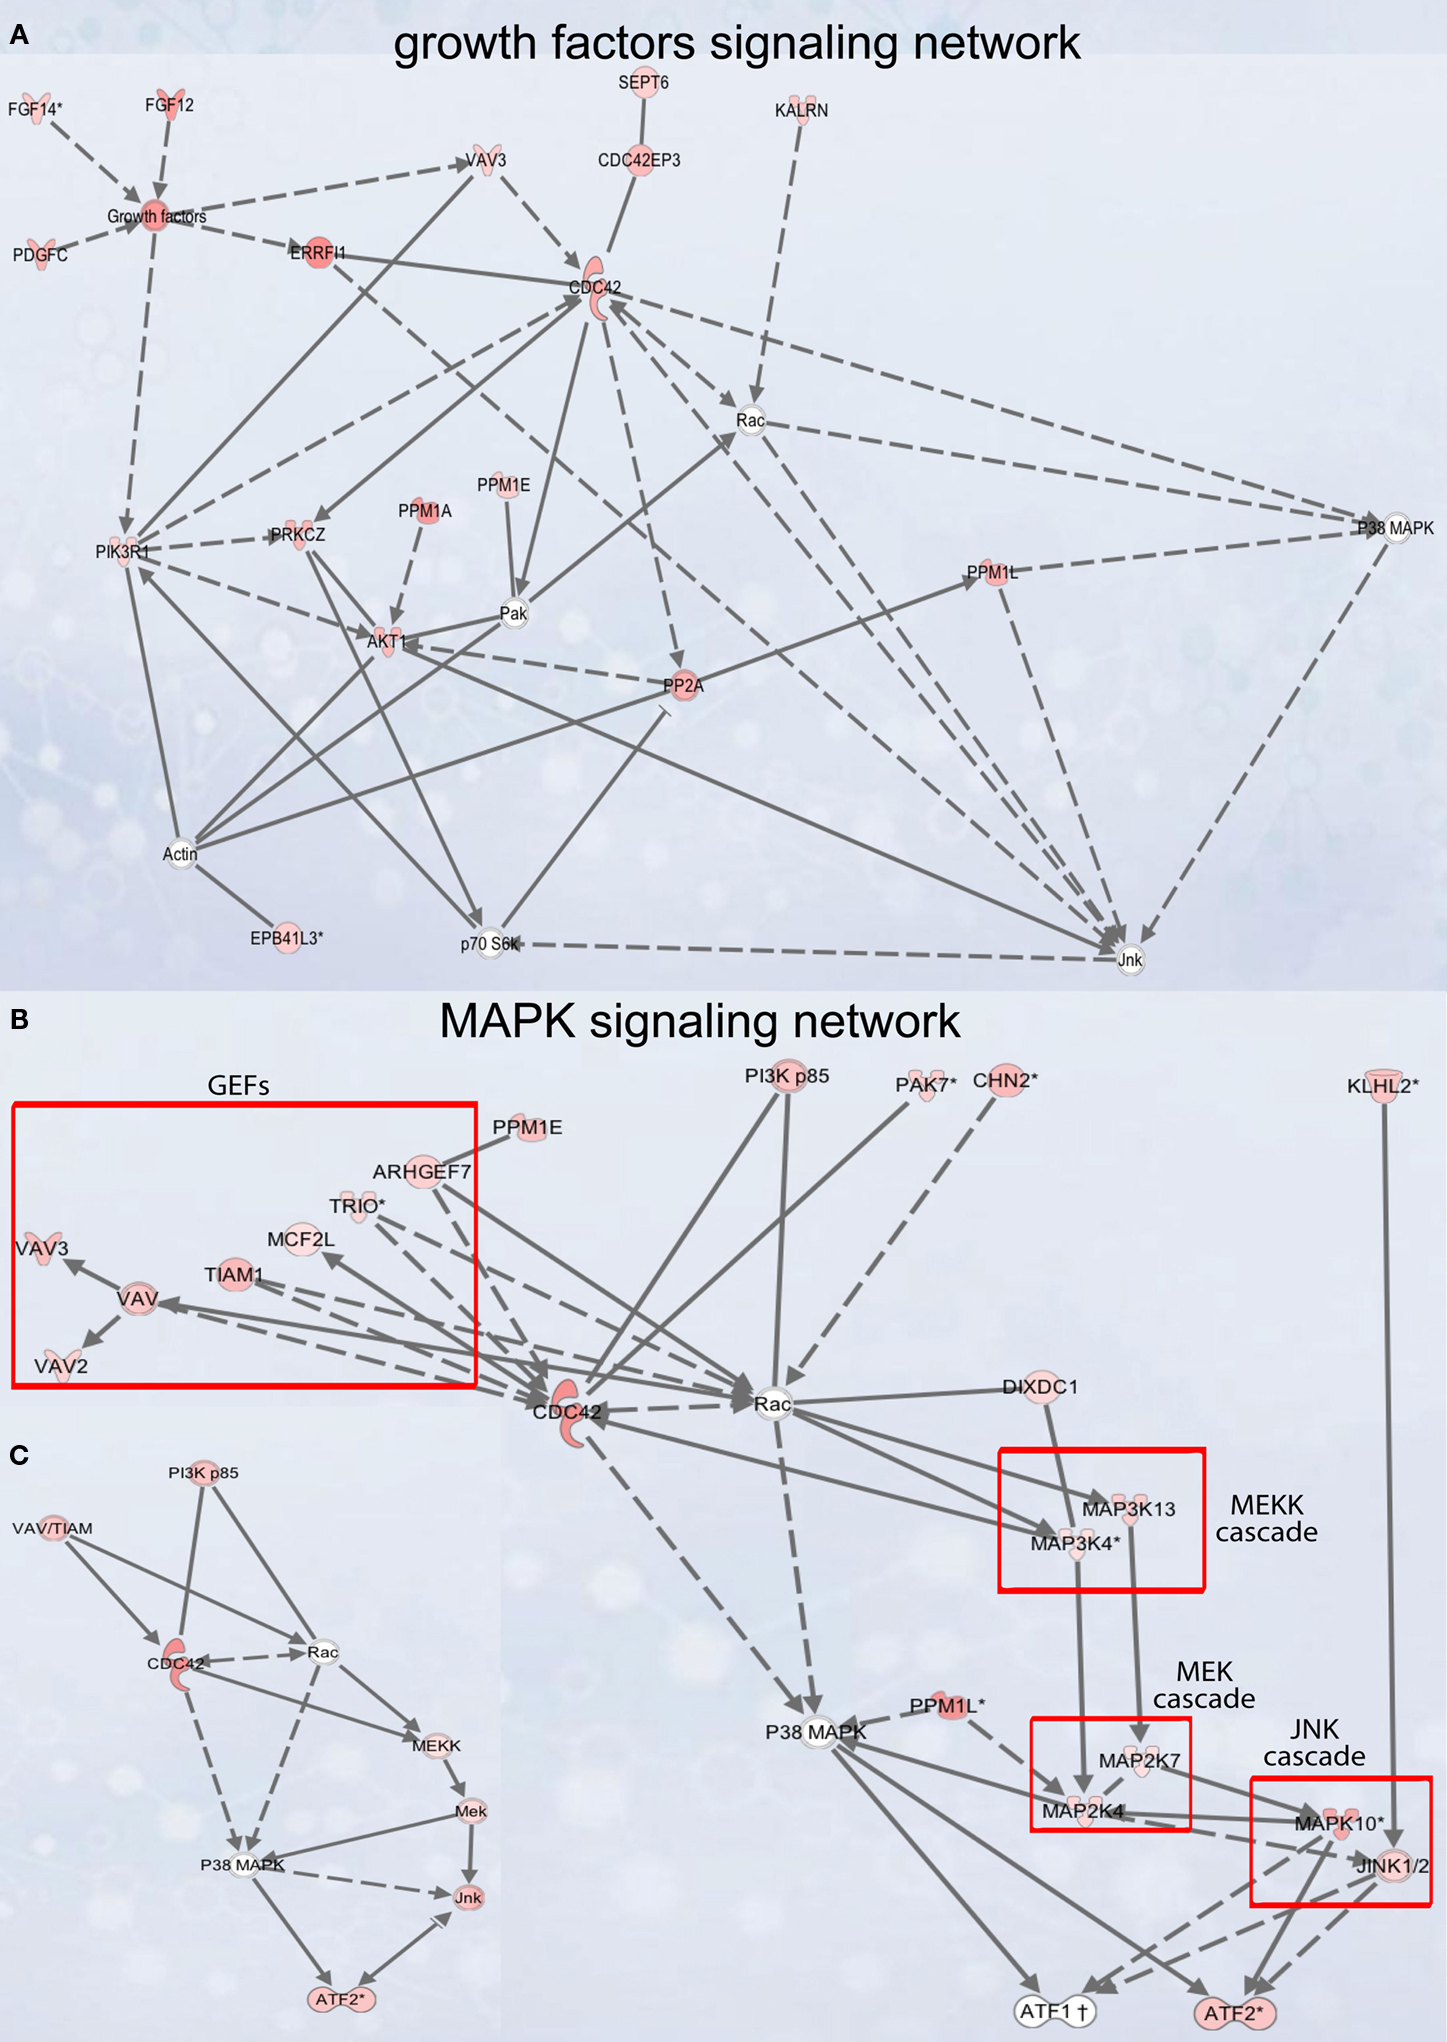
Figure 5. Signaling networks upregulated in migrating neuroblasts. (A) Growth factor signaling network. (B) and (C) MAPK signaling network. (C) is simplified version of (B). Networks were identified by Ingenuity Pathway Analysis and subsequently modified using Bibliosphere, PathwayArchitect, GO and pathway databases. The intensity of the red color indicates the extent of gene upregulation. Connecting lines with arrowheads indicate activation of proteins, without arrowheads protein–protein interaction. Continuous and dashed lines are direct and indirect activation/interaction, respectively. For node description see Figure 4
.
For each network we selected several constituent genes and silenced their expression by injection of recombinant lentivirus expressing shRNAs and EGFP into aSVZ/pRMS of wild-type mice. Knockdown efficiency for all used shRNAs was 75% or higher in transfection and infection experiments (Table 5 in Supplementary Material). After 4 and 7 days, the migration of EGFP-labeled infected cells to OB was quantified. Possible infection of some proliferating cells would not be a confounding issue in this scenario given that the analysis was carried out already a few days post infection. Control experiments indicated that we usually infected only a small number of precursor cells (the vast majority of infected cells were nestin-negative, data not shown). Two shRNA expressing viruses were used for each target gene to avoid off-target effects. For each network at least three genes were selected. The genes were either immediate downstream effectors in the network (e.g., Calm1 and Camk4 in calmodulin-signaling) or appeared to be at crucial points on which signaling within the network converge (e.g., Hdac2 in Akt1-DNA transcription signaling). All genes selected for functional in vivo analysis are expressed in RMS according to in situ data of the Allen Brain Institute (Table 6 in Supplementary Material).
Calmodulin-signaling network
The calmodulin-signaling network involves signaling via voltage-gated calcium channel (VGCC) genes (Cacna1a, Cacna1b, Cacna1c, Cacna2d1, Cacnb3, Cacnb4, Cacng2/Stargazin) and calmodulin 1 (Calm1) that in turn modulate the activity of transcription factor CaMKIV (Camk4), Akt/PKB (protein kinase B) and PKA (protein kinase A), and also the actin cytoskeleton machinery (Figure 4
A). To analyze the importance of calmodulin-signaling for migrating neuroblasts, we silenced the expression of the Ca2+-sensor gene Calm1 and its direct target Camk4. For both we showed a remarkable reduction in the number of neuroblasts that had migrated to the OB 4 or 7 days post-injection (Figures 6
A,B,E,F).
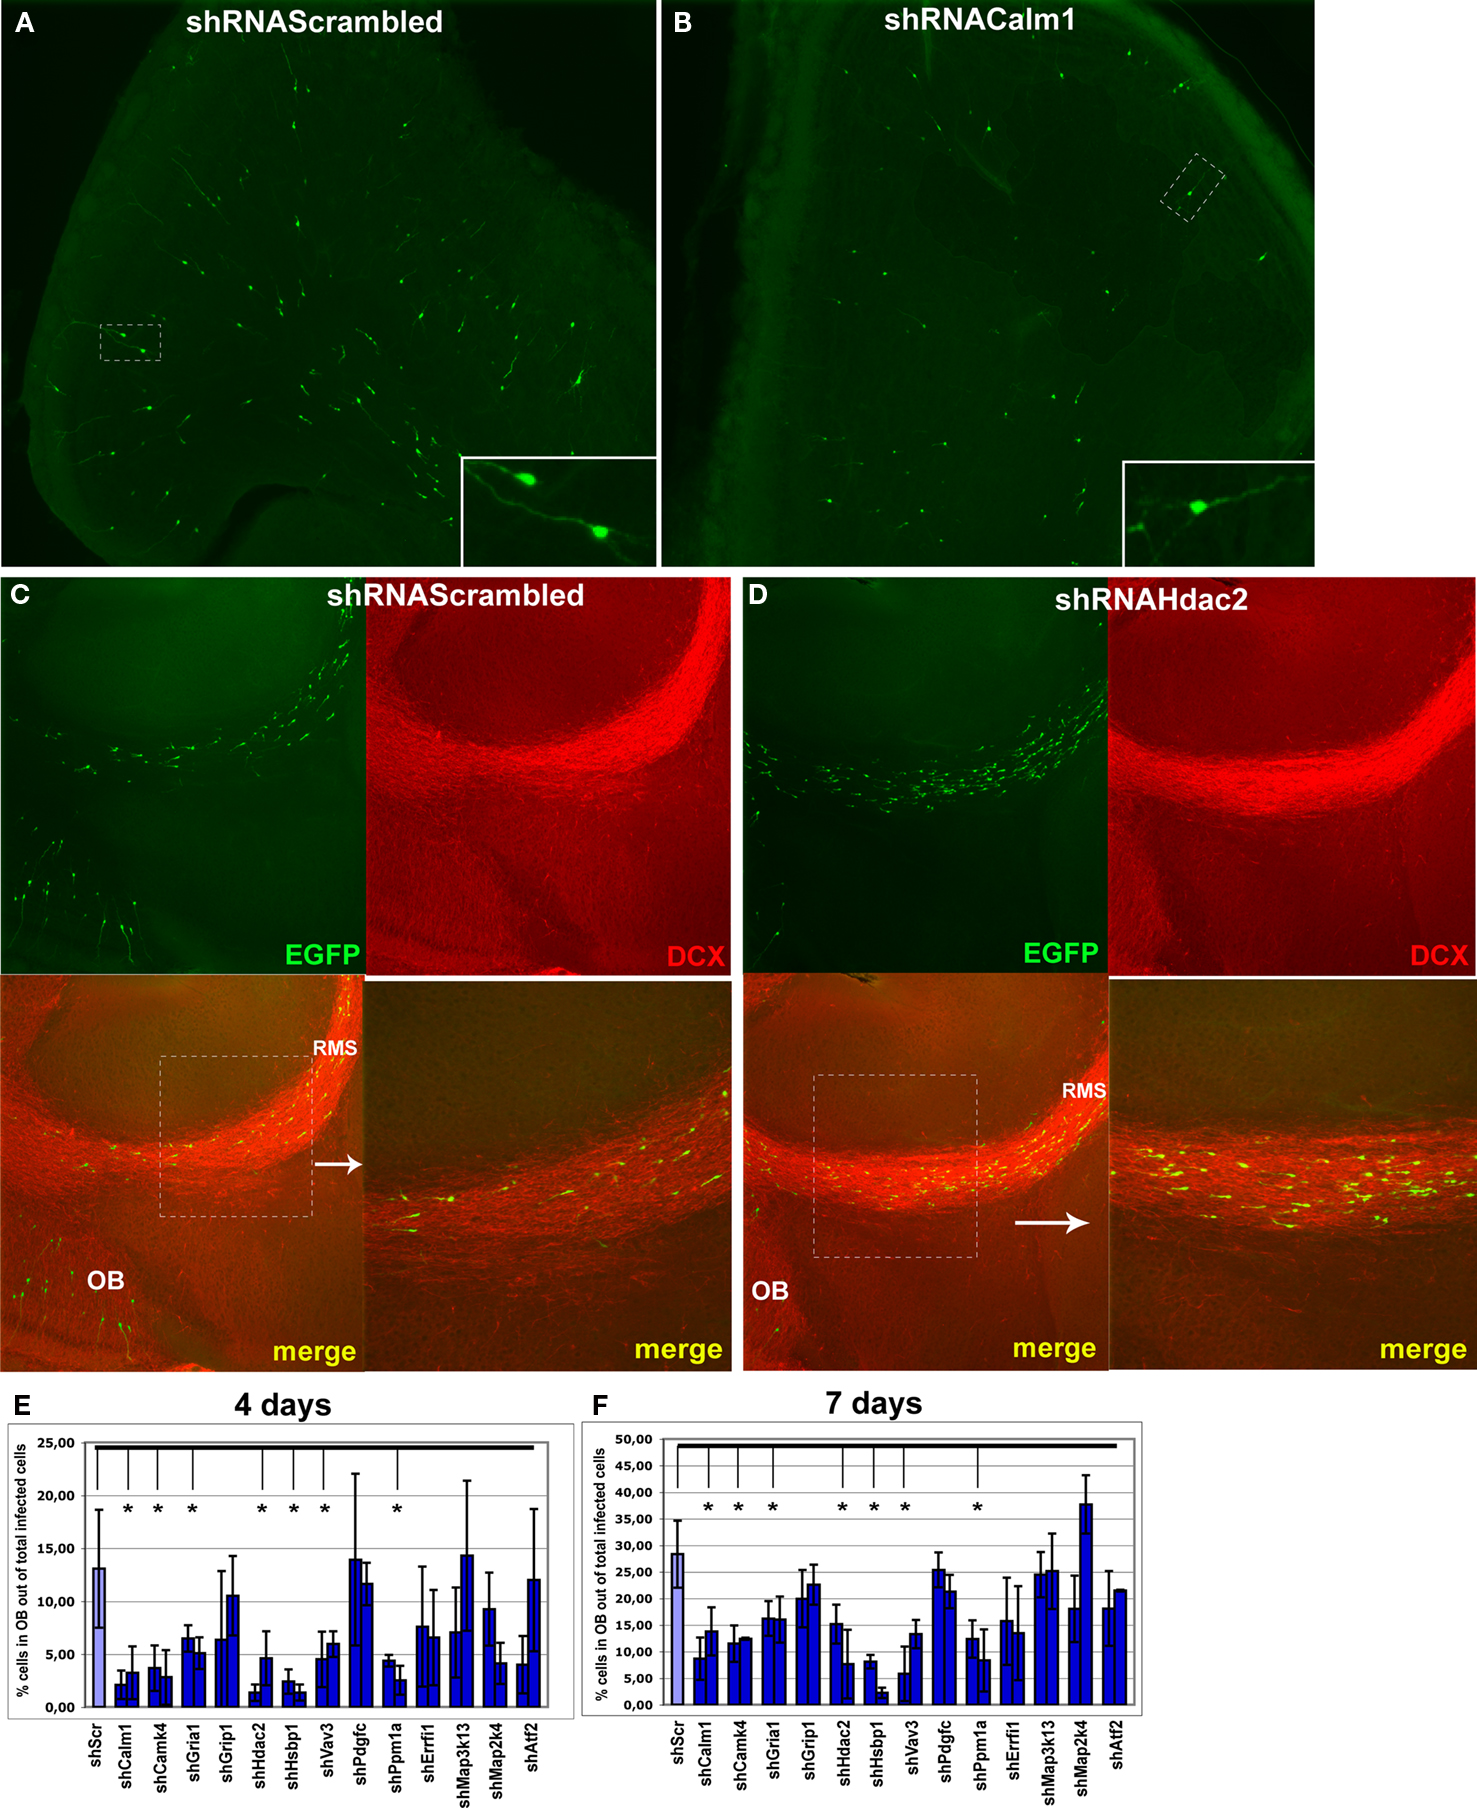
Figure 6. Effect of in vivo gene expression knockdown on neuroblast migration to the olfactory bulb. (A) and (B) Example of gene knockdown effect. Green fluorescent cells in olfactory bulb infected by shRNAScrambled and shRNACalm1 viruses, respectively. Insets show higher magnification of cells indicated by boxed area. Much fewer shRNACalm1-expressing cells reached the OB after 7 days post-injection in comparison to cells infected with shRNAScrambled virus. (C) and (D) Effect of Hdac2 knockdown on neuroblast migration in the RMS. Compared to controls (C), more infected cells were migrating in the RMS 4 days post-injection in shRNAHdac2 (D) virus-infected animals. The RMS is visible as more intensely stained in the panels showing the doublecortin (DCX) expression. (E) and (F) Percentage of infected cells in the OB relative to total number of infected cells on SVZ-RMS-OB route after injection of shRNA expressing viruses into the aSVZ/pRMS, 4 and 7 days post-injection, respectively (*p < 0.001). The two bars denote two different shRNAs used for each gene.
A striking effect was visible when restricting the analysis to the bulb and quantifying the ratio of tangential versus radial migration. Thus, in animals with Calm1/Camk4 knockdown, the number of infected neuroblasts in the part of the RMS within the OB (tangentially migrating cells) was increased with a concomitant decreased number of labeled cells outside of the stream (radially migrating cells) (Figures 7
A,B,D).
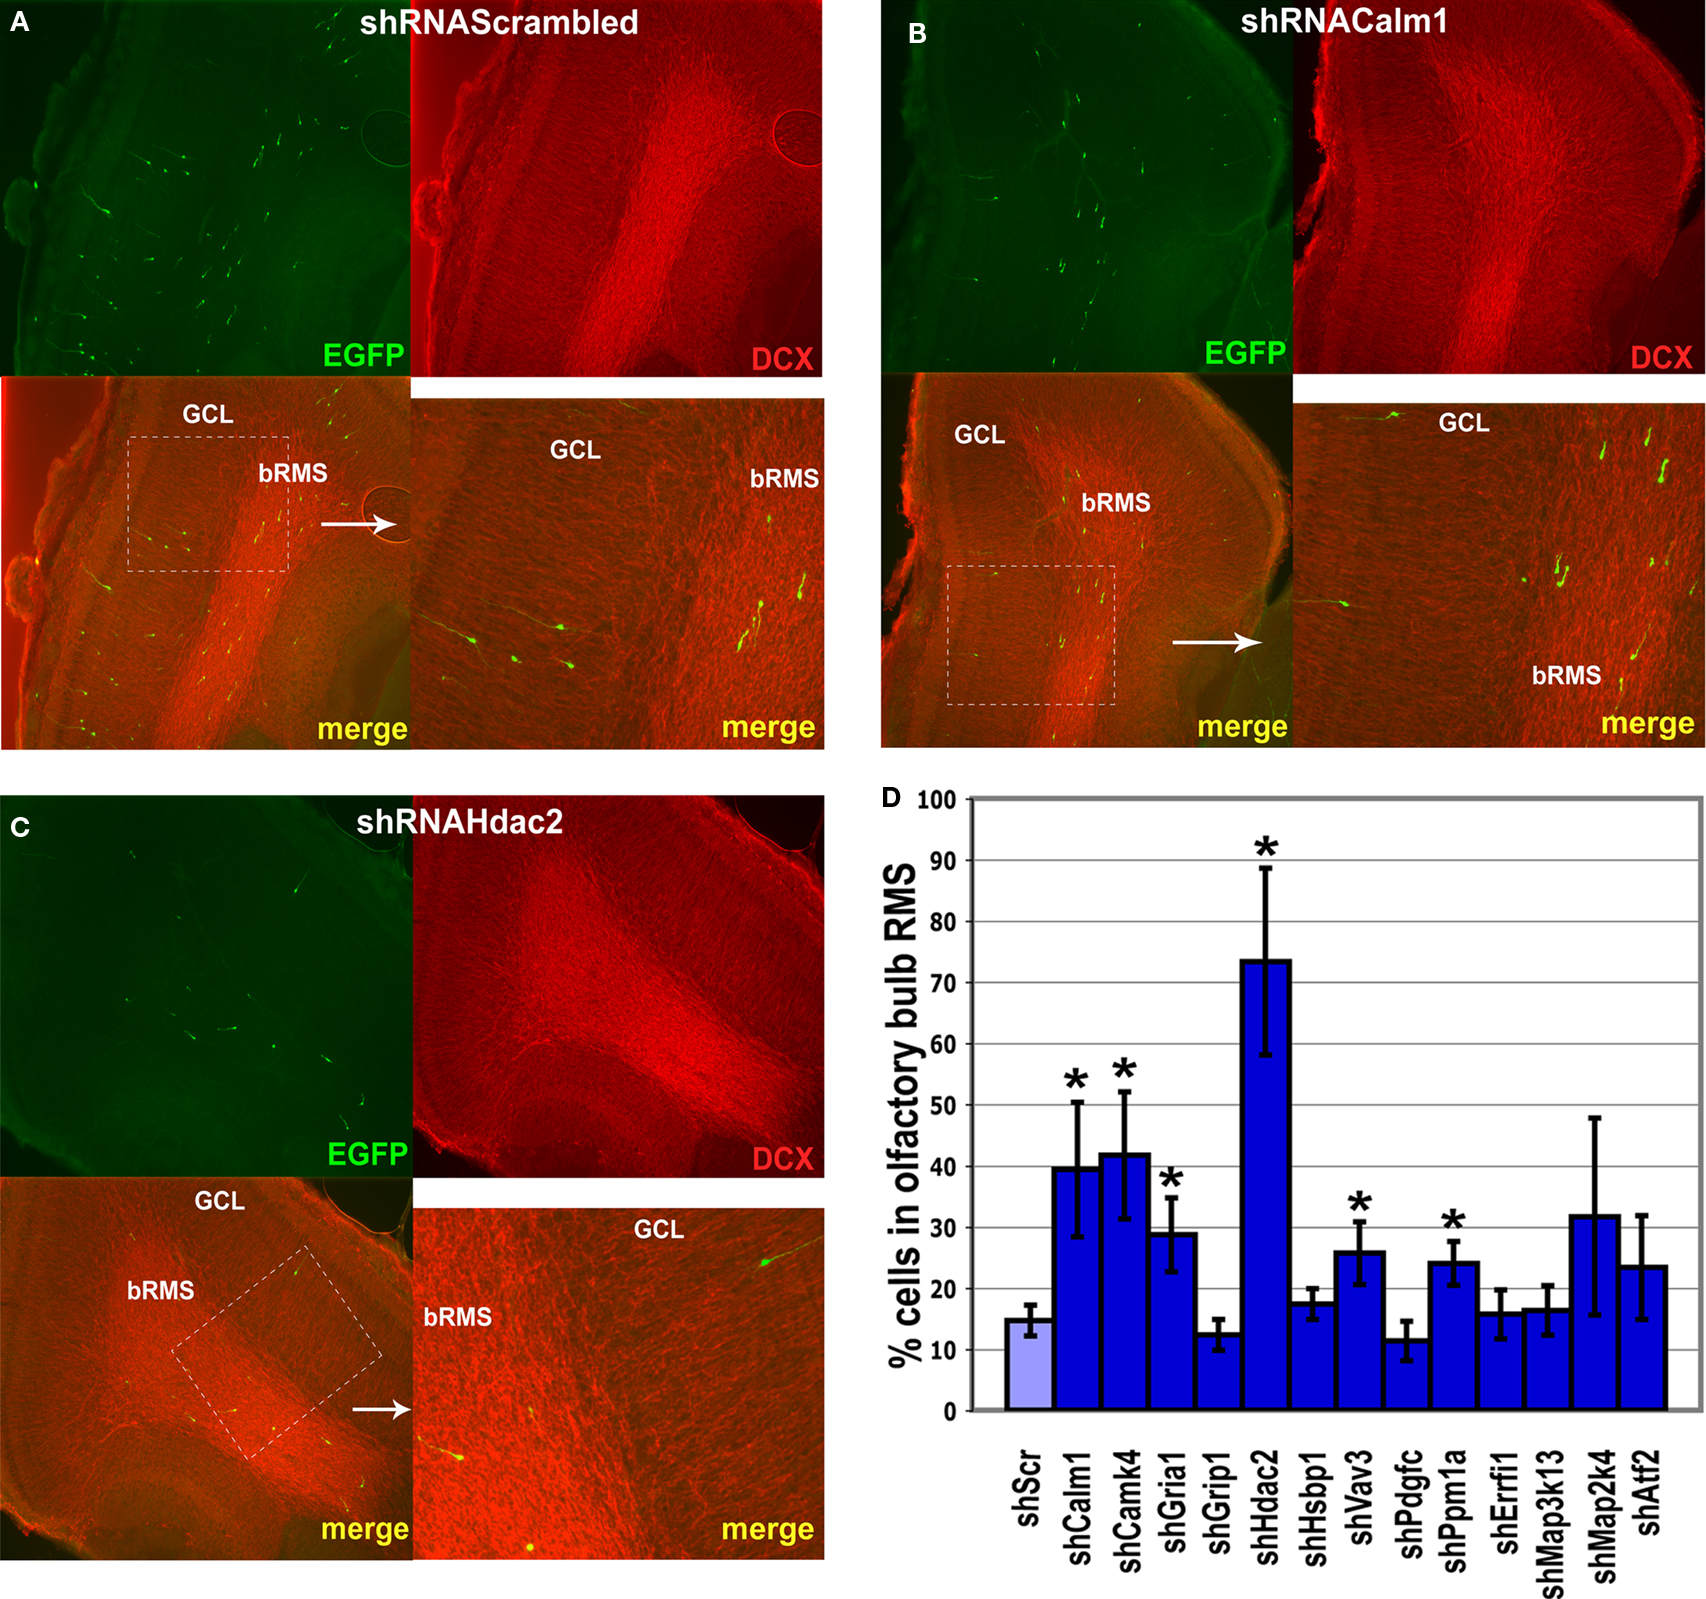
Figure 7. Effect of in vivo gene expression knockdown on neuroblast migration in the olfactory bulb. The RMS within the olfactory bulb (bRMS) is visible as more intensely stained in the panels showing doublecortin (DCX) expression thus clearly delineating it from the more lightly stained granule cell layer (GCL). In comparison to control shRNAScrambled (A), Calm1 (B) or Hdac2 (C) gene knockdown resulted in fewer cells in the GCL but more cells in the bRMS relative to the whole OB 4 days post-injection. (D) Percentage of green fluorescent cells in the bRMS (more intensive red area) to green fluorescent cells in the whole OB in control and gene knockdown experiments (*p < 0.01).
In this network, activation of calmodulin-signaling through VGCC most likely results as a consequence of AMPA receptor activation (Gria1 – GluA1 subunit of AMPA receptor in the Figure 4
A). Indeed, silencing of Gria1 gene expression resulted in a reduction in the number of OB neuroblasts and slowing of their migration (Figures 6
E,F). Furthermore, RMS neuroblasts infected by shRNAGria1 expressing viruses have more neurites than neuroblasts infected by control virus (Figures 8
A–D), possibly interfering with directed migration toward the OB.
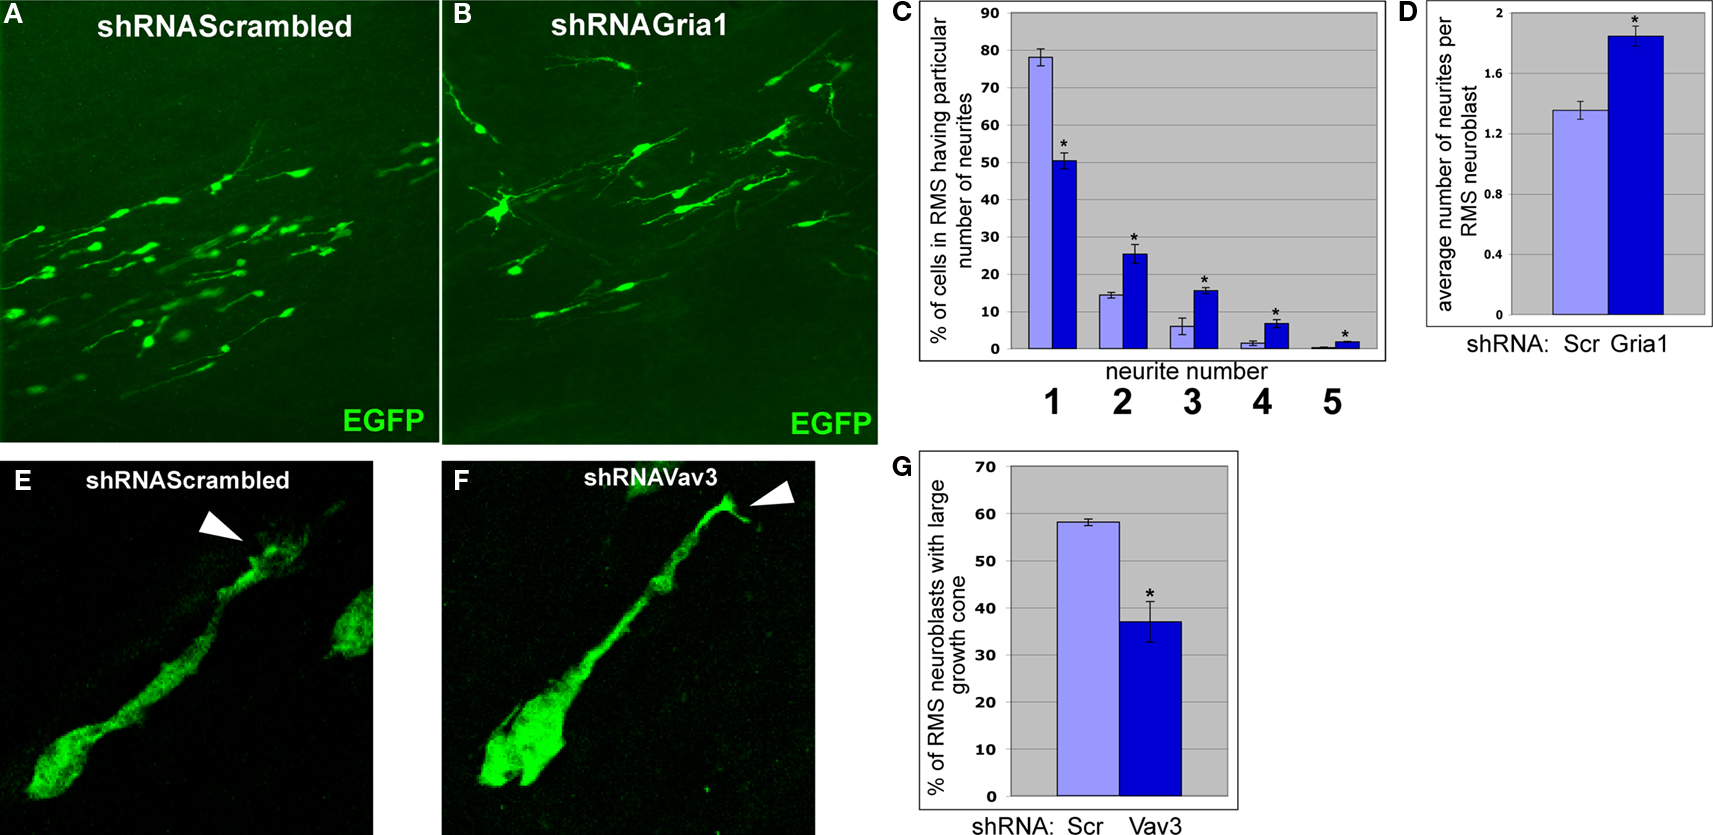
Figure 8. Effects of Gria1 or Vav3 knockdown on the shape of migrating neuroblasts. (A) and (B) Neuroblasts migrating in anterior RMS subsequent to infection with shRNAScrambled and shRNAGria1 expressing viruses, respectively. (C) Gria1 knockdown resulted in a decrease of neuroblasts having one neurite and an increase of neuroblasts having two and more neurites (light blue – control, dark blue – Gria1 knockdown) (*p < 0.005). (D) Gria1 knockdown resulted in an increase in the average number of neurites per neuroblast in the RMS (*p < 0.001). (E) and (F) Typical migrating RMS neuroblast infected by shRNAScrambled and shRNAVav3 expressing viruses, respectively. Arrowheads indicate the growth cones of the leading neurite. (G) In animals infected by shRNAVav3 expressing viruses, fewer neuroblasts in the RMS have a large growth cone (*p < 0.001).
We have analyzed several genes for their possible involvement in neuroblast differentiation (Calm1, Camk4, Vav3 and Gria1). We did not find any morphological difference in infected neuroblast that reached the granule cell layer when comparing control and gene-knockdown animals, at least not during the time period analyzed in this study. There was also no change in neuronal precursor/neuroblast differentiation when tested in an assay using infected neurospheres (data not shown).
Akt1-DNA transcription network
Another identified upregulated network, the Akt1-DNA transcription network (Figure 4
B), couples Akt1 signaling to glutamate receptor signaling, DNA transcription and protein folding. The importance of Akt1 per se for migrating neuroblasts was shown above. Therefore, we analyzed the importance of three major Akt1 effectors in three subparts of the network: Grip1 (glutamate receptor interacting protein 1, glutamate receptor signaling), Hdac2 (histone deacetylase 2, DNA transcription) and Hsbp1 (heat-shock binding protein 1, protein folding). While Grip1 knockdown did not have an apparent effect on neuroblast migration (Figures 6
E,F, 7
D), Hdac2 and Hsbp1 expression silencing decreased the number of infected OB neuroblasts (Figure 6
E,F, 7
D).
Of all genes studied, inhibition of Hdac2 expression had the most prominent effect on neuroblast migration (Figures 6
C–F, 7
C,D). There were only few infected neuroblasts migrating radially outside of the RMS within the OB (Figures 7
A,C) and most neuroblasts in which Hdac2 had been knocked-down resided in the anterior part of the RMS (Figure 6
D).
Hsbp1 silencing decreased significantly the total number of OB neuroblasts but the percentage of cells in the OB RMS relative to the whole OB was comparable to that in controls (Figure 7
D).
Growth factor signaling network
Although the importance of GFs for migrating neuroblasts has been studied for a long time (e.g., see Abrous et al., 2005
; Ghashghaei et al., 2007
), the intracellular network mediating this signaling is by and large unknown. Of note, GF signaling network (Figure 5
A) comprises core members – PI3K, Akt1, Rac1 and PKCζ – that we have shown to be important effectors in the cytoskeleton pathway. We chose three additional proteins from the GF signaling network that could influence the activity of these core members: Vav3 (vav oncogene 3), Errfi1 (ERBB receptor feedback inhibitor 1) and Ppm1a (protein phosphatase 1A). We did not observe any effect for migrating neuroblasts by silencing of Errfi1 expression (Figures 6
E,F, 7
D). However, both Ppm1a and Vav3 silencing decreased the number of neuroblasts migrating to the OB (Figures 6
E,F) associated with an increased number of infected cells in the OB RMS relative to the whole OB (Figure 7
D).
Vav3 codes for guanyl-nucleotide exchange factor (GEF) and was suggested to participate in lamellipodia formation (Hunter et al., 2006
). Neuroblasts migrating in the RMS normally have a neurite ending with a growth cone, a fast-changing structure consisting of filopodia and lamellipodia (Figure 8
E). However, most RMS neuroblasts infected by shRNAVav3 expressing viruses had smaller growth cones (Figures 8
F,G). Thus, migrational defects in shRNAVav3 expressing neuroblasts may result at least in part from a disorganization of growth cone structure.
Interestingly, we found the upregulation of the Pdgfc gene in migrating neuroblasts, which encodes a relatively new member of the PDGF family, and could have an autostimulatory effect on neuronal migration. However, silencing the Pdgfc gene in vivo did not influence neuroblast migration (Figures 6
E,F, 7
D).
MAPK signaling network
We next analyzed in vivo the MAPK signaling network that comprises several separate cascades (Figures 5
B,C as a summary). For Rac1 and its activator Vav3 that are also part of the GEF cascade, we had shown above the involvement in neuroblast migration in vivo. However, when testing in vivo three downstream molecules Map3k13, Map2k4 and Atf2 (activating transcription factor 2) that participate in other cascades of the MAPK signaling network, we did not find an effect on neuroblast migration (Figures 6
E,F, 7
D). It is unlikely that the lack of an effect is due to technical reasons, considering the success for many of the genes that were tested. However, it cannot be excluded with certainty that the extent of gene knockdown as obtained here (reduction of gene expression to at least 25%) sufficed to modify the migrational phenotype of neuroblasts. Another possible scenario for a lack of functional effect could be that the knockdown of a gene in the network is circumvented by the activity of another gene in the network.
Other upregulated networks in migrating neuroblasts
Schemes for other top-scored networks are presented in the Supplementary Material and were not studied functionally (Table 4 in Supplementary Material). The novel networks include calcium signaling networks (Networks 8, 19 and 21), one network comprising genes related to the protein degradation machinery (Network 5), a cAMP signaling network (Network 18) and potential beta-estradiol cascades (Networks 10 and 14).
Of note is also a network that might couple GABA receptor signaling with the actin regulatory protein machinery (Network 12). Previous experiments demonstrated that non-synaptic signaling of GABA decreases neuroblast migration within the RMS (Bolteus and Bordey, 2004
), but the exact mechanism of the GABA action is unknown. Based on our data, a scenario can be envisaged linking GABA activity and neuronal motility. Signaling in this network includes the activity of GABAA receptors, gephyrin (a microtubule-associated protein mediating the interaction of the receptors with the cytoskeleton) and enabled homolog (Enah) (an actin-associated protein inducing polymerization of actin – Krause et al., 2003
). Hence, GABA could inhibit neuroblast migration by affecting the actin machinery remodeling proteins.
Using EGFP-labeled RMS neuroblasts as a model system, we performed a whole-transcriptome search for genes involved in in vivo neuronal migration. Most studies carried out so far investigated the role of external factors for neuronal migration. There is little known about intracellular networks that mediate the cellular response to these factors. We isolated labeled RMS neuroblasts from two distinct locations of their migratory route, thus, expecting a change in the expression of the genes involved in migration. Via microarray analysis, we identified around 1,100 differentially expressed genes, 650 of which changed expression more than two-fold. Bioinformatics analysis revealed many novel candidate networks that may govern neuronal migration. The validity of the microarray data was tested for a number of arbitrarily chosen genes by qRT-PCR. Our data were also in agreement with publicly available in situ hybridization data (www.brain-map.org
). To confirm the reliability of our microarray data, we chose several candidates that might be involved in cytoskeleton reorganization. We demonstrated by several functional in vitro and in vivo assays that the upregulated genes indeed affected migration and could hence be grouped in one functional network. A number of these genes had been previously shown to be involved in cell migration. Thus, PTEN and Plekha1 were shown to affect migration of cancer cells (Dey et al., 2008
) and fibroblasts (Hogan et al., 2004
), respectively. Also PI3K had been demonstrated to be critical for tangential migration of GABAergic interneurons during embryonic development (Polleux et al., 2002
). Whilst these studies are important, they are restricted to the analysis of an individual gene in a defined cell type. The major advance of this study is that the analysis was extended to numerous genes that could be grouped in pathways. Most importantly, we carried out in vivo experiments to test the functional role of several upregulated genes for neuroblast migration. After corroborating the bioinformatics data using as a proof of principle the cytoskeleton pathway, we selected four additional networks, the calmodulin-signaling network, Akt1-DNA transcription network, GF signaling network and MAPK signaling network, to further test in vivo their role for neuroblast migration. The choice of these networks was dictated by the high p-values (indicating a high probability that these networks are activated in migrating neuroblasts) and by the fact that these networks comprised certain genes whose regulation in different contexts had been studied in neurons (e.g., calmodulin in paradigms leading to altered plasticity). Finally, the tested networks have some constituents that they share with the cytoskeleton pathway and could thus be grouped into a larger network whose components are activated during neuroblast migration. We carried out in vivo functional analysis to demonstrate that the selected genes of distinct networks govern neuroblast migration. The tested genes – Calm1, Camk4, Gria1 (calmodulin-signaling), Hdac2, Hsbp1 (Akt1-DNA transcription), Vav3, Ppm1a (GF signaling) – were not known to be involved in neuroblast migration or migration of other cell types.
To date, there have been no studies employing a whole-transcriptome search for genes underlying neuronal migration in vivo. Therefore, we used RMS neuroblasts as a tool for such a search. The programs used for network analysis are based on literature data mining, hence most members in the networks identified here have been shown to interact with at least one other member. Previously described interactions could have occurred in various cell type and in different cellular processes, including migration. The novelty of linking upregulated genes in the networks presented here resides in the identification of many genes that are possibly involved in a distinct cellular process, i.e., migration. Although the statistical values for the described networks are highly significant, such an approach may still result in false positive candidate genes, reason why each network must be functionally analyzed.
We identified several gene networks that migrating neuroblasts share with other types of migrating cells. A striking example is the upregulated Leukocyte extravasation signaling pathway that is involved in leukocyte migration from blood vessels to the site of inflammation (Vicente-Manzanares and Sanchez-Madrid, 2004
) (Table 3 in Supplementary Material). Also, some of the novel networks, such as the GF signaling network (Figures 5
A and 9
), are not neuron-specific but comprise genes that have been shown to affect migration of other cell types.
A major finding of this study is the identification of several novel intracellular networks that we showed to be important for migrating neuroblasts in vivo (Figure 9
). The involvement of Ca2+ in cell migration has been previously described in neurons (Guan et al., 2007
; Zheng and Poo, 2007
). However, an intracellular network mediating this signaling has been missing. According to our functional in vivo results (Figure 9
), calcium entry into migrating neuroblasts first activates calmodulin 1 (Calm1) and as a further downstream effector the DNA transcription factor CaMKIV (McKinsey et al., 2000
) known to modulate several intracellular pathways (Agell et al., 2002
). An important Ca2+ source must be the extracellular Ca2+, given the remarkable upregulation of the VGCC genes (Cacna1a, Cacna1b, Cacna1c, Cacna2d1, Cacnb3, Cacnb4, Cacng2/Stargazin). These channels can be activated via AMPA receptors that were shown to enhance/stimulate GABAergic interneuron migration (Manent et al., 2006
). Indeed, our in vivo experiments demonstrated the importance of the GluA1 subunit regulating neuroblast migration (Figures 6
E,F, 7
D and 8
A–D). Finally, the bioinformatics data indicate a connection with the actin fiber remodeling system via the Wave1 (Wasf1) and Arp2/3 complex.
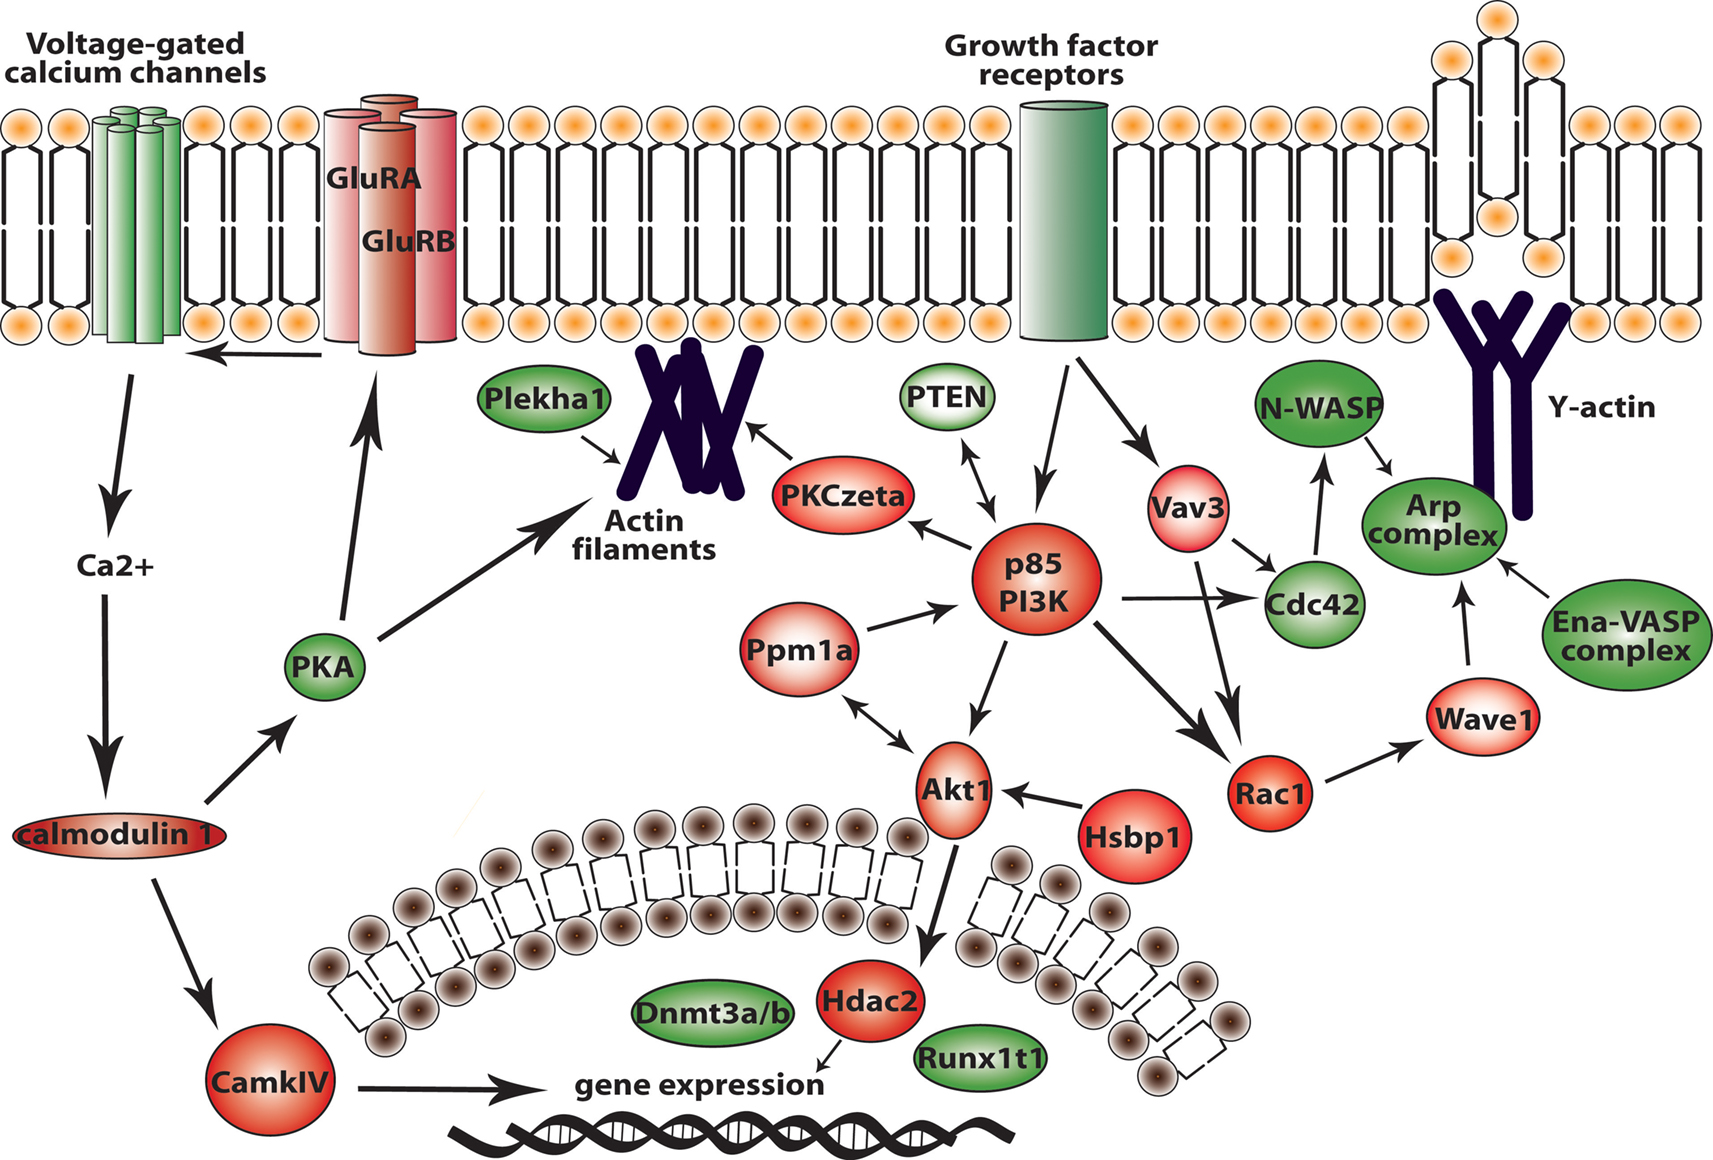
Figure 9. Major signaling pathways in migrating neuroblasts resulting from our study. In red are proteins that we showed in vivo to be important for migrating neuroblasts. In green are proteins that might be involved in neuroblast migration according to our microarray data and bioinformatics analysis.
Another identified upregulated network, the Akt1-DNA transcription network (Figure 9
), couples Akt1 signaling to the complex protein machinery involved in transcriptional regulation and protein folding. Many factors could regulate Akt1 (e.g., see Figures 4
A,B). One of them is Hsbp1 that regulates apoptosis through Akt1 (Rane et al., 2003
). Only a small percentage of neuroblasts after reaching the OB integrate into local circuits. Many migratory cells die by apoptosis, a process counteracted by Hsbp1-Akt1 activity. Akt1 could also have a considerable impact on DNA transcription by activating several DNA and histone-modifying proteins that we found to be upregulated in migrating cells, including histone deacetylase 2 (Hdac2) and DNA methyltransferase 3a and 3b (Dnmt3a and 3b, respectively). Consistent with the bioinformatics data, Hdac2 expression silencing in vivo had a remarkable effect on neuroblast migration (Figures 6
C–F, 7
C,D). Thus, the Akt1-DNA transcription network is likely to play a functional role in these developing/immature cells whose pattern of transcribed genes undergoes fast modifications.
The GF signaling network (Figure 5
A) activates several intracellular cascades and the actin machinery. There are core proteins of this network – PI3K, Akt1, Rac1 and PKCζ – that are important effectors for neuroblast migration as demonstrated by our in vitro and in vivo analysis. The GF signaling network that was functionally investigated here is further linked to other signaling cascades (e.g., p38/MAPK and Jnk) via the small GTPases, Cdc42 and Rac, as indicated by the bioinformatics analysis. Furthermore, we extended this study to two auxiliary proteins in the GF signaling network (Figure 9
), Ppm1a and Vav3, and provided in vivo evidence that they affect RMS neuroblast migration. Vav3 is a GEF and catalyzes the exchange of GDP to GTP in a GTPase complex, thereby activating GTPases (Rossman et al., 2005
). Activation of Rac1 by Vav3 promotes microvascular endothelial cell migration and Vav2−/− Vav3−/− mice show significant decrease in the formation of filopodia and lamellipodia (Hunter et al., 2006
). In our study we found that knockdown of Vav3 altered growth cone formation of migrating RMS neuroblasts (Figures 8
E–G). Thus, Vav3 and Ppm1a, as well as other auxiliary proteins (see Figure 5
A) have an important role in neuroblast migration most likely by fine-tuning the modulation of the core protein activity (PI3K, Akt1, Rac1 and PKCζ) in the GF signaling network.
Finally we investigated the involvement of MAPK signaling network (Figure 5
B) in neuroblast migration. The crucial role of the MAPK cascade for migration of different cell types including neurons (Sarkisian et al., 2006
) has been demonstrated (reviewed in Huang et al., 2004
). We provided in vivo evidence for an involvement of the upper part of the network in neuroblast migration (Vav3, PI3K and Rac1). However, silencing of the downstream genes Map3k13, Map2k4 and Atf2 did not affect neuroblast migration. This clearly indicates the necessity for functionally testing individual genes and networks resulting from bioinformatics analysis.
Of further interest are the results regarding the strong upregulation of some genes that were not further functionally tested. Thus, the most upregulated gene (more than 50-fold) was protocadherin (Pcdh7), which codes for a cell adhesion protein. Protocadherins are a family of cell adhesion proteins that play an important role in establishing neural connectivity (Morishita and Yagi, 2007
). For example, protocadherin FAT1 was shown to be necessary for actin binding of Ena/VASP, an actin polymerization regulating protein (Moeller et al., 2004
). It is possible that Pcdh7 plays a role in actin remodeling and thus affects RMS neuroblast migration.
An impressive upregulation was also noted for Cadps2 (Ca2+-dependent activator protein 2), a secretory vesicle-associated protein involved in the release of neurotrophins (Sadakata et al., 2004
) that play a key role in many processes of brain development, including neuronal migration (Woo and Lu, 2006
).
Neuronal migration is a very important process for brain development and in some brain areas still plays a functional role in plasticity even during adulthood. Many signals initiate in the surrounding microenvironment and direct the migration of the right neurons to the right place. The signals are integrated by many intracellular pathways in a large migratory network. Although these pathways have different constituents they operate together and disturbance of any of them could dramatically change the outcome of migration. We performed an in vivo analysis to identify candidate genes constituting functional networks underlying migration. For many poorly studied proteins we ascertained new functions and assigned a place in a network. We discussed how certain pathways could be meaningfully linked into more complex networks, how certain players act in several pathways that all are parts of the migratory cell transcriptome. Comparison with data obtained from cancer cells may help identify differentially expressed genes/pathways in migrating malignant cells and normal cells. However, any bioinformatics data have to be tested functionally because a defined network may serve different functions in the same cell type and distinct cellular processes (for instance, migration in this study) must be analyzed in the context of the whole organism. Publicly available data obtained in the study can be used for further comprehensive functional analysis of yet other pathways and their integration into a global migrational network.
The authors declare that the research was conducted in the absence of any commercial or financial relationships that could be construed as a potential conflict of interest.
We thank Prof. H.-J. Grone and Dr M. Kenzelmann as well as Prof. R. Bartenschlager for letting us use the Bioanalyzer and the TaqMan ABI Prism 7000 Sequence detection system respectively; Evrogen (Moscow, Russia) and Dr Yair Pilpel for the generous gift of PTurboFP602-C and EGFP-N-Wave1, respectively. We thank U. Amtmann, R. Hinz-Hernkommer, I. Preugschat-Gumbrecht and P. Pratley for technical assistance. This work was supported in part by the Schilling Foundation, the SFB484 and BMBF grants 01GS0117 and 01GS0498.
The Supplementary Material for this article can be found online at http://www.frontiersin.org/molecularneuroscience/paper/10.3389/neuro.02/007.2009/