Department of Neurobiology and Anatomy, Drexel University College of Medicine, Philadelphia, PA, USA
A significant objective of neuroinformatics is the construction of tools to readily access, search, and analyze anatomical imagery. This goal can be subdivided into development of the necessary databases and of the computer vision tools for image analysis. When considering mesoscale images, the latter tools can be further divided into registration algorithms and anatomical models. The models are atlases that contain both bitmap images and templates of anatomical boundaries. We report here on construction of such a model for the C57BL/6J mouse. The intended purpose of this atlas is to aid in automated delineation of the Mouse Brain Library, a database of brain histological images of importance to neurogenetic research.
Neuroanatomical atlases have long been of pedagogical and research value. For the mouse, the familiar paper format (Hof et al., 2000
; Paxinos and Franklin, 2001
; Shambra et al., 1992
; Valverde, 1998
) has, in recent years, been supplemented by digital ones (Baldock et al., 2003
; Lee et al., 2005
; Lein et al., 2007
; Ma et al., 2005
; MacKenzie-Graham et al., 2004
). The commonly recognized advantages of the latter include 3D visualization, rapid searchability, and ease of dissemination. There is another benefit: namely, computer readability.
While in the past atlases were designed exclusively for human viewing, this is often no longer the case. Atlases now also serve to automate delineation and provide a framework for spatial brain normalization of experimental material. In the case of spatial normalization the latter is mapped into a standardized atlas coordinate space where multimodal or multisubject data can be compared (Boline et al., 2007
; Hjornevik et al., 2007
; Lein et al., 2007
; Martone et al., 2003
). Alternatively, the atlas can be warped along with its neuroanatomical templates to automatically parcel experimental data (Bug et al., 2007a
; Rosen et al., 2003
). The same image registration algorithms can be employed to achieve either of these goals. There are numerous alignment approaches available many of which are even conveniently implemented in the freely available Insight Toolkit (www.itk.org) and while still imperfect, their performance has greatly improved over the past two decades of intensive research effort in biomedical image registration. The role in registration does not necessarily supplant the use of the very same atlases in data visualization. Indeed, following automated processing they are often the critical nexus for human retrieval and visualization of the collated neuroinformatic data and in their digital form they enable new ways to display their content for visual inspection (Gustafson et al., 2004
, 2007
; Hjornevik et al., 2007
; Palombi et al., 2006
).
There are numerous requirements for modern atlases imposed by these applications. Foremost, the atlases need to be 3D. While much of the imagery collected from animal studies is of sectional material, 3D atlases are none-the-less required for accurate intersubject registration due to the need to resort to 3D nonlinear transformation (Gefen et al., 2008
). Their spatial resolution should equal or exceed the accuracy of the registration sought in the intended application. They should include both bitmapped images of the tissue as well as delineation templates. The former is used in intensity-based registration procedure, of which there are numerous algorithms (Toga, 1999
), while the latter is used to annotate experimental material and to enable anatomy-based search through the aligned datasets (Rosen et al., 2003
). Of course, both delineations templates and images of the tissue are useful in visualization. Ideally, to optimize registration performance, the same stain used on the experimental material that will be aligned to the atlas would be used on the atlas sections during atlas construction. That stain should also differentiate the anatomical boundaries to be segmented in creating the delineation templates, else generation of these will require a secondary volume and transfer to the primary one will be only as accurate as the intermodal registration between the two atlas datasets.
We report here on the construction of the Neuroterrain 3D Mouse Brain Atlas (NMBA). Its main intended use is in conjunction with the Mouse Brain Library (MBL; Rosen et al., 2003) and it is this use that guided design of the atlas. MBL is a research resource developed by the Informatics Center for Mouse Neurogenetics. It consists of Nissl-stained sectional imagery from a large number of mouse brains. The brains are from inbred recombinant lines and the library is specifically developed for use in quantitative trait loci analysis, a powerful genetic approach for identification of genetic loci influencing complex traits (Lander and Schork, 1994
). The MBL is being used to map neuroanatomical traits (Beatty and Laughlin, 2006
; Seecharan et al., 2003
; Williams et al., 2001
) and the library content is suitable for detailed quantitative neuroanatomical studies. NMBA is needed to automatically segment the MBL and to visualize the results (Bug et al., 2007a
). The reconstruction approach undertaken here has enabled development of a high-resolution, 17.9 μm isotropic, 3D Nissl-stained atlas.
Tissue Preparation
One adult male C57BL/6J mouse, weighting 24 g was anesthetized with an overdose of sodium pentobarbital (500 mg/kg) resulting in death within 10 min. The carcass was then decapitated, and the brain removed using our previously published skullcap technique (Dougherty et al., 1998
). Briefly, all but a dorsal cap of the skull was removed with care taken to keep the pituitary gland and the flocculus intact. The brain was frozen resting on a platform with the residual bone downward. It was slowly lowered (1 mm/15 s) into (−70°C) isopentane. This approach minimizes tissue distortion (Dougherty et al., 1998
). It was left in the freezing liquid for 10 min, wiped dry, wrapped in an aluminum foil, and placed into a −80°C freezer until cryosectioning. Animal procedures were in accordance with National Institutes of Health guidelines and the Drexel University Animal Care and Use Committee.
Blockface Imaging, Cryosectioning and Section Collection
The brain was fixed to a cryostat chuck by slowly embedding it in a 10% mixture of M-1 embedding medium (Shandon-Lipshaw, Pittsburgh, PA, USA) and India ink. The brain was cut horizontally on a cold (−16 to −18°C) Leica Cryopolycut (CM3500) equipped with a blockface imaging system. The blockface images were taken with a Circon MV190-504HRG camera outfitted with a Computar 16 mm lens (F/1.4) and a 5-mm extension tube attached to the knife housing, at an in-plane pixel pitch of 35 μm/pixel. An image was taken prior to cutting every section. The imaging system employed introduces slight geometric barrel distortion and it was corrected using a cubic polynomial function with bilinear interpolation.
On the Cryopolycut the tissue moves horizontally while the knife descends prior to each stroke. By mounting the imaging system on the knife, focus on the tissue is maintained throughout the entire cutting session. To obtain repositioning accuracy, the drive on the microtome was modified and includes an active stop. When this mode is engaged, thrust from the motor is reduced and the tissue conveying treadmill assembly is pushed against a metal stop plate. This assures consistent stroke-to-stroke repositioning of the tissue under the camera (Nissanov et al., 2006
).
Thick sections of 17.9 μm were collected dorso-ventrally through the entire mouse brain using Tape-Windows (Instrumedics, St Louise, MO, USA). With this tape system, an adhesive tape is placed on the tissue block prior to each cutting stroke to support the section during the cutting process. The section with tape backing is then transferred to a 4× polymer-coated slide (tissue side down), UV irradiated to bind the tissue to the slide, placed on dry ice for few minutes, and finally the tape is removed. This tape-based collection protocol greatly reduces tissue distortion (Nissanov et al., 2001
). To accurately assess section thickness, the microtome advance mechanism was calibrated as previously described (Lo, 1996
). Briefly, Nalgene PVC-180, a material of similar hardness to frozen brain, was cut and its thickness measured with Dektak IIA contact profilometer. All the tissue sections (total of 314) were dried overnight and then the tissue sections were stained. For staining, they were hydrated, stained with 0.5% cresyl violet acetate 5 min, dehydrated and coverslipped with Permount.
Section Digitization
The sections were imaged with a Nikon LS3510 slide scanner at a resolution of 8 μm/pixel. Our previously published algorithm (Nissanov and McEachron, 1991
) was utilized to correct for spatial nonuniformity of illumination.
Section-to-section staining variation leads to distracting streaks in reconstructed volumes. To avoid these a gray value normalization was performed: mean optical density of each section was assessed, a 5th order polynomial was fit through the data, and each image adjusted to force its mean to the fit by a multiplicative correction factor. Images were then downsampled to 8-bit and a LUT simulating cresyl violet color generated.
3D Reconstruction
A two-step reconstruction approach was employed (Ardekani, 2000
). Each section was first aligned to its respective blockface image. For this step, the tissue outer contour on both sectional image and blockface were delineated – the India ink used in embedding the brain (Section Blockface imaging, cryosectioning and section collection) simplified the task of delineating the outer contour of the blockface image. Next the sectional image was aligned to the blockface image (after upscaling the blockface to the same magnification as the sectional mask) using principal moments (Nissanov and McEachron, 1991
). The translation and rotational parameters were used to define the starting position for the second step: section-to-section alignment using Automated Image Registration (AIR) software (Woods et al., 1998a
,b
). AIR is an intensity-based alignment approach, and the input to it was the sectional gray value images following convolution with an 11 × 11 median filter. AIR settings were set to 2D rigid-body registration. Satisfactory results required multiple runs. The initial registration yielded blocks of well aligned sequential sections interrupted by six abrupt misalignment steps. To correct for those, the initial position of the section following the misalignment was altered and the data rerun. Once visually inspection determined that acceptable registration was attained, the resulting registration parameters from both steps were applied to the original images. A small number, 3, of the 314 histological sections were lost during collection and were replaced by the adjacent section. Thirty additional sections had minor damage. A replacement for the damaged portion was cloned from an adjacent section.
Delineation
Anatomical structures were manually delineated on individual horizontal views at the original 8 μm resolution. Initially, this was done using the BRAIN software (Nissanov and McEachron, 1991
). Subsequently, Amira (Mercury Computer System, Inc) was used. Nomenclature and identification of fine structures were based on the atlas by Franklin and Paxinos (1997)
. For coarse grouping of regions, the nomenclature of NeuroNames (Bowden and Dubach, 2003
) as modified by BIRNLex (http://xwiki.nbirn.net/xwiki/bin/view/BIRN%2DOTF/About+BIRNLex) was adopted. This nomenclature choice will ease ongoing efforts to achieve interoperability between atlases being integrated within the Bioinformatics Research Network (BIRN).
NMBA is freely available. We have previously reported on our developed software for viewing 3D datasets that is based on a client–server architecture (Gustafson et al., 2007
). The client is available for downloading (see “Available Technologies” at www.neuroterrain.org/) and it enables access to the atlas residing on our server. The current version is limited to MacOS with clients for Windows and Linux to be released soon.
Section collection using tape support systems minimizes tissue distortion (Nissanov et al., 2001
) to an extent that registration of successive sections can be constrained to rigid-body alignment. The approach employed here, an initial coarse alignment to the corresponding blockface followed by supervised AIR, has been previously reported to yield misregistration error of 25 μm (1.4 pixels; Ardekani, 2000
). To evaluate it directly on the atlas brain, planar distance between the same punctate features on adjacent sections was determined. Ten equidistant horizontal planes were selected and four features (typically vessels) were located on each. The mean displacement was calculated for each section pair and the mean distance for all 10 section pairs was found to be 1.4 pixels, or 25.1 μm (standard deviation = 1.2 pixels, or 21.5 μm). The quality of the reconstruction can be qualitatively appreciated from resampled views orthogonal to the original cutting plane (Figure 1
). In addition to spatial accuracy, no obvious stain intensity variation is visible – a product of the gray value normalization routine employed.
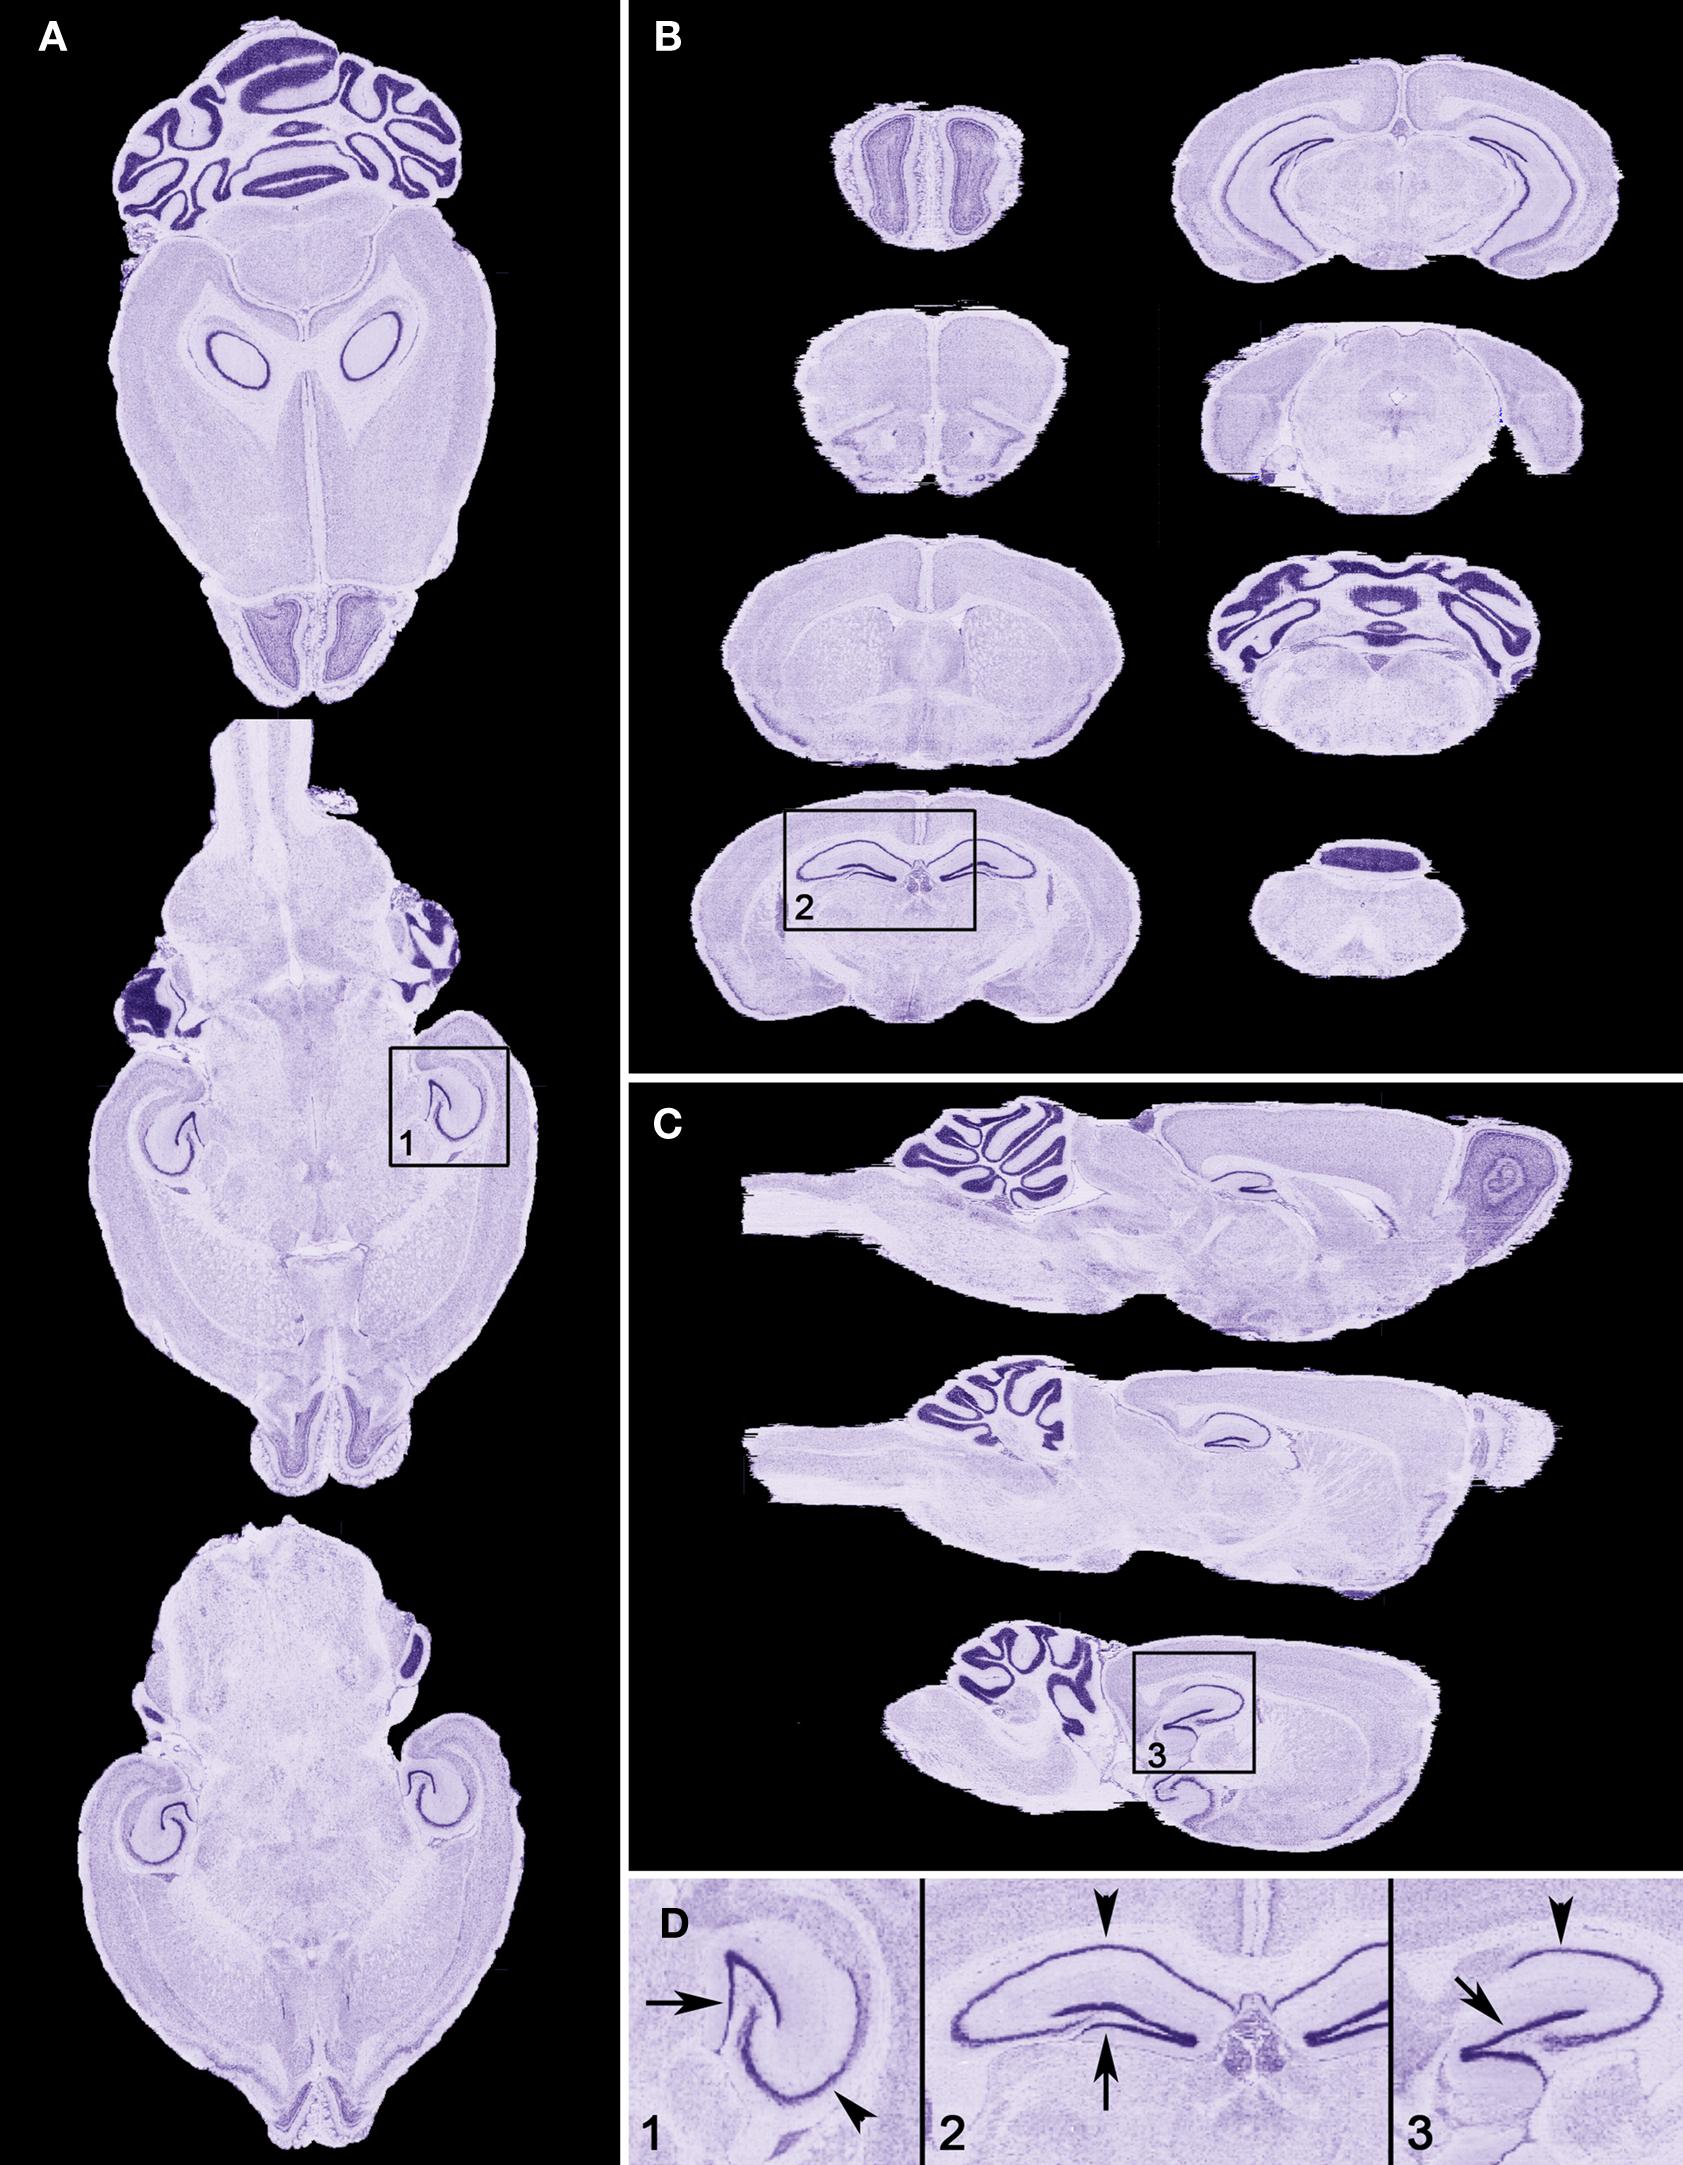
Figure 1. Sectional views through the NMBA. The initial cutting plane during generation of the sectional material was horizontal (A). The accuracy of the reconstruction can be appreciated from orthogonal resamples of the 3D volume along the coronal (B) and sagittal (C) planes and in the higher magnification views in (D) taken from (A–C). The smoothness of features such as the cell rich granular layer of the dentate gyrus (arrow in D) and of the pyramidal layer of the hippocampus (arrowhead in D) in all planes of view is indicative of effective registration. Note that application of gray value normalization has resulted in uniform staining intensity in all planes.
Atlases are composed of imagery of the histology combined with delineation templates. To generate the latter from registered sectional views, we delineated consecutive sections for each volume of interest (VOI). We have utilized a modification of NeuroNames hierarchical schema (Bowden and Dubach, 2003
) as adapted by BIRNLex (http://xwiki.nbirn.net/xwiki/bin/view/BIRN%2DOTF/About+BIRNLex), to guide systematic delineation of the atlas. Levels 1–3 have been completed as illustrated in Figure 2
. Additionally, a large number of VOIs at finer levels have been segmented. Those include complete delineations of the hippocampus (Figure 3
A) and olfactory bulb (Figure 3
B) as well as the anterior commissure, striatum, ventricular system. The thalamus, epithalamus, ventral thalamus, and hypothalamus are also delineated as a whole without further subdivision.
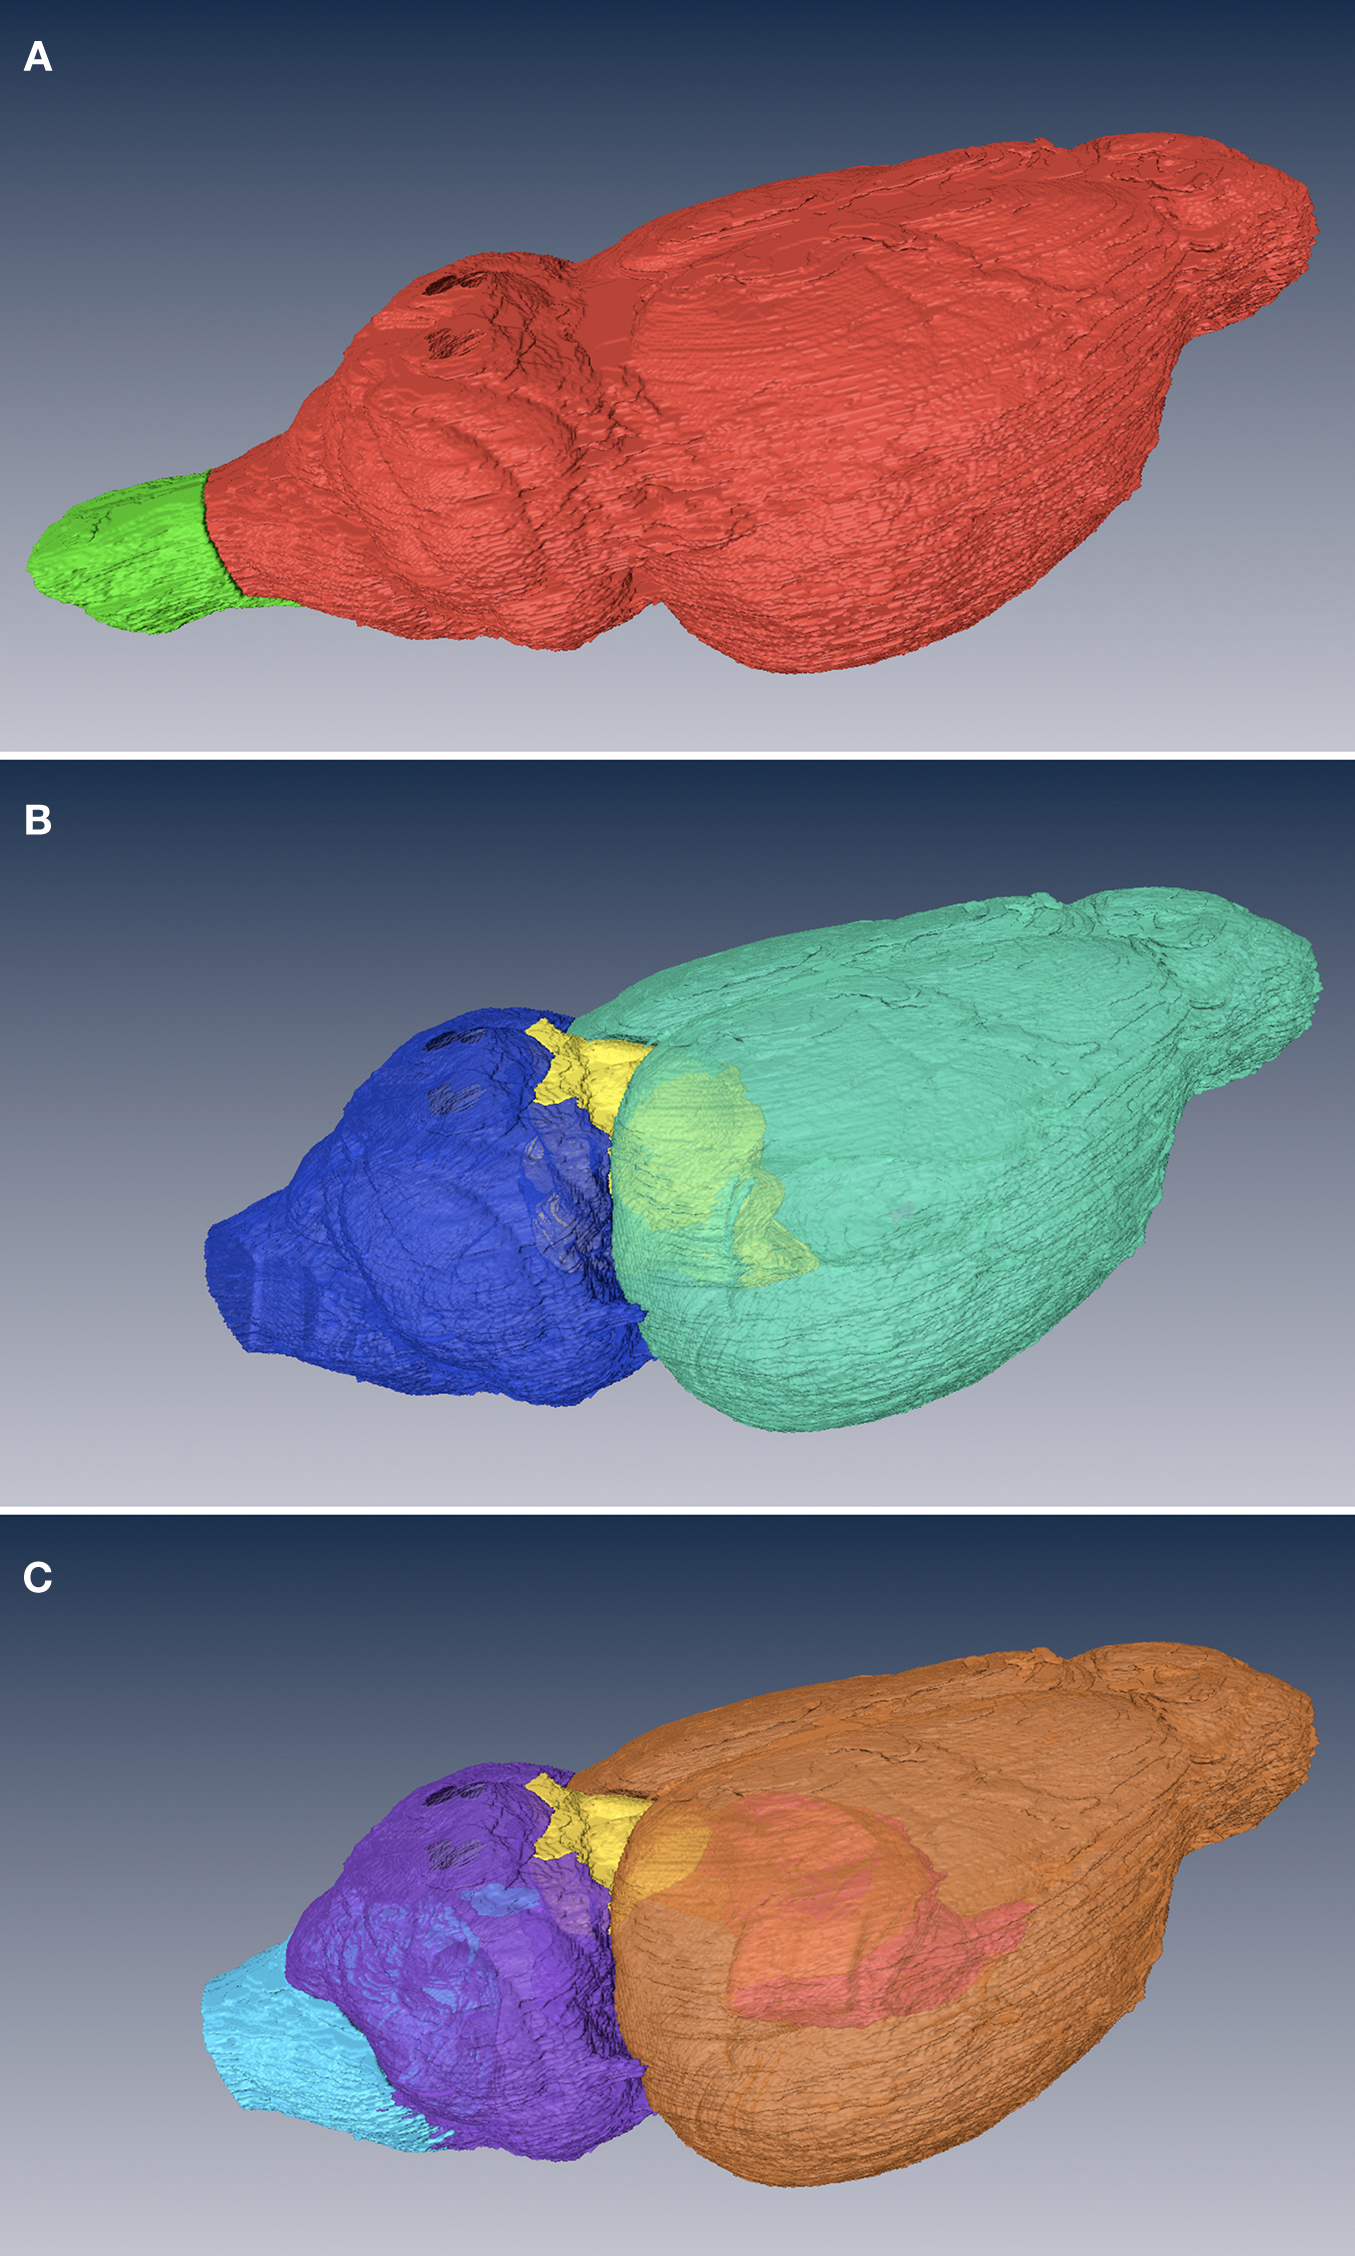
Figure 2. Surface views of NeuroNames level 1–3. Level 1 (A), the coarsest level, subdivides the CNS into brain (red) and spinal cord (green). The brain is further divided in level 2 (B) into forebrain (green), midbrain (yellow), and hindbrain (blue). In level 3 (C), the divisions are telencephalon (orange), diencephalon (pink), tectum (yellow), metencephalon (purple), and medulla oblongata (light blue).
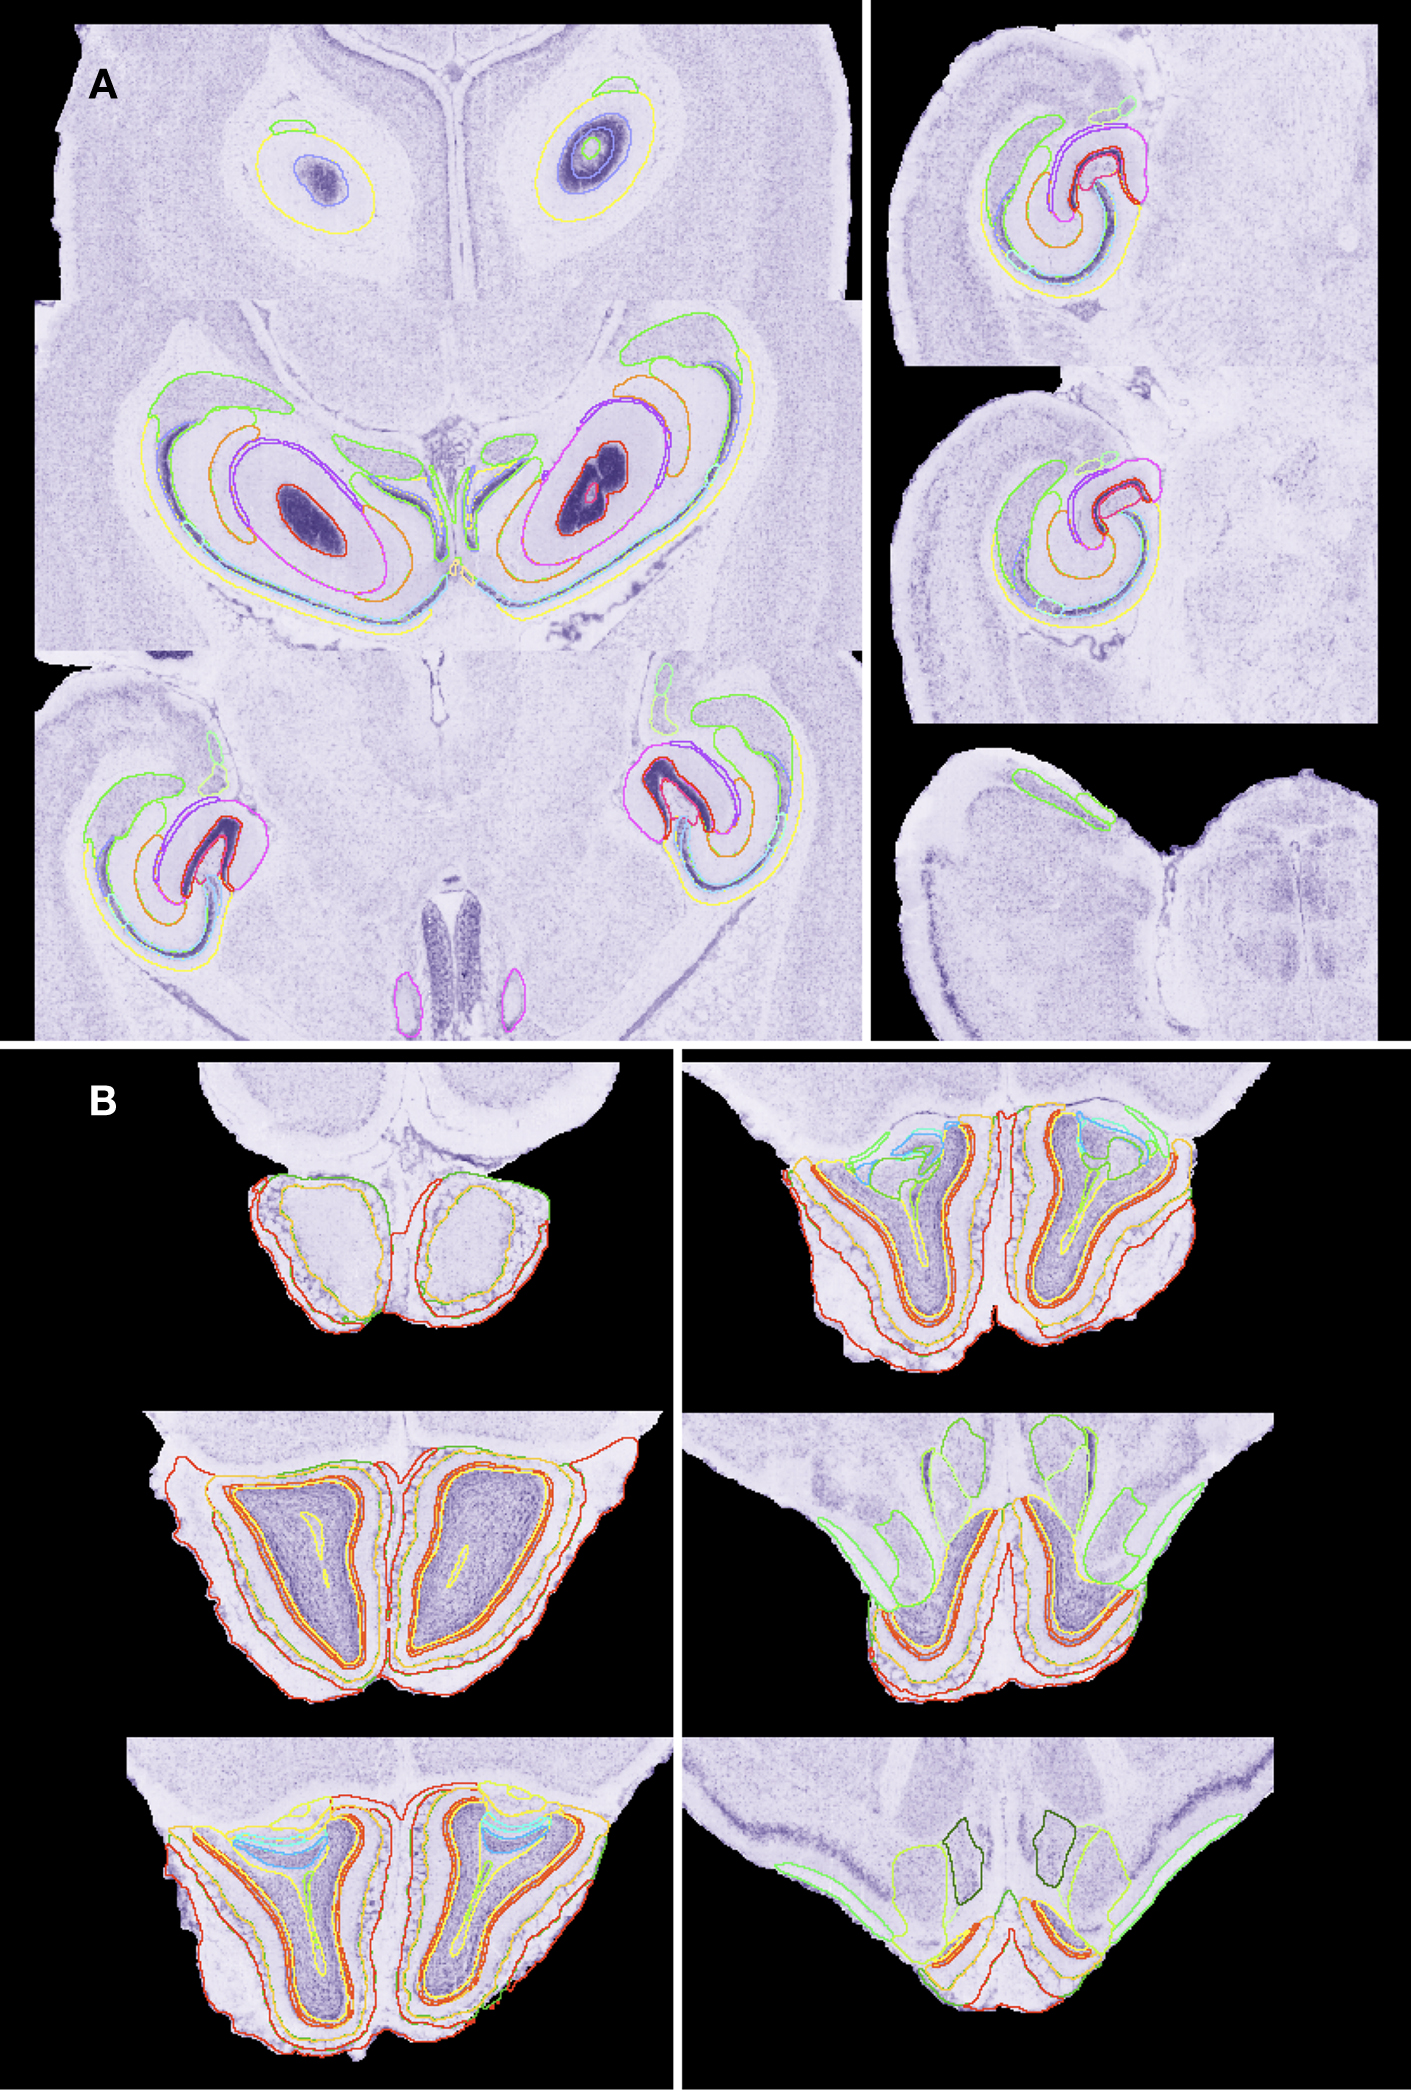
Figure 3. Fine structure delineations. Shown are selected horizontal atlas levels with full delineation of the hippocampus (A) and olfactory bulb (B). Outline colors in (A): CA1 to CA3 represented in different values of blue; dentate gyrus (DG) – pink; fasciola cinereum-gold; granule layer of DG-red; hippocampal fissure-purple; molecular layer of DG-orange; oriens layer of the hippocampus-yellow; parasubiculum-green; polymorph layer of DG-pink-purple; presubiculum-light green; pyramidal cell layer of the hippocampus-dark baby blue; striatum radiatum of the hippocampus-light forest green; subiculum-green. Outline colors in (B): Accessory olfactory bulb (OB) and anterior olfactory nucleus-light green value; Dorsal lateral olfactory tract-turquoise; ependyma and subependymal layer of ventricle of OB-light lime green; external plexiform layer of OB and accessory olfactory bulb (AOB)-yellow-gold; glomerular layer of OB-dark green and of AOB-yellow-green; granule layer of AOB-blue; granule cell layer of OB-yellow; internal plexiform layer of OB-orange; lateral olfactory tract-green; mitral cell layer of OB-red; mitral cell layer of the AOB-light turquoise; olfactory nerve layer-red.
In the past number of years, the term atlas has become somewhat ambiguous. Rather than the traditional definition of a reference work to guide interpretation of experimental results, at times it is used to refer to a larger body of registered data sets. This is well exemplified by the Allen Brain Atlas, a massive effort to map the expression pattern of all mouse genes generated a large collated set of maps that are, in conjunction with the Allen Reference Atlas, collectively called an atlas (Lein et al., 2007
). A more restricted definition is that used for probabilistic atlases generated from multiple individuals (Lee et al., 2005
; MacKenzie-Graham et al., 2007
). In the case of NMBA, we use the term in an even more circumscribed manner and in line with the definition of the Allen Reference Atlas and confine the term to the data and delineations generated from a single specimen. This divergence of terminology simply reflects differences in intended use.
NMBA is designed foremost to function within MBL. We rely on atlas-based segmentation to annotate MBL. In this approach NMBA is aligned to each of the library’s brains and in doing so the anatomical outlines are warped to fit each of them (Bug et al., 2007a
). We have developed two alignment strategies used for this automated segmentation (Gefen et al., 2003
, 2004
, 2008
). Our most current one locates a curved surface within the NMBA matching each section of an MBL brain (Gefen et al., 2006
, 2008
). Intersected VOIs are mapped back to the MBL section. The approach relies on comparison of intensity information between the MBL data and the NMBA. Defining accurate transformation between brains in the invariable presence of interanimal variability and distortion introduced during tissue processing requires seeking 3D nonlinear mapping parameters. The isotropic 3D nature of NMBA is critical for this task.
While registration techniques for data with different contrast exists (Toga, 1999
) and indeed our approach can function in such multimodal settings, matching the contrast between the experimental data and reference atlas improves alignment. MBL was constructed to support differentiation of classical neuroanatomical structure and of cellular elements and to do so the brains were Nissl-stained using cresyl violet. We therefore also elected to stain the atlas with the same stain.
The isotropic resolution achieved with NMBA, 17.9 μm, was defined by technical limitations. While it is considerably higher than routinely attainable accuracy of brain spatial normalization and, in all likelihood, higher than the accuracy possible for intersubject registration using topologically preserving methods, fine 3D resolution is of value in visualization. Higher resolution would, in fact, be welcomed. However, in our hands, we are unable to attain consistent acceptable section quality when cutting finer than 15 μm using tape support. Without tape support, loss of sections, knife-induced nonlinear section-to-section distortion, as well as global shrinkage during section processing greatly complicates reconstruction. With the tape system, global shrinkage during staining is limited at the expense of local fine tears: volume loss during hydration leads to small tears where without the tape it results in shrinkage. These become apparent particularly in cell rich areas at around 10 μm on high quality sections.
Achieving significantly higher resolution, then, would require tackling the nonlinear reconstruction problem. Blockface imaging has been used to guide such reconstruction not only in a linear setting as we have here, but also under the nonlinear framework (Kim et al., 1997
). However, this imaging approach does not yield sufficient contrast, even with systemically applied stains (Nissanov et al., 2006
), to support high-resolution deformation correction. Indeed, because of its limited utility we resorted to refining the blockface-based alignment using AIR. A possible alternative is to substitute high-resolution in situ MRI for the role of the blockface volume. With current resolution of 21 μm (Johnson et al., 2007
), this approach is quite tenable.
To be of utility in MBL segmentation, neuroanatomical templates must be manually delineated. This tedious time consuming task involves delineation of sequential section, ideally, with a 3-D view providing feedback. We have followed a two-track approach in selecting the VOIs to be delineated. For collaborators needing fine delineations we are pursuing an “as needed” segmentation as well as providing means to incorporate their own atlas segmentation. We are also pursuing a systematic approach. Using the BIRNLex modification of the hierarchical NeuroNames nomenclature (Bowden and Dubach, 2003
), we are drilling down from the coarsest to the finest levels.
While design considerations for the NMBA were driven by it use in the context of the MBL, the atlas is available for wider utility. The viewer required to visualize and navigate the atlas is freely available for download (www.neuroterrain.org). Furthermore, BIRN supported efforts will make possible use of NMBA with non-MBL data depositories. To this end, incorporation of NeuroNames into BIRNLex will allow rich structure-based searches of segmented material reliant on the formal representation of the volumetric partonomy (Gupta et al., 2007
) while spatial co-registration of the reference atlases available within BIRN will address direct image-based queries (Boline et al., 2007
; Bug et al., 2007b
).
The interoperability sought within BIRN highlights the further potential of digital atlases. Within the scope of a given research program an atlas serves as the means of collating a large image repository. Initially, this was effectively implemented within the human neuroimaging community (Fox et al., 1994
) and more recently within the mouse research field (Lein et al., 2007
; Venkataraman et al., 2008
). By co-registering atlases and enabling communication between them, another level of functionality will be achieved as queries can be issued against multiple independent data sources and relevant results from across those retrieved.
The authors declare that the research was conducted in the absence of any commercial or financial relationships that could be construed as a potential conflict of interest.
This work was supported by the Human Brain Project through grant P20 MH62009, the Bioinformatics Research Network through grant RR043050-S2, and by the NSF DBI grant 0352421. We thank Mr William Bug for his help in with the BIRNLex nomenclature.
Baldock, R. A., Bard, J. B. L., Burger, A., Burton, N., Christiansen, J., Feng, G., Hill, B., Houghton, D., Kaufman, M., Rao, J., Sharpe, J., Ross, A., Stevenson, P., Venkataraman, S., Waterhouse, A., Yang, Y., and Davidson, D. R. (2003). EMAP and EMAGE: a framework for understanding spatially organized data. Neuroinformatics 1, 309–326.
Boline, J., Bug, W., Zaslavsky, I., Williams, R., Martone, M., Anderson, S., Wong, W., Yuan, H., Memon, A., Ng, Q., Grethe, J., Sforza, D., MacKenzie-Graham, A., Nissanov, J., Gustafson, C., and Toga, A. (2007). Accessing a sharing infrastructure with the Mouse BIRN atlasing toolkit (MBAT). In Proceedings of the Society for Neuroscience 37th Annual Meeting, San Diego, CA, USA.
Bug, W., Wong, W., Gustafson, C., Johnson, G., Martone, M., Price, D., Rosen, G., Williams, R., Zaslavsky, I., and Nissanov, J. (2007b). Integration of brain atlasing tools: NeuroTerrain-Smart Atlas synergistic visualization and analysis environment. In Proceedings of the 3rd International IEEE EMBS Conference on Neural Engineering, Kohala Coast, Hawaii, pp. 280–283.
Gupta, A., Astakhov, V., Boline, J., Bug, B., Fennema-Notestine, C., Grethe, J., Kennedy, D., Martone, M., Rubin, D., Sanders, B., and Turner, J. (2007). Data Federation in the Biomedical Informatics Research Network: Tools for semantic annotation and query of distributed multiscale brain data. In Proceedings of the Society for Neuroscience 37th Annual Meeting, San Diego, 37, p. 100.116.
Lein, E. S., Hawrylycz, M. J., Ao, N., Ayres, M., Bensinger, A., Bernard, A., Boe, A. F., Boguski, M. S., Brockway, K. S., Byrnes, E. J., Chen, L., Chen, T. M., Chin, M. C., Chong, J., Crook, B. E., Czaplinska, A., Dang, C. N. et al. (2007). Genome-wide atlas of gene expression in the adult mouse brain. Nature 445, 168–176.
Rosen, G., Porte, N. L., Diechtiareff, B., Pung, C., Nissanov, J., Gustafson, C., Bertrand, L., Gefen, S., Fan, Y., Tretiak, O., Manly, K. F., Park, M. R., Williams, A. G., Connolly, M. T., Capra, J. A., and Williams, R. W. (2003). Informatics center for mouse genomics: the dissection of complex traits of the nervous system. Neuroinformatics 1, 327–342.