Does innovation in Environmental Technologies Curb CO2 Emissions? Evidence From Advanced Time Series Techniques
 Han Hongqiao
  Mahmood Ahmad
- Business School, Shandong University of Technology, Zibo, China
This study investigates the impact of environmental innovation, de jure trade globalization, renewable energy consumption and financial development on CO2 emissions in the United States (US) under the Environment Kuznets Curve hypothesis (EKC). To do this, yearly data from 1971 to 2018 is employed using the novel Augmented ARDL (AARDL) and Gradual Shift causality for empirical analysis. The empirical outcomes from the AARDL test disclosed cointegration between variables. The long-run empirical estimation revealed that environmental innovation is contributing to CO2 mitigation. Also, environmental innovation helps to develop the EKC between economic growth and CO2. Apart from this, environmental innovation Granger causes economic growth and CO2. Additionally, financial development is positively connected with CO2, while renewable energy alleviates emissions levels. The study also found a negative association between de jure trade globalization and CO2 emissions only in the short run. Based on the empirical results, this study suggests that the US should enhance innovation in environmental technologies and, at the same time, make policies to accelerate de jure trade globalization to achieve climate-related goals.
Introduction
Undoubtedly, developing and developed countries are concerned about the challenging issue of global warming, and the shocks of climate change are felt around the world. However, it is also a recognized fact that some major economies contributed enormously to the increased CO2 emissions levels and global warming, while some developing countries had only a little contribution. Among these major economies, the United States is ranked as the second-largest CO2 emitter, which utilizes 16% of global energy production with only 4.3% of the world population compared to India and China, which accommodate 36% of the world population and consume just about 28% of global energy production (IEA, 2017). The US has also shown its intention to combat climate change through the energy transition, and a significant increase in renewables was also observed in the previous 2 decades; however, with more than 80% share of conventional energy (fossil fuels) in the energy mix, it is still a long way to achieve a green environment (Ahmad et al., 2022b).
The United States generates over 15% of global anthropogenic emissions which is a by-product of the enormous economic progress achieved by the country. The US is among the most developed countries and even in 2019, its total GDP surpassed the GDP of China by 37% (WDI, 2021). In the last 2 decades, the US economy experienced tremendous growth (Khan et al., 2021). In the past literature, scholars used the concept of the EKC (Environmental Kuznets Curve) to understand the growth-emissions nexus which emerged after the revolutionary work of (Grossman and Krueger, 1995, 1991). This hypothesis is based on the notion that environmental deterioration is the consequence of economic growth at the early stages of growth where countries intend to develop more products by ignoring their environmental cost. Thus, at this stage, the scale effect prevails in the economy, and substantial production is achieved by consuming an enormous amount of energy and other resources. This leads to more waste generation and environmental pollution. However, the next stage is generally characterized by the structural change which affects environmental quality. It is believed that during this stage, the composition effect prevails, and nations develop their economic structure from primary (agriculture) to secondary (industry) and lastly, to the service sector with less ecological damage. Likewise, with more income, technique effect tends to emerge, which plays an enormous role in environmental quality by building modern technology and nurturing knowledge and innovation. Hence, environmental degradation and the progress of the economy generally follow an inverted U-shaped (EKC) relationship. The turning point in this relation depends on many factors, such as innovation, technology, environmental preference, and environmental regulations, etc.
In this modern world, technological innovation (TEI) brings numerous environmental and economic changes, such as increasing fossil fuel consumption, developing economies, and improving living standards (Guo et al., 2017; Hashmi and Alam, 2019). Besides, it is widely believed that technological innovation can be used as an effective way to decrease environmental degradation (Ahmad et al., 2022a), but its role in carbon emissions mitigation is inconclusive. Because some previous studies suggested that the impact of TEI on CO2 can be positive (Danish and Ulucak, 2021; Ahmad et al., 2021), while some others find the negative or insignificant effect (Wang et al., 2012; Du et al., 2019). In this context, Ahmad et al. (2020) argue that countries can meet the needs of the increasing population and overcome the scarcity of resources through technological innovation without hurting the environmental quality. However, Su and Moaniba (2017) demonstrated that climate change-related innovation responds negatively to carbon emissions from solid fuel consumption (mainly from coal) and other greenhouse gas emissions and positively to increases in emissions from liquid fuels and natural gas. Wang et al. (2021) suggested that technological innovation significantly enhances green growth in China.
The previous literature uses total patents in all technologies to measure technological innovation and this innovation may not represent technological progress in environment-related technologies. The study of Adebayo et al. (2021) revealed that in the context of Chile, technological innovation boosts emissions. Hence, in recent years, countries around the globe have been searching for eco-friendly capabilities to lessen environmental degradation. Hence, the strategy of enhancing green innovation that is measured by patents in environment-related technologies can be more relevant for environmental sustainability. Dramatically rising emissions in the United States (US) have augmented the demand for environment-related innovations, which can play an essential role in decreasing them. It is essential to probe green innovation and CO2 connection in the US which is the leading country in environmental technologies with a considerable patent count (OECD, 2022) and among the top carbon dioxide emitting countries (IEA, 2020).
The US is actively striving to initiate several strategies related to trade globalization under the environmental protection law to protest the environmental quality. In this context, the US has imposed trade restrictions, new taxes, and customs tariffs on polluted goods to curb environmental degradation. Moreover, to achieve the carbon naturality target, the country has cut tariffs on environmental goods such as solar water heaters, water treatment plants, wind turbines, etc. According to the estimates, the US exported $238 billion of environmentally friendly goods in 2015, and it has been growing at the rate of 6 percent since 2012.1 De jure trade globalization covers trade components like tariffs, trade agreements, trade taxes, etc., which are important for conducting sustainable trade, but previous environmental literature has not focused on the impact of de jure trade globalization on environmental quality.
Based on the aforementioned argument, the following are the main contributions of this study. First, as opposed to the previous studies which probe the impact of technological innovation on environmental quality, this study specifically investigates green innovation (environmental-related patents) and environmental quality nexus in the context of the US. Second, as per the authors’ knowledge, this is the first study that examines the impact of de jure trade globalization on environmental quality. Third, the study uses recent methodologies, such as the Augmented ARDL technique which solves drawbacks of the ARDL models and determines cointegration based on three tests instead of using just the F-statistics. Also, this method not only eliminates the possible endogeneity issues that may arise in the ARDL method but also solves issues like serial correlation. This technique performs well even in the case of a mixed integration level of variables. Apart from this, the study adopted the Gradual Shift causality method that can be utilized during mixed integration levels of variables. This method performs well by accounting for smooth and gradual shifts during casual analysis. Thus, the study provides important insights into the relationship between green innovation, de jure trade globalization, and environmental degradation using recent econometric techniques.
Literature Review
As the economies around the world are undergoing the Fourth Industrial Revolution, innovation is often seen as the most effective means of accomplishing the SDGs (Ahmad et al., 2021). In this context, some research works disclosed that technological innovation (TEI) could be a crucial tool to promote environmental sustainability, while few studies established that TEI either increases environmental degradation or does not influence it. Interestingly, scholars mostly used total patents to measure technological innovation, and very limited environmental studies used green innovation (eco or environmental innovation) which is measured by environment-related patents. Previous studies on technological and green innovation are discussed below.
Henriques and Borowiecki (2017) used an extended Kaya decomposition model to study the influence of TEI on carbon emission in Japan, North America, and Europe. They concluded that TEI is the main offsetting aspect in emission reduction. Besides, Yii and Geetha (2017)found that TEI in Malaysia significantly mitigates CO2 in the short run, but it has an insignificant impact in the long run. Lin and Zhu (2019) investigated the linkage between green technologies and carbon emissions in China. Their results highlighted that renewable energy technologies have a significant and negative effect on emissions.
Wang et al. (2021) illustrated that TEI encourages environmental sustainability by lowering CO2 in G7 countries. In the context of emerging countries, Ahmad et al. (2020) evaluated the dynamic linkage between TEI and ecological footprint (EF). Their results unveiled that technological innovation helps to mitigate EF.
On the contrary, Chen and Lee (2020) failed to provide a significant effect of technological innovation on carbon emission globally. However, Sinha et al. (2020) suggested that TEI can speed up the advancement towards sustainable development goals (SDGs). Similarly, Guo et al. (2021) unveiled the negative relationship between technological innovation and CO2 emissions in China. Conversely, Adebayo et al. (2021)provided that TEI is among the major causes of increasing emissions in the context of Chile. They argued that Chile’s technological innovation does not concentrate on environment-related innovation.
Limited studies examined the possible green (eco) innovation and CO2 connections. For example, Ding et al. (2021) assessed the influence of green innovation on consumption-based CO2 in G-7. They concluded that green innovation significantly alleviates emissions. Likewise, Hashmi and Alam (2019)demonstrated that environmentally-friendly patents, as well as environmental taxes, lessen CO2 in OCED countries.
Besides, trade globalization is an important factor that covers de facto trade including trade volume as well as de jure trade including trade agreements, trade taxes, tariffs, etc. Ahmed and Le (2020) scrutinized the influence of trade globalization on CO2 in ASEAN countries. The panel methodology indicated the negative relationship between trade globalization and carbon emissions. Besides, trade globalization is mostly ignored in the previous literature. However, Pata and Caglar (2021) probed the connection between trade openness, globalization, economic growth, and CO2 for China. The test results suggested that trade openness, globalization, and economic growth drive environmental pollution. Similarly, Dou et al. (2021) assessed the trade openness and CO2 connection in the China-Japan-ROK FTA countries. Their results unveiled that trade openness significantly promotes CO2 emissions in these countries. In addition, exports can inhibit domestic CO2 emissions, while imports induce more national CO2 emissions. Trade globalization covers de facto and de jure components and there are studies available either on total trade globalization or on trade volume.
Summing up, we can say that TEI’s influence on environmental quality varies. It should also be noted that previous studies mostly used overall patent application as a measure of technological innovation. There is a paucity of research work on the relationship between green innovation and environmental quality. On the other hand, few studies assessed the impact of trade globalization on CO2, but the effect of de jure parts of trade globalization on CO2 is yet to be apprehended. Moreover, the authors are unaware of any empirical investigation that probed the impact of green innovation, de jure trade globalization, and CO2 emissions. Hence, this study addressed this gap in the literature and study green innovation, de jure trade globalization, and CO2 emissions nexus in the US. It is expected that green innovation and de jure trade globalization can affect environmental sustainability; thus, the results of this research might help the US to achieve the carbon neutrality targets.
Materials and Methods
Data and Model Construction
The study developed the following models to scrutinize the long-run elasticities for the period 1971 to 2018.
Where, CO2, Y, Y2, and GI denote CO2 emissions (tonnes per capita), economic growth (GDP constant 2010 $ per capita), the square of GDP, and green innovation (patents on environment-related technologies as a percentage of the total patents on all technologies), respectively. REW, FD, and TGD depict renewable energy (per capital kilowatt-hour), financial development, and de jure trade globalization (KOF index between 0 and 100), respectively. Following previous empirical works (Shahbaz et al., 2016; Ahmed et al., 2021a, 2021b; Pata and Caglar, 2021), the variables’ logarithm form is used.
The study’s duration from 1971 to 2018 is tied with the data availability of selected variables. The data on Y (economic growth) and FD (financial development) are sourced fromWDI (2020). Time series data on CO2 emissions and REW (renewable energy) are amassed from IEA (2020) and OWD (2021), respectively. The data series on green innovation is collected from OECD (2022), while the KOF index is accessed to collect data on de jure trade globalization (Dreher et al., 2008; Gygli et al., 2019).
Methodology
To analyze the association among green innovation (GI), de jure trade globalization (TGD), renewable energy (REW), economic growth (Y), and financial development (FD), this study utilized the Augmented ARDL methodology developed by the recent study of (Sam et al., 2019). Before using the AARDL, it is essential to inspect the integration level of the variables selected for the study by using the unit root tests. Consistent with the previous literature (Sam et al., 2019; Pata and Caglar, 2021), this study not only applied the Augmented Dicky-Fuller (ADF) and Phillip-Perron (PP) tests but also the structural break unit root tests of Phillip Perron to make sure that variables are stationary at 1 (0) and/or 1 (1) and the results are not biased due to the presence of structural breaks. Figure 1 visually shows the estimation strategy.
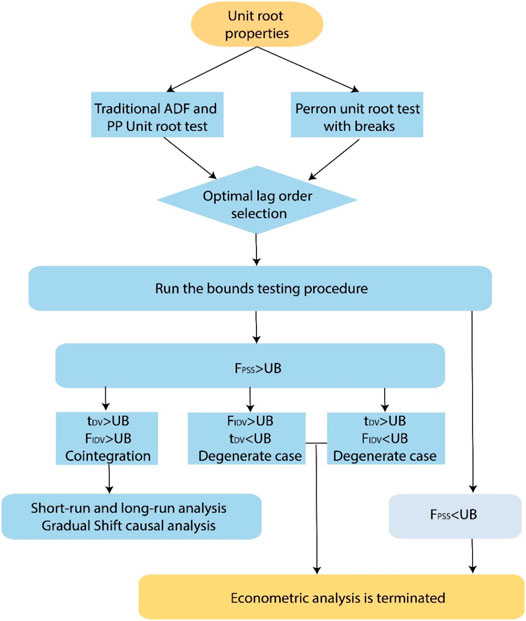
FIGURE 1. Estimation strategy.
The recent research of McNown et al. (2018) criticized the ARDL technique of Pesaran et al. (2001) and disclosed that F-statistics generated by the ARDL is insufficient to decide the cointegration and the cointegration should be decided using three tests rather than using just one F-statistics. The research of Cai et al. (2018) also supported this view and unfolded that the ARDL bound test does not provide reliable findings. The study of Sam et al. (2019) presented a new test on the lagged level of independent variables and removed the limitations of the ARDL by accounting for all degenerate cases. Eqs 1 and 2 can be expressed in the ARDL framework as follows.
For the model presented in Eq. 3, the long-run part of the equation is depicted from (
In order to reject the above hypothesis, the generated F-statistics must be more than the upper critical bound values (Pesaran et al., 2001). However, this hypothesis denotes the combined significance of all coefficients in the long-run part of Eq. 3; hence, this significance can be caused by the significance of the regressors or the dependent variable. Accordingly, the studies of McNown et al. (2018) and Sam et al. (2019) proposed the F-test for the independent variables (lagged level) and the t-test for the dependent variable (lagged level) to tackle these shortcomings. The following are the hypothesis for these two tests.
To reject the hypothesis presented in Eq. 5, the critical values of (Narayan, 2005) are compared with the overall F-statistics, while for the next two hypotheses (Eqs 6 and 7), the critical values of Sam et al. (2019) and Narayan (2005) are utilized. The presence of a long-run equilibrium relationship necessitates the rejection of all three hypotheses (Eqs 5–7). However, the comparison of computed statistics with the critical values can result in some degenerate cases depicting false cointegration. For instance, the t-test for the response variable is insignificant but both F-tests (for explanatory variables and all variables) are statistically significant. Likewise, the F-test for the explanatory variable may be insignificant but the t-test and overall F-test can be significant.
Nevertheless, the use of the Augmented ARDL solves such issues. Moreover, in the ARDL methodology only one endogenous variable can be added to the model; however, the AARDL method also relaxes this assumption and there is no restriction on adding more endogenous variables (Pata and Caglar, 2021). Also, the AARDL method can be applied on small samples and fractionally integrated variables.
Lastly, the study used the Gradual Shift causality test. The study of Toda and Yamamoto (1995) developed a causality technique that can be applied on fractionally integrated variables and its application does not need stationarity testing. The Toda and Yamamoto (TY) test is based on a vector autoregression (VAR) framework and adds maximum integration order of variables (dmax) to the optimal lag length (k) to set the lag length for its estimation. However, this method ignores the structural shift which may cause unreliable results; hence, this study employed the Gradual Shift causality method of (Nazlioglu et al., 2016), which considers the structural shift in the causal analysis and accounts for smooth and gradual shifts. This test is also known as the “Fourier Causality Test” and it is developed by adding cumulative and single frequencies. Thus, the modified version of the WALD statistics combines the TY and Fourier approximation.
Results and Discussion
First, we computed descriptive statistics in Table 1. In Figure 2, the distribution of panel data in various box plots is presented. The percentages for every graph are 25, 50, and 75. The upper and lower lines depict the maximum and minimum. Moreover, the median is represented in circles, and mean values are given in squares. CO2 emissions have a mean value of 18.91219 and the deviation from the mean value is 1.903,692. Green innovation (patents in environment-related technologies as a share of total patents) ranges between 5.3100 and 12.6400 from 1971 to 2018. As shown in Figure 3, most of the increase in green innovation was noticed after the year 2000 as shown in Figure 4 indicating that the US has focused on increasing green innovation over the past 2 decades. Likewise, de jure trade globalization (TGD) measured by the KOF index ranges between 60 and 84. It indicates that TGD has increased for the analyzed period implying that the US has followed the policy of opening up in terms of trade regulations, tariffs, and trade taxes for most of the analyzed period (Figure 2). However, in recent years, TGD has shown a decline. Economic growth per capita (Y) depicts an impressive growth over the selected period.

TABLE 1. Descriptive statistics.
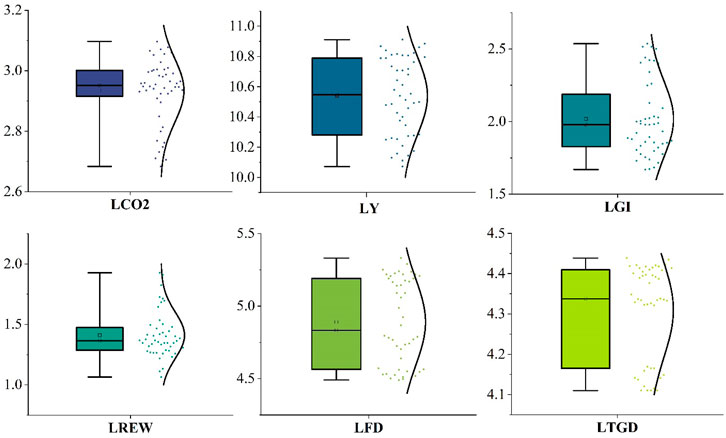
FIGURE 2. Box chart of variables with scatterplot and distribution.
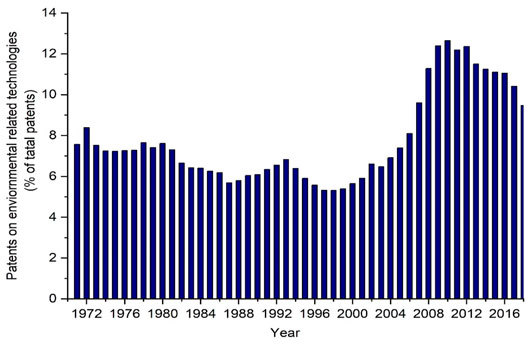
FIGURE 3. Green innovation.
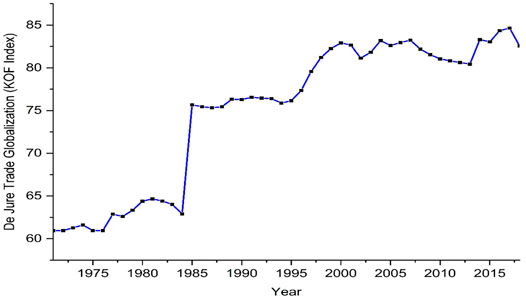
FIGURE 4. Trade Globalization (de jure).
After this, it is imperative to probe the integration level of analyzed variables. The estimates summarized in Table 2 unfold that GI, CO2, Y, REW, FD, and TGD are stationary at 1 (1) in the PP and ADF methods.
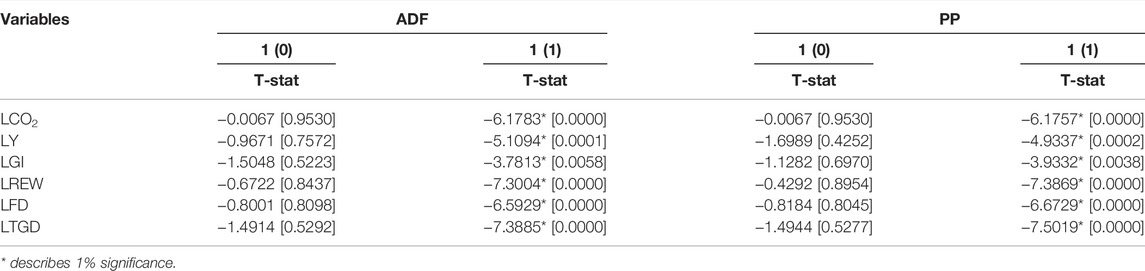
TABLE 2. PP and ADF tests.
Intercept Option Is Selected to Compute Results
However, this basic analysis overlooked a possible break in each variable. Hence, following (Sam et al., 2019), we analyzed the integration level of analyzed variables accounting for one unknown break before estimating the AARDL since the AARDL can accommodate one structural break. The Perron test with breaks in Table 3 illustrated 1 (1) integration level except for TGD which is stationary at 1 (0). In addition, the breaks in variables are also presented in Table 3. The break in CO2 is detected in 1982 and to incorporate this break, we included a dummy variable in the model. There is no major event related to this break; however, it coincides with the Environmental Protection Act of19822 in the US. Also, the United States Environmental Protection Agency strived to strengthen environmental laws during the 1980s resulting in an improvement of environmental quality in major cities (Environmental Protection Agency, 2014); hence, this may have caused a break in CO2 emissions during 1982.
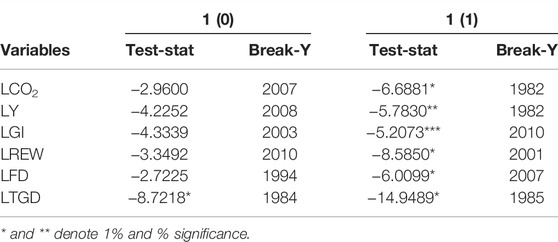
TABLE 3. Perron test with breaks.
Intercept is Added to Estimate Results
Critical Values: 10% [-4.92], 5% [-5.23], and 1% [-5.92].
The analysis presented above revealed that the variables’ stationary level is either 1 (1) or 1 (0), Thus, we can perform the cointegration test in the AARDL framework. In Table 4, the estimates suggest that in both models, the F-statistics (overall) are more than the critical values of (Narayan, 2005). Likewise, the t-statistics for the response variable (CO2) is also significant when compared against Pesaran et al. (2001) critical values. Lastly, the F-statistics for regressors in both models are more than the bootstrapped critical values of (Sam et al., 2019). Hence, all three tests indicate that LY, LY2, LGI, LREW, LFD, LTGD, and LCO2 are cointegrated. These findings are unique since three different statistics are utilized to decide the cointegration, unlike the ARDL bound method that uses the F-statistics only. All the diagnostic tests in Table 4 support the validity of the findings and the reliability of models since there is no heteroscedasticity, residual correlation, non-normal distribution, and misspecification in the models. In addition, the stability of the parameters is also evident from the plots of CUSUM and CUSUMsq in Figures 5–8.
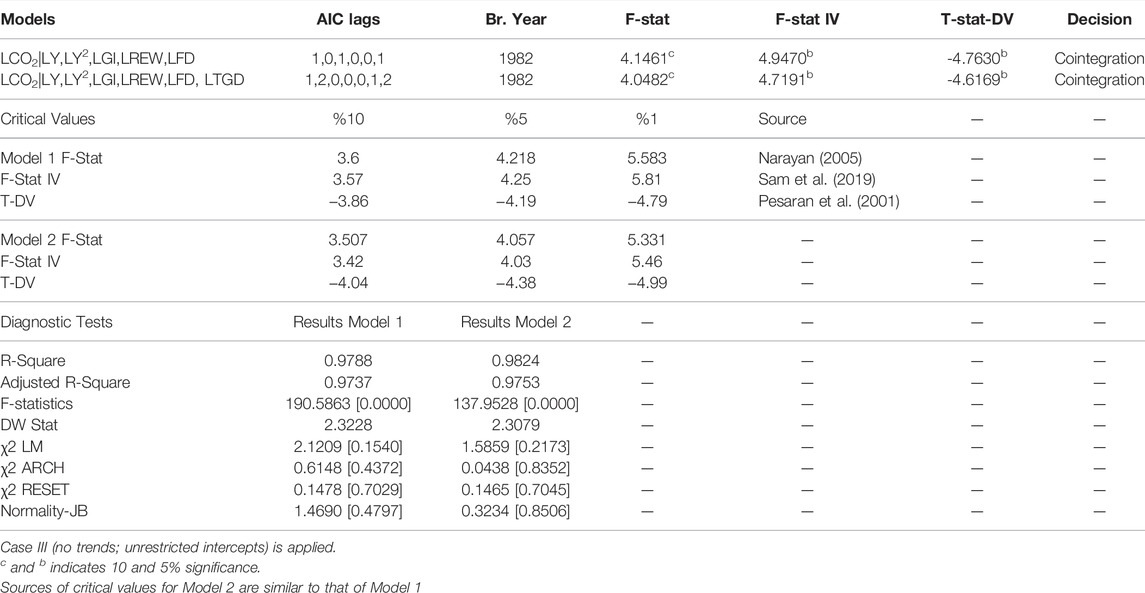
TABLE 4. Cointegration analysis augmented ARDL test.
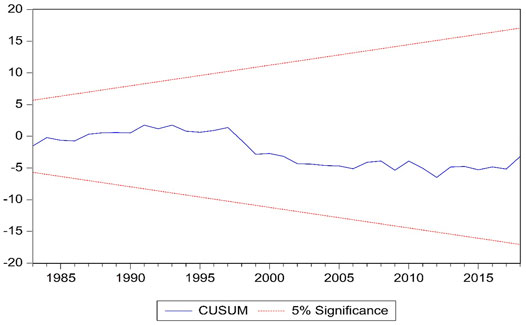
FIGURE 5. CUSUM plot (model 1).
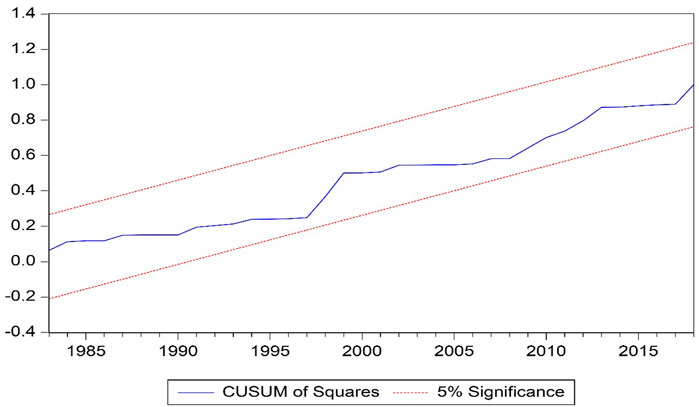
FIGURE 6. CUSUMsq plot (model 1).
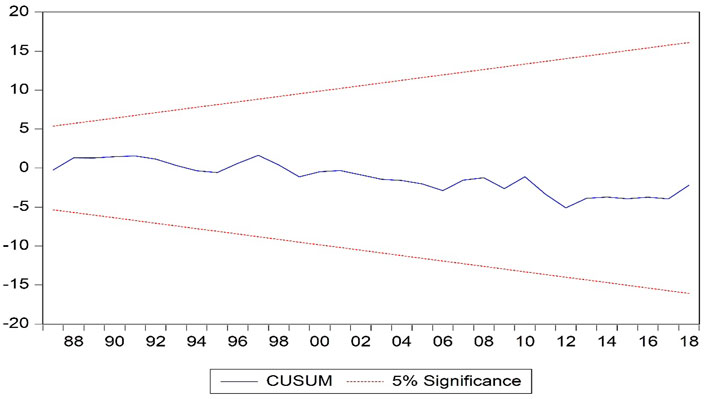
FIGURE 7. CUSUM plot (model 2).
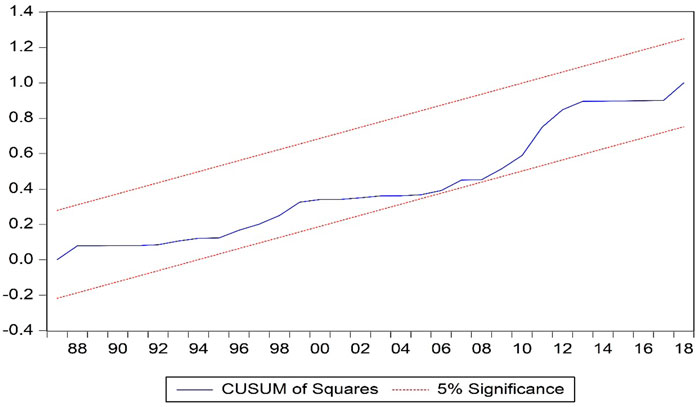
FIGURE 8. CUSUMsq plot (model 2).
The variables selected for this research are cointegrated; therefore, we can estimate the long and short-run coefficients to understand the impact of explanatory variables on CO2. In Table 5, Y and Y2 increase and decrease CO2, respectively. A rise of 12.7737 in CO2 is associated with a 1% increase in Y, while a similar upsurge of 1% in Y2 reduces CO2 by 0.6444% in the long-run. These empirical findings postulate that growth and CO2 nexus is in agreement with the EKC hypothesis. This finding matches many studies that disclosed an inverted U-shaped nexus between the economies’ growth and their environmental degradation. For example, Can et al. (2021) for OECD nations, Kihombo et al. (2021) for WAME nations, Can and Gozgor (2017) for France, and Nathaniel et al. (2020)for Africa. This empirical outcome in the context of the United States suggests that the current growth level is damaging environmental quality. This judgment is supported by the views of Ahmed et al. (2021b) who argue that the US energy mix is largely dependent on fossil energy even in recent years, and the US has accomplished most of its growth by using fossil energy that pollutes the environment. Hence, currently, economic progress is harmful to environmental quality; however, after reaching a high level, it is expected that economic progress will decrease emissions levels. This is because the US is already expanding the consumption of renewables and the government is willing to progress towards energy transition (Ahmed et al., 2021a). Also, environmental awareness, society’s demand for a green environment, and innovation are increasing in a developed nation like the US. According to the EKC hypothesis, all such factors eventually help to decrease the environmental pollution. Therefore, this result is reasonable in the context of the US.

TABLE 5. Long & short-run outcomes model 1
Green innovation (GI), which is the focus of this research, significantly alleviates CO2 i.e., a reduction of 0.1334% in CO2 is linked with a 1% rise in GI. This fresh outcome in the context of the US is somewhat validated by the panel study of Khan et al. (2020) who illustrated that environmental innovation decreases consumption-based emissions in the context of G7. Our finding is somewhat different as we used total emissions as the dependent variable and time-series data. Also, using an EKC-based model, we validated that the EKC holds in the US when including GI in the model. Besides, the studies of Murshed et al. (2021b) and Ahmad et al. (2021) also unfolded that environmental innovation is negatively connected with the ecological footprint. Thus, this result is justifiable because green innovation helps to build modern efficient technology which can play a crucial part in environmental sustainability. This finding specifies that the US is on the right track of alleviating its CO2 emissions through building environment-related technologies. Also, the presence of such technologies will help to lower the damages caused by economic progress and after a certain level of progress, the negative association between economic progress and CO2 emissions can be achieved.
Renewable energy (REW) in the US decreases CO2 and therefore, improves environmental quality. A 0.1348% mitigation in CO2 is the consequence of a 1% upsurge in REW denoting that the country can continue to boost the level of REW for carbon dioxide reduction. This estimate coincides with the conclusion of Adebayo et al. (2021) for Chile, Murshed et al. (2021a)for Bangladesh, Kahia et al. (2019)for MENA nations, Caglar (2020) for selected nine nations, and Bekun et al. (2019) for EU nations. It is well known that most of the environmental problems are caused by fossil energy while renewables are clean sources of energy with no CO2 generation; thus, clean energy in the US is helping to decrease emissions. The US is striving to reduce its share of fossil energy and increase renewables in recent years. Consequently, the share of renewables has reached approximately 11% of total energy consumption (Ahmed et al., 2021b). Our analysis suggests that this clean energy is playing a positive role in improving environmental quality in the US.
Next, FD in the US increases CO2 suggesting that FD is detrimental to environmental quality. This consequence matches the estimates of Kihombo et al. (2021) for WAME economies, Adebayo and Odugbesan (2020) for South Africa, Ahmed et al. (2021b)for J apan, and Shen et al. (2021) for China. However, this judgment contradicts the conclusions of Ahmed et al. (2019) for Malaysia. This outcome points out that lending by the financial sector increases environmental unsustainability. This makes sense since FD stimulates investments in building infrastructure that stimulates the utilization of energy. The financial sector also increases the purchasing power of people and people purchase automobiles, home appliances, and other products that raise energy demand. The financial sector also supports business organizations by lending money, which increases economic activities leading to more energy usage Ahmed et al. (2021b). Hence, FD enhances CO2 emissions in the context of the US. Also, DM (dummy variable) has a negative connection with the CO2 which validates our existing discussion that the Environmental Protection Act of 1982 and strengthening environmental laws during the 1980s have caused this break in emissions resulting in a reduction in CO2.
Moving to the short-run, the estimates in Table 5 elucidate that most variables do not influence emissions. However, FD enhances emissions and high income is positively linked with CO2. More importantly, the lagged ECT is 0.51 with the right sign signifying that adjustment to the long-run equilibrium takes less than 2 years.
In order to validate these long-run empirical estimates and also to inspect the impact of de jure trade globalization, the study estimated model two by adding de jure trade globalization in Table 6. The estimates corroborated the long-run findings of the previous model since all coefficients had similar signs and significance as in model 1. However, when adding de jure trade globalization (TGD), the EKC was proved even in the short-run. Besides, de jure trade globalization is negatively connected with CO2 but its coefficient is significant only in the short-run. It indicates that de jure parts of trade globalization, such as tariffs, trade regulations, and trade agreements, are promoting environmental sustainability up to some extent. Thus, the US may continue to improve TGD to attain environmental sustainability in the upcoming years. This is a unique finding and previous studies have not yet attempted to explore the impact of TGD on emissions. However, this finding is supported by the work of Ahmed and Le (2020) who illustrate some positive environmental effects of total trade globalization in ASEAN. Nevertheless, findings from model two validate the long-run results of model 1.
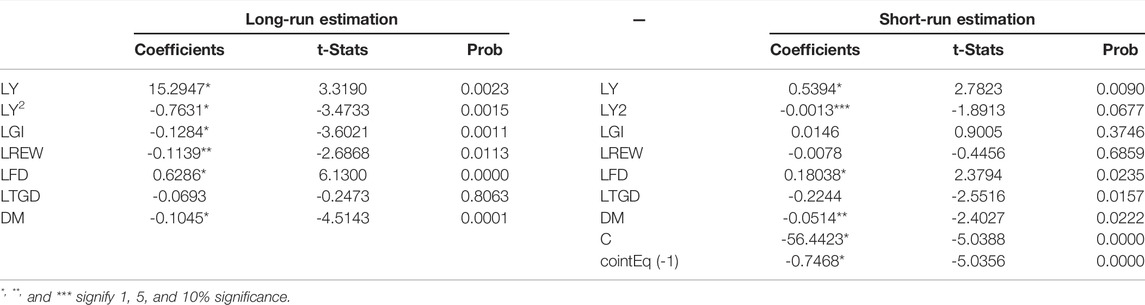
TABLE 6. Robustness analysis (long & short-run results) model 2
Finally, the Gradual Shift causality method is utilized in Table 7 to check the causal directions of variables with CO2 as well as with economic growth for better policymaking. The results indicate causality from green innovation to CO2 indicating that changes in GI will cause changes in CO2. In addition, FD also Granger causes CO2 while feedback effect is illustrated between de jure trade globalization and CO2. This feedback effect indicates that changes in TGD will cause changes in CO2. Also, an increase in CO2 motivates policymakers to revisit trade regulations, tariffs, and taxes to decrease CO2. As noticed in Table 7, CO2 Granger causes REW which suggests that due to the high level of emissions policymakers increase the share of renewables. GI Granger causes Y (economic growth) demonstrating that green innovation in the US can stimulate economic growth. FD also Granger causes Y, while feedback effect between de jure trade globalization and Y is found which suggests that TGD supports economic progress, while economic progress also drives TGD.
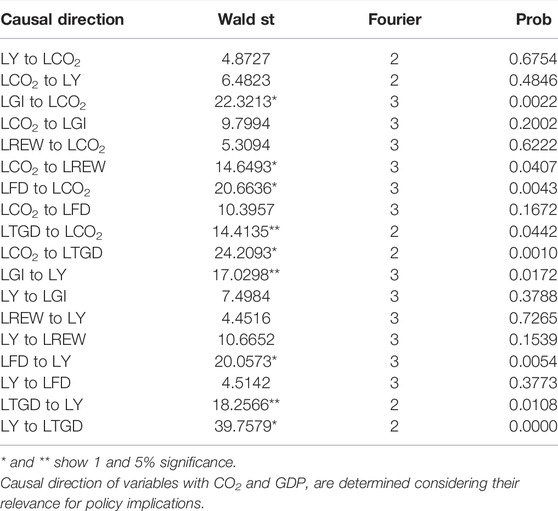
TABLE 7. Gradual shift causality results.
Conclusion and Policy Directions
Undeniably, environmental challenges are mostly the by-product of economic progress which is achieved by consuming pollutant energy sources. Green innovation can pave the way to combat environmental degradation and climate change by developing green technologies. Also, de jure trade globalization (tariffs, trade agreements, trade taxes, etc.) can play a part in conducting sustainable trade. Thus, this research studies the impacts of role of green innovation and de jure trade globalization on CO2 emissions in the US (second-largest carbon-emitting country) controlling for renewable energy (REW), economic growth (Y), and financial development (FD). The study adopts an EKC framework and employs some of the recent time series estimation methodologies for trustworthy estimates and reliable policies. The data set from 1971 to 2018 is analyzed using the AARDL and Gradual Shift causality techniques. The findings from the AARDL technique reveal that GI, TGD, Y, Y2, REW, FD, and CO2 are cointegrated. The evidence of cointegration obtained in the study is reliable and strong since all three tests in the AARDL methodology indicate the long-run equilibrium relationship among the series under focus.
After this, long-run empirical estimation is conducted to capture the effects of explanatory variables on CO2. In this regard, the outcomes revealed that green innovation not only decreases the levels of CO2 in the US but also contributes to forming the EKC between economic growth and CO2. De jure trade globalization is also negatively associated with CO2; however, its significant impact is only found in the short run. Besides, FD contributes to environmental degradation by intensifying CO2, while renewable energy (REW) lessens CO2 in the US. The Gradual Shift causality method revealed that green innovation Granger causes CO2, while there is a bidirectional association between de jure trade globalization (TGD) and CO2. In addition, green innovation also Granger causes economic growth, while bidirectional causality exists between TGD and economic growth.
These unique outcomes are important for policymaking in the US. Policies should be considered to raise the patents in environment-related technologies. This will be helpful not only to accomplish economic progress but also to attain CO2 mitigation which in turn will stimulate environmental sustainability. However, to raise the level of such patents, some tax benefits and subsidies must be offered to boost research and development in environment-related technologies. Special research grants to the universities for such innovation and collaboration of academic institutions with the industries may boost green innovation. Additionally, the study disclosed the EKC hypothesis; hence, the US must invest in clean energy and decrease dirty energy sources to lessen the adverse effects of current economic progress. Our finding direct that if the US continues to uplift renewables and green innovation, the future income level will not be harmful to environmental quality after a threshold level. Thus, in addition, to producing electricity from green energy sources, efforts should be made to offer green energy household appliances at reasonable prices to the people. This may help to increase the demand for green energy and decrease CO2.
This study also disclosed a negative linkage between de jure trade globalization and CO2. This is indeed the first attempt to understand this relationship using some reliable time series econometric techniques. This finding indicates that policymakers can use TGD as a tool to conduct sustainable trade which may help to transfer some green technology. De jure trade components can easily be revisited to achieve CO2 reduction and economic progress since TGD not only decreases emissions but is also associated with economic progress. However, policymakers should be very cautious while designing policies for de jure trade globalization since there is a feedback effect between TGD and Y. Lastly, FD is harmful to environmental quality in the US; therefore, rules and regulations must be introduced for the financial sector to make the lending sustainable.
This study is limited to the United States and a limited number of variables are considered for a short period of 1971–2018. In future investigations, one may conduct similar studies in developing countries by introducing the role of human capital and green finance.
Data Availability Statement
Publicly available datasets were analyzed in this study. This data can be found here: The raw data supporting the conclusion of this article available on the public sources mentioned in the article.
Author Contributions
HH: Conceptualization, Writing original draft: WX: Conceptualization, data curation, formal analysis, writing original draft. MA: Conceptualization, Writing original draft, writing—review, and editing, Supervision. LZ: project administration, writing—review, and editing, funding acquisition.
Funding
This work was supported by the Research on Humanities and Social Sciences in Colleges and Universities of Shandong Province (Grant No. J18RA106).
Conflict of Interest
The authors declare that the research was conducted in the absence of any commercial or financial relationships that could be construed as a potential conflict of interest.
The handling editor EE declared a shared affiliation with the authors at the time of review.
Publisher’s Note
All claims expressed in this article are solely those of the authors and do not necessarily represent those of their affiliated organizations, or those of the publisher, the editors and the reviewers. Any product that may be evaluated in this article, or claim that may be made by its manufacturer, is not guaranteed or endorsed by the publisher.
Footnotes
1See https://ustr.gov/trade-agreements/other-initiatives/environmental-goods-agreement.
2For details on environmental protection act please see, https://www.congress.gov/bill/97th-congress/house-bill/7179?r=42&s=1 (Accessed July, 2021).
References
Adebayo, T. S., and Odugbesan, J. A. (2020). Modeling CO2 Emissions in South Africa: Empirical Evidence from ARDL Based Bounds and Wavelet Coherence Techniques. Environ. Sci. Pollut. Res. 28, 9377–9389. doi:10.1007/s11356-020-11442-3
Adebayo, T. S., Udemba, E. N., Ahmed, Z., and Kirikkaleli, D. (2021). Determinants of Consumption-Based Carbon Emissions in Chile: an Application of Non-linear ARDL. Environ. Sci. Pollut. Res. 28, 43908–43922. doi:10.1007/s11356-021-13830-9
Ahmad, M., Jiang, P., Majeed, A., Umar, M., Khan, Z., and Muhammad, S. (2020). The Dynamic Impact of Natural Resources, Technological Innovations and Economic Growth on Ecological Footprint: An Advanced Panel Data Estimation. Resour. Policy 69, 101817. doi:10.1016/j.resourpol.2020.101817
Ahmad, M., Jiang, P., Murshed, M., Shehzad, K., Akram, R., Cui, L., et al. (2021). Modelling the Dynamic Linkages between Eco-Innovation, Urbanization, Economic Growth and Ecological Footprints for G7 Countries: Does Financial Globalization Matter? Sustain. Cities Soc. 70, 102881. doi:10.1016/j.scs.2021.102881
Ahmad, M., Ahmed, Z., Bai, Y., Qiao, G., Popp, J., and Oláh, J. (2022a). Financial Inclusion, Technological Innovations, and Environmental Quality: Analyzing the Role of Green Openness. Front. Environ. Sci. 10, 1–12. doi:10.3389/fenvs.2022.851263
Ahmad, M., Ahmed, Z., Gavurova, B., and Oláh, J. (2022b). Financial Risk, Renewable Energy Technology Budgets, and Environmental Sustainability: Is Going Green Possible? Front. Environ. Sci. 10, 1–10. doi:10.3389/FENVS.2022.909190
Ahmed, Z., and Le, H. P. (2020). Linking Information Communication Technology, Trade Globalization Index, and CO2 Emissions: Evidence from Advanced Panel Techniques. Environ. Sci. Pollut. Res. 28, 8770–8781. doi:10.1007/s11356-020-11205-0
Ahmed, Z., Wang, Z., Mahmood, F., Hafeez, M., and Ali, N. (2019). Does Globalization Increase the Ecological Footprint? Empirical Evidence from Malaysia. Environ. Sci. Pollut. Res. 26, 18565–18582. doi:10.1007/s11356-019-05224-9
Ahmed, Z., Cary, M., and Le, H. P. (2021a). Accounting Asymmetries in the Long-Run Nexus between Globalization and Environmental Sustainability in the United States: An Aggregated and Disaggregated Investigation. Environ. Impact Assess. Rev. 86, 106511. doi:10.1016/j.eiar.2020.106511
Ahmed, Z., Zhang, B., and Cary, M. (2021b). Linking Economic Globalization, Economic Growth, Financial Development, and Ecological Footprint: Evidence from Symmetric and Asymmetric ARDL. Ecol. Indic. 121, 107060. doi:10.1016/j.ecolind.2020.107060
Bekun, F. V., Alola, A. A., and Sarkodie, S. A. (2019). Toward a Sustainable Environment: Nexus between CO2 Emissions, Resource Rent, Renewable and Nonrenewable Energy in 16-EU Countries. Sci. Total Environ. 657, 1023–1029. doi:10.1016/j.scitotenv.2018.12.104
Emre Caglar, A. (2020). The Importance of Renewable Energy Consumption and FDI Inflows in Reducing Environmental Degradation: Bootstrap ARDL Bound Test in Selected 9 Countries. J. Clean. Prod. 264, 121663. doi:10.1016/j.jclepro.2020.121663
Cai, Y., Sam, C. Y., and Chang, T. (2018). Nexus between Clean Energy Consumption, Economic Growth and CO2 Emissions. J. Clean. Prod. 182, 1001–1011. doi:10.1016/j.jclepro.2018.02.035
Can, M., and Gozgor, G. (2017). The Impact of Economic Complexity on Carbon Emissions: Evidence from France. Environ. Sci. Pollut. Res. 24, 16364–16370. doi:10.1007/s11356-017-9219-7
Can, M., Ahmed, Z., Mercan, M., and Kalugina, O. A. (2021). The Role of Trading Environment-Friendly Goods in Environmental Sustainability: Does Green Openness Matter for OECD Countries? J. Environ. Manag. 295, 113038. doi:10.1016/j.jenvman.2021.113038
Chen, Y., and Lee, C.-C. (2020). Does Technological Innovation Reduce CO2 emissions?Cross-Country Evidence. J. Clean. Prod. 263, 121550. doi:10.1016/j.jclepro.2020.121550
Danish, , and Ulucak, R. (2021). Renewable Energy, Technological Innovation and the Environment: A Novel Dynamic Auto-Regressive Distributive Lag Simulation. Renew. Sustain. Energy Rev. 150, 111433. doi:10.1016/J.RSER.2021.111433
Ding, Q., Khattak, S. I., and Ahmad, M. (2021). Towards Sustainable Production and Consumption: Assessing the Impact of Energy Productivity and Eco-Innovation on Consumption-Based Carbon Dioxide Emissions (CCO2) in G-7 Nations. Sustain. Prod. Consum. 27, 254–268. doi:10.1016/J.SPC.2020.11.004
Dou, Y., Zhao, J., Malik, M. N., and Dong, K. (2021). Assessing the Impact of Trade Openness on CO2 Emissions: Evidence from China-Japan-ROK FTA Countries. J. Environ. Manag. 296, 113241. doi:10.1016/J.JENVMAN.2021.113241
Dreher, A., Gaston, N., and Martens, P. (2008). Measuring Globalisation : Gauging its Consequences. New York: Springer-Verlag New York. doi:10.1007/978-0-387-74069-0
Du, K., Li, P., and Yan, Z. (2019). Do green Technology Innovations Contribute to Carbon Dioxide Emission Reduction? Empirical Evidence from Patent Data. Technol. Forecast. Soc. Change 146, 297–303. doi:10.1016/J.TECHFORE.2019.06.010
Environmental Protection Agency (2014). The Editors of. Encyclopedia Britannica. Available at: https://www.britannica.com/topic/Environmental-Protection-Agency (Accessed August 12, 2021).
Grossman, G., and Krueger, A. (1991). Environmental Impacts of a North American Free Trade Agreement. Cambridge, MA: National Bureau of Economic Research. doi:10.3386/w3914
Grossman, G. M., and Krueger, A. B. (1995). Economic Growth and the Environment. Q. J. Econ. 110, 353–377. doi:10.2307/2118443
Guo, L. l., Qu, Y., and Tseng, M.-L. (2017). The Interaction Effects of Environmental Regulation and Technological Innovation on Regional Green Growth Performance. J. Clean. Prod. 162, 894–902. doi:10.1016/j.jclepro.2017.05.210
Guo, J., Zhou, Y., Ali, S., Shahzad, U., and Cui, L. (2021). Exploring the Role of Green Innovation and Investment in Energy for Environmental Quality: An Empirical Appraisal from Provincial Data of China. J. Environ. Manag. 292, 112779. doi:10.1016/j.jenvman.2021.112779
Gygli, S., Haelg, F., Potrafke, N., and Sturm, J.-E. (2019). The KOF Globalisation Index - Revisited. Rev. Int. Organ. 14, 543–574. doi:10.1007/s11558-019-09344-2
Hashmi, R., and Alam, K. (2019). Dynamic Relationship Among Environmental Regulation, Innovation, CO2 Emissions, Population, and Economic Growth in OECD Countries: A Panel Investigation. J. Clean. Prod. 231, 1100–1109. doi:10.1016/j.jclepro.2019.05.325
Henriques, S. T., and Borowiecki, K. J. (2017). The Drivers of Long-Run CO2 Emissions in Europe, North America and Japan since 1800. Energy Policy 101, 537–549. doi:10.1016/J.ENPOL.2016.11.005
IEA (2017). International Energy Agency, World Energy Balances: Overview. https://www.iea.org/publications/freepublications/publication/world-energy-balances---2017-edition---overview.html 21 (Accessed February 09, 2022).
IEA (2020). CO2 Emissions from Fuel Combustion 2020: Highlights. [WWW Document] https://webstore.iea.org/co2-emissions-from-fuel-combustion-2020-highlights (Accessed February 15, 2022).
Kahia, M., Ben Jebli, M., and Belloumi, M. (2019). Analysis of the Impact of Renewable Energy Consumption and Economic Growth on Carbon Dioxide Emissions in 12 MENA Countries. Clean. Techn Environ. Policy 21, 871–885. doi:10.1007/s10098-019-01676-2
Khan, Z., Ali, S., Umar, M., Kirikkaleli, D., and Jiao, Z. (2020). Consumption-based Carbon Emissions and International Trade in G7 Countries: The Role of Environmental Innovation and Renewable Energy. Sci. Total Environ. 730, 138945. doi:10.1016/j.scitotenv.2020.138945
Khan, I., Hou, F., and Le, H. P. (2021). The Impact of Natural Resources, Energy Consumption, and Population Growth on Environmental Quality: Fresh Evidence from the United States of America. Sci. Total Environ. 754, 142222. doi:10.1016/j.scitotenv.2020.142222
Kihombo, S., Saud, S., Ahmed, Z., and Chen, S. (2021). The Effects of Research and Development and Financial Development on CO2 Emissions: Evidence from Selected WAME Economies. Environ. Sci. Pollut. Res. 28, 51149–51159. doi:10.1007/s11356-021-14288-5
Lin, B., and Zhu, J. (2019). The Role of Renewable Energy Technological Innovation on Climate Change: Empirical Evidence from China. Sci. Total Environ. 659, 1505–1512. doi:10.1016/J.SCITOTENV.2018.12.449
McNown, R., Sam, C. Y., and Goh, S. K. (2018). Bootstrapping the Autoregressive Distributed Lag Test for Cointegration. Appl. Econ. 50, 1509–1521. doi:10.1080/00036846.2017.1366643
Murshed, M., Ahmed, Z., Alam, M. S., Mahmood, H., Rehman, A., and Dagar, V. (2021a). Reinvigorating the Role of Clean Energy Transition for Achieving a Low-Carbon Economy: Evidence from Bangladesh. Environ. Sci. Pollut. Res. 28, 67689–67710. doi:10.1007/s11356-021-15352-w
Murshed, M., Rahman, M. A., Alam, M. S., Ahmad, P., and Dagar, V. (2021b). The Nexus between Environmental Regulations, Economic Growth, and Environmental Sustainability: Linking Environmental Patents to Ecological Footprint Reduction in South Asia. Environ. Sci. Pollut. Res. 28, 49967–49988. doi:10.1007/s11356-021-13381-z
Narayan, P. K. (2005). The Saving and Investment Nexus for China: Evidence from Cointegration Tests. Appl. Econ. 37, 1979–1990. doi:10.1080/00036840500278103
Nathaniel, S., Barua, S., Hussain, H., and Adeleye, N. (2020). The Determinants and Interrelationship of Carbon Emissions and Economic Growth in African Economies: Fresh Insights from Static and Dynamic Models. J. Public Aff. 21, 1–15. doi:10.1002/pa.2141
Nazlioglu, S., Gormus, N. A., and Soytas, U. (2016). Oil Prices and Real Estate Investment Trusts (REITs): Gradual-Shift Causality and Volatility Transmission Analysis. Energy Econ. 60, 168–175. doi:10.1016/j.eneco.2016.09.009
OECD (2022). Patents on Environment Technologies (Indicator) (Accessed February 01, 2022). doi:10.1787/fff120f8-en
OWD (2021). Our World in Data. Available at: https://ourworldindata.org/grapher/per-capita-renewables%0A (Accessed February 05, 2022).
Pata, U. K., and Caglar, A. E. (2021). Investigating the EKC Hypothesis with Renewable Energy Consumption, Human Capital, Globalization and Trade Openness for China: Evidence from Augmented ARDL Approach with a Structural Break. Energy 216, 119220. doi:10.1016/j.energy.2020.119220
Pesaran, M. H., Shin, Y., and Smith, R. J. (2001). Bounds Testing Approaches to the Analysis of Level Relationships. J. Appl. Econ. 16, 289–326. doi:10.1002/jae.616
Sam, C. Y., McNown, R., and Goh, S. K. (2019). An Augmented Autoregressive Distributed Lag Bounds Test for Cointegration. Econ. Model. 80, 130–141. doi:10.1016/j.econmod.2018.11.001
Shahbaz, M., Mallick, H., Mahalik, M. K., and Sadorsky, P. (2016). The Role of Globalization on the Recent Evolution of Energy Demand in India: Implications for Sustainable Development. Energy Econ. 55, 52–68. doi:10.1016/j.eneco.2016.01.013
Shen, Y., Su, Z.-W., Malik, M. Y., Umar, M., Khan, Z., and Khan, M. (2021). Does Green Investment, Financial Development and Natural Resources Rent Limit Carbon Emissions? A Provincial Panel Analysis of China. Sci. Total Environ. 755, 142538. doi:10.1016/j.scitotenv.2020.142538
Sinha, A., Sengupta, T., and Alvarado, R. (2020). Interplay between Technological Innovation and Environmental Quality: Formulating the SDG Policies for Next 11 Economies. J. Clean. Prod. 242, 118549. doi:10.1016/j.jclepro.2019.118549
Su, H.-N., and Moaniba, I. M. (2017). Does Innovation Respond to Climate Change? Empirical Evidence from Patents and Greenhouse Gas Emissions. Technol. Forecast. Soc. Change 122, 49–62. doi:10.1016/j.techfore.2017.04.017
Toda, H. Y., and Yamamoto, T. (1995). Statistical Inference in Vector Autoregressions with Possibly Integrated Processes. J. Econ. 66, 225–250. doi:10.1016/0304-4076(94)01616-8
Wang, Z., Yang, Z., Zhang, Y., and Yin, J. (2012). Energy Technology patents-CO2 Emissions Nexus: An Empirical Analysis from China. Energy Policy 42, 248–260. doi:10.1016/J.ENPOL.2011.11.082
Wang, K.-H., Umar, M., Akram, R., and Caglar, E. (2021). Is Technological Innovation Making World "Greener"? an Evidence from Changing Growth Story of China. Technol. Forecast. Soc. Change 165, 120516. doi:10.1016/j.techfore.2020.120516
WDI (2021). World Devleopment Indicators (WDI). Available at: https://datatopics.worldbank.org/world-development-indicators/(Accessed on may 11, 2022).
Keywords: environmental innovation, renewable energy, economic growth, environmental sustainability, united states
Citation: Hongqiao H, Xinjun W, Ahmad M and Zhonghua L (2022) Does innovation in Environmental Technologies Curb CO2 Emissions? Evidence From Advanced Time Series Techniques. Front. Environ. Sci. 10:930521. doi: 10.3389/fenvs.2022.930521
Received: 28 April 2022; Accepted: 23 May 2022;
Published: 08 June 2022.
Edited by:
Ehsan Elahi, Shandong University of Technology, ChinaReviewed by:
Shujaat Abbas, Ural Federal University, RussiaTao Peng, Ocean University of China, China
Copyright © 2022 Hongqiao, Xinjun, Ahmad and Zhonghua. This is an open-access article distributed under the terms of the Creative Commons Attribution License (CC BY). The use, distribution or reproduction in other forums is permitted, provided the original author(s) and the copyright owner(s) are credited and that the original publication in this journal is cited, in accordance with accepted academic practice. No use, distribution or reproduction is permitted which does not comply with these terms.
*Correspondence: Wang Xinjun, sdutwxj@126.com