The Rhinobiome of Exacerbated Wheezers and Asthmatics: Insights From a German Pediatric Exacerbation Network
 Malik Aydin1,2* Cornelius Weisser2
  Olivier Rué3
  Mahendra Mariadassou3
  Sandra Maaß4 Ann-Kathrin Behrendt5
  Yan Jaszczyszyn6 Tatje Heilker2 Maximilian Spaeth2 Silvia Vogel7 Sören Lutz8 Parviz Ahmad-Nejad9 Viktoria Graf9 Aliyah Bellm10
  Christoph Weisser11
  Ella A. Naumova12 Wolfgang H. Arnold12 Anja Ehrhardt13 Almut Meyer-Bahlburg5
  Dörte Becher4
  Jan Postberg14† Beniam Ghebremedhin9† Stefan Wirth1†
- 1Laboratory of Experimental Pediatric Pneumology and Allergology, Faculty of Health, Center for Biomedical Education and Research, School of Life Sciences, Witten/Herdecke University, Witten, Germany
- 2Center for Child and Adolescent Medicine, Helios University Hospital Wuppertal, Witten/Herdecke University, Wuppertal, Germany
- 3Université Paris-Saclay, INRAE, MaIAGE, Jouy-en-Josas, France
- 4Center of Functional Genomics of Microbes, Institute of Microbiology, University of Greifswald, Greifswald, Germany
- 5Pediatric Rheumatology and Immunology, Department of Pediatrics, University Medicine Greifswald, Greifswald, Germany
- 6Université Paris-Saclay, CEA, CNRS, Institute for Integrative Biology of the Cell, Gif-sur-Yvette, France
- 7Department of Pathology, Division of Molecular Pathology, Helios University Hospital Wuppertal, Center for Clinical and Translational Research, Witten/Herdecke University, Wuppertal, Germany
- 8Children's Hospital, Helios Hospital Niederberg, Teaching Hospital of University Hospital Essen, Velbert, Germany
- 9Institute for Medical Laboratory Diagnostics, Center for Clinical and Translational Research, Helios University Hospital Wuppertal, Witten/Herdecke University, Wuppertal, Germany
- 10Helios Hospital Krefeld, Children's Hospital, Teaching Hospital of Rheinisch-Westfälische Technische Hochschule (RTWH) University Aachen, Krefeld, Germany
- 11Department of Economics and Center for Statistics, Georg-August University Göttingen, Göttingen, Germany
- 12Department of Biological and Material Sciences in Dentistry, Faculty of Health, Witten/Herdecke University, Witten, Germany
- 13Department of Human Medicine, Faculty of Health, Institute of Virology and Microbiology, Center for Biomedical Education and Research, Witten/Herdecke University, Witten, Germany
- 14Laboratory of Clinical Molecular Genetics and Epigenetics, Faculty of Health, Center for Biomedical Education and Research, School of Life Sciences, Witten/Herdecke University, Wuppertal, Germany
Although the nose, as a gateway for organism–environment interactions, may have a key role in asthmatic exacerbation, the rhinobiome of exacerbated children with asthma was widely neglected to date. The aim of this study is to understand the microbiome, the microbial immunology, and the proteome of exacerbated children and adolescents with wheeze and asthma. Considering that a certain proportion of wheezers may show a progression to asthma, the comparison of both groups provides important information regarding clinical and phenotype stratification. Thus, deep nasopharyngeal swab specimens, nasal epithelial spheroid (NAEsp) cultures, and blood samples of acute exacerbated wheezers (WH), asthmatics (AB), and healthy controls (HC) were used for culture (n = 146), 16 S-rRNA gene amplicon sequencing (n = 64), and proteomic and cytokine analyses. Interestingly, Proteobacteria were over-represented in WH, whereas Firmicutes and Bacteroidetes were associated with AB. In contrast, Actinobacteria commonly colonized HCs. Moreover, Staphylococcaceae, Enterobacteriaceae, Burkholderiaceae, Xanthobacteraceae, and Sphingomonadaceae were significantly more abundant in AB compared to WH and HC. The α-diversity analyses demonstrated an increase of bacterial abundance levels in atopic AB and a decrease in WH samples. Microbiome profiles of atopic WH differed significantly from atopic AB, whereby atopic samples of WH were more homogeneous than those of non-atopic subjects. The NAEsp bacterial exposure experiments provided a disrupted epithelial cell integrity, a cytokine release, and cohort-specific proteomic differences especially for Moraxella catarrhalis cultures. This comprehensive dataset contributes to a deeper insight into the poorly understood plasticity of the nasal microbiota, and, in particular, may enforce our understanding in the pathogenesis of asthma exacerbation in childhood.
Introduction
Childhood asthma is one of the most common respiratory disease worldwide, which is characterized by airway inflammation and reversible respiratory symptoms (1, 2). Asthma and wheeze during childhood are complex disease entities; their clinical presentation is shadowed by multifactorial causes (3). Increased westernized lifestyle conditions in urban environment, air pollution, and the method of childbirth may contribute to this dramatic prevalence (4–7). Infections with certain bacteria in early childhood may at least indirectly be a risk factor for asthma, and the inclusion of microbiome phenotypes as biomarkers may eventually contribute to an improved understanding of disease pathogenesis, course monitoring, comparisons, and similarities between wheezers (WH) and asthmatics (AB) (8, 9). In detail, the microbiome of the nasopharynx (NP) may develop from bacterial species that are colonized on the skin or vaginal flora of mothers and may be transmitted from parents to their children (10–13). During the first year of life, the bacterial colonization changes through contact with other individuals due to the use of antibiotic therapies; further bacterial species may be added, or certain bacterial species may be selected out of the microbiome (13–15). Interestingly, children with a neonatal colonization of S. pneumoniae, M. catarrhalis, and H. influenzae or a combination of these bacteria are at increased risk of developing persistent wheeze or asthma (16). The microbiome of the NP and the oropharynx (OP) is similar to that of the lung (9, 17, 18). Children with asthma have a lower bacterial diversity in the NP compared to healthy subjects (19). Although few studies describe the role of nasal and pharyngeal microbiome in patients with allergies and asthma and indicate that the microbiome may have an influence on the regulatory units of the innate immune system (20, 21), the characterization of the nasal microbiome in exacerbated children with chronic bronchitis and asthma is not sufficiently well-studied. Moreover, the literature does not embrace the early childhood exacerbation, which should reflect the burden of asthma, as stated by the World Health Organization (https://www.who.int/news-room/fact-sheets/detail/asthma). A better in-depth knowledge of the factors triggering acute exacerbations are important. Hence, considering these aspects, we aimed to describe the bacterial composition of the nasal cavity of exacerbated pediatric WH and AB and analyzed the impact of M. catarrhalis on the proteome profile of nasal epithelial spheroids (NAEsp) with the main desire to improve the clinical stratification in the near future.
Materials and Methods
Subjects and Study Design
We performed a prospective clinical trial of acute exacerbated pediatric subjects with chronic bronchitis/wheeze (3 months to <6 years of age) or asthma (≥6–17 years of age) suffering from an acute exacerbation episode. A detailed study description was previously published (22, 23). Briefly, deep nasopharyngeal swab specimens were taken during study enrollment. The AB and WH were divided into atopic and non-atopic groups based on clinical and laboratory parameters (e.g., positive allergic sensitization, total IgE levels, IgE-specific antibodies to distinct allergens, positive clinics for atopic disorders, etc.). In addition, children without any chronic diseases, absent from acute febrile infections, and term delivery were classified as healthy subjects (22, 23).
Technical Information
16S rRNA Meta-Barcoding and Culturing
To analyze the bacterial diversity in the nasopharyngeal cavity using the 16S V3–V4 ribosomal RNA regions, data from our pediatric exacerbation study cohort were used for nasal microbiota analyses through high-throughput next-generation sequencing (NGS) technique. Deep frozen swab specimens (eSwab COPAN LQ Amies) were systematically thawed. For DNA extraction, a special protocol was established using QIAmp DNA micro and QIAmp DNA Microbiome kits from QIAGEN. Further information on the DNA isolation method is available in this article's online repository material. For amplification of the V3 and V4 regions of the bacterial DNA, the 16S gene amplicon sequencing library preparation protocol from Illumina® was used according to Illumina's recommendations. The primer sequences used for this study were already previously tested as most effective for 16S ribosomal RNA V3 and V4 regions (22, 24, 25) (https://emea.support.illumina.com/documents/documentation/chemistry_documentation/16s/16s/16s-metagenomic-library-prep-guide-15044223-b.pdf). A detailed technical information on library preparation is available in this article's online repository material.
The libraries were sequenced on an Illumina® MiSeq instrument in a paired end 2 × 300 bp run, using a MiSeq Reagent Kit v3 (600 cycle). Demultiplexing was performed (bcl2fastq2 V2.2.18.12) and adapters were trimmed with Cutadapt 1.15; only reads longer than 10 bp were kept. For each sample, at least 75,000 reads were obtained.
For the classical bacterial culture, each nasopharyngeal swab was streaked on BD™ Chocolate Agar, Columbia blood with 5% sheep blood, Columbia CNA Agar, and MacConkey Agar (all media from Becton Dickinson, Heidelberg) for up to 48 h incubation at 37°C. The blood-containing medium was incubated at 37°C and 5% CO2 atmosphere (Panasonic, Inco Safe CO2 Incubator, MCO-230AICUV). Matrix-assisted laser desorption/ionization time-of-flight mass spectrometry (MALDI-TOF-MS, Bruker) was used for bacterial identification based on ribosomal proteins. The antimicrobial susceptibility testing of the bacterial isolates was performed either with the automated system BD Phoenix™ or manually via an Epsilometer test, and/or agar diffusion tests.
Moraxella Catarrhalis, Staphylococcus Aureus, and Haemophilus Influenzae in vitro Exposure Model
To analyze the effects of isolated M. catarrhalis on nasal epithelial cells (NAEPCs), subject-derived NAEPCs at passage 2 (P2) were seeded for spheroid cell culture (1 × 10³ cells per well) on a non-cell attachment, lipidure®-coated, 96-well, U-bottom plate from amsbio® using Pneumacult ALI culture media from STEMCELL™ Technologies, Vancouver, Canada (26). The culture media was changed every 2 days, and the cells were incubated at 37°C and 5% CO2 for up to maximum 10 days until a size of ~200–300 nm was observed. Subject-derived deep-frozen M. catarrhalis cultures of AB and WH were thawed and re-cultivated on a Choco culture agar plate for 24 h at 37°C and 5% CO2. A biofilm production was confirmed using the 96-well microtiter plate assay. Following incubation at 37°C, planktonic bacteria were rinsed with sterile saline, and the remaining adherent bacteria were stained with crystal violet dye. Biofilm-producing M. catarrhalis cultures were used in a concentration of 5 × 10⁵ per well on spheroid cell cultures and incubated for 24 h at 37°C and 5% CO2. In addition, S. aureus and H. (para-)influenzae cultures were also used for comparison experiments. Epithelial cell damage factors such as lactate dehydrogenase (LDH) were assessed for M. catarrhalis exposure experiments using LDH-Glo™ cytotoxicity assay provided by Promega. Using bead-based multiplex LEGENDplex™ assays by BioLegend, Canada (Human B cell Panel #740527, Human Cytokine Panel 2 #740526, Human Inflammation Panel 1 #740808), the following cytokines were analyzed: Interleukin-(IL)17A, IFN-γ, and TNF-α. LEGENDplex™ assay kits were performed according to the manufacturer's instructions. In detail, samples were incubated with capture beads and assay buffer in V-bottom plates overnight with constant shaking at 4°C. In parallel, standard dilutions were prepared and likewise incubated with beads and Matrix A1. After two washing steps (800 × g for 5 min with 200 μl of wash buffer), beads were incubated with biotinylated detection antibodies for 1 h followed by streptavidin-PE for 30 min at RT on a plate shaker. Plates were washed and beads were resuspended in 100 μl of wash buffer. Samples were stored protected from light at 4°C until measurement with a BD FACS Canto II flow cytometer. Reactions were performed in duplicate. Data were analyzed via LEGENDplex™ V8.0 software (BioLegend®) based on standard curve interpolation and specified as pg/ml.
Whole Proteome Analyses
Next, we were interested whether the proteome level of infected NAEsp with subject-derived M. catarrhalis was biologically different between groups. The exposure experiments with M. catarrhalis were firstly lysed, and the extracted proteins were separated by 1D SDS-PAGE before tryptic in-gel digestion. Eluted peptides were analyzed by LC-MS/MS using an EASY-nLC II liquid chromatography system coupled to an LTQ Orbitrap Velos Pro (ThermoFisher Scientific, Waltham, Massachusetts, U.S.A.). Results obtained during analysis of a pure culture of n = 5 subject-derived M. catarrhalis strains were used to create a spectral library, which was subsequently used to identify spectra obtained from infection experiments. First, the data obtained from infection experiments were searched against the generated spectral library using the tool “SpectraST Search” within the TPP framework. Obtained pep.xml files where combined to interact.pep.xmls and processed with Peptide Prophet. Resulting ipro.pep.xmls were merged into protein lists using the TPP Tool “Analyze proteins” with activated “Normalize NSP using protein length” option. Finally, the software Philosopher (Nesvizhskii Lab) was used to filter the prot.xml files for an FDR of <0.01 on peptide and protein level. More details on sample preparation, MS analysis, and data processing can be found in the Supplementary Material.
Bioinformatics Analyses
Statistical analyses for LDH and cytokine measurements were performed using GraphPad Prism version 8.3.0 for Windows, GraphPad Software, La Jolla, California, U.S.A. (www.graphpad.com). The data were presented as mean and standard error of the mean (SEM). The data were firstly tested for normal distribution using the Shapiro–Wilk test. The majority of the results were not normally distributed. To perform statements regarding significant differences between groups, the following non-parametric test procedures were therefore used: for >2 groups, the Kruskal–Wallis test with Dunn's multiple post-hoc test was used for correction for multiple comparisons; for simple pair comparisons (two groups), the Mann–Whitney U-test was used. The significance level α was set as 0.05. The significance level was set at *p < 0.05.
The quality of the sequenced samples was assessed with FASTQC Babraham Bioinformatics (http://www.bioinformatics.babraham.ac.uk/projects/fastqc) (27). Sequencing data analyses were performed with FROGS pipeline (27). FROGS is designed to analyze large sets of amplicon sequences and produces abundance tables of operational taxonomic unit (OTU) and their taxonomic affiliation. Briefly, this pipeline includes a pre-processing step where reads were merged with PEAR (28), primers were removed with cutadept, and remaining sequences were de-replicated and filtered according to their length (400–440 bp) and N content. This step was followed by Swarm clustering (29) with an agglomeration distance of d = 3. Chimera detection was then performed using Vsearch (30) before applying an OTU abundance filter (OTUs with total count <10 × e5 of the total abundance were discarded). The sequence of each OTU was then affiliated with blastn against the Silva v132 database (31). OTUs with a blast coverage <95% were removed. Finally, Fasttree (32) was used to build a phylogenetic tree from the remaining sequences.
All diversity analyses were performed using the R statistical software (v 3.6.1) and phyloseq package (https://www.R-project.org/) (33). α-diversity was computed using the specific richness, the Shannon index (moderately upweights abundant taxa), and the Inverse-Simpson (upweights abundant taxa) index. α-diversity indices were compared with Kruskal–Wallis tests, followed by Dunn's post-hoc tests. β-diversity was computed using the Jaccard, Bray–Curtis (upweights abundant taxa), UniFrac (upweights phylogenetically distant taxa), and weighted UniFrac (upweights phylogenetically distant and abundant taxa) indices after rarefaction to the same number of reads per sample. Ordination of β-diversity matrices to produce 2D-plots was done using multidimensional scaling (MDS), and PERMANOVA (a multivariate equivalent of ANOVA) was used to test whether a factor had an effect on the average microbiome composition.
Furthermore, DESeq2 was used to perform the differential abundance tests. DESeq2 uses a generalized linear model with negative binomial distribution. The p-values were corrected for multiple comparison using the Benjamini–Hochberg correction procedure to control the false discovery rate at a p-level of 0.05. The final normalized read number was 50,000 reads per sample.
Results
The Characterization of the Patient Cohort
For this approach, n = 146 nasopharyngeal swab specimens were used for further analyses including culture-based (n = 146) and NGS-based methodology (n = 64). A total of 146 patient samples were used for cultural analyses, whereas n = 46 was derived from AB (n = 17♀; 10.3 ± 3.3 years), n = 61 from WH (n = 20♀; 2.3 ± 1.5 years), and n = 39 from HC cohorts (n = 18♀; 8.5 ± 4.4 years). A total of 64 patient samples were additionally used for 16S-rRNA gene amplicon sequencing analyses, whereas n = 23 was derived from AB (n = 6 ♀, 9.4 ± 3.5 years), n = 23 from WH (n = 9 ♀, 2.6 ± 1.3 years), and n = 18 from HC groups (n = 9♀, 8.1 ± 3.4 years). Table 1 summarizes the patient-relevant characteristics in detail.

Table 1. Clinical item parameters of samples used for this approach.
The Nasal Cavity of WH Is Colonized With More Bacteria Than Other Groups
By use of culture-based methodology, n = 146 nasal swab specimens were taken into the analyses. In detail, 46 of 61 subjects with wheeze had a positive bacterial culture (75.4%) in comparison to AB (n = 21 of 46) and HC (n = 12 of 39). Specifically, we detected H. (para-)influenzae, Moraxella spp., Streptococcus spp., and Staphylococcus spp. in the specimens of our cohort. In concordance with the literature, WH showed more colonization with M. catarrhalis [n = 21 (45.6%) vs. n = 4 (19.1%) in AB, and n = 3 (25%) in HC], as well as H. (para-)influenzae [n = 20 (43.5%) vs. n = 8 (38.1%) in AB, and n = 3 (25%) in HC], S. pneumoniae [n = 3 (6.5%) vs. n = 0 (0%) in AB, and n = 0 (0%) in HC], and S. aureus [n = 11 (23.9%) vs. n = 11 (52.4%) in AB, and n = 6 (50%) in HC]. The culture-based results were again divided into further subgroups (atopic/non-atopic) and analyzed. Interestingly, atopic AB (n = 41) showed positive cultures for H. (para-)influenzae in n = 7 cases, n = 10 for S. aureus, and n = 2 for M. catarrhalis, whereas atopic WH (n = 25) showed similar results: n = 8 positive cultures for H. (para-)influenzae, n = 8 for S. aureus, and n = 12 for M. catarrhalis. When the respective groups were divided into non-atopic subgroups, non-atopic AB (n = 5) showed n = 1 positive cultures for H. (para-)influenzae, n = 2 for S. aureus, and n = 1 for M. catarrhalis. The non-atopic WH (n = 36) had n = 12 positive cultures for H. (para-)influenzae, n = 3 for S. aureus, and n = 9 for M. catarrhalis.
The Composition of the Nasal Microbiota Varied Between WH and AB
Next, nasopharyngeal swab specimens were then used for 16S-rRNA gene amplicon sequencing analyses. Here, the abundance of phyla revealed differences between AB, WH, and HC (Figure 1A). In detail, Proteobacteria was more frequently sequenced in WH. Asthmatics, on the other hand, had more Firmicutes. Actinobacteria was more frequently present in the HC group (permANOVA p = 0.005). Figure 1B presents the genera level abundances of bacteria. Categorizing the subjects into atopic and non-atopic status, atopic WH had more commonly Proteobacteria in the nasal swab specimens than atopic AB (permANOVA p = 0.015). Moraxella and Haemophilus were among the most abundant genera in WH. In detail, S. pneumoniae, M. catarrhalis, S. aureus, and Haemophilus (para-) influenzae accounted for most of the sequences. Interestingly, further analyses of Proteobacteria revealed that non-atopic WH were more frequently colonized with Moraxella and Haemophilus as compared to AB and HC. Atopic AB were more colonized with Streptococcus and Staphylococcus in the nasal cavity. Atopic WH had higher Moraxella colonization rates than AB, whereas non-atopic WH were more colonized with Streptococcus and Moraxella colonization (Figure 1C). We then compared the colonization levels of several taxa between atopic subjects with HC. Staphylococcaceae (p < 0.05), Enterobacteriaceae (p < 0.05), Burkholderiaceae (p < 0.05), Xanthobacteriaceae (p < 0.05), and Sphingomonadaceae (p < 0.05) were significantly more abundant in atopic pediatric subjects (Supplementary Figures 1A,B).
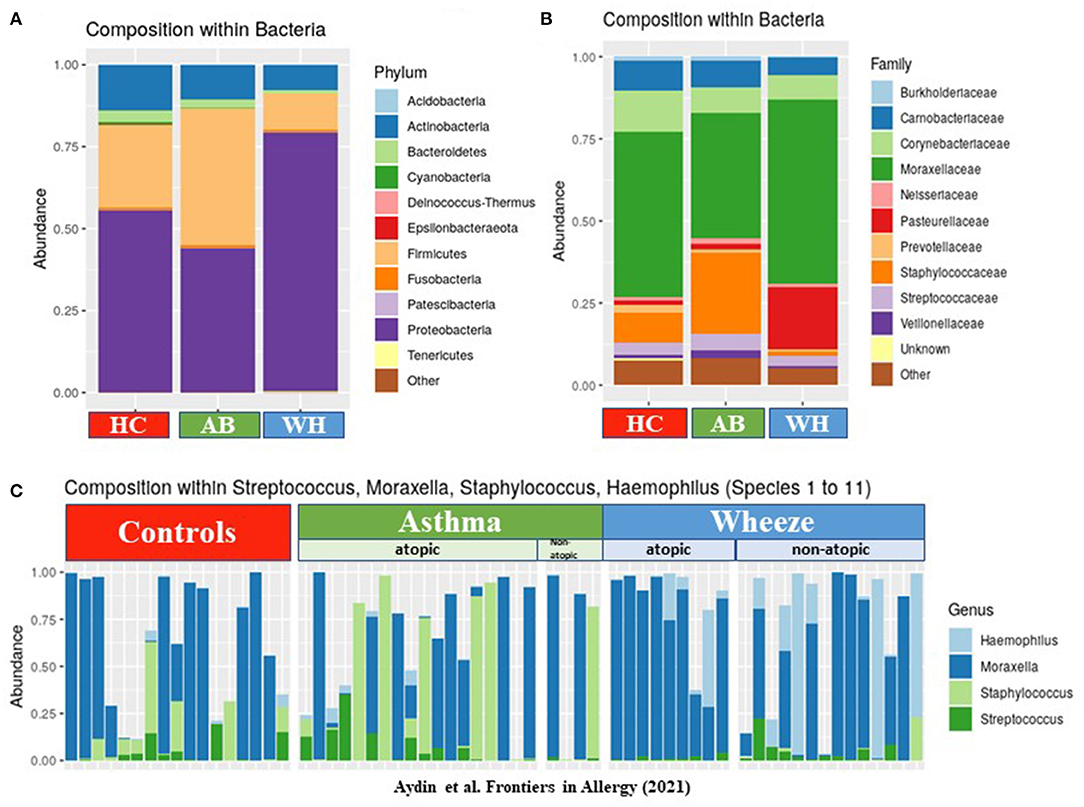
Figure 1. The composition of bacteria in different disease groups. (A) The y-axis shows the abundances of each phylum level. Proteobacteria were highly abundant in WH, whereas Firmicutes, Cyanobacteria, and Actinobacteria were commonly more colonized in AB (n = 64). (B) This figure presents the genera level abundances of bacteria. (C) The relative abundance levels of Moraxella (and other genus found by cultural approach) are presented in three different groups: HC, AB, and WH and subclassified in atopic/non-atopic AB and WH (AB, Asthmatics; WH, Wheezers; HC, Healthy controls).
α-Diversity Level Differed in Terms of Atopic Level
Focusing on the specific α-diversity using the observed number of OTUs, according to the Shannon (moderately upweights abundant taxa) and the Inverse-Simpson indices (strongly upweights abundant taxa), observed on the rarefaction curves, the diversities were widely distributed in terms of number of OTU, but less so in terms of number of effective taxa (InvSimpson). The atopic WH were different from the atopic AB, as the atopic from the non-atopic WH (p = 0.0198) and the atopic from the non-atopic AB (p = 0.0198; Supplementary Figures 2A,B). Thus, the α-diversity was increased in atopic AB, but it was decreased in WH (Observed p = 0.008, Shannon p = 0.066, InvSimpson p = 0.081) (Figure 2). The β-diversity results are presented in the Supplementary Material of this manuscript.
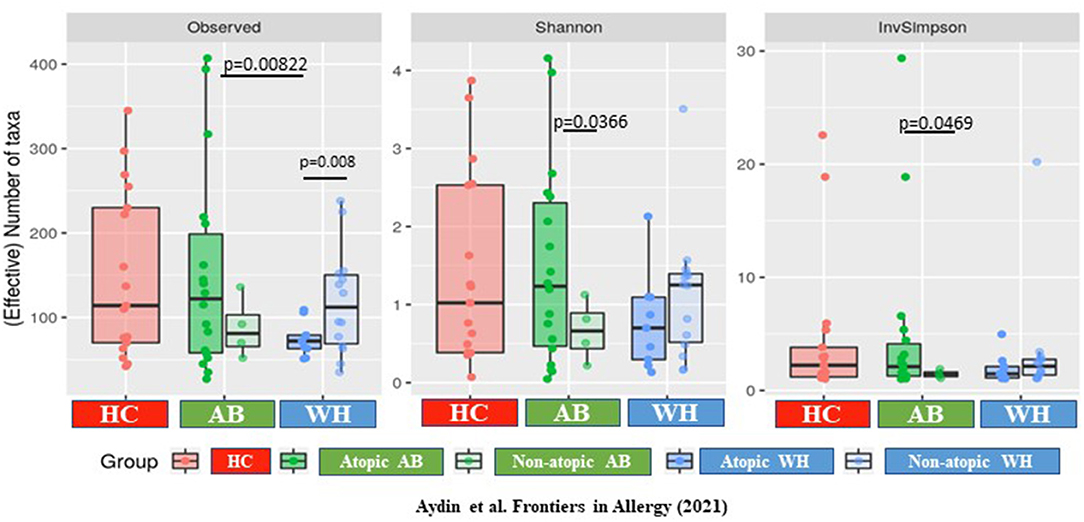
Figure 2. The α-diversity differs between atopic and non-atopic diseased subjects. The α-diversity is increased in atopic AB but is decreased in WH (Observed p = 0.008, Shannon p = 0.066, InvSimpson p = 0.081) (AB, Asthmatics; WH, Wheezers; HC, Healthy controls).
Differential Abundances of Taxa Showed Distinct Clusters in the AB, WH, and HC
We filtered the taxa (keeping only those present in at least 12% of the samples) before performing a differential abundance analysis on the remaining taxa. In total, we identified n = 24 OTUs with differential abundances in AB, WH, and HC (Supplementary Figures 3A,B and Supplementary Table 1). With reference to the atopic status, we observed n = 42 OTUs with significant differential abundances in atopic AB and WH (Supplementary Figures 3C,D and Supplementary Table 2). The filter applied to the differential abundance analysis and the rationale of the filter was to increase statistical power by pruning the rare taxa whose prevalence was too low in the dataset for any test to be significant. Thus, the 12% prevalence threshold correspond to a taxa being present in at least eight samples. First and foremost, below that prevalence threshold, abundance data are scarce and the statistical power to detect meaningful differences between groups is small, so that discoveries made on those taxa will disproportionately be false positives. Additionally, and since we correct for multiple testing issues, including those taxa in the differential analyses increases the total number of tests performed and thus decreases the statistical power for more prevalent taxa. Finally, taxa with very low prevalence are unlikely to correspond to biologically relevant effects. This method as filtering prior to differential analysis is quite common in the field to increase the statistical power.
Moraxella Catarrhalis may Be Responsible for Epithelial Damage in Human Primary NAEPC Culture
In our analyses, M. catarrhalis were commonly more present in the nasal cavity of WH compared to AB and HC. Considering the literature of the potential clinical relevance of M. catarrhalis, we aimed to analyze its influence on the epithelial integrity and proteome level by performing an in vitro exposure experiment with subject-derived M. catarrhalis strains on NAEsp. Here, we investigated histological, cytokine, and proteome analyses after exposure. We infected NAEsp from HC donors with isolated subject-derived M. catarrhalis strains, which were previously cultured from AB and WH groups. Interestingly, 24 h post-infection, we observed a disruption of the epithelial integrity (Figure 3A). Moreover, epithelial damage factors (i.e., lactate dehydrogenase) and the concentration of IFN-γ, TNF-α, and IL-17A were significantly released in M. catarrhalis exposure experiments compared to wild-type (untreated, UT) NAEsp (Figures 3B,C). Furthermore, we performed cytokine analyses in plasma samples of the study cohort. Interestingly, the cytokine measurement provided significant differences between exacerbated AB and WH in comparison to healthy pediatric donors (Figure 3D). Additional exposure experiments with H. influenzae and S. aureus also showed an affection of the epithelial barrier for both bacterial strains, and a cytokine release in supernatants of S. aureus-related exposure experiments. H. influenzae was not significantly associated with cytokine release, although the infection was macroscopically observed by turbidity of the culture medium the day after infection and the cell integrity was also affected as observed in the M. catarrhalis and S. aureus exposure experiments (Supplementary Figure 4).
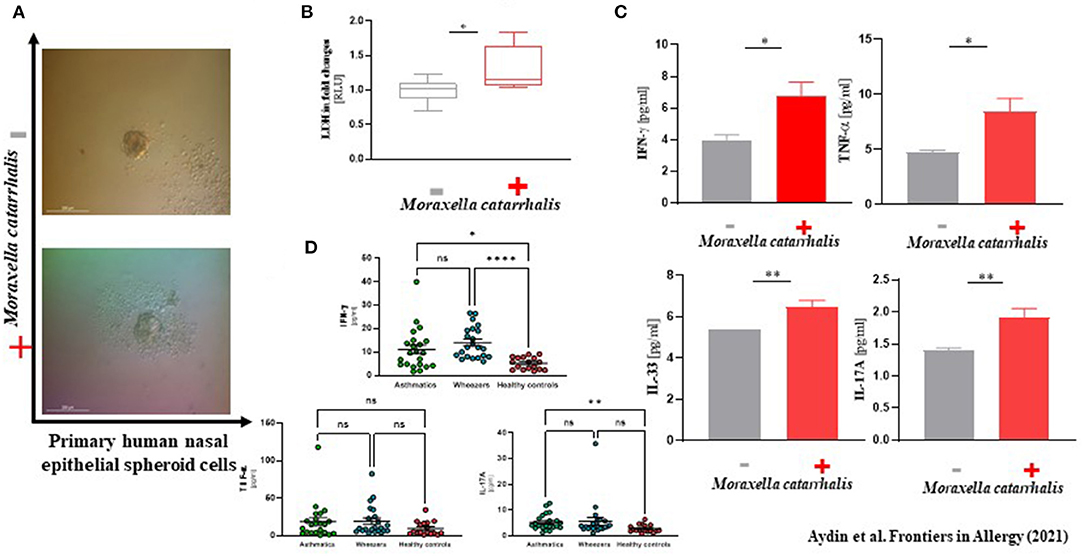
Figure 3. Phenotype-specific Moraxella catarrhalis infection could be associated with a disruption of epithelial integrity in vitro. (A) Primary human nasal epithelial cells were used for spheroid (NAEsp) cell culture technique (1 × 10³ cells per well). After circa 1 week, NAEsp reached a size of 200–300 nm and were used for infection experiments with M. catarrhalis strains derived from AB and WH in a concentration of 5 × 10⁵ cfu per NAEsp. After 24 h of infection, the epithelial barrier of the spheroids was microscopically impaired. (B) Lactate dehydrogenase (LDH), as a potential epithelial damage factor, was increased in supernatants of provoked and non-provoked NAEsp with M. catarrhalis (normalized values presented as fold changes). (C) The concentration of IL-33, IFN-γ, TNF-α, and IL-17A was significantly elevated in supernatants of the exposure group with M. catarrhalis (the non-provoked cells showed values under the detection and the measurable reference values were used for analyses). (D) Furthermore, we then analyzed IFN-γ, TNF-α, and IL-17A in plasma samples of the study population using LEGENDplex™ bead assay. Concordantly, our pediatric exacerbation study cohort revealed a significant difference between exacerbated AB, WH, and HC, specifically for IFN-γ and IL-17A (AB, Asthmatics, n = 22; WH, Wheezers, n = 22; HC, Healthy controls, n = 17). *p < 0.05, **p < 0.01, ***p < 0.001, ****p < 0.0001.
tRNA-cytidine-2-sulfurtransferase may Be an Interesting Pathogenesis Marker for WH With Acute Exacerbation
Next, to describe the role of M. catarrhalis during exacerbation in AB and WH, we were then interested to analyze the proteome profile of M. catarrhalis strains derived from the entire cohort. Subsequently, proteome analyses of the spheroid cell cultures infected with M. catarrhalis revealed discrete differences in the proteome profiles, particularly for samples of AB and WH groups compared to non-infected spheroid cell cultures. In detail, we observed disease-relevant proteome changes in M. catarrhalis exposure experiments (including human and M. catarrhalis-specific). The UT group had high abundance levels for n = 64 proteins except for the proteins K1C18_Human, A0A39M9V6_MORCAm, and LRP2_Human. Interestingly, AB, WH, and UT group had more common abundance levels for ALBU_Human, K1C19_Human, A0A198UUX1_MORCA, A0A198XHJ9_MORCA, A0A349RU5_MORC, and TRFE_Human. Wheezer-specific high abundance levels were furthermore observed for different M. catarrhalis specific protein levels, and these levels were reduced for AB, except for D5VAD5_MORCA and Q3YKS2_MORCA. The UT group had high protein abundance levels except for A0A3A9M9V6_MORCA and O85056_MORCA (Figures 4A,B). Asthmatics, WH, and UT group had high abundance levels for these three proteins, but in detail, AB and WH had different abundances in few proteins (Figure 4C). Strikingly, the detailed data inspection then showed that tRNA-cytidine-2-sulfurtransferase (TtcA), tr|A0A198WQA0|A0A198WQA0_MORCA was significantly abundant only in the WH compared to the AB group (Figure 4D).
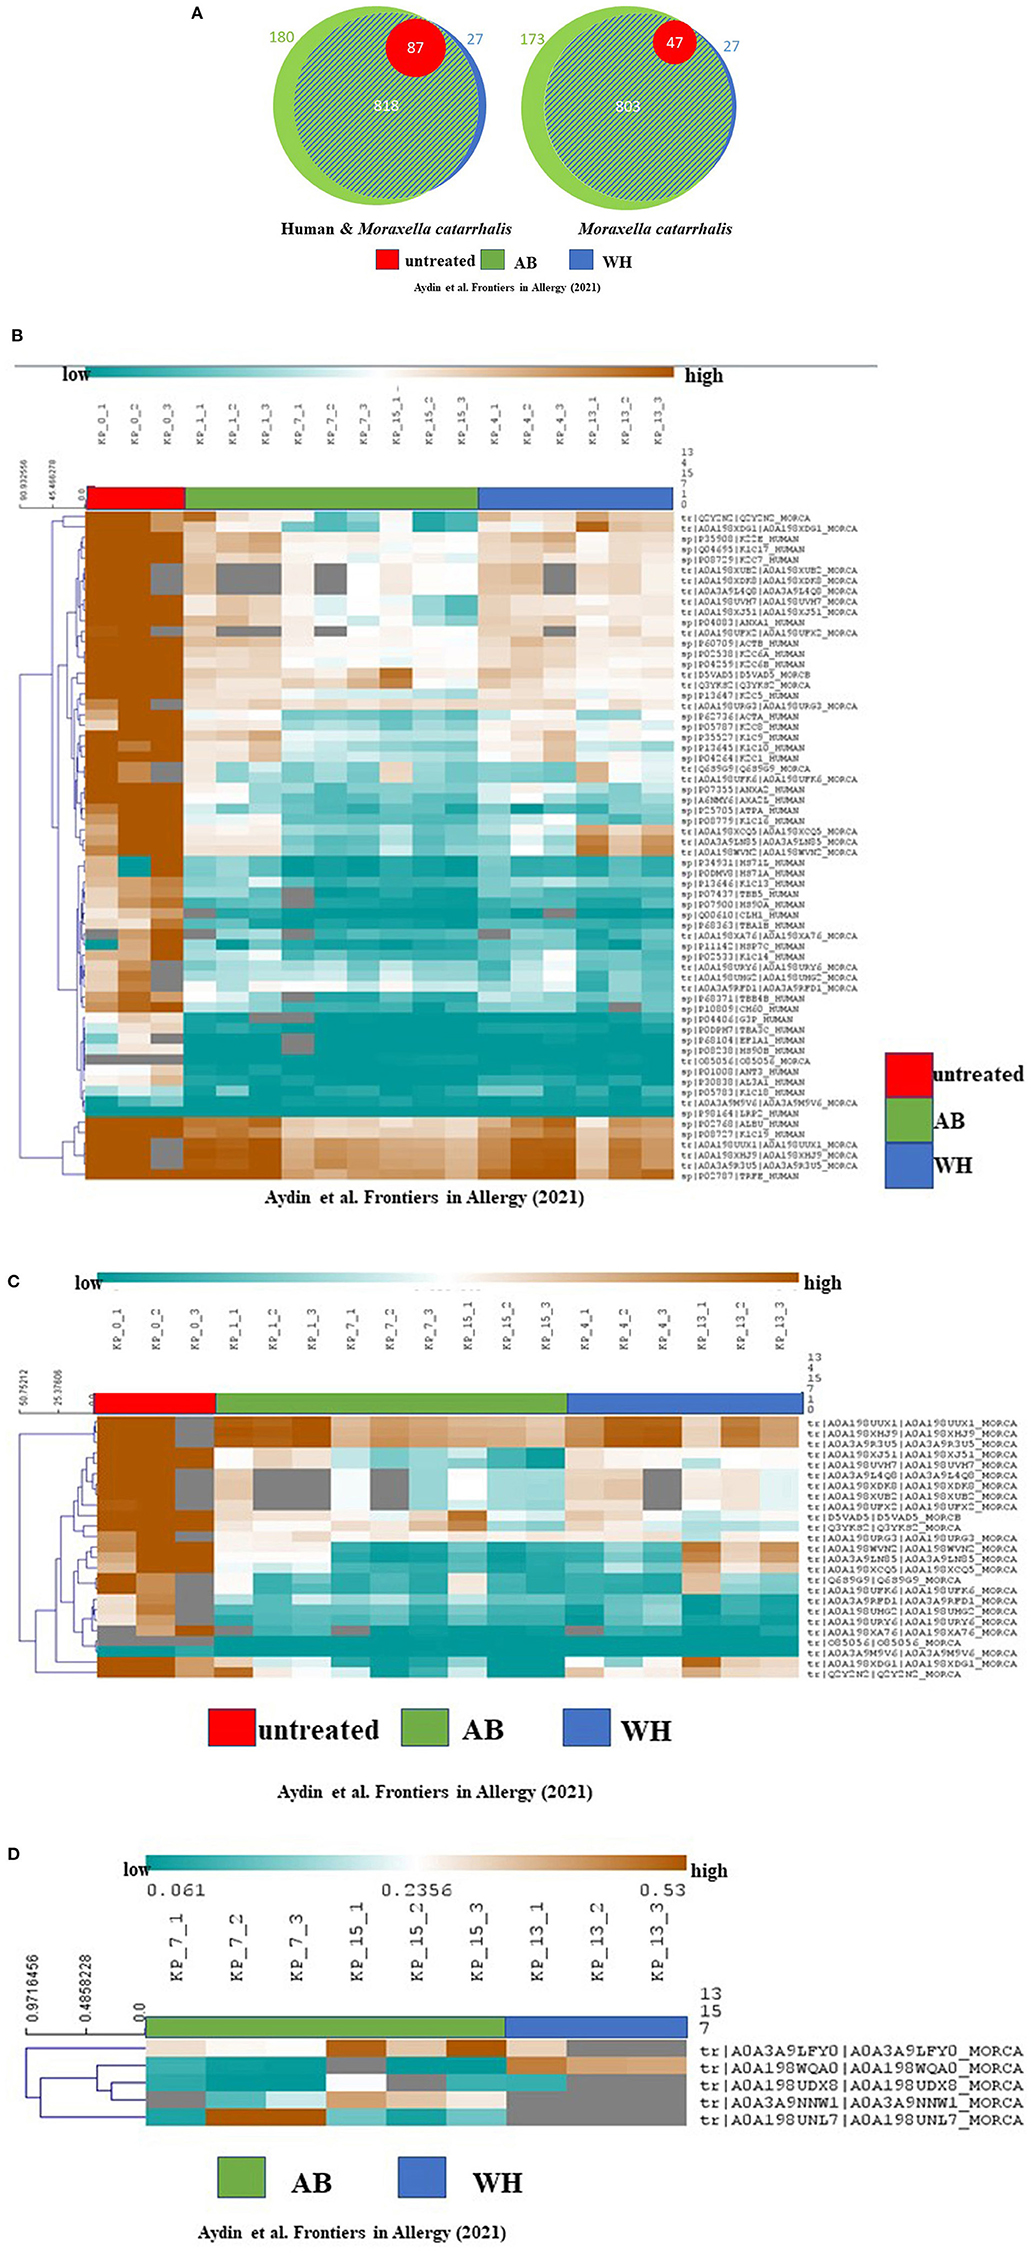
Figure 4. Proteome analyses revealed cohort-specific differences and TtcA was associated with WH. (A) Proteome analyses of the cultures showed the following quantified proteins (left: human and M. catarrhalis; right: M. catarrhalis) highlighted in a Venn diagram, depicted in unteated (UT) (red), AB (green) and WH (blue). The size of the circular area is proportional to the number of quantified proteins in each group. Healthy controls had less protein differences compared to WH and AB. A distinct proportion in the AB group had cohort-specific proteome abundance levels. (B) Proteome analyses of the cultures including human and M. catarrhalis-associated proteins presented significant abundance levels in AB, WH, and UT groups. The abundance levels are colored ranging from blue (low abundance) to orange (high abundance). Gray color represents missing information for each protein in the group. Interestingly, AB, WH, and UT had common high abundance levels for ALBU_Human, K1C19_Human, A0A198UUX1_MORCA, A0A198XHJ9_MORCA, A0A349RU5_MORC, and TRFE_Human. WH-specific high abundance levels were furthermore observed for different M. catarrhalis specific protein levels and this level was found to be reduced in AB, except for D5VAD5_MORCA and Q3YKS2_MORCA. (C) Spearman rank correlation was performed for clustering samples. A separate analysis for solely M. catarrhalis-specific proteins revealed significant correlations between AB, WH, and UT, and in toto n = 25 proteins did cluster with each group. The abundance levels range from blue (low abundance) to orange (high abundance). In detail, AB and WH had different abundances in few protein levels. (D) A differentiated analysis for the WH group presented a group-specific abundance protein level in comparison to the AB group; in particular, tRNA-cytidine-2-sulfurtransferase (TtcA), tr|A0A198WQA0|A0A198WQA0_MORCA, was highly significantly abundant only in the WH group (AB, Asthmatics; WH, Wheezers; HC, Healthy controls).
Discussion
The rhinobiome of children with exacerbated asthma and wheeze must be extensively studied. With this study, we aimed to characterize the nasal microbiota of children and adolescents with wheeze and asthma suffering from acute wheezing or asthmatic episode. In summary, we observed a variety of microbiome and proteome clusters, particularly in WH-derived samples.
The microbiome of the lung develops through micro-aspiration and inhalation of pathogens from the environment, the upper respiratory and the gastrointestinal tract, as well as through the reaction of the mucosa to these pathogens (15). It has already been shown that the microbiome is niche-specifically organized in complex communities and is strongly adapted to its environment (20). In our study population, M. catarrhalis as well as S. aureus and H. influenzae were predominantly colonized in the nasal cavity of WH. To determine whether these bacteria may be related to exacerbation, we analyzed the effects of these bacteria on healthy NAEsp cultures. Here, we observed cytokine release in cultures exposed to S. aureus and M. catarrhalis. Recently, McCauley and colleagues published an article on the microbiome of exacerbated pediatric asthmatics. They observed an increased colonization of Moraxella, Haemophilus, Staphylococcus, etc. in their cohort. To correlate their descriptive data, they analyzed the functionality of bacterial strains and observed increased cytokine levels in A549 lung cancer cells (34). In detail, M. catarrhalis significantly caused more epithelial damage and the greater release of cytokines when compared to other bacterial strains (34). Deducing ideas from these descriptive approaches, we then used M. catarrhalis strains to investigate proteome analyses. In detail, the proteome level of the exposure experiment with M. catarrhalis showed a difference between protein expression profiles in diseased groups. We observed that the whole proteome was phenotype-specific and that WH provided a somewhat different proteome composition during exacerbation in vitro compared to AB. In detail, TtcA, as a regulator of the post-transcriptional thiolation of the cytosine 32 in tRNA (35), was significantly abundant in WH-derived M. catarrhalis cultures in comparison to samples of exacerbated AB and HC groups. Moreover, the sulfate adenyltransferase subunit 1 and D-3-phosphoglycerate dehydrogenase were also abundant in our entire cohort. These proteins were specific to M. catarrhalis, and which influences on the human signaling pathway regarding asthma pathogenesis they have, are not fully understood. Thus, further analyses will soon give further insights into the relevance of these proteins and whether they have an influence on the pathogenesis of asthma exacerbation.
Mansbach et al. (36) have investigated the role of airway microbiota in their American multicenter study and analyzed the samples of infants after bronchiolitis over several time points. They observed that patients with bronchiolitis colonized with Moraxella or Streptococcus species were at increased risk of developing frequent wheezing episodes (36). Dumas et al. (37) showed a similar observation where infants with severe bronchiolitis and a colonization with Haemophilus and Moraxella showed later recurrent wheezing episodes in this group.
Several studies revealed that the microbiome may directly influence the regulatory units of the innate immune system and thus influence the pathophysiology of asthma. Additionally, there may also be phenotypic and regional differences in adult AB. Fazlollahi et al. (24) highlighted that at least in adults, ethnicity-dependent nasal microbiome differences seem to exist. They analyzed the 16 S-ribosomal nasal microbiome of adults with exacerbated and non-exacerbated AB in New York, U.S.A., and the nasal mucosa of adult AB was colonized with Bacteroidetes and Proteobacteria. Prevotella buccalis, Dialister invisus, Gardnerella vaginalis, and Alkanindiges hongkongensis were relatively more abundant as compared to the current asthma activity level (24). In view of individual variability, the differences might arise from the characteristics of the patients, the region where they grew up, and the age (24).
Many efforts have been focused on analyzing the link between microbiome and disease pathogenesis. S. aureus is one of the most well-studied bacteria in which this link is sufficiently described, as ~30% of all people worldwide are colonized with S. aureus (38, 39). In a recent publication by Tsilochristou et al. (40), a S. aureus colonization was strikingly connected to food allergies as well as to atopic eczema. In our cohort, the WH group was also more frequently colonized with this bacterium, perhaps indicating an increased likelihood of exacerbation.
Rosas-Salazar et al. (41) suggested that 40% of children with respiratory syncytial virus (RSV) infection in the first years of life may develop a wheeze and asthma in later years of age. Children with RSV in whom Lactobacillus could be detected in the NP/OP developed significantly fewer wheezing symptoms later in life. Thus, the occurrence of Lactobacillus in RSV-infected patients may reduce the risk of later wheezing (41). A meta-analysis of cesarean section deliveries and the risk of asthma showed that children who were delivered by cesarean section have a 20% higher risk of developing asthma compared to spontaneous vaginal deliveries (7, 42).
In our study population, we observed that the colonization of H. influenzae and M. catarrhalis was increased mainly in the preschool WH cohort. None of our cohorts received a long-term antibiotic treatment. Therefore, we assume that there is no bias that may influence the colonization of the nasal cavity. However, the question arises whether the use of several antibiotics in the history has a significant impact on the colonization in the nasal cavity. This information was not collected during study enrollment and must be taken into consideration during the interpretation of the data. Moreover, the effect of viral infection on disease pathogenesis and the microbiome composition have been extensively analyzed in the literature (43, 44). Moreover, there is also an interaction between viral infection and the microbial composition in the airways and an infection with RSV may be correlated with the colonization of H. influenzae or Streptococcus species (15). It should be considered that multifactorial conditions can lead to an exacerbation. In our study analysis, we did not perform respiratory viral panel testing yet, so this information is missing for this manuscript. Another limitation is that children who grew up in different milieus and have already undergone many antibiotic therapies may have a different microbiome profile than children of the same age or older/younger children as described previously in some studies. The same living and housing conditions, previous therapies, contact with animals, birth modes, etc. must be considered when analyzing the microbiome of patients. A substratification into the above factors to achieve a 1 to 1 matching makes the possibility of practical implementation difficult. Considering this fact, a potential age-based bias is not fully excluded. Nevertheless, we believe that it was important to include the wheezer study group into the analyses, as a defined percentage of this heterogeneous group will show a progress to asthma. Thus, this side information is critically important during interpretation of this dataset, which is necessary for an assessment of biodiversity. Longitudinal analyses of patients of whether bacterial colonization changes or differs between two study visits (exacerbation and phase without clinical symptoms) should be analyzed.
In summary, our complex dataset adds important insights into the plasticity of the nasal microbiome during exacerbation of pediatric chronic bronchitis and AB. Despite few limitations, the power of our entire cohort is important. Further ongoing studies and the inclusion of follow-up samples over different time frames would be interesting to address the role of the nasal microbiome in the pathogenesis of wheeze and asthma in order to characterize their impact on disease development.
Data Availability Statement
The datasets presented in this study can be found in online repositories. The names of the repository/repositories and accession number(s) can be found below. The mass spectrometry proteomics data have been deposited to the ProteomeXchange Consortium via the PRIDE (45) partner repository with the dataset identifier PXD024694. Project Name: The rhinobiome of exacerbated preschool wheezers and asthmatics: insights from a German pediatric exacerbation network, Project accession: PXD024694. Moreover, the metagenomics data set are uploaded and have the following project number: BioProject ID: PRJNA714100.
Ethics Statement
Ethical approval and its later amendments were obtained by the Ethics Committees of the Witten/Herdecke University (158/2017) and (Ärztekammer Nordrhein, NR 2019312), Germany, and the study was separately registered at the German Clinical Trials Register (DRKS) (registration number DRKS00015738). Written informed consent to participate in this study was provided by the subjects or/and the participants' legal guardian. This article does not contain any studies with animals performed by any of the authors.
Author Contributions
MA, CoW, SM, DB, JP, BG, and SW had full access to all of the data in the study and take responsibility for the integrity of the data and the accuracy of the data analysis. MA, CoW, JP, BG, and SW: concept and design. MA, CoW, OR, MM, YJ, SM, DB, A-KB, TH, MS, SL, JP, AM-B, BG, and SW: acquisition, analysis, or interpretation of data. MA, CoW, JP, BG, and SW: drafting of the manuscript. MA, CoW, ChW, OR, MM, SM, and DB: statistical analysis. MA and SW: obtained funding. SV: administrative, technical, or material support. MA, JP, BG, and SW: supervision. All authors: critical revision of the manuscript for important intellectual content.
Funding
This research received partial funding from the Helios Center for Research and Innovation (HRCI) via Helios Kliniken GmbH, Grant-ID: 04882 and from the internal grant program (Grant-ID: 2020-36) of the Faculty of Health at Witten/Herdecke University, Germany. The funding organizations had no role in the design and conduct of the study; collection, management, analysis, and interpretation of the data; preparation, review, or approval of the manuscript; and decision to submit the manuscript for publication.
Conflict of Interest
The authors declare that the research was conducted in the absence of any commercial or financial relationships that could be construed as a potential conflict of interest.
Acknowledgments
We very much appreciate our colleagues at the Microbiology Department of Institute of Medical Laboratory Diagnostics of the Helios University Hospital Wuppertal of Witten/Herdecke University, Germany, for their endless support. We thank Claudia Hirschfeld for assistance with the MS measurements and the support during spectral library building. We are grateful to the INRAE MIGALE bioinformatics (MIGALE, INRAE, 2020. Migale bioinformatics Facility, doi: 10.15454/1.5572390655343293E12) for providing statistical analyses, help, and computer resources. Finally, we would like to thank the children and parents who were motivated and willing to support the asthma and allergy science to search for a better understanding of asthma development and exacerbation. Without their incredible support, we could never have implemented our experimental ideas into practice.
Supplementary Material
The Supplementary Material for this article can be found online at: https://www.frontiersin.org/articles/10.3389/falgy.2021.667562/full#supplementary-material
Supplementary Figure 1. (A,B) The data presents the genus level taxonomy.
Supplementary Figure 2. The phylogenetic diversity. (A) The phylogenetic diversity contrasting pair with reads in HC, AB, and WH. (B) The atopic WH were significantly different from the atopic AB (p = 0.05), as well as the atopic vs. the non-atopic WH (p = 0.0198), and the atopic vs. non-atopic AB (p = 0.0198).
Supplementary Figure 3. After filtering the taxa, a differential abundance analysis was performed on the remaining taxa. (A,B) n = 24 significantly differential clusters were observed in AB, WH, and HC. (C,D) Further subclassifying the group into atopic and non-atopic level, n = 42 clusters could be calculated in atopic AB and WH (n = 50).
Supplementary Figure 4. The effect of Staphylococcus aureus and Haemophilus influenzae on nasal epithelial spheroid cultures. After 24 h of infection, a significant release of the IL-33, TNF-α, and IL-17A concentrations in the supernatants was observed particularly in exposure experiments with S. aureus and for IL-33 in H. influenzae exposure experiments. #The non-provoked cells showed values under the detection and the measurable reference values were used for analyses.
Supplementary Figure 5. The beta diversity of diseased patients showed differential variances between atopy vs. non-atopy subjects. (A,B) For the β-diversity, we analyzed different variants of between-sample diversity, Jaccard for presence/absence-based with no phylogenetic information, Bray-Curtis for abundance-based with no phylogenetic information, Unifrac for presence/absence-based with phylogenetic information and wUnifrac for abundance-based with phylogenetic information. A permdisp test, showed an interesting homogeneity of WH in comparison to AB or HC subjects. In addition, using 2D space Multi-Dimensional Scaling, WH were highly homogeneous (AB vs. WH p = 0.00089; WH vs. HC p = 0.031; AB vs. HC p = 0.768). (AB, Asthmatics; WH, Wheezers; HC, Healthy controls).
Supplementary Table 1. Differential abundant taxa and description of significant clusters of the AB, the WH, and the HC.
Supplementary Table 2. Differential abundant taxa and description of significant clusters of the atopic AB, and the WH, in comparison to the HC.
Abbreviations
AB, Asthmatics; DRKS, Deutsches Register für Klinische Studien (German Clinical Trials Register); HC, Healthy controls; IL, Interleukin; LDH, Lactate dehydrogenase; MALDI-TOF-MS, Matrix-assisted laser desorption/ionization time-of-flight mass spectrometry; MDS, Multi-Dimensional Scaling; NAEsp, Human nasal epithelial spheroids; NGS, Next-generation sequencing; NP, Nasopharynx; WHO, World Health Organization; OP, Oropharynx; OTU, Operational taxonomic unit; WH, Wheezers.
References
1. Lemanske RF Jr, Busse WW. 6. Asthma. J Allergy Clin Immunol. (2003) 111:S502–19. doi: 10.1067/mai.2003.94
2. Robinson D, Humbert M, Buhl R, Cruz AA, Inoue H, Korom S, et al. Revisiting Type 2-high and Type 2-low airway inflammation in asthma: current knowledge and therapeutic implications. Clin Exp Allergy. (2017) 47:161–75. doi: 10.1111/cea.12880
3. Wright AL. Epidemiology of asthma and recurrent wheeze in childhood. Clin Rev Allergy Immunol. (2002) 22:33–44. doi: 10.1007/s12016-002-0004-z
4. Burney P, Amaral AFS. Air pollution and chronic airway disease: is the evidence always clear? Lancet. (2019) 394:2198–200. doi: 10.1016/S0140-6736(19)32537-1
5. Guarnieri M, Balmes JR. Outdoor air pollution and asthma. Lancet. (2014) 383:1581–92. doi: 10.1016/S0140-6736(14)60617-6
6. Sandall J, Tribe RM, Avery L, Mola G, Visser GH, Homer CS, et al. Short-term and long-term effects of caesarean section on the health of women and children. Lancet. (2018) 392:1349–57. doi: 10.1016/S0140-6736(18)31930-5
7. Thavagnanam S, Fleming J, Bromley A, Shields MD, Cardwell CR. A meta-analysis of the association between Caesarean section and childhood asthma. Clin Exp Allergy. (2008) 38:629–33. doi: 10.1111/j.1365-2222.2007.02780.x
8. Dickson RP, Martinez FJ, Huffnagle GB. The role of the microbiome in exacerbations of chronic lung diseases. Lancet. (2014) 384:691–702. doi: 10.1016/S0140-6736(14)61136-3
9. Sullivan A, Hunt E, MacSharry J, Murphy DM. 'The microbiome and the pathophysiology of asthma'. Respir Res. (2016) 17:163. doi: 10.1186/s12931-016-0479-4
10. Biesbroek G, Tsivtsivadze E, Sanders EA, Montijn R, Veenhoven RH, Keijser BJ, et al. Early respiratory microbiota composition determines bacterial succession patterns and respiratory health in children. Am J Respir Crit Care Med. (2014) 190:1283–92. doi: 10.1164/rccm.201407-1240OC
11. Grice EA, Segre JA. The skin microbiome. Nat Rev Microbiol. (2011) 9:244–53. doi: 10.1038/nrmicro2537
12. Mendling W. Vaginal microbiota. Adv Exp Med Biol. (2016) 902:83–93. doi: 10.1007/978-3-319-31248-4_6
13. Mueller NT, Bakacs E, Combellick J, Grigoryan Z, Dominguez-Bello MG. The infant microbiome development: mom matters. Trends Mol Med. (2015) 21:109–17. doi: 10.1016/j.molmed.2014.12.002
14. Blaser MJ. Antibiotic use and its consequences for the normal microbiome. Science. (2016) 352:544–5. doi: 10.1126/science.aad9358
15. Teo SM, Mok D, Pham K, Kusel M, Serralha M, Troy N, et al. The infant nasopharyngeal microbiome impacts severity of lower respiratory infection and risk of asthma development. Cell Host Microbe. (2015) 17:704–15. doi: 10.1016/j.chom.2015.03.008
16. Bisgaard H, Hermansen MN, Buchvald F, Loland L, Halkjaer LB, Bonnelykke K, et al. Childhood asthma after bacterial colonization of the airway in neonates. N Engl J Med. (2007) 357:1487–95. doi: 10.1056/NEJMoa052632
17. Chung KF. Airway microbial dysbiosis in asthmatic patients: a target for prevention and treatment? J Allergy Clin Immunol. (2017) 139:1071–81. doi: 10.1016/j.jaci.2017.02.004
18. Holt PG. The mechanism or mechanisms driving atopic asthma initiation: the infant respiratory microbiome moves to center stage. J Allergy Clin Immunol. (2015) 136:15–22. doi: 10.1016/j.jaci.2015.05.011
19. Castro-Nallar E, Shen Y, Freishtat RJ, Perez-Losada M, Manimaran S, Liu G, et al. Integrating microbial and host transcriptomics to characterize asthma-associated microbial communities. BMC Med Genomics. (2015) 8:50. doi: 10.1186/s12920-015-0121-1
20. Huang YJ, Marsland BJ, Bunyavanich S, O'Mahony L, Leung DY, Muraro A, et al. The microbiome in allergic disease: current understanding and future opportunities-2017 PRACTALL document of the American Academy of Allergy, Asthma & Immunology and the European Academy of Allergy and Clinical Immunology. J Allergy Clin Immunol. (2017) 139:1099–110. doi: 10.1016/j.jaci.2017.02.007
21. Kirjavainen PV, Karvonen AM, Adams RI, Taubel M, Roponen M, Tuoresmaki P, et al. Farm-like indoor microbiota in non-farm homes protects children from asthma development. Nat Med. (2019) 25:1089–95. doi: 10.1038/s41591-019-0469-4
22. Aydin M, Naumova EA, Lutz S, Meyer-Bahlburg A, Arnold WH, Kreppel F, et al. Do current asthma-preventive measures appropriately face the World Health Organization's concerns: a study presentation of a new clinical, prospective, multicentric pediatric asthma exacerbation cohort in Germany. Front Pediatr. (2020) 8:574462. doi: 10.3389/fped.2020.574462
23. Aydin M, Naumova EA, Paulsen F, Zhang W, Gopon F, Theis C, et al. House dust mite exposure causes increased susceptibility of nasal epithelial cells to adenovirus infection. Viruses. (2020) 12:1151. doi: 10.3390/v12101151
24. Fazlollahi M, Lee TD, Andrade J, Oguntuyo K, Chun Y, Grishina G, et al. The nasal microbiome in asthma. J Allergy Clin Immunol. (2018) 142:834–43.e832. doi: 10.1016/j.jaci.2018.02.020
25. Klindworth A, Pruesse E, Schweer T, Peplies J, Quast C, Horn M, et al. Evaluation of general 16S ribosomal RNA gene PCR primers for classical and next-generation sequencing-based diversity studies. Nucleic Acids Res. (2013) 41:e1. doi: 10.1093/nar/gks808
26. Aydin M, Naumova EA, Bellm A, Behrendt AK, Giachero F, Bahlmann N, et al. From submerged cultures to 3D cell culture models: evolution of nasal epithelial cells in asthma research and virus infection. Viruses. (2021) 13:387. doi: 10.3390/v13030387
27. Ewels P, Magnusson M, Lundin S, Kaller M. MultiQC: summarize analysis results for multiple tools and samples in a single report. Bioinformatics. (2016) 32:3047–8. doi: 10.1093/bioinformatics/btw354
28. Zhang J, Kobert K, Flouri T, Stamatakis A. PEAR: a fast and accurate Illumina Paired-End reAd mergeR. Bioinformatics. (2014) 30:614–20. doi: 10.1093/bioinformatics/btt593
29. Mahe F, Rognes T, Quince C, de Vargas C, Dunthorn M. Swarm v2: highly-scalable and high-resolution amplicon clustering. PeerJ. (2015) 3:e1420. doi: 10.7717/peerj.1420
30. Rognes T, Flouri T, Nichols B, Quince C, Mahe F. VSEARCH: a versatile open source tool for metagenomics. PeerJ. (2016) 4:e2584. doi: 10.7717/peerj.2584
31. Quast C, Pruesse E, Yilmaz P, Gerken J, Schweer T, Yarza P, et al. The SILVA ribosomal RNA gene database project: improved data processing and web-based tools. Nucleic Acids Res. (2013) 41:D590–6. doi: 10.1093/nar/gks1219
32. Price MN, Dehal PS, Arkin AP. FastTree 2–approximately maximum-likelihood trees for large alignments. PLoS One. (2010) 5:e9490. doi: 10.1371/journal.pone.0009490
33. McMurdie PJ, Holmes S. phyloseq: an R package for reproducible interactive analysis and graphics of microbiome census data. PLoS One. (2013) 8:e61217. doi: 10.1371/journal.pone.0061217
34. McCauley K, Durack J, Valladares R, Fadrosh DW, Lin DL, Calatroni A, et al. Distinct nasal airway bacterial microbiotas differentially relate to exacerbation in pediatric patients with asthma. J Allergy Clin Immunol. (2019) 144:1187–97. doi: 10.1016/j.jaci.2019.05.035
35. Bouvier D, Labessan N, Clemancey M, Latour JM, Ravanat JL, Fontecave M, et al. TtcA a new tRNA-thioltransferase with an Fe-S cluster. Nucleic Acids Res. (2014) 42:7960–70. doi: 10.1093/nar/gku508
36. Mansbach JM, Luna PN, Shaw CA, Hasegawa K, Petrosino JF, Piedra PA, et al. Increased Moraxella and Streptococcus species abundance after severe bronchiolitis is associated with recurrent wheezing. J Allergy Clin Immunol. (2020) 145:518–27.e518. doi: 10.1016/j.jaci.2019.10.034
37. Dumas O, Hasegawa K, Mansbach JM, Sullivan AF, Piedra PA, Camargo CA Jr. Severe bronchiolitis profiles and risk of recurrent wheeze by age 3 years. J Allergy Clin Immunol. (2019) 143:1371–9.e1377. doi: 10.1016/j.jaci.2018.08.043
38. von Eiff C, Becker K, Machka K, Stammer H, Peters G. Nasal carriage as a source of Staphylococcus aureus bacteremia. Study Group. N Engl J Med. (2001) 344:11–6. doi: 10.1056/NEJM200101043440102
39. Wertheim HF, Melles DC, Vos MC, van Leeuwen W, van Belkum A, Verbrugh HA, et al. The role of nasal carriage in Staphylococcus aureus infections. Lancet Infect Dis. (2005) 5:751–62. doi: 10.1016/S1473-3099(05)70295-4
40. Tsilochristou O, du Toit G, Sayre PH, Roberts G, Lawson K, Sever ML, et al. Association of Staphylococcus aureus colonization with food allergy occurs independently of eczema severity. J Allergy Clin Immunol. (2019) 144:494–503. doi: 10.1016/j.jaci.2019.04.025
41. Rosas-Salazar C, Shilts MH, Tovchigrechko A, Schobel S, Chappell JD, Larkin EK, et al. Nasopharyngeal Lactobacillus is associated with a reduced risk of childhood wheezing illnesses following acute respiratory syncytial virus infection in infancy. J Allergy Clin Immunol. (2018) 142:1447–56.e1449. doi: 10.1016/j.jaci.2017.10.049
42. Bosch A, Levin E, van Houten MA, Hasrat R, Kalkman G, Biesbroek G, et al. Development of upper respiratory tract microbiota in infancy is affected by mode of delivery. EBioMedicine. (2016) 9:336–45. doi: 10.1016/j.ebiom.2016.05.031
43. Li N, Ma WT, Pang M, Fan QL, Hua JL. The commensal microbiota and viral infection: a comprehensive review. Front Immunol. (2019) 10:1551. doi: 10.3389/fimmu.2019.01551
44. Lynch JP, Sikder MA, Curren BF, Werder RB, Simpson J, Cuiv PO, et al. The influence of the microbiome on early-life severe viral lower respiratory infections and asthma-food for thought? Front Immunol. (2017) 8:156. doi: 10.3389/fimmu.2017.00156
Keywords: nasal microbiome, proteomics, metagenomics, bioinformatics, bacteria, Moraxella catarrhalis, asthma, exacerbation
Citation: Aydin M, Weisser C, Rué O, Mariadassou M, Maaß S, Behrendt A-K, Jaszczyszyn Y, Heilker T, Spaeth M, Vogel S, Lutz S, Ahmad-Nejad P, Graf V, Bellm A, Weisser C, Naumova EA, Arnold WH, Ehrhardt A, Meyer-Bahlburg A, Becher D, Postberg J, Ghebremedhin B and Wirth S (2021) The Rhinobiome of Exacerbated Wheezers and Asthmatics: Insights From a German Pediatric Exacerbation Network. Front. Allergy 2:667562. doi: 10.3389/falgy.2021.667562
Received: 13 February 2021; Accepted: 23 March 2021;
Published: 31 May 2021.
Edited by:
Sun Ying, Capital Medical University, ChinaCopyright © 2021 Aydin, Weisser, Rué, Mariadassou, Maaß, Behrendt, Jaszczyszyn, Heilker, Spaeth, Vogel, Lutz, Ahmad-Nejad, Graf, Bellm, Weisser, Naumova, Arnold, Ehrhardt, Meyer-Bahlburg, Becher, Postberg, Ghebremedhin and Wirth. This is an open-access article distributed under the terms of the Creative Commons Attribution License (CC BY). The use, distribution or reproduction in other forums is permitted, provided the original author(s) and the copyright owner(s) are credited and that the original publication in this journal is cited, in accordance with accepted academic practice. No use, distribution or reproduction is permitted which does not comply with these terms.
*Correspondence: Malik Aydin, malik.aydin@uni-wh.de
†These authors have contributed equally to this work and share senior authorship