Dimensions of the Suckling Pig
 Benjamin C. Smith
 Brett C. Ramirez
- Department of Agricultural and Biosystems Engineering, Iowa State University, Ames, IA, United States
The rising prewean mortality rates in swine production are a great economic and production burden to the swine industry. The thermal environment for a piglet is commonly adapted to the piglet's specific needs with a key factor of surface area impacting all modes of heat transfer. The current standard for pig dimensions was originally accepted in 1968 and has yet to be updated with clear data from piglets during lactation. The objective of this study was to collect and evaluate the dimensions of body weight, length, height and width of piglets during lactation. Eight litters from geriatric sows (commercial cross breds) were utilized in this study with data collected every day from birth to weaning (23–32 days of age). The evaluation of the dimensions with effects of litter size and sex showed that sex of the piglet does not have a significant impact on dimensions while litter size does. The piglets in this study were smaller than the standard at birth, likely attributed to changes in genetics and an increase in total born. The results of this study showed a slight difference in dimension at the heavier weights to a study with nursery pigs however there are differences in genetics. The data and equations presented in this study will be valuable for the design of creep areas and supplemental heat sources to accommodate the size of modern piglets during lactation.
Introduction
Dimensions of livestock and poultry are critical inputs to aid in designing modern housing structures and equipment. For growing pigs and sows, space requirements of pens or stalls can be derived from capturing pig dimensions and calculating projected area based on an assumed simplified geometry or direct measurement of static and dynamic space usage. Design of equipment such as feeders, drinker height, and weighing scales, need to utilize pig dimensions to ensure proper accommodation. Further, changes in pig conformation can have an impact on thermoregulation (Curtis, 1983). A reduced surface area to volume results in decreased heat dissipation to the environment. Piglets have a high surface area to volume ratio resulting in high heat loss and increase susceptibility to chilling. There is a continual need to maintain equations and tabulated information regarding pig dimensions to inform housing and equipment design.
During the pre-weaning period, creep areas for piglets are heated to improve piglet survivability. The size of creep areas is inconsistent and often simply determined by construction convenience. As the body weight, the number of piglets born per litter, and weaning age are dynamic and variable throughout the industry (Stalder, 2018), information allowing estimation of creep area based on piglet size could assist in evaluation and implementation of new creep area sizes. Supplemental heat is generally provided by a heat lamp suspended above a rubber mat or a heated mat. The effective heated area must be able to accommodate the litter or risk piglets be unable to access heat. While environmental factors can affect the space occupied by a litter (huddling, lying pattern, posture, etc.) of resting piglets, piglet dimension data can be used estimate the necessary effective heated area to accommodate modern litters or varying number and body weights.
Tables and allometric relations of pig dimensions and projected area of pigs are available, but is scarce for piglets. The earliest reference, ASABE (2011) D321.1, graphically depicts pig dimensions for weights ranging from 5 to 100 kg. Recently Leonard et al. (2020) and Mumm et al. (2019) documented the static and dynamic space usage of late-gestation sows. Condotta et al. (2018) quantified dimensions of growing pigs (4–20 weeks old; 5–227 kg) using machine vision to demonstrate modern pigs tend to be wider (15.1%) and shorter in height (−10.2%) and length (−4.9% on average) compared to ASABE (2011). Other studies have derived allometric relations relating growing pig resting area as a function of body weight (Boon, 1981; Ekkel et al., 2003; Pastorelli et al., 2006). During the pre-weaning period, Wheeler et al. (2008) studied the static space usage of piglets as influenced by radiant temperature and derived a relationship as a function of individual piglet weight to determine occupied area for a litter of 10 piglets. Zhang and Xin (2005) studied the area occupied of piglets on heated mats to estimate necessary mat size. These studies demonstrate that there is a lack of dimension data on pre-weaning piglets and the resting area of piglets is a critical component to estimate creep area and heated area size. Hence, the objectives of this study were to collect dimension data of height, length, and width of piglets and evaluate factors impacting the dimensions.
Materials and Methods
The animal use protocol for this study was approved by the Institutional Animal Care and Use Committee (IACUC #20-084).
Facility Description
The procedures and data collection were conducted in the Animal Thermal Environment Interaction Laboratory (ATEIL) at Iowa State University. See Smith (2021) for the specifics of the laboratory design, construction, and commissioning. Two rooms each contained four farrowing stalls (stalls A-D) with steel woven wire flooring elevated 0.46 m above the concrete floor. The outer dimensions of each farrowing stall were 2.1 by 1.8 m with a 0.61 m wide of sow space and 0.61 m wide creep area located on each side of the sow space. The sow stall was fabricated from stainless steel with a bow bar design. Each sow stall featured an ad libitum feeder with 6.8 kg of feed capacity and a water nipple in the feed trough.
Animal Husbandry Procedures
Eight late gestation sows (Landrace X Yorkshire, bred to Duroc boar; PIC genetics) were procured from a commercial producer from which the parity of sows available were limited to Geriatric sows (P6 and 7). These sows were available to be used for this study because the cooperating producer had elected to remove these sows from the herd due to old age only. Sows were randomly (random number generated Excel) assigned to the eight farrowing stalls and were moved to ATEIL at an average day 85 of gestation (range: day 82–90). A restricted diet, with the ration meeting or exceeding the minimum requirements for gestating sows (NRC, 2012), was fed at 2.3 kg per day for body condition score average to fat, and 3.2 kg for body condition score thin. Sows were body condition scored at receiving using a caliper (Knauer and Baitinger, 2015). Sows were allowed to farrow naturally, but were induced (2 mL dose dinoprost, Lutalyse), if not in labor on day 116 of gestation. Farrowing assistance was provided as needed and piglets were processed following industry standard procedures (PIC, 2015).
Split suckling was performed with litters with more piglets born live than functional teats within the first 24 h following birth. No cross fostering was performed. The subsequent day after farrowing, sows were fed three times a day at 08:00, 12:00, and 16:00 in increments of 3.6 kg if the sow had consumed at least half of the previous meal, as marked on the sow feeder, to achieve the maximum daily feed intake of 10.9 kg. The ration met or exceeded the minimum requirements for lactating sows (NRC, 2012). Each piglet was individually tagged at 24 h of age with a numbered tag in each ear. The farrowing interval was 10 days for all 8 L and weaning was performed when the youngest litter was 23 days old (range 23–32 days of age).
Data Collection
Piglet body weight (BW), length (L), height (H), and width (W) were collected at birth and then daily starting at 24 h post farrowing following sow feeding at 8:00. Length and height were measured by briefly restraining each pig, such that the pig was in a natural straight back posture, on a cart with a custom backboard that had marked rulers attached to it, a measuring bar was utilized for accurate readings of the rulers. Piglet width was measured using a caliper (±0.25 mm, 8 in.; Digital Outside Calipers, Igaging, San Clemente, CA, USA), and BW was measured using a hanging bucket scale (±0.10 kg, 300 kg capacity; W1478, Performance Tools, Tukwila, WA, USA). Depth (i.e., abdomen to top of spine) measurement was not measured as recent research has shown that this measurement does not differ from the width of the piglet at and below 20 kg based on the 95% confidence interval (Condotta et al., 2018).
Data and Statistical Analysis
Custom software (Python 3.7, Python Software Foundation, Wilmington, DE, USA) developed in an integrated development environment (Kluyver et al., 2016) was used to process and analyze the data. The BW of the piglets was averaged by litter starting at birth (considered day 0) through weaning (day 32–23). Averages were used to develop a growth curve by day of age by regressing a second order polynomial to the data. The root mean square error (RMSE) was calculated for the regression. An initial power regression was preformed using the SciPy curve fit package to the dataset (2,525 data points) for each of the independent variables (L, H, W) with BW as the dependent variable for prediction of the independent variables (Figure 1). Standardized residuals were calculated for each independent variable and outliers were removed if the standardized residual for any of the independent variables was greater than or equal to 3.0. A new power regression was refit to the dataset excluding outliers (2,460 data points) and the RMSE was calculated for each regression. Most of the outliers were piglets that were culled or died of natural causes within 48 h of the measurement. A confidence interval, 95%, was calculated for each dimension.
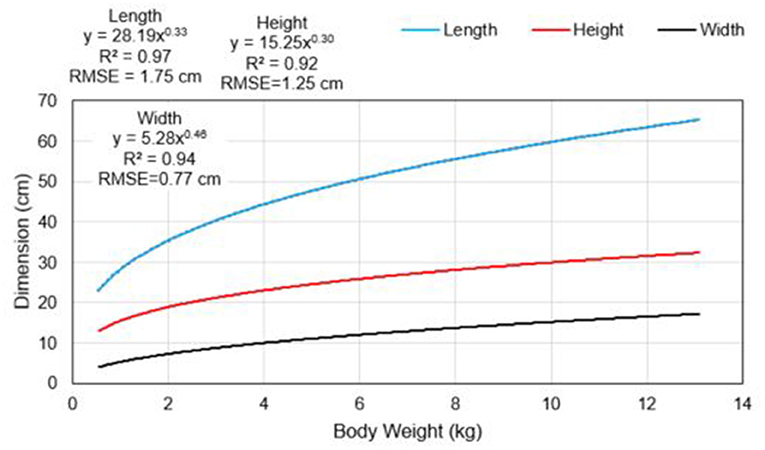
Figure 1. Dimension data (y axis) vs. body weight (x axis) from birth to weaning for all piglets in the study.
A statistical analysis of BW, L, H, and W, as the dependent variables, was completed using JMP 14.1 (SAS Inc, Cary, NC). A Standard Least Squares model was used, with the analysis ran by age of the litter. Independent variables (fixed effects) of number of piglets in the litter and sex of the piglet were included into the model (Equation 1). Sow parity group was not included as all sows in this study were geriatric. For the number of piglets 12 different values ranging from 6 piglets to 20 piglets were evaluated within the model.
Where,
Vi = variable value i (BW, L, H, W) for the given litter and piglet
μi = average for the variable i (BW, L, H, and W)
N = number of piglets in the litter effect
S = sex of the piglet effect.
Surface and Projected Area Analysis
Utilizing the upper and lower limits of the confidence interval of piglet dimensions, a sensitivity analysis for surface area and the surface area to BW ratio was performed. Surface area (SA; m2) was calculated by modeling the piglets as ideal cylinders, a typical method to heat transfer modeling, which excludes the ends of the cylinder and utilizes the width and length dimensions (Equation 2, Hoff et al., 1993; Condotta et al., 2018). The surface area to volume ratio was not analyzed in this study as no volume measurements were possible on live piglets.
Average dimension data were used to estimate the proportionality coefficient (C1) for the allometric relationship (C1 × BWC2) relating BW to projected area. The scaling exponent (C2) was assumed fixed at 0.67 (Petherick and Baxter, 1981). The projected area (rectangle) for an individual piglet was defined as lying recumbently (excluding legs) using the product of length and width dimensions (Petherick and Baxter, 1981). An allometric regression was performed using Matlab (R2017, The MathWorks, Inc., Natick, MA).
Results
Data were collected from 118 piglets at birth and 90 piglets at weaning for a total of 2,525 data points in the dataset. The average number of piglets born live per sow was 14.75 (range 9–20) with the average piglets weaned per sow at 11.25 (range 6–13). There was a ten-day age range between the 8 L in this study. The average BW at birth was 1.2 kg (SD = 0.4) and at weaning was 9.2 kg (SD =1.8). The results of the BW, L, H, and W measurements and regressions are presented in Figure 1 (BW) and Figure 2 (L, H, W) and Table 1. The prediction equations for the dimensions are presented in the figures for the respective variables. The results of the Standard Least Squares model indicated that the sex of the piglet had no impact on any of the dimensions at any age throughout lactation, P >0.05 for all days. The litter size effect was significant most days throughout lactation P < 0.05. There were a few notable days when mortalities occurred in multiple litters were the effect of litter size was not significant; however, the effect significance returned within the next couple of days. The extent of the litter size effect in the model offers no insight into the dimension and BW of piglets over the course of the lactation as only a small number of litters were consistently significant effects.
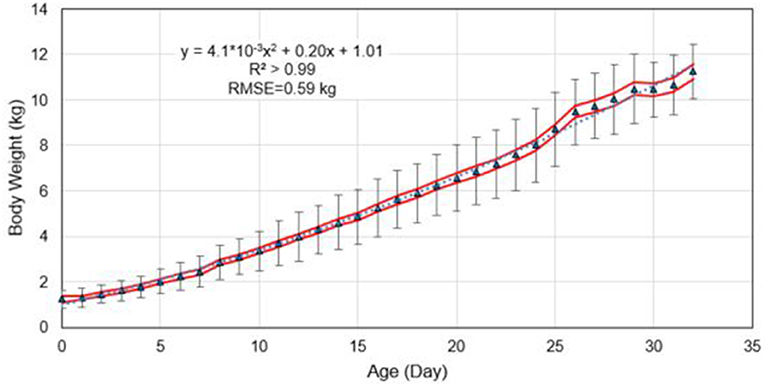
Figure 2. Litter average piglet body weight (y axis) vs. day of age (x axis). Error bars represent one standard deviation of the mean. Red lines represent the 95% CI of the mean. Blue dotted line represents the fitted line for the second order polynomial equation.
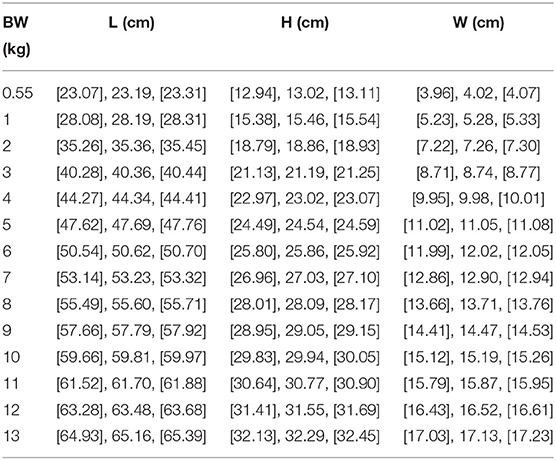
Table 1. Dimension mean and Confidence Intervals (95%) in [ ] of dimensions (cm) for based on the body weight (L, length; H, height; W, width).
The SA for the piglets in this study ranged from 467.87 cm2 (461.68–474.10) at 1 kg to 3,507.06 m2 (3,474.59–3,539.67) at 13 kg utilizing Equation (2) (Figure 3). The SA to BW ratio showed a decreasing trend as weight increases starting at 467 at 1 kg to 269 at 13 kg.
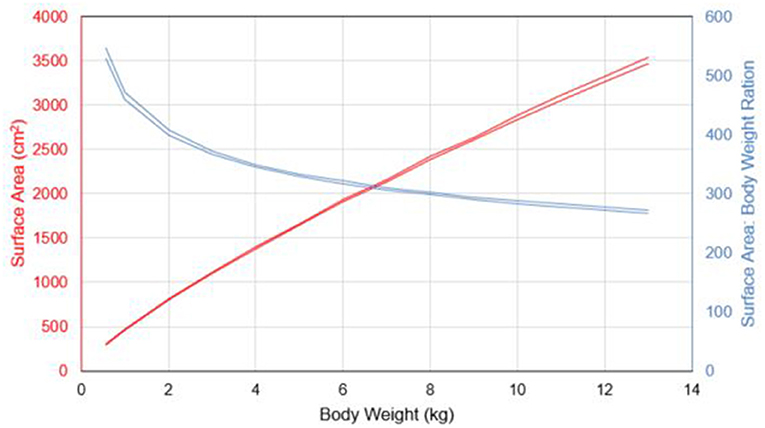
Figure 3. Sensitivity analysis (upper and lower 95% CI) of the dimensions used to calculate surface area of a piglet. Surface area (red lines) and the surface area: body weight ratio (blue lines).
The allometric regression yielded a proportionality coefficient of 0.019 (R2 = 0.988; RMSE = 0.004 m) with a fixed scaling exponent of 0.67.
Discussion
The BW curve generated (Figure 1) from this study follows typical growth curves for suckling pigs from this genetic background; however, this study had a lower birth weight, 19% difference, in comparison (Gomez, 2019). The increased variation in BW in the later days of lactation is possibly due to sow performance (feed intake, health, etc.). It would be reasonable to expect greater variation in the growth curve if young (P1 and P2) and prime (P3–P5) sows were represented in the study.
The overall shape and relationship of the dimension curves (L, H, W) are similar to those in older literature and recent studies (Figure 2; Table 1; Midwest Plan Service, 1983; ASABE, 2011; Condotta et al., 2018). Notably, this set of dimension data shows that at birth, piglets are smaller in all dimensions. It is unclear how data were collected at the lower weights in the ASABE standard, thus this decrease in dimensions could be attributed to multiple factors including genetic improvements and larger total born litters. In comparison, a recent study evaluating the dimensions of a pig across a range of genetic backgrounds from weaning to market weight reported dimensions at BWs of 5 kg and 10 kg with 150 replications at each weight. This study's pigs were slightly smaller for height (−0.24%, −6.34% difference) and width (−24.3%, −13.3% difference); however, length was longer (4.5%, 4.3% difference) at both BWs in comparison to the recent study. These differences could be due to the difference in feeding program (lactation vs. nursery), possible age differences, and genetics, as the recent study was representative of several crossbred combinations.
Similar to the results in Condotta et al. (2018), sex was found to not be a significant effect on piglet dimensions. The litter size effect is logical as the larger litters at birth had smaller dimensions on average. However, after 4 days post farrowing, a trend was noted that the litters of 11 piglets were growing at a slightly faster rate and thus, were physically larger [model effect size from Equation (1) for all dimensions > 1.10]. Sow health, and the ratio of piglets to functional teats were contributing factors that impacted the litter's growth. The smallest litter in the study was on average smaller (model effect size < −0.50) in all dimensions with six piglets due to health concerns; while litters of 13 piglets were slightly behind the litters of 11 due to functional teat restrictions with model effect size averaging 0.20.
Both SA and SA to BW ratio showed a small difference between upper and lower limits as estimated from the upper and lower 95% CI dimensions. The calculated SA showed an increasing difference as piglet BW increased, suggesting more variation in SA for heavier piglets. This is most likely attributed to differences in growth, access to colostrum, and environment experienced by the piglets later in lactation. As anticipated, the SA to BW ratio showed an exponential decay. The upper and lower extent of the SA to BW ratio remained relatively constant as piglet BW increased. However, due to the sensitivity of the SA to BW ratio on piglet thermoregulation, slight differences due to piglet size can have large impact. This implies that modeling of entire litters assuming uniform SA and SA to BW ratio may result in potentially inaccurate outcomes.
The proportionality coefficient of the allometric relationship used to estimate projected area of a recumbent lying piglet (0.55–13 kg) was less than those reported in literature. For individual piglets, Petherick and Baxter (1981) found a proportionality coefficient of 0.025 (2–90 kg) and Zhang and Xin (2005) reported a proportionality coefficient of 0.032 with a scaling exponent of 0.53. Differences in pig genetics and measurement technique may have influenced projected areas. For litters, Boon (1981) reported a proportionality coefficient of 0.3 for a 12-piglet litter (0.025 for an individual piglet) and Wheeler et al. (2008) estimated for a 10-piglet litter at recommended thermal conditions a proportionality coefficient of 0.29 and a scaling exponent of 0.53 (R2 = 0.49). Laying area data collected from individual larger, growing pigs have been shown by Ekkel et al. (2003) and Pastorelli et al. (2006) to have proportionally and scaling coefficients of 0.033 and 0.66 (30 to 100 kg) as well as 0.028 and 0.67 (47–198 kg), respectively. The technique of measuring individual piglets to create the allometric relationships is more similar to those used by Petherick and Baxter (1981) and for larger, growing pigs. Boon (1981) formed the allometric relationship assuming a constant L to W ratio of 3.5 from visual inspection of ASABE (2011). This study found a decreasing L to W ratio of 5.8 (0.55 kg) to 3.8 (13 kg) as piglet BW increased.
There are several limitations of this study, with the lack of sow parity variation and genetic variation being the top limitations. The inclusion of a sow parity distribution including young (P1 and P2) and prime (P3–P5) would offer a better insight into the sow effects on piglet growth and dimensions through lactation. Recent research analyzing dimensions of wean-to-finish pigs did include various genetic backgrounds, but did not analyze if the genetic variation was an effect on pig dimensions. This study does utilize a commercial genetic line, thus limiting the application to the specific genetic line and those lines very similar to it. Further research including the data collection across multiple genetic lines [other commercial lines, and purebred lines (Duroc, Berkshire, Landrace, Yorkshire, etc.)] would strengthen the knowledge base of piglet dimensions during lactation and offer precise data for various applications in industry and research.
The overall implications of the changes in piglet dimensions could be significant in relation to the variability of prewean mortality rates in the swine industry. The change of piglet dimensions could play a role in prewean mortality as the supplemental heat sources provided to meet the piglet's thermal needs to not increase in physical area over the lactation cycle. It is common that the largest area coverage will be at the time of birth (Smith et al., 2019). The most common supplemental heat source in industry is the heat lamp which also presents a unique challenge that the heat distribution on a rubber mat is not even like heat mats or semi-enclosed heated microclimates (Davis et al., 2008; Stinn and Xin, 2014; Smith et al., 2019). While recent studies suggest that at a later age and weight during lactation piglets no longer require supplemental heat, some level is suggested for the vast majority of lactation (Milan et al., 2019). The static nature of the supplemental heat source area could cause piglets to seek out other warm areas in the creep area near the sow. Especially with heat lamps this could be true as multiple heat lamps have been shown to have little impact on piglet productivity (Leonard et al., 2020). A critical assessment of the supplemental heat area provided for litters is needed as the total born live has been historically increasing and will likely continue to increase (Stalder, 2018). The data and equations provided from this study will provide accurate data for use in designing new technologies for the creep area as well as accurate modeling of piglets for heat transfer purposes.
Data Availability Statement
The raw data supporting the conclusions of this article will be made available by the authors, without undue reservation.
Ethics Statement
The animal study was reviewed and approved by Institutional Animal Care and Use Committee (IACUC #20-084) at Iowa State University.
Author Contributions
BS and BR were involved in the conceptual design of the study. BS supervised the animal experiment and data collection and performed the data analysis. All authors were involved in the preparation of the manuscript for publication.
Funding
This research was funded in part by a grant from the Center for Industrial Research and Service (CIRAS) at Iowa State University and FarrPro Inc. This work was a product of the Iowa Agriculture and Home Economics Experiment Station, Ames, Iowa. Project Number IOW04100 was sponsored by Hatch Act and State of Iowa funds. The authors declare that this study received funding from FarrPro Inc. and CIRAS. The funder was not involved in the study design, collection, analysis, interpretation of data, the writing of this article or the decision to submit it for publication.
Author Disclaimer
The content of this article was however solely the responsibility of the authors and does not represent the official views of the USDA.
Conflict of Interest
The authors declare that the research was conducted in the absence of any commercial or financial relationships that could be construed as a potential conflict of interest.
Publisher's Note
All claims expressed in this article are solely those of the authors and do not necessarily represent those of their affiliated organizations, or those of the publisher, the editors and the reviewers. Any product that may be evaluated in this article, or claim that may be made by its manufacturer, is not guaranteed or endorsed by the publisher.
Acknowledgments
The authors would like to thank Sara Weyer, Dylan Riedemann, Gabe Greiner, Devri Cliburn, Julia Bowman, Sam Te Slaa, and Chad Schechinger for their work during the experiment and Highway Farms for their assistance and cooperation for supplying sows for the study.
References
Boon, C. R. (1981). The effect of departures from lower critical temperature on the group postural behaviour of pigs. Anim. Prod. 33, 71–79. doi: 10.1017/S0003356100025228
Condotta, I., Brown-Brandl, T., Stinn, J., Rohrer, G. A., Davis, J. D., and Silva-Miranda, K. O. (2018). Dimensions of the modern pig. Trans. ASABE 61, 1729–1739. doi: 10.13031/trans.12826
Curtis, S. E. (1983). Environmental Management in Animal Agriculture. Ames, IA: The Iowa State University Press.
Davis, D. J., Xin, H., and MacDonald, R. D. (2008). Infrared thermographic evaluation of commercially available incandescent heat lamps. Appl. Eng. Agric. 24:12. doi: 10.13031/2013.25264
Ekkel, E. D., Spoolder, H. A. M., Hulsegge, I., and Hopster, H. (2003). Lying characteristics as determinants for space requirement in pigs. Appl. Anim. Behav. Sci. 80, 19–30. doi: 10.1016/S0168-1591(02)00154-5
Hoff, S. J., Janni, K. A., and Jacobson, D. L. (1993). Modeling newborn piglet thermal interactions with a surface energy balance model. Trans. ASAE 36, 151–59. doi: 10.13031/2013.28326
Kluyver, T., Ragan-Kelley, B., Pérez, F., Granger, B. E., Bussonnier, M., Frederic, J., et al. (2016). “Jupyter Notebooks-a publishing format for reproducible computational workflows,” in Positioning and Power in Academic Publishing: Players, Agents and Agendas, Vol. 2016, eds F. Loizides and B. Scmidt (IOS Press), 87–90.
Knauer, M. T., and Baitinger, J. D. (2015). The sow body condition caliper. Appl. Eng. Agric. 31, 175–78. doi: 10.13031/aea.31.10632
Leonard, S. M., Xin, H., Brown-Brandl, T. M., Ramirez, B. C., Dutta, S., and Rohrer, A. G. (2020). Effects of farrowing stall layout and number of heat lamps on sow and piglet production performance. Animals 10:348. doi: 10.3390/ani10020348
Midwest Plan Service (1983). Structures and Environment Handbook. MWPS-1-TS. Ames, IA: Midwest Paln Service.
Milan, H. F. M., Sandro, A., Maia, C., and Gebremedhin, G. K. (2019). Prediction of optimum supplemental heat for piglets. Trans. ASABE 62, 321–342. doi: 10.13031/trans.13015
Mumm, J. M., Díaz, J. A. C., Stock, J. D., Johnson, A. K., Dekkers, J. C., Ramirez, A., et al. (2019). Dynamic space utilization for lame and non-lame gestating sows estimated by the lying-standing sequence. Livest. Sci. 223, 1–7. doi: 10.1016/j.livsci.2019.02.014
NRC (2012). Nutrient Requirements of Swine. 11th Rev. Edn. Washington, DC: National Academies Press.
Pastorelli, G., Musella, M., Zanelli, M., Tangorra, F., and Corino, C. (2006). Static spatial requirements of growing-finishing and heavy pigs. Livest. Sci. 105, 260–264. doi: 10.1016/j.livsci.2006.05.022
Petherick, J. C., and Baxter, S. H. (1981). “Modelling the static spatial requirements of livestock,” in Proceedings of the CIGR Section II Seminar on Modelling, Design, and Evaluation of Agricultural Buildings, ed J. A. D. MacCormack (Aberdeen), 75–82.
PIC (2015). PIC Sow and Gilt Manual. Available online at: https://www.pic.com/resources/gilt-sow-management/ (accessed October 15, 2020).
Smith, B. C. (2021). Technology and assessment techniques for swine farrowing facility management (Dissertation). Iowa State University, Ames, IA, United States.
Smith, B. C., Ramirez, B. C., Hoff, S. J., Greiner, L. L. (2019). Pilot-scale assessment of a novel farrowing creep area supplementary heat source. Animals 9:996. doi: 10.3390/ani9110996
Stalder, K. J. (2018). 2017 Pork Industry Productivity Analysis. National Pork Board Research Grant Report. Des Moines, IA: National Pork Board. Available online at: https://jygatech.com/wp-content/uploads/2021/05/PigmortalityStalderIowa.pdf (accessed October 15, 2020).
Stinn, J. P., and Xin, H. (2014). Heat Lamp vs. Heat Mat as Localized Heat Source in Swine Farrowing Crate. 5098789. Ames, IA: Iowa State University, Digital Repository.
Wheeler, E. F., Vasdal, G., Flø, A., and Bøe, K. E. (2008). Static space requirements for piglet creep area as influenced by radiant temperature. Trans. ASABE 51, 271–278. doi: 10.13031/2013.24220
Keywords: body weight, heat transfer, height, length, piglet
Citation: Smith BC and Ramirez BC (2021) Dimensions of the Suckling Pig. Front. Anim. Sci. 2:694299. doi: 10.3389/fanim.2021.694299
Received: 12 April 2021; Accepted: 02 July 2021;
Published: 05 August 2021.
Edited by:
Edward Narayan, The University of Queensland, AustraliaReviewed by:
Gota Morota, Virginia Tech, United StatesFabio Abeni, Consiglio per la Ricerca in Agricoltura e l'Analisi dell'Economia Agraria (CREA), Italy
Copyright © 2021 Smith and Ramirez. This is an open-access article distributed under the terms of the Creative Commons Attribution License (CC BY). The use, distribution or reproduction in other forums is permitted, provided the original author(s) and the copyright owner(s) are credited and that the original publication in this journal is cited, in accordance with accepted academic practice. No use, distribution or reproduction is permitted which does not comply with these terms.
*Correspondence: Brett C. Ramirez, bramirez@iastate.edu
†ORCID: Benjamin C. Smith orcid.org/0000-0003-3299-3628