Different Approaches to Assess the Seismic Capacity of Masonry Bridges by Non-linear Static Analysis
 Paolo Zampieri
 Simone Perboni
  Cyrille Denis Tetougueni
- Department of Civil, Architectural and Environmental Engineering, University of Padua, Padua, Italy
A large portion of the existing masonry arch bridges in Italy are still in service in the infrastructure system and are located in a geographical area of high seismic risk. Most of them were built more than 100 years ago taking into account only gravitational loads during the design phase without any seismic analysis. For this reason, a seismic vulnerability assessment has been appointed as mandatory regular activity from the Italian government in order to define the priority of seismic retrofit interventions. In this study, a multi-span slender masonry bridge considered as the most vulnerable typology of masonry bridges to seismic action will be assessed. Then, the results obtained from three different seismic assessment approaches will be discussed and compared. In particular, two approaches based on different FE modeling and the last one built on rigid blocks analysis are considered. Finally, a detailed 3D finite element analysis allowed representing all the collapse mechanisms (global and local) of the bridges are presented. Simplified approaches, even though cannot describe all the collapse mechanisms of the bridges due to seismic action can lead to reliable results.
Introduction
Masonry arch bridges represent a significant percentage of cultural heritage in Italy and Europe (Melbourne et al., 2007). Most of them were built mainly between the end of the nineteenth century (Brencich and Sabia, 2008) and the early twentieth century, a period characterized by the development of important transportation means such as roads and railways. The increase in traffic loads and recent significant seismic events, combined with the material deterioration, have led to a more in-depth study of the behavior of these structures through the use of different analysis approaches (D'Altri et al., 2019). In many geographical regions with high seismic hazard, the assessment of the seismic vulnerability of existing bridges is required since they have been designed to withstand only gravitational loads. Although seismic actions were not considered in the design, most of the masonry bridges anyhow display good resistance (Da Porto et al., 2016) to horizontal loads due to their strong structural robustness. However, multi-span bridges with slender piers and almost semi-circular arches are still vulnerable to seismic action. The “Claro River Bridge” (Da Porto et al., 2016) is a perfect example of this type of structure, which collapsed after an earthquake occurred off the coast of central Chile on Saturday, February 27th 2010 with a magnitude of 8.8 on the moment magnitude scale.
Besides, many researchers have addressed in recent decades fatigue problems in masonry arch bridges. Amongst the existing methodologies, the stress-life approach and numerical analysis are commonly used by scientists. In particular, the stress-life approach to evaluate the fatigue strength of a specific existing bridge has been used in Laterza et al. (2017) and Casamassima and D'amato (2019). The authors highlighted the effectiveness of this methodology and praised for further studies to derive new curves. On the other hand, the fatigue assessment of arch bridges has been also studied using probabilistic tools. Few authors investigated the remaining service life using the Weibull distribution to calibrate their model (Clark, 1994; Casas, 2009). The authors proposed a new model for the reliability-based assessment of the fatigue performance of existing bridges.
For the purpose of vulnerability assessment, the static and dynamic linear analyses may lead to conservative results, since it is not possible to consider the non-linearity of the masonry material. Non-linear dynamic analysis (Pelà et al., 2013) is certainly the most refined method of analysis, which at the same time requires particularly a high computational cost and provides results that may be unfamiliar to structural engineers. Non-linear dynamic analysis can be a quick tool for analyses of simple structural models, which is actually the case of macro-elements (Pantò et al., 2016; Cannizzaro et al., 2018) or fiber-beam element approaches (De Santis and de Felice, 2014).
Another method of analysis used for seismic design of masonry structures is the non-linear static analysis. Indeed, non-linear static analyses can be developed with different analysis strategies: 3D finite element models (D'amato et al., 2017; Scozzese et al., 2019), macro-element (Caliò et al., 2012; Cannizzaro et al., 2018), fiber-beam models, FEM/DEM models (Milani and Lourenço, 2012; Baraldi et al., 2018) etc. Other authors stressed out the necessity of experimental campaigns to calibrate numerical analyses and the relevance of the choice of the control node before the non-linear static analysis of the bridge (Pelà et al., 2005; Rota et al., 2010; Zampieri et al., 2015b). In addition, a nonlinear static analysis procedure called “non-linear kinematic analysis” is also possible if the bridge is discretized into rigid blocks (Galassi et al., 1839, 2018a,b; Cavalagli et al., 2017; Galassi and Tempesta, 2019a,b) and the capacity curve of the collapse mechanism is obtained.
In this paper, the authors reported the critical review of the results from the non-linear static analysis using two modeling strategies: FEM with 3D brick elements on the one hand and then with fiber-beam elements. Besides, the results obtained from the non-linear kinematic analysis will be also discussed.
Theoretical Background
In this section, the models used for the analysis of the structure under study are briefly described. Two different approaches are considered: the first consists of a 3D finite element model (3D-element approach) and the second is made of fiber-beam elements (fiber-beam element approach). The results obtained from the two approaches will then be compared with the results from non-linear kinematic analysis (N-L-A).
3D Element Approach
In this approach, a three-dimensional model is created using MIDAS FEA (Midas Fea v1.1., 2016). The model includes all the structural parts participating to the seismic resistance of the bridge. Prismatic finite elements with a triangular base were used for the mesh and each finite element is characterized by 18 degrees of freedom in space with an average size of 0.35 m. The numerical analysis of the structure considers the masonry as a continuous medium. “Total Strain Crack Model” (TSCM)1 refers to the constitutive law relationship describing the mechanical behavior of the masonry. It displays an elastic behavior in traction with linear softening after the ultimate tensile strength is reached (Figure 1). It is worth noting that the ultimate tensile strength (ft) in this study corresponds to 1/100 of the compressive strength (fc). On the other hand, the constitutive relationship for compressive stresses is linear elastic-perfectly plastic was considered to describe the compressive behavior of the masonry (Figure 1). Finally, the filling material is modeled using a Mohr-Coulomb failure criterion.
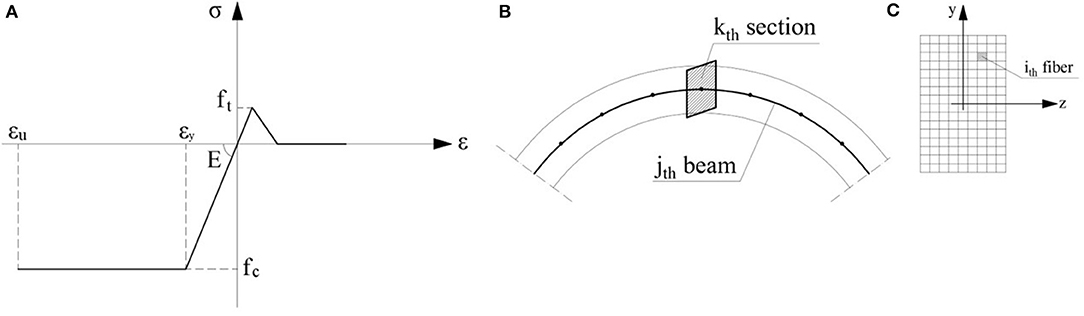
Figure 1. Material and geometrical characteristics of the arch. (A) Masonry non-linear constitutive law. (B) Example of discretization of the arch with beam elements. (C) Generic reference section of fiber-section.
Fiber-Beam Element Approach
An adequate number of experimental tests referred in Brencich and Gambarotta (2005) and De Felice and De Santis (2010) confirm that the plane section hypothesis of the beam element is also valid when it experiences a non-linear deformation. For these reasons, the solution considered to discretize the arch by means of straight beams (composed of fibers) is a valid trade-off between the model itself and the accuracy of the solution obtained.
The non-linear constitutive law of the beam is illustrated as follow.
In Figures 1B,C, the longitudinal strain along the x-axis of the generic section A(x) of the fiber-beam element is defined as dx = {χz(x) χy(x) ε(x)}, where χ is defined as the curvature in the z and y directions and ε is the axial strain. According to the plane section hypothesis, the strain of the section is defined as ε(x, y, z) = a(y, z) d(x), where a(y, z) = {−y z 1}. Therefore, considering the elastic modulus E(x, y, z), the distribution of stresses σ(x, y, z) = E(x, y, z) ε(x, y, z) is immediately defined. From these relationships, it is possible to obtain the stiffness matrix k(x) of the section and the vector defining the resisting actions D(x) = {Mz(x) My(x) Nx} in the case of continuous bridge structure throughout Equations (1) and (2):
On the other hand, when the fiber beam model is used, the generic section of the beam element is divided into n(x) fibers. Equations (1) and (2) become Equations (3) and (4) and are calculated as follows:
Ai(x) is the area of the i-th fiber of the reference section x. Finally, the stiffness matrix for a single element is obtained as: K = F−1, where F represents the flexibility matrix, defined as follows:
L is the length of the element, k(x) the section stiffness matrix and b(x) the matrix function of the force.
Non-linear Kinematic Analysis
Non-linear kinematic seismic analyses of the masonry bridge allow the design of the seismic capacity curve of the bridge collapse mechanism (taking as a control point the keystone centroid of the central arch).
For the longitudinal non-linear kinematic analysis, the structure is considered as made of n rigid blocks (Figure 2A). In order to consider the resisting effect of the backing, a macro-block between arches and top piers is considered as shown in Figure 2B.
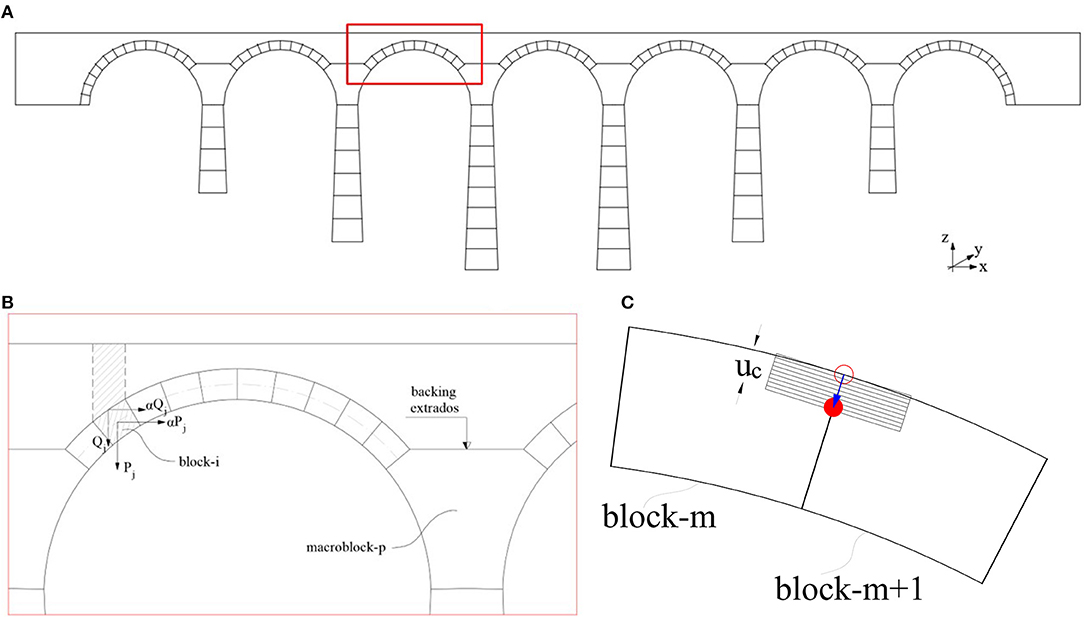
Figure 2. Description of the non-linear kinematic models. (A) Subdivision in rigid blocks of the bridge. (B) Loads applied at the i-block (longitudinal analysis). (C) Hinge localization between two rigid blocks.
The capacity curve of the bridge is calculated by applying the principle of virtual work (PVW) to the deformed shape of the structure:
Where:
Pi is the resultant of the forces directly applied in the i-th block (e.g., the weight of the block).
Qj is the resultant of the forces not directly applied in the block but transmitted by the structure and which generate a horizontal seismic force.
θ is the generalized displacement (e.g., a rotation) taken as a reference; θ is the rotation of the arch segment H1H2 (Figure 3A).
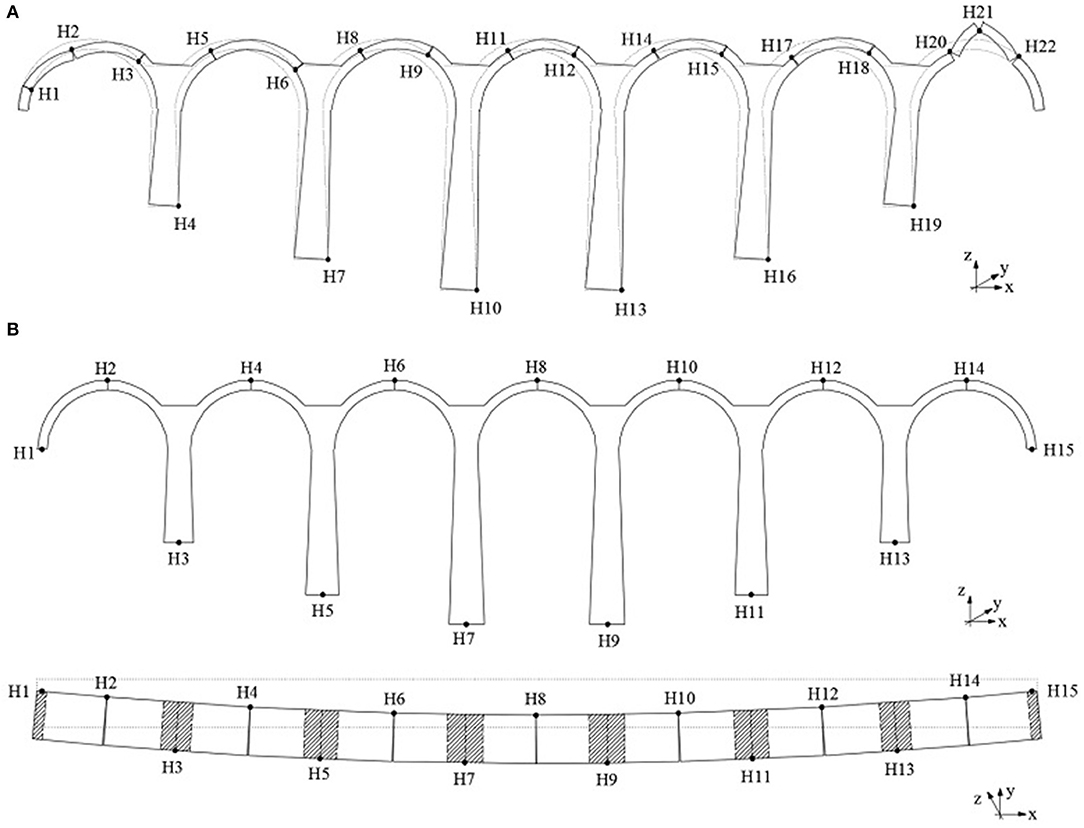
Figure 3. Collapse mechanisms of the bridge. (A) Longitudinal collapse mechanism. (B) Transversal collapse mechanism.
dx, i and dx, j are the horizontal virtual displacements of the point of application of the i-inertia force of the arch and the j-inertia force of the infill (Figure 2B).
dy, i and dy, j are the vertical virtual displacements of the point of application of the force Pi and the point of application of the force Qj (Figure 2B).
Finite compressive strength of the masonry is considered moving the hinge from the edge of the arch to the neutral axis depth uc in the ultimate condition as represented in Figure 2C.
With the application of PVW for finite incremental values of the rotation θ, the collapse multiplier α(θ) and the associated displacement di(θ) for each i-block can be obtained. The procedure ends with the derivation of a displacement for the corresponding collapse multiplier α(θ) = 0. In this case, the equation of PVW becomes.
The first step prior to the transversal kinematic analysis is to subdivide the structure in macro-elements as shown in Figure 3. If n is considered as the number of bridge spans, then the structure is subdivided into n+1 macro-blocks. The two abutments as well as half of the two outer spans, are considered as two macro-blocks whereas the other n-1 blocks are centered bridge spans. Each arch crown is identified as the starting and ending of the inner blocks of the bridge. This assessment methodology is efficient when dealing with the kinematic approach. Further information can be found in Zampieri et al. (2015a).
Seismic Assessment Methods
Non-linear Static Assessment
Once the curves describing the structural behavior (capacity curve) have been obtained following a non-linear static analysis, the structure is assessed. To do this, the force-displacement curve of the MDOF system is converted into a bilinear curve of an equivalent SDOF system.
Where,
F* e d* are respectively, the force and displacement of the equivalent SDOF
Fb e dc are respectively, the force and displacement of the actual system MDOF
Γ is the modal participation factor, defined as:
Where,
τ is the dragging vector relative to the direction of the investigated bridge
φ is the vector relative to the fundamental vibration mode of the real system normalized by setting dc = 1
M is the matrix of the mass of the real system
The assessment of the performance of the structure is carried out considering the following formulas.
The period of the bilinear equivalent system SDOF (T*) is given by:
Where,
m* = Φ · M · τ is the mass of the equivalent SDOF system
k* is the stiffness of the elastic part of the bilinear curve
If T* ≥ TC virgule the demand in displacement for the inelastic system (SDp(T*)) is assumed to be the same as that of an elastic system of the same period (SDe(T*)):
If T* < TC virgule the demand in displacement for the inelastic system is greater than that of an elastic system of the same period, obtained as follows:
Where
q* = Se(T*) · is the ratio between the elastic response force and the yield strength of the equivalent system. If q* ≤ 1 si ha che .
Non-linear Kinematic Assessment
In the non-linear kinematic seismic analysis, the capacity curve of the structure must be transformed into equivalent SDOF system. The spectral acceleration a*(θ) and the spectral displacement d*(θ) of equivalent SDOF system are computed as follows.
dx, k is the finite horizontal displacement of the generic point P of the system (assumed as representative to plot the pushover curve) and δx, k is its virtual horizontal displacement;
M* is the mass participation of the structure to create the mechanism computed as:
With non-linear kinematic analysis, the seismic assessment is expressed in terms of displacement and the verification is satisfied when:
Where and represent respectively, the ultimate displacement, elastic displacement, secant period and spectrum elastic displacement for the period .
Case Study: Multi-span Bridge
The bridge typology investigated in the case study is quite similar to the Rio Claro Bridge before its collapse in 2010. The bridge is made of seven masonry arch spans and the geometrical characteristics have been chosen by the authors to reflect current existing arch bridges. Due to the lack of resources, no experimental campaign has been done in this work. It is worth noting that the mechanical characteristics of the masonry brick elements found in Table 1 derived partly from the experimental campaign discussed in Reccia et al. (2014) while the other parameters were suggested in Barbieri (2019). As shown in Figure 4, the bridge consists of semi-circular arches with a span of 12.5 m and a rise of 6.1 m. The vaults are 1.0 m thick. The piers, also in masonry, have a variable height of 18.1, 15.0, and 9.6 m. The masonry abutments are 7.5 m high. A 4.5 m thick of the backing is considered starting from the arch level. The filling material consists of loose material, for a height of 0.8 m from the extrados in keystone to the arches and, above this, a layer of ballast equal to 0.8 m; both layers are confined by a 0.8 m thicker spandrel walls. The transversal dimension of the bridge is 5.0 m.
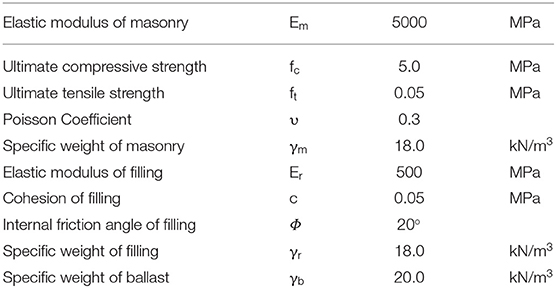
Table 1. Resistance Characteristics of the constitutive elements in the model.
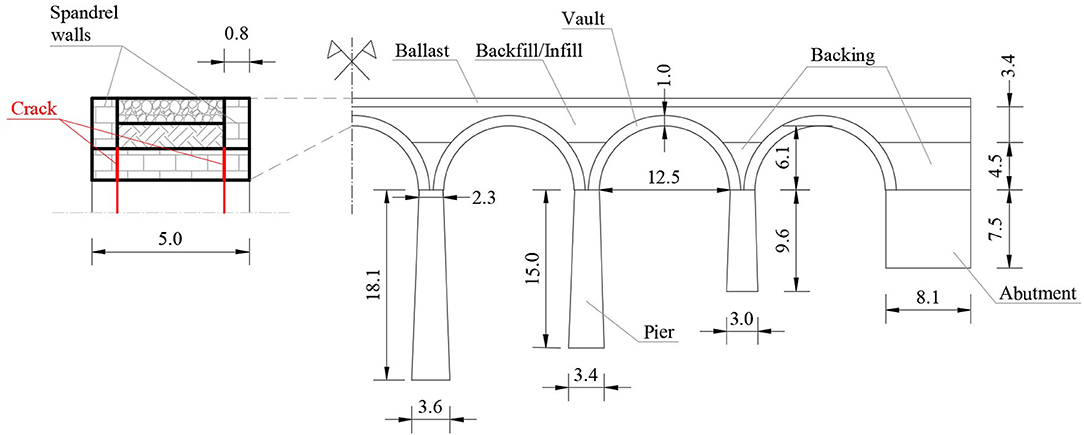
Figure 4. Geometrical properties of the case study.
To match as close as possible the deterioration observed in existing bridge, vertical cracks between the arch and the pier as illustrated in Figure 4 have been considered in all the arches during the numerical modeling.
As already described in the previous paragraph, two types of finite element models are considered. The first concerns a 3D finite element model presented in Figure 5, in which the resisting elements of the bridge are discretized by means of tetrahedral elements. The mechanical parameters of these elements are listed in Table 1.
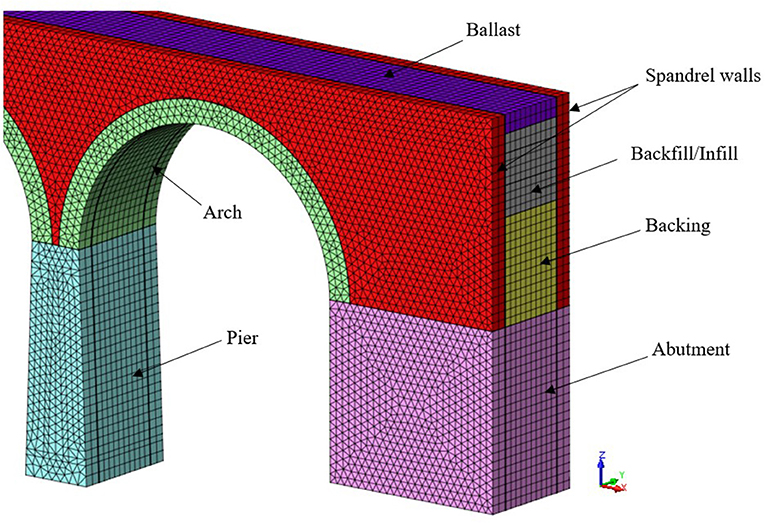
Figure 5. Specific detailing of the 3D FEM bridge model under study.
The next model considered is illustrated in Figure 6 and concerns a fiber-beam element model in which the resisting elements of the bridge such as piers and arches are discretized by means of beam elements. On the other hand, the backing and filling materials are discretized by means of cut-off bar elements without mass, to which resistance characteristics have been assigned for compression only, to work as connecting rod elements. Figure 6B shows the three fiber-beam element models analyzed, in which different elements of the structure participating in the seismic resistance of the bridge are considered from time to time. In particular: in the Fiber-beam element model 1 virgule only piers and arches are considered to be resistant; in fiber-beam element model 2 virgule the addition of the backing and in fiber-beam element model 3 virgule the additional filling is considered to be resistant.
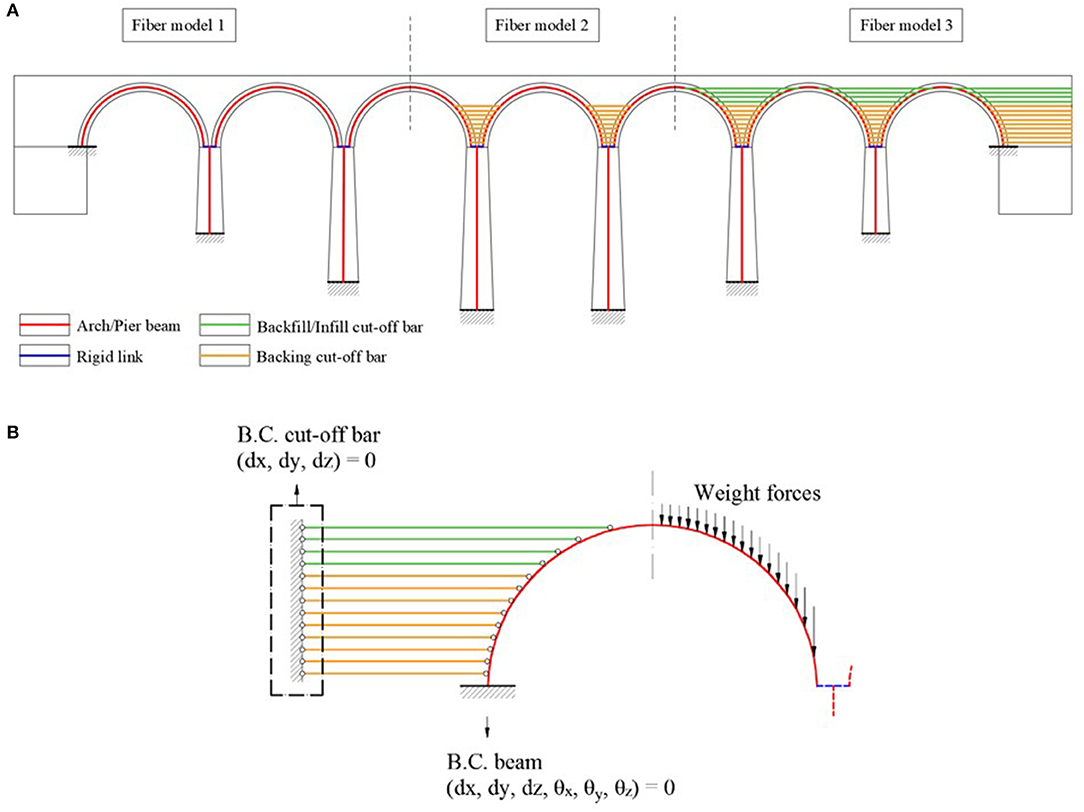
Figure 6. FEM modeling of the arch bridge under study. (A) Schematic representation of the fiber model considered. (B) Detailing of the constraint and loading conditions considered for the fiber-beam model of the bridge.
The weights of the remaining elements, which are not considered as resisting elements from time to time, are applied as forces to the arches.
Comparison Between Three Different Type of Modeling
Modal Analysis Results
The two FEM modeling strategies of the bridge under study are now compared. Firstly, the comparison between the vibration modes obtained through a modal analysis is done. Table 2 contains the results of the period (T) and mass participation (M) with reference to the principal modes of vibration in both longitudinal and transversal directions Figure 7 shows the deformed shapes of the principal modes.
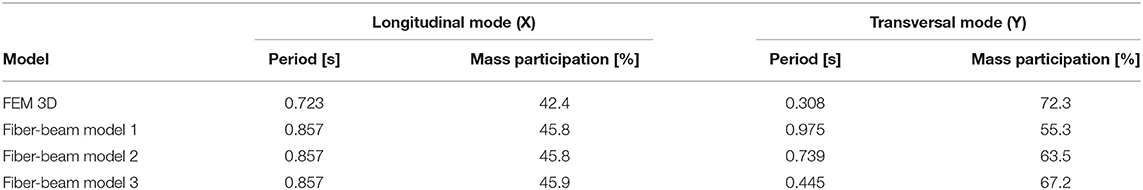
Table 2. Comparison of principal vibration modes in longitudinal direction (X) and in transversal direction (Y).
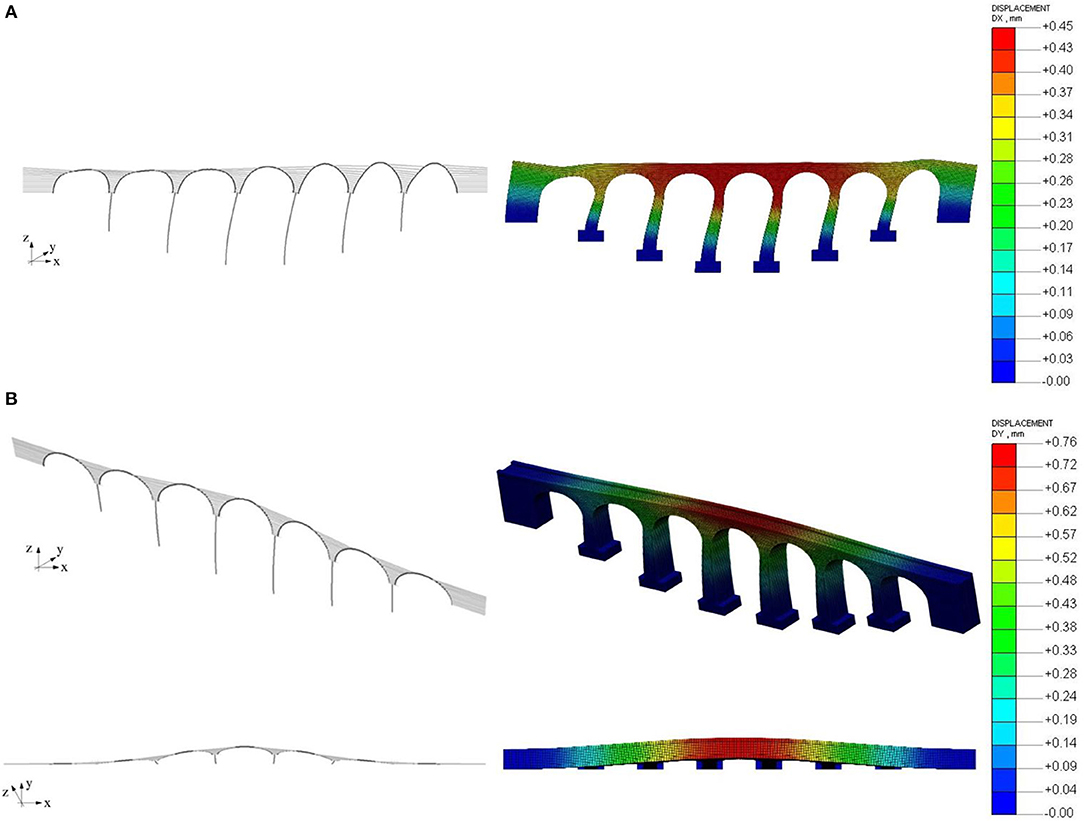
Figure 7. Results from FEM analyses. (A) First significant vibration mode in the longitudinal direction (X) of the Fiber-beam model. (B) First significant vibration mode in the longitudinal direction (X) of 3D model.
From the modal analysis although the deformed modes of vibration are substantially similar, the periods differ by 44.5% in the longitudinal direction (X) and by 21.0% in reference to the transversal direction (Y). Less evidence is observed for mass participation. Indeed, the difference is up to 5.1% in the longitudinal direction (X) and 3.5% points for the transversal direction (Y).
Non-linear Static Analysis Results
The next comparison between the two types of finite element modeling concerns a non-linear static analysis. In this regard, the analysis was carried out by applying a force proportional to the masses of the structure in both longitudinal and transversal directions of the bridge (which corresponds respectively, to the X-axis and the Y-axis of the models). As far as the fiber-beam element model is concerned, we consider other cases: The contribution from the filling material is neglected (namely “Fiber-beam element model 2”) and the backfilling and filling are simultaneously considered (called “Fiber-beam element model 3”). The curves resulting from the above analyses are illustrated in Figure 8, which shows the normalized force against the displacement of the control point. It is worth noticing that the control point in this research is taken at the arch intrados of the bridge mid-span.
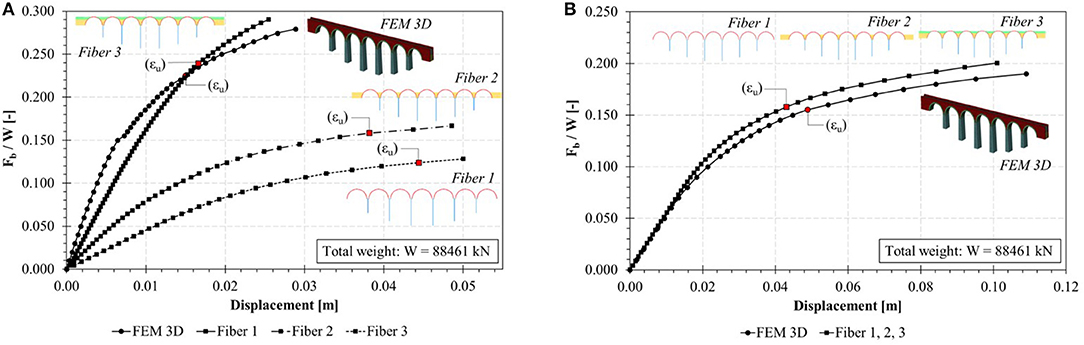
Figure 8. Normalized force-displacement from pushover analyses. (A) First significant vibration mode in the transversal direction (Y) of the Fiber-beam model. (B) First significant vibration mode in the transversal direction (Y) of the 3D model.
Considering Figure 8, it is possible to draw the following conclusions. For fiber-beam element models, as the number of elements considered to participate in the seismic resistance of the bridge increases, the value of ultimate force increases. In fact, the resistance changes from 11057.6 kN for the Fiber-beam element model 1 to 24769.1 kN for the Fiber-beam element model 3. On the other hand, the value of ultimate displacement decreases, from 0.05 m for the Fiber-beam element model 1 to 0.025 m for the Fiber-beam element model 3.
Similar observations can be made by comparing the 3D FEM model and the corresponding Fiber-beam element model.
With regard to the non-linear static analysis in the transversal direction, the behavior between the different modeling strategies is quite similar. Indeed, the normalized pushover curves for the three fiber-beam models overlay each other (Figure 8B). Furthermore, the ultimate resistance varies from 16807.6 kN for the 3D FEM model to 17692.2 kN for the fiber-beam element models. Moreover, the ultimate displacement varies from 0.115 m for the 3D FEM model to 0.103 m for the fiber-beam element models. It should be pointed out that the ultimate resistance and ultimate displacement remain the same for the three fiber-beam element models.
For each step of the pushover curve from the relevant analysis, the verification of the shear-slip should be done throughout the following expression:
Where
l′ is the length of the compressed part of the section
t is the thickness of the section
fvk0 is the characteristic shear strength in the absence of vertical loads
σn is the average normal stress due to the vertical loads acting on the design elements
ΓM is the safety coefficient, considered equal to 1.0 in the case of non-linear static analysis.
Considering the 3D-element modeling approach, the structure displays damages at the base of the piers. In the transversal direction, the damage is less significant as shown in Figure 9A. In particular, the observed damage is relevant for pier 6, arches 1, 2, and 7 and for the right abutment (Figure 9B).
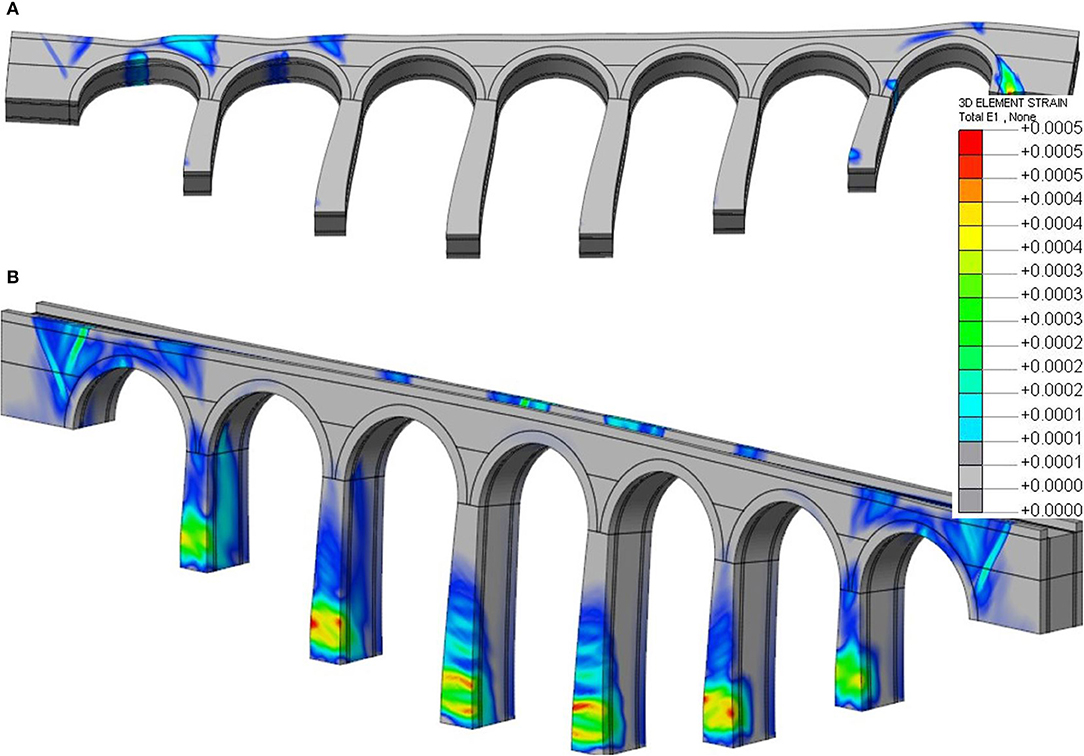
Figure 9. Tensile principal Strain for the last step of the analysis. (A) Pushover curves in longitudinal direction. (B) Pushover curves in transverse direction.
From the analysis in the transversal direction through the 3D-element approach, it is possible to appreciate the collapse of the spandrel that occurs before reaching the capacity in that direction. For both spandrels (namely spandrel A and spandrel B) (see Figure 10), this collapse consists of the formation of cracks in the areas mainly subjected to the traction of the element. These cracks are more pronounced as the applied load increases (force proportional to the masses of the structure).
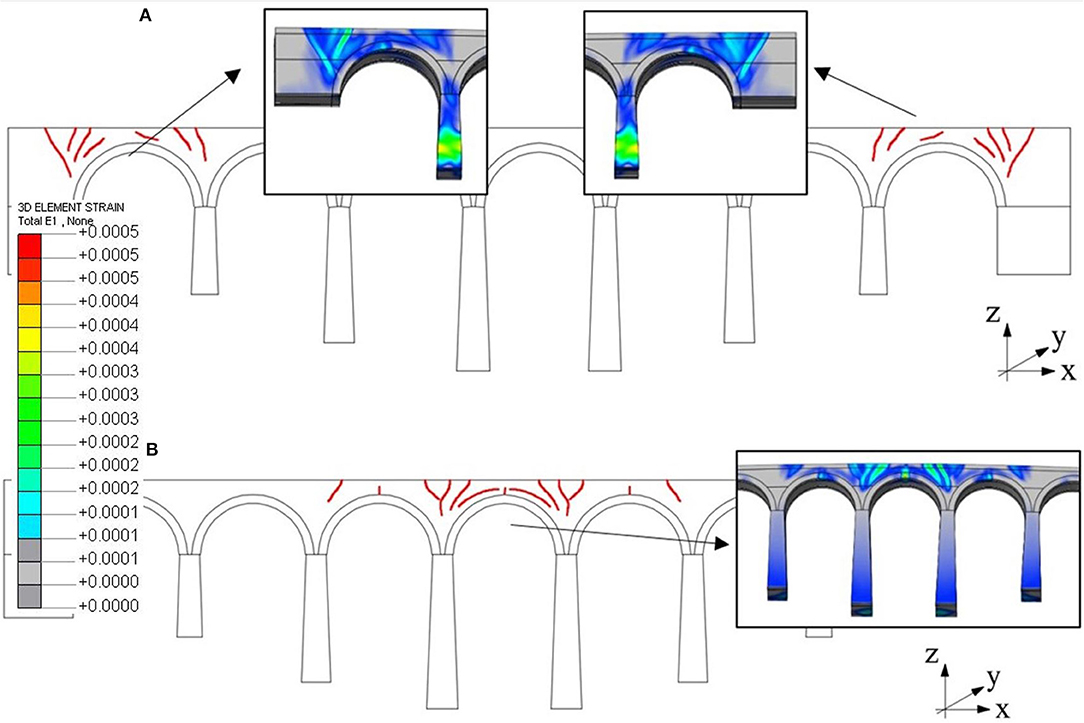
Figure 10. Damage state of the spandrel walls. (A) Strain state in the longitudinal direction (X). (B) Strain state in the transversal direction (Y).
The damage involving the spandrel, as illustrated in Figure 10, consists of the formation of cracks mainly at arches 1 and 7 for the spandrel A and arches 3, 4, and 5, for the spandrel B.
Non-linear Kinematic Analysis Results
From the non-linear kinematic analysis, it was possible to determine the collapse mechanism of the bridge in longitudinal and transversal direction (Figure 11). It is worthy to record that the analyses performed and presented in this sub-section refer to the use of the rigid block model already introduced. On the first hand, the longitudinal collapse mechanism (Figure 11A) is characterized by the formation of hinges at the base of the piers and on the arches. The collapse mechanism is defined through an iterative process that provides a minimum kinematically admissible collapse multiplier.
a) Collapse mechanism in the longitudinal direction
b) Collapse mechanism in the transversal direction.
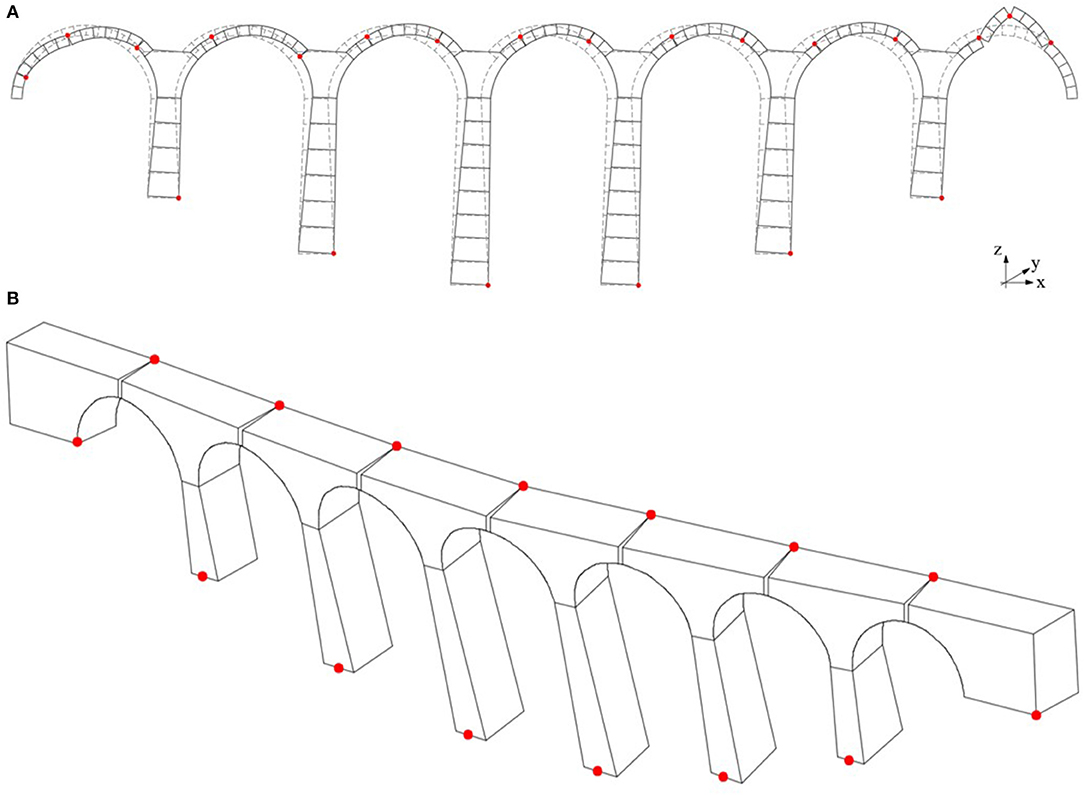
Figure 11. Displayed collapse mechanism from the non-linear kinematic analysis. (A) Side A of the bridge spandrel walls. (B) Side B of the bridge spandrel walls.
On the second hand, the transversal collapse mechanism (Figure 11B) is defined without using an optimization process based on the previous authors' work and reported in Zampieri et al. (2015a)1.
The capacity curves obtained from non-linear kinematic analysis show that is equal to 0.162 g and 0.157 g, respectively, for longitudinal and transversal analysis while is equal to 0.182 and 2.155 m, respectively.
Seismic Vulnerability Assessment
From the force-displacement curves that describe the behavior of the structure under the effect of seismic loads, it was also possible to investigate the seismic vulnerability of the bridges under study. This assessment is carried out by comparing the ultimate capacity in displacement of the structure (obtained by the pushover analysis) with the structural demand.
The Performance Indicator (PI), which best describes the relationship between the structural capacity and the demand are defined as follow respectively, for the non-linear static and the non-linear kinematic analysis.
The seismic vulnerability can also be investigated throughout the response spectrum from Eurocode 8 considering the following parameters: Soil category: B; Design ground acceleration: ag = 0.2 g; Soil factor: SS = 1.2; Topographic coefficient: ST = 1.0; Maximum spectrum amplification factor F0 = 2.5; Damping coefficient (5.0 %).
The analysis of the 3D-element approach shows the following results (see Figures 12A,B). In particular, the most severe conditions are obtained with reference to the longitudinal direction (X-axis in the model) with PI values equal to 0.62 and a final displacement of 0.011 m, compared to a PI of 0.93 found for the transversal direction (Y-axis in the model) and a final displacement of 0.034 m.
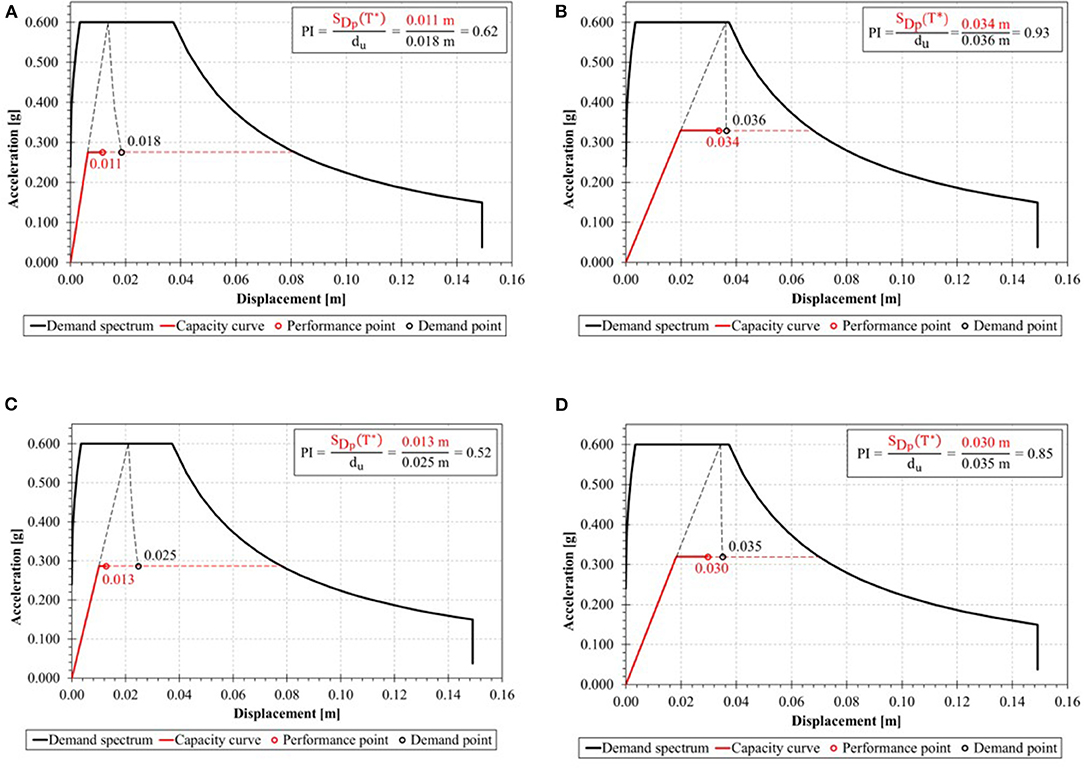
Figure 12. Seismic vulnerability analysis of two different modeling approaches. (A) Verification in the longitudinal direction (X) of the 3D model. (B) Verification in the transversal direction (Y) of the 3D model. (C) Verification in the longitudinal direction (X) of the fiberbeam model. (D) Verification in the transversal direction (Y) of the fiberbeam model.
The results from the analysis of the fiber-beam element model are shown in Figures 12C,D. In particular, the most severe conditions are obtained with reference to the longitudinal direction (X-axis in the model) with PI values of 0.52 and a final displacement of 0.013 m, compared to a PI of 0.85 for the transversal direction (Y-axis in the model) and a final displacement of 0.030 m.
From the non-linear kinematic analysis, the results obtained are presented in Figure 13. In particular, in this case, the verifications are both satisfied. From these, it can be concluded non-linear kinematic provides results that are not comparable with the ones obtained with the other methods illustrated. This difference probably depends on the flexural behavior of the slender piers that cannot be considered with a rigid blocks schematization of the bridge. However, the displacement and the period and , depending on e may not be representative for masonry bridge. These values have been calibrated indeed for masonry buildings. Therefore, the methodology could produce results which are comparable to those obtained from non-linear static analysis provided that the values of and are calibrated specifically for bridges in the scope of future research.
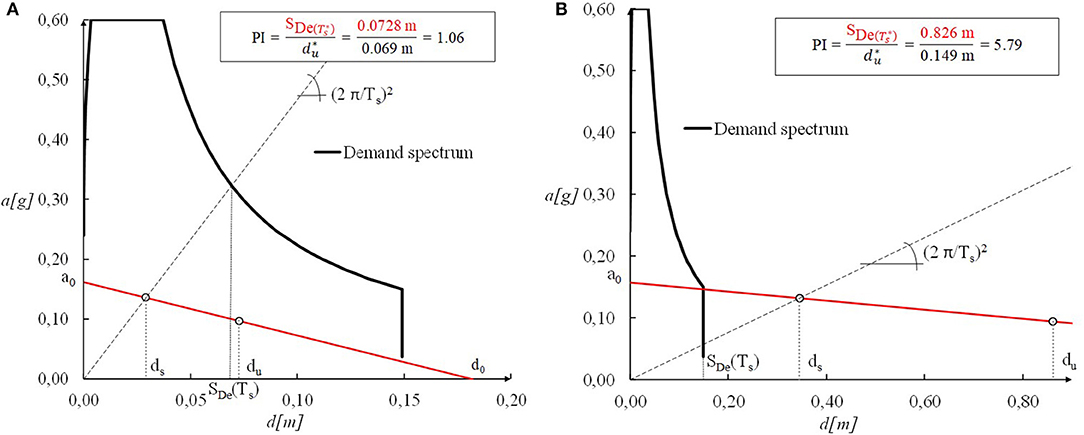
Figure 13. Seismic vulnerability from non-linear kinematic analyses. (A) Verification in the longitudinal direction (X) of the 3D model. (B) Verification in the transversal direction (Y) of the 3D model.
By comparing the PI values obtained from the analyses, it is possible to notice how the fiber-beam element model gives lower PI values than those of the 3D finite element model. These results show that the fiber-beam element model, while satisfactorily approximating the behavior of the structure (also in comparison to the 3D finite element model) is more favorable to safety by lowering PI values in respect to the 3D finite element model.
Conclusion
In order to study the seismic behavior of the multi-span masonry bridge (chosen as a case study) three different approaches based on non-linear static analysis were investigated. Two of them based on different F.E modeling strategies (3D-element approach and fiber-beam element approach) and the third is a rigid block analysis. The 3D-element approach was able to define all the collapse mechanism of the bridges: Global Longitudinal collapse mechanism, Global Transversal collapse mechanism and the Local Transversal mechanism of the spandrel wall.
• The capacity curve was found from all the different approaches and the seismic vulnerability expressed in term of capacity displacement/demand displacement was investigated. Finally, a comparison of the different results was done leading to the following conclusions:
• The fiber-beam element approach, even if it is a simplified approach and limited to describe all the possible seismic collapse mechanisms of the bridges carries out results that are comparable with that of the 3D-element approach. However, this approach underestimates the horizontal stiffness of the bridges;
• Kinematic analysis can represent in a clear way the collapse mechanisms of the bridges and its maximum resisting acceleration ();
• Non-linear kinematic seismic assessment procedure displays results completely different with respect to the other approaches. This result depends on and parameters and are valid for masonry buildings.
• Future research and development could involve the calibration of and in other to perform reliable non-linear kinematic analysis of masonry bridges.
Data Availability Statement
The datasets generated for this study are available on request to the corresponding author.
Author Contributions
PZ coordinated the work, performed some numerical analysis, and edited the document. SP performed most of the numerical analysis and edited the document. CT performed some numerical analysis and edited the document. CP supervised the work.
Conflict of Interest
The authors declare that the research was conducted in the absence of any commercial or financial relationships that could be construed as a potential conflict of interest.
Footnotes
1. ^DIANA-10.2 User's Manual n.d.
References
Baraldi, D., Reccia, E., and Cecchi, A. (2018). In plane loaded masonry walls: DEM and FEM/DEM models. A critical review. Meccanica 53, 1613–1628. doi: 10.1007/s11012-017-0704-3
Barbieri, D. M. (2019). Two methodological approaches to assess the seismic vulnerability of masonry bridges. J. Traff. Transp. Eng. 6, 49–64. doi: 10.1016/j.jtte.2018.09.003
Brencich, A., and Gambarotta, L. (2005). Mechanical response of solid clay brickwork under eccentric loading. Part I: unreinforced masonry. Mater. Struct. 38, 257–266. doi: 10.1617/14134
Brencich, A., and Sabia, D. (2008). Experimental identification of a multi-span masonry bridge: the Tanaro Bridge. Constr. Build. Mater. 22, 2087–2099. doi: 10.1016/j.conbuildmat.2007.07.031
Caliò, I., Marletta, M., and Pantò, B. (2012). A new discrete element model for the evaluation of the seismic behaviour of unreinforced masonry buildings. Eng. Struct. 40, 327–338. doi: 10.1016/j.engstruct.2012.02.039
Cannizzaro, F., Pantò, B., Caddemi, S., and Caliò, I. (2018). A Discrete Macro-Element Method (DMEM) for the nonlinear structural assessment of masonry arches. Eng. Struct. 168, 243–256. doi: 10.1016/j.engstruct.2018.04.006
Casamassima, V. M., and D'amato, M. (2019). Fatigue assessment and deterioration effects on masonry elements: a review of numerical models and their application to a case study. Front. Built Enviton. 5, 1–10. doi: 10.3389/fbuil.2019.00065
Casas, J. R. (2009). A probabilistic fatigue strength model for brick masonry under compression. Const. Build. Mater. 23, 2964–2972. doi: 10.1016/j.conbuildmat.2009.02.043
Cavalagli, N., Gusella, V., and Severini, L. (2017). The safety of masonry arches with uncertain geometry. Comp. Struct. 188, 17–31. doi: 10.1016/j.compstruc.2017.04.003
Clark, G. W. (1994). Bridge analysis testing and cost causation project: serviceability of brick masonry. Brit. Rail Res. 151.
Da Porto, F., Tecchio, G., Zampieri, P., Modena, C., and Prota, A. (2016). Simplified seismic assessment of railway masonry arch bridges by limit analysis. Struct. Infrastruct. Eng. 12, 567–591. doi: 10.1080/15732479.2015.1031141
D'Altri, A. M., Sarhosis, V., Milani, G., Rots, J., Cattari, S., Lagomarsino, S., et al. (2019). Modeling strategies for the computational analysis of unreinforced masonry structures: review and classification. Arch. Computat. Methods Eng. doi: 10.1007/s11831-019-09351-x
D'amato, M., Laterza, M., and Casamassima, V. M. (2017). Seismic performance evaluation of a multi-span existing masonry arch bridge. Open Civil Eng. J. 11, 1191–1207. doi: 10.2174/1874149501711011191
De Felice, G., and De Santis, S. (2010). Experimental and numerical response of arch bridge historic masonry under eccentric loading. Int. J. Archit. Herit. 4, 115–137. doi: 10.1080/15583050903093886
De Santis, S., and de Felice, G. (2014). A fibre beam-based approach for the evaluation of the $seismic capacity of masonry arches Stefano. Earthq. Eng. Struct. Dyn. 1–6. doi: 10.1002/eqe
Galassi, S., Misseri, G., Rovero, L., and Tempesta, G. (2018a). Failure modes prediction of masonry voussoir arches on moving supports. Eng. Struct. 173, 706–717. doi: 10.1016/j.engstruct.2018.07.015
Galassi, S., Ruggieri, N., and Tempesta, G. (1839). “Ruins and archaeological artifacts: vulnerabilities analysis for their conservation through the original computer program BrickWORK,” in Structural Analysis of Historical Constructions, eds R. Aguilar, D. Torrealva, S. Moreira, M. Pando, and L. F. Ramos (Springer International Publishing). doi: 10.1007/978-3-319-99441-3_197
Galassi, S., Ruggieri, N., and Tempesta, G. (2018b). A novel numerical tool for seismic vulnerability analysis of ruins in archaeological sites. Int. J. Archit. Herit. 14, 1–22. doi: 10.1080/15583058.2018.1492647
Galassi, S., and Tempesta, G. (2019a). Safety evaluation of masonry arches. A numerical procedure based on the thrust line closest to the geometrical axis. Int. J. Mech. Sci. 155, 206–221. doi: 10.1016/j.ijmecsci.2019.02.036
Galassi, S., and Tempesta, G. (2019b). The matlab code of the method based on the full range factor for assessing the safety of masonry arches. Methods 6, 1521–1542. doi: 10.1016/j.mex.2019.05.033
Laterza, M., D'amato, M., and Casamassima, M. (2017). Stress-life curves method for fatigue assessment of ancient brick arch bridges. Int. J. Archit. Herit. 11, 843–858. doi: 10.1080/15583058.2017.1315621
Melbourne, C., Wang, J., and Tomor, A. K. (2007). A new masonry arch bridge assessment strategy (SMART). Proc. Inst. Civ. Eng. Bridg. Eng. 160, 81–87. doi: 10.1680/bren.2007.160.2.81
Midas Fea v1.1. (2016). Nonlinear and Detail FE Analysis System for Civil Structures. MIDAS Information Technology (MIDAS IT).
Milani, G., and Lourenço, P. B. (2012). 3D non-linear behavior of masonry arch bridges. Comput. Struct. 110–111, 133–50. doi: 10.1016/j.compstruc.2012.07.008
Pantò, B., Cannizzaro, F., Caddemi, S., and Caliò, I. (2016). 3D macro-element modelling approach for seismic assessment of historical masonry churches. Adv. Eng. Softw. 97, 40–59. doi: 10.1016/j.advengsoft.2016.02.009
Pelà, L., Aprile, A., and Benedetti, A. (2005). Seismic assessment of masonry arch bridges. Eng. Struct. 31, 331–353. doi: 10.1142/S1363246905002432
Pelà, L., Aprile, A., and Benedetti, A. (2013). Comparison of seismic assessment procedures for masonry arch bridges. Constr. Build. Mater. 38, 381–394. doi: 10.1016/j.conbuildmat.2012.08.046
Reccia, E., Milani, G., Cecchi, A., and Tralli, A. (2014). Full 3D homogenization approach to investigate the behavior of masonry arch bridges: the venice trans-lagoon railway bridge. Const. Build. Mater. 66, 567–586. doi: 10.1016/j.conbuildmat.2014.05.096
Rota, M., Pecker, A., Bolognini, D., and Pinho, R. (2010). A methodology for seismic vulnerability of masonry arch bridge walls. J. Earth Eng. 31, 1777–1788. doi: 10.1016/j.engstruct.2009.02.012
Scozzese, F., Ragni, L., Tubaldi, E., and Gara, F. (2019). Modal properties variation and collapse assessment of masonry arch bridges under scour action. Eng. Struct. 199:109665. doi: 10.1016/j.engstruct.2019.109665
Zampieri, P., Tecchio, G., da Porto, F., and Modena, C. (2015a). Limit analysis of transverse seismic capacity of multi-span masonry arch bridges. Bull. Earth Eng. 13, 1557–1579. doi: 10.1007/s10518-014-9664-3
Keywords: masonry arch bridges, seismic vulnerability, non-linear static analysis, non-linear kinematic analysis, rigid block analysis
Citation: Zampieri P, Perboni S, Tetougueni CD and Pellegrino C (2020) Different Approaches to Assess the Seismic Capacity of Masonry Bridges by Non-linear Static Analysis. Front. Built Environ. 6:47. doi: 10.3389/fbuil.2020.00047
Received: 13 December 2019; Accepted: 24 March 2020;
Published: 12 May 2020.
Edited by:
Antonio Formisano, University of Naples Federico II, ItalyReviewed by:
Stefano Galassi, University of Florence, ItalyMichele D'amato, University of Basilicata, Italy
Copyright © 2020 Zampieri, Perboni, Tetougueni and Pellegrino. This is an open-access article distributed under the terms of the Creative Commons Attribution License (CC BY). The use, distribution or reproduction in other forums is permitted, provided the original author(s) and the copyright owner(s) are credited and that the original publication in this journal is cited, in accordance with accepted academic practice. No use, distribution or reproduction is permitted which does not comply with these terms.
*Correspondence: Paolo Zampieri, paolo.zampieri@dicea.unipd.it