High Pressure Behavior of Chromium and Yttrium Molybdate (Cr2Mo3O12, Y2Mo3O12)
 Lindsay Young
  Jennifer Gadient
 Cora Lind
- Department of Chemistry and Biochemistry, The University of Toledo, Toledo, OH, United States
The high pressure behavior of negative thermal expansion materials continues to be of interest, as their potential use in controlled thermal expansion composites can be affected by irreversible pressure-induced phase transitions. To date, it is not possible to predict the high pressure behavior of these compounds, necessitating measurements on each composition. In this work, high pressure synchrotron powder X-ray diffraction studies of Cr2Mo3O12 and Y2Mo3O12 were conducted in a diamond anvil cell. Chromium molybdate, which adopts the monoclinic P21/a structure under ambient conditions, was found to not undergo any crystalline-crystalline transitions up to 8.9 GPa. The orthorhombic ambient pressure polymorph of yttrium molybdate was found to undergo a phase transition to the monoclinic P21/a scandium tungstate structure below 0.13 GPa. This structure is frequently observed for related materials at low temperatures, but has never been reported for Y2Mo3O12. No additional changes in this material were observed up to 4.9 GPa. The fact that the monoclinic polymorphs of these materials do not undergo phase transitions within the studied pressure range makes them unique among A2M3O12 materials, as most isostructural compositions undergo at least one phase transition to crystalline high pressure phases.
Introduction
Thermal expansion describes the tendency of materials to change dimensions with increasing temperature. Due to longitudinal vibrations of atoms along atomic bonds as thermal energy is introduced, most materials expand. The thermal expansion coefficient α quantifies the magnitude of dimensional change over a specific temperature range. Mismatches in thermal expansion are a major concern in many engineering fields for any devices that combine two or more materials (Roy et al., 1989; Lommens et al., 2005; Takenaka, 2012). The differences in the magnitude of thermal expansion between two adhered materials can lead to degradation of devices with thermal cycling due to delamination at the interface. In addition, any optical or electronic applications where absolute dimensions are crucial for optimal performance require materials that display negligible expansion to ensure dimensional stability. These challenges have led to significant interest in materials that display negative thermal expansion (NTE) (Korthuis et al., 1995; Evans et al., 1996; Attfield and Sleight, 1998a,b; Lind et al., 1998, 2011; Sleight, 1998; Reisner et al., 2000; Li et al., 2002; Phillips et al., 2008; Chapman and Chupas, 2009; Kozy et al., 2009; Greve et al., 2010). It has been proposed that NTE materials when incorporated as fillers in composites would allow the overall expansion of the material to be reduced or tailored to a specific value (Verdon and Dunand, 1997; Holzer and Dunand, 1999; Matsumoto et al., 2003; Sullivan and Lukehart, 2005; Tani et al., 2007, 2010; Lind et al., 2011). This has been accomplished previously with zirconium tungstate as a filler in a ceramic zirconia optical fiber coating (Fleming et al., 1997). However, other attempts to prepare composites with tailored expansion coefficients have failed due to irreversible phase transitions of the NTE filler under the temperature and pressure conditions encountered during manufacturing or use. For example, a Cu/ZrW2O8 composite showed highly irreproducible expansion behavior due to formation of the orthorhombic high pressure phase of ZrW2O8, which displays positive volume expansion (Holzer and Dunand, 1999).
There are several classes of materials that display NTE properties. One of these is the scandium tungstate family. These materials are often referred to as the A2M3O12 family, which includes a wide range of compositions, as A can be any trivalent cation ranging in size from Al3+ to the smaller lanthanides, and M can be molybdenum or tungsten. These materials crystallize in corner-sharing networks of AO6 octahedra and MO4 tetrahedra, and many compositions form closely related monoclinic (P21/a-A2M3O12) and orthorhombic (Pbcn-A2M3O12) structures. NTE is only observed in the orthorhombic phase, and arises from concerted tilting motions of the polyhedra. The formation of the monoclinic and orthorhombic phases depends heavily on composition, and many compounds show a reversible transition between the monoclinic polymorph at low temperatures and the orthorhombic structure at high temperatures. The temperature at which this transition occurs varies widely with composition, and in extreme cases, materials can adopt the monoclinic or orthorhombic structures over their entire stability range. For instance, scandium tungstate, yttrium tungstate and yttrium molybdate (Nassau et al., 1971; Evans et al., 1998; Forster and Sleight, 1999; Marinkovic et al., 2005; Zhou et al., 2008) retain the orthorhombic structure to at least −263 to −258 °C, the lowest temperatures studied to date, while gallium molybdate remains monoclinic up to its decomposition temperature of 600 °C (Gates et al., 2006).
In addition to the corner-sharing orthorhombic and monoclinic polymorphs described above, denser structures with higher A-site coordination numbers, resulting in a combination of both corner- and edge-shared polyhedra, are known for compositions that contain the larger lanthanides lanthanum through terbium (Nassau et al., 1965, 1971). Yttrium's ionic radius falls between the ionic radii of the trivalent lanthanides that form the Pbcn structure and polymorphs with 7- or 8-coordinated A3+ cations, respectively (Shannon, 1976). As a result, yttrium molybdate can adopt two orthorhombic structures in space groups Pba2 and Pbcn under ambient conditions (Marinkovic et al., 2005; Gates and Lind, 2007). Pbcn-Y2Mo3O12 is thermodynamically stable above 550 °C but can be retained as a metastable phase by quenching to room temperature (Gates and Lind, 2007). This structure readily absorbs water from the atmosphere, leading to formation of a trihydrate, Y2Mo3O12·3H2O (Kol'tsova, 2001). The denser Pba2-phase is isostructural to Tb2Mo3O12, with a higher coordination number for Y and edge sharing YO7 polyhedra. The denser Pba2-Y2Mo3O12 polymorph is thermodynamically stable below 550 °C, but is kinetically disfavored, thus requiring long periods of annealing at 530 °C to prepare it. This structure does not hydrate (Gates and Lind, 2007).
Because NTE materials may need to withstand high pressures and temperatures during production and regular use of composites, it is important to characterize their behavior under non-ambient conditions for effective application. The open framework structure of these materials that gives rise to NTE is highly susceptible to pressure-induced changes. High pressure studies of a number of NTE materials have shown that they undergo phase transitions to high pressure polymorphs or amorphize (see Table 1 and references therein). These denser structures are not expected to exhibit NTE (Hu et al., 1997; Paraguassu et al., 2004; Garg et al., 2005b; Maczka et al., 2012), as the phonon modes that cause NTE require corner-sharing open frameworks. Irreversible phase transitions to high pressure polymorphs are thus detrimental for potential applications, while reversible phase transitions may be acceptable if they occur at pressures that are not encountered during use of composites.

Table 1. Current high pressure research on scandium tungstate family materials.
While a number of high pressure studies of A2M3O12 materials have been conducted, the knowledge of their high pressure behavior is not comprehensive. Some compositions are well characterized, but many are only partially characterized (e.g., In2Mo3O12, In1.5Y0.5Mo3O12, Lu2W3O12, Y2Mo3O12, see Table 1) or have not yet been studied (e.g., many Ln2M3O12, Cr2Mo2O12). Variations in data quality and experimental parameters have also led to conflicting results for the same materials (e.g., Al2W3O12, Sc2W3O12, Table 1). As such, the high pressure behavior of A2M3O12 materials remains unpredictable. One exception to this has been the observation that compositions adopting the orthorhombic structure at room temperature undergo a phase transition to the slightly denser P21/a-structure below 0.5 GPa (Paraguassu et al., 2004; Garg et al., 2005a; Varga et al., 2005a,b, 2006; Cetinkol et al., 2008; Varga, 2011; Lind, 2012; Maczka et al., 2012). Generally, at least one additional phase transition occurs at higher pressures between 1 and 4 GPa. Amorphization is commonly reported, which can be reversible or irreversible and shows onsets as low as 2.3 GPa or higher than 10 GPa (Garg et al., 2001, 2005a,b; Secco et al., 2001, 2002a,b; Liu et al., 2002; Arora et al., 2004, 2005; Karmakar et al., 2004; Mukherjee et al., 2004; Paraguassu et al., 2004; Varga et al., 2005a; Gates et al., 2006; Baiz et al., 2012; Torres Dias et al., 2013). Table 1 summarizes the current literature on high pressure behavior of A2Mo3O12compounds.
This paper reports the high pressure behavior of Cr2Mo3O12 and Pbcn-Y2Mo3O12. Cr2Mo3O12 is monoclinic at room temperature and displays positive expansion with αl = 9.8 × 10⁻⁶°C−1 up to 380 °C, where it undergoes a transition to the orthorhombic Pbcn polymorph. Above this temperature, NTE with αl = −9.4 × 10⁻⁶°C−1 is observed (Tyagi et al., 2002). Y2Mo3O12 adopts the orthorhombic structure at all temperatures, and shows NTE with αl = −9.0 × 10⁻⁶°C−1 from −253 to 177 °C (Marinkovic et al., 2009). No previous high pressure studies on chromium molybdate exist, while yttrium molybdate has been investigated by low resolution diffraction studies by our group and Raman spectroscopy by Torres Dias (Gates, 2008; Torres Dias et al., 2013). Our previous low resolution diffraction data showed no evidence of phase transitions until irreversible amorphization occurred at 2.3 GPa. It was surprising that no transition to the monoclinic polymorph was detected. However, the in situ Raman study conducted by Torres Dias et al. reported a phase transition at 0.3 GPa, followed by irreversible amorphization at 2.4 GPa. The Raman data suggested a change in symmetry from orthorhombic to monoclinic. In this work, higher resolution synchrotron diffraction data revealed that Pbcn-Y2Mo3O12 indeed undergoes a transition to the monoclinic P21/a structure at low pressure. The atomic coordinates were extracted by Rietveld analysis. Interestingly, P21/a-Y2Mo3O12 and Cr2Mo3O12 do not undergo any further crystalline-crystalline phase transitions before amorphization occurs. To our knowledge, this is the first report of relatively low density corner sharing polyhedral frameworks that remain stable under pressure.
Experimental
Cr2Mo3O12 and Pbcn-Y2Mo3O12 powders were synthesized using a non-hydrolytic sol-gel (NHSG) method as described previously (Gates et al., 2006; Gates and Lind, 2007; Gindhart, 2007; Baiz et al., 2008; Gates, 2008; Gindhart et al., 2008; Baiz, 2010). Well crystallized Cr2Mo3O12 was obtained after heat treatment to 500 °C, while Y2Mo3O12 required heating between 800 and 1,000 °C to achieve sharp peaks. Sample quality was confirmed by powder X-ray diffraction on a PANalytical X'Pert Pro Multipurpose Diffractometer. Phase pure samples with good crystallinity were chosen for the high pressure studies. Pbcn-Y2Mo3O12 has a strong tendency to absorb ambient moisture and form a trihydrate (Figure 1A), thus the material was freshly dried (Figure 1B), immediately transferred to a vial while hot and sealed with Parafilm.
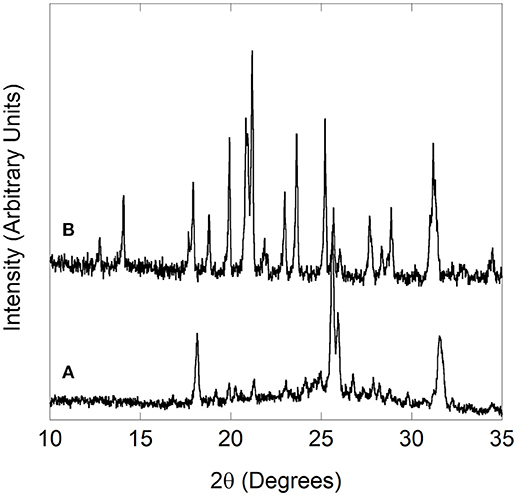
Figure 1. Yttrium molybdate (A) trihydrate formed upon exposure to atmospheric moisture, (B) Pbcn polymorph reformed after drying.
In situ high pressure powder diffraction studies were carried out at beamline 17-BM at the Advanced Photon Source at Argonne National Laboratory in an EasyLab “Diacell Bragg-(G)” diamond anvil cell (DAC). Data were collected with a 2-D Perkin Elmer a-Si C-window CCD detector during two separate trips. Cr2Mo3O12 was measured at a wavelength of 0.72808 Å and a detector distance of 400 mm. Y2Mo3O12 was investigated during a subsequent trip at a wavelength of 0.72959 Å with a larger detector distance of 600 mm to allow collection of data to smaller d-spacings. Both setups allowed even subtle changes in the PXRD patterns to be seen. Data were collected by averaging six individual 5 s exposures. Anhydrous isopropanol was chosen as a pressure transmitting fluid (PTF) with a hydrostatic limit of 4.2 GPa (Angel et al., 2007). While higher hydrostatic limits can be achieved (Klotz et al., 2009) with alcohol or alcohol/water mixtures (10.5 GPa) or some liquefied inert gases (N2: 10 GPa, Ne: 15 GPa, He: 40 GPa), these PTFs are not suitable for the study of many NTE materials. Water is known to penetrate the open frameworks of several NTE compounds, and may lead to formation of crystalline hydrates as observed for ZrW2O8·H2O (Duan et al., 1999; Banek et al., 2010) or Y2Mo3O12·3H2O (Kol'tsova, 2001; Marinkovic et al., 2005). While no crystalline methanol adducts have been reported, it is plausible that this molecule may also penetrate into open frameworks and impact the high pressure behavior. Similarly, atomic or diatomic gases may insert into the NTE frameworks, as has been demonstrated for CaZrF6 (Hester et al., 2017a).
The powders were finely ground using a mortar and pestle in an approximately 3:1 ratio with sodium chloride as an internal pressure calibrant. An EasyLab “Diacell Bragg-(G)” membrane diamond anvil cell with diamond culet faces measuring 500 microns was fitted to a 300 micron thick steel gasket pre-indented to 100 microns with a 250 micron hole. The sample was packed into the sample chamber, flooded with anhydrous isopropanol as a PTF, and the DAC was quickly sealed. To avoid hydration of Pbcn-Y2Mo3O12, this sample was packed in a glovebag under argon. An “asclosed” pattern was collected before attaching a stainless steel diaphragm to the cell, and a programmable methanol pump was used to gradually increase the pressure to 4.9 GPa (Y2Mo3O12) and 8.9 GPa (Cr2Mo3O12) while collecting data at pressure increments of approximately 0.02 to 0.2 GPa. After the highest pressure was reached, files were collected during decompression in approximately 1.0 GPa steps. Final pressures of 2.2 and 1.9 GPa were observed at the end of the runs for Cr2Mo3O12 and Y2Mo3O12, respectively. A “decompressed” pattern was collected after opening the cell to release any residual pressure. The pressure for each scan was determined from the refined NaCl lattice parameters using the equation of state published by Birch (Birch, 1986). This approach requires calculation of Eulerian strain using equation (1):
where f is the Eulerian strain, v is the cell volume at pressure P, and vo is the ambient pressure volume. The value for vo was determined to be 179.5864 Å3. The calculated values for f can then be used to determine pressure using equation (2):
where Ko is the bulk modulus at ambient temperature and a is a constant that depends on temperature. Literature values for Ko (239.9 kbar at 25 °C) and a (1.796 at 25 °C) were used (Birch, 1986).
The pressures reported in this manuscript are estimated to have errors of ± 0.1 GPa due to the continuous pressure increase during data collection, which results in each pattern being collected over a small range of pressures. The only exception are scans collected in the “asclosed” cell before attaching the diaphragm, for which we estimate an error of ± 0.02 GPa based on the uncertainty of the extracted lattice parameter of the standard.
Bulk moduli of all phases were estimated using the program PASCal using a 3rd order Birch–Murnaghan equation of state (Cliffe and Goodwin, 2012). For high pressure phases, the first pressure point at which a polymorph was observed was used as critical pressure.
Data Integration and Analysis
The 2-D data were integrated using GSAS-II (Toby and Von Dreele, 2013). A pattern of NIST LaB6 collected in the DAC was used to calibrate the detector distance and determine the penetration correction, which was necessary to correct a slight non-linear distortion of the data due to penetration of X-rays into the detector. The patterns were refined using Topas Academic (Bruker, 2006; Coelho, 2018), and consecutive refinements were conducted in command line mode by copying each output file to the input file for the next dataset. Rietveld refinements were carried out for all phases, as the atomic coordinates were either known or determined in the course of this work.
Results and Discussion
The high pressure behavior of Cr2Mo3O12 and Y2Mo3O12 was investigated in situ using synchrotron powder diffraction inside a DAC. During each experiment, the pressure was continuously increased. Different pressure programs were used during the two experiments, resulting in a pressure increase that was approximately twice as fast for Cr2Mo3O12 compared to Y2Mo3O12. Stack plots of all high pressure datasets and selected 1D diffraction patterns are displayed in Figures 2, 3.
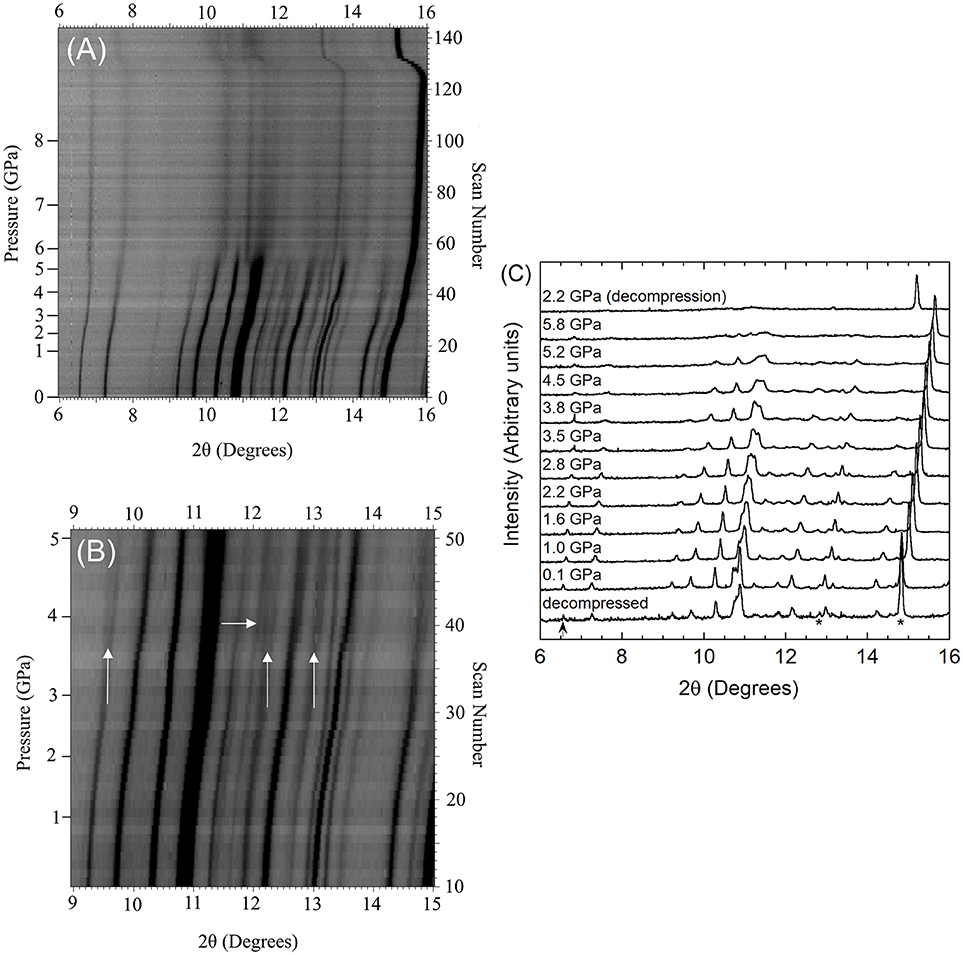
Figure 2. (A,B) Stacked 2D overlays of all high pressure data and (C) selected patterns for Cr2Mo3O12 collected during compression unless stated otherwise. In (C), NaCl peaks are indicated by * in the pattern collected after decompression, and the strongest peak of the unidentified impurity phase is marked with an arrow. Vertical arrows in (B) mark peaks that broaden significantly compared to other Cr2Mo3O12 peaks, while the horizontal arrow indicates an area of peak coalescence.
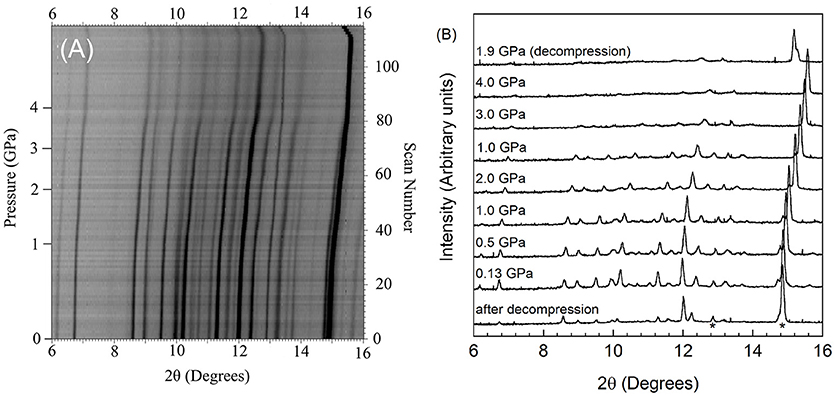
Figure 3. (A) Stacked 2D overlay of all high pressure data and (B) selected patterns for Pbcn-Y2Mo3O12 collected during compression and after decompression. In (B), NaCl peaks are indicated by * in the pattern collected after decompression.
The scans collected upon sealing the DAC showed that the materials were under a small amount of pressure at the beginning of data collection, as the diamond anvil cell must be tightened enough to avoid evaporation of the PTF. The pressure of the first dataset was 0.05 GPa for Cr2Mo3O12 and 0.13 GPa for Pbcn-Y2Mo3O12, respectively. Data were collected up to 8.9 GPa for Cr2Mo3O12 with 0.05 to 0.2 GPa increments, and up to 4.9 GPa for Pbcn-Y2Mo3O12 with 0.02 to 0.1 GPa increments between patterns. Inspection of the PXRD overlays showed that the peaks steadily shifted to higher angles with increasing pressure (Figures 2, 3). Visual inspection of the data did not show any obvious signs of reconstructive phase transitions to distinct crystalline high pressure polymorphs, such as peak splitting, coalescence, or abrupt changes in the pattern. At sufficiently high pressures, the peaks became progressively broader in both materials.
Diffraction data for chromium molybdate were collected up to 8.9 GPa (scan 126, Figure 2A), although the conditions became non-hydrostatic above 4.2 GPa (scan 44) due to the hydrostatic limit of isopropanol. The patterns collected at lower pressures showed comparable shifts to higher angles for all peaks, suggesting relatively isotropic compressibility of Cr2Mo3O12 along all three unit cell axes. Close inspection of the stacked data overlay revealed some subtle changes in the 3 to 4 GPa pressure range (see arrows in Figure 2B). Scan 38 (3.6 GPa) shows noticeable broadening of several peaks (e.g., 9.5, 12.3, and 13.2°), while other peaks coalesce with neighboring peaks (e.g., 12–12.2°). As these changes were not observed at lower pressures, this suggests that a subtle phase transition to a closely related structure occurred.
The data range displayed in Figure 2A contains two peaks that belong to the pressure standard NaCl, which are found at 12.8 and 14.8° 2θ at the beginning of the experiment (scan 0) and persist as well-defined peaks in all scans. In contrast, the Cr2Mo3O12 peaks start to become progressively diffuse above 5.5 GPa (scan 54), indicating the onset of disorder or amorphization. Many NTE materials have been reported to amorphize under pressure (Huang, 1998; Perottoni and da Jornada, 1998; Garg et al., 2001, 2005b; Liu et al., 2001, 2002; Secco et al., 2001, 2002a,b; Arora et al., 2004, 2005; Karmakar et al., 2004; Mukherjee et al., 2004; Paraguassu et al., 2004; Varga et al., 2005b; Gates et al., 2006; Keen et al., 2007; Catafesta et al., 2008; Cetinkol et al., 2009; Baiz et al., 2012; Torres Dias et al., 2013; Salke et al., 2018), especially under non-hydrostatic conditions, as their open frameworks allow for volume-reducing rotations of the constituent polyhedra. Under non-hydrostatic pressure, such random reorientations can become “frozen in” at relatively low pressures, resulting in progressive loss of long range order. In most materials, amorphization is irreversible upon decompression. In this work, data were also collected during decompression (scans 127-144). The final dataset during the Cr2Mo3O12 high pressure experiment was collected at a residual pressure of 2.2 GPa, and showed only NaCl peaks and very broad features resembling an amorphous material (Figure 2C). However, complete release of the pressure by opening the cell resulted in recovery of crystallinity, suggesting that the material does not completely disorder (Figure 2C).
Lattice constants as a function of pressure were extracted by Rietveld refinement. The pattern collected after closing the cell gave a good match to the PDF view cards of monoclinic Cr2Mo3O12 (01-078-1654) and cubic NaCl (01-077-2064), and these phases were used as starting models for refinements. The patterns contained intensity spikes due to sample graininess, indicating that data quality was not optimal. Throughout the data set, several unidentified peaks at 6.6, 16.9, 19.4, 25.2, and 29.5° persisted. These peaks were of low intensity (see arrow in Figure 2C for most intense peak) and could not be identified as belonging to any known impurity phases, nor any known parts of the instrumental setup such as the diamond, mounting clay, or steel. It was evident that these features shifted significantly less than the chromium molybdate peaks, and persisted as sharper peaks even above the hydrostatic limit. This behavior suggests that these peaks are either due to diffraction from a material not experiencing the same pressure as the sample, or from a very hard impurity phase. Although they could not be identified, the peaks were of such low intensity that they did not interfere with Rietveld analysis.
At the lowest pressure, the data were refined using the monoclinic α-Cr2Mo3O12 phase (Figure 4A). Bond distance restraints were necessary to vary atomic positions without losing polyhedral connectivity. Refinements with restraints resulted in slightly distorted polyhedra, but preserved the overall connectivity. After initial optimization, atom positions were fixed before running consecutive refinements to avoid potentially disastrous changes. All scans with discernible peaks could be fitted using the α-phase model. Refinement quality decreased at higher pressures as peaks began to broaden above 4.0 GPa, with only very broad features remaining above 5.0 GPa (Figure 2C). This pressure range extends above the hydrostatic limit of isopropanol, which is 4.2 GPa. The changes in lattice parameters and volume (Figure 5) were extracted up to 5.0 GPa. Linear behavior was observed up to ~3.5 GPa, at which point a discontinuity or a change in slope occurred for all lattice parameters. A small but distinct increase in the a parameter was observed, followed by a continued decrease at a slightly lower rate. In contrast, a small stepwise decrease of the b-parameter preceded a steepening of the compressibility slope. The evolution of the c-parameter was almost continuous. This suggested a subtle structural distortion, which is supported by the observed anisotropic peak shifts in the data (Figure 2B). A full structural refinement of a selected dataset was carried out above this subtle phase transition using the ambient monoclinic structure of Cr2Mo3O12 as a starting point. Only the metal positions could be varied despite using bond distance restraints due to the lower data quality. A good fit was achieved (Figure 4B), corroborating that a closely related structure was formed. Similar transitions have been observed in Al2Mo3O12, AlGaMo3O12, Fe2Mo3O12, and FeAlMo3O12 (Young et al., 2016), where the compressibility of the unit cell axes changed at pressures between 1.5 and 3 GPa, but structural refinements using the original α-phase model remained stable. In addition, these four compounds underwent a second transition to a γ-phase at pressures between 2.7 and 4.9 GPa, which involved a small discontinuity in several lattice parameters as well as the cell volume. All three phases could be described with the ambient pressure P21/a monoclinic structure model. The pressure for the α- to α'- and α'- to γ-transitions correlated well with the average ionic radius of the A3+ cation in the previous study, with larger cations resulting in a lower transition pressure. The α- to α'- transition was in all cases accompanied by significant stiffening of the c-axis, while the a- and b axes softened, stiffened or remained largely unaffected depending on composition. In contrast, c-axis compressibility remained similar in the α'- and γ-phases, while the b-axis softened by about 30%.
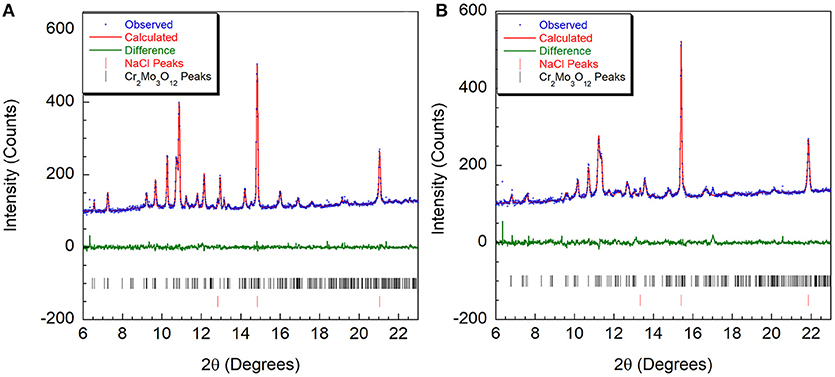
Figure 4. Rietveld plots of Cr2Mo3O12 data collected at (A) 0.05 GPa and (B) 3.7 GPa refined using the P21/a structure.
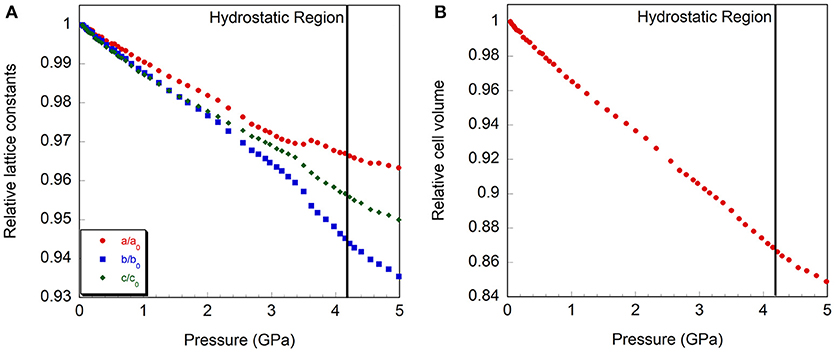
Figure 5. Relative compressibility of Cr2Mo3O12, (A) cell axes and (B) volume. The hydrostatic limit is indicated by a vertical line.
The small discontinuity observed in the lattice constants of Cr2Mo3O12 suggests that the transition observed should be compared to the formation of the γ-phase in Al2Mo3O12, AlGaMo3O12, Fe2Mo3O12 and FeAlMo3O12, even though no stepwise decrease in cell volume is observed due to the combination of significant a-axis stiffening, b-axis softening and unaffected c-axis compressibility. The change in compressibility of the b- and c-axes between α-Cr2Mo3O12 and γ-Cr2Mo3O12 is comparable to what was observed in the previously studied compositions, while the significant stiffening of the a-axis is much more pronounced than the changes in Al2Mo3O12, AlGaMo3O12, Fe2Mo3O12, and FeAlMo3O12. The transition pressure of ~3.5 GPa is similar to the 3.2 GPa transition pressure reported for the formation of γ-FeAlMo3O12 (Young et al., 2016). The ionic radius of Cr3+ in octahedral coordination is 61 pm, which is comparable to the average ionic radius of an equimolar mixture of Fe3+ and Al3+ in octahedral coordination (59.5 pm).
Separate compressibility constants were extracted for the pressure ranges corresponding to the α- and γ-phases of Cr2Mo3O12 to avoid contributions from the phase transition. Compressibility constants for α-Cr2Mo3O12 were extracted from 0.05 to 3.4 GPa, and were found to be βα, a = 0.93 ± 0.01 × 10⁻² GPa−1, βα, b = 1.19 ± 0.01 × 10⁻² GPa−1, βα, c = 1.01 ± 0.01 × 10⁻² GPa−1, and βα, v = 3.13 ± 0.02 × 10⁻² GPa−1. For γ−Cr2Mo3O12, these values changed to βγ, a = 0.64 ± 0.02 × 10⁻² GPa−1, βγ, b = 1.51 ± 0.04 × 10⁻² GPa−1, βγ, c = 0.99 ± 0.02 × 10⁻² GPa−1, and βγ, v = 3.08 ± 0.04 × 10⁻² GPa−1 for the 3.6 to 4.5 GPa pressure range, indicating that the overall volume compressibility decreased slightly. Above 4.5 GPa, stiffening of all lattice constants was observed. The compressibility of α-Cr2Mo3O12 is close to isotropic, with b slightly softer than the other axes. This is similar to other scandium tungstate materials (Liu et al., 2003; Varga et al., 2006; Young et al., 2016). Above the subtle phase transition, the compressibility becomes considerably more anisotropic. The bulk moduli of the α- and γ-phases were found to be 28.7 ± 0.4 GPa and 26.3 ± 1.2 GPa, respectively, indicating almost negligible stiffening at high pressure.
Yttrium molybdate patterns were collected at pressures up to 4.9 GPa (scan 110), which is slightly higher than the hydrostatic limit of isopropanol. No distinct phase transitions were observed in the scan overlay (Figure 3A), and all peaks shifted uniformly to higher angles with increasing pressure, indicating isotropic compressibility of all lattice constants. Peaks belonging to the NaCl pressure standard remained sharp throughout the experiment, while the Y2Mo3O12 peaks became broader and less intense above 3.8 GPa (scan 80), which is close to the hydrostatic limit for isopropanol. Peaks remained broad throughout decompression (scans 111-115) to 1.9 GPa. Integrated patterns showed broader and weaker features as pressure was increased, and the scan collected at the end of the high pressure run [1.9 GPa (decompression)] remained largely featureless except for NaCl peaks (Figure 3B). Upon complete release of pressure by opening the cell, crystallinity was recovered, but peaks remained broader and weaker, indicating that some irreversible structural damage occurred.
Initially, a Rietveld refinement starting from the Pbcn structure was attempted for the as-closed dataset collected at 0.13 GPa. A reasonable fit could only be achieved after varying the atomic positions. This resulted in a cell with lattice constants of a = 13.53 Å, b = 9.81 Å, and c = 9.94 Å. However, two peaks remained unaccounted for (Figure 6A), and inspection of the refined structure revealed that the atoms had moved far enough to no longer form recognizable polyhedra. This held true even when constraints were applied. Additionally, the unit cell parameters indicated that a 4.4% reduction in unit cell volume had occurred when compared to the ambient pressure cell constants. This reduction in unit cell volume was much higher than expected based on the compressibility of other orthorhombic A2Mo3O12 compounds, and suggested that a transition to the structurally related higher density P21/a polymorph may have occurred below 0.13 GPa. This agrees with a previous Raman study by Torres Dias et al. (2013), which suggested that Pbcn-Y2Mo3O12 underwent a transition to a lower symmetry phase below 0.3 GPa. It is not surprising that this transition would occur at such a low pressure, as previous studies have shown that Sc2W3O12 (Garg et al., 2005a; Varga et al., 2005b, 2006; Cetinkol et al., 2008), Sc2Mo3O12 (Varga et al., 2005a) and Al2W3O12 (Varga et al., 2005a) behave similarly and undergo this transition at 0.3 GPa, 0.25 GPa and 0.1 GPa, respectively. Initial unit cell parameters for the corresponding monoclinic unit cell were estimated based on the known transformation matrix (Evans and Mary, 2000), and combined with the atomic coordinates of α−Fe2Mo3O12 as a starting model for a Rietveld refinement. Soft distance restraints were applied to stabilize the refinement, which resulted in an excellent fit with final unit cell parameters of a = 16.726 Å, b = 9.943 Å, c = 19.643 Å, and β = 125.77°. Reasonable bond distances that preserved the polyhedral connectivity were obtained, confirming that a phase transition to monoclinic ε-Y2Mo3O121 had occurred (Figure 6B). Some distortion of the polyhedra was evident, although this could also be a result of the limited data quality. The final atomic coordinates obtained for the 0.13 GPa dataset are provided in Table 2. As no evidence of further phase transitions was observed, consecutive Rietveld refinements of all scans up to the highest pressure were carried out using the monoclinic ε-Y2Mo3O12 cell. Atomic positions were fixed for these consecutive refinements. Linear compressibility was observed up to 3.7 GPa (Figure 7). Above this pressure, peak broadening and the resulting deteriorating refinement quality made extraction of lattice constants unreliable, which was evident from significant increases in their statistical errors. While quantitative analysis at pressures above 3.7 GPa is not feasible, the evolution of lattice parameters suggests that the material softens in this pressure range. Most materials get stiffer at high pressures due to reduction of empty space upon compression. However, pressure induced softening has been observed in a number of NTE material (Pantea et al., 2006; Fang and Dove, 2013, 2014; Fang et al., 2013; Morelock et al., 2013; Gallington et al., 2014; Hancock et al., 2015; Alabarse et al., 2017; Hester et al., 2017b; Ticknor et al., 2018), and has been linked to the facile polyhedral rotations that give rise to their expansion behavior. In many cases, amorphization is preceded by pressure induced softening as well. To avoid contributions from this region, the relative compressibilities were extracted for the 0.13 to 3.7 GPa pressure range, giving values of βε, a = 1.39 ± 0.004 × 10⁻² GPa−1, βε, b = 1.09 ± 0.003 × 10⁻² GPa−1, βε, c = 1.26 ± 0.01 × 10⁻² GPa−1, and βε, v = 3.57 ± 0.01 × 10⁻² GPa−1. In contrast to other materials in the scandium tungstate family that are most compressible along the b-axis, the P21/a-Y2Mo3O12 phase is stiffest along the b-axis. The bulk modulus was estimated to be 24.8 ± 0.2 GPa, which is similar to other A2M3O12 compositions studied.
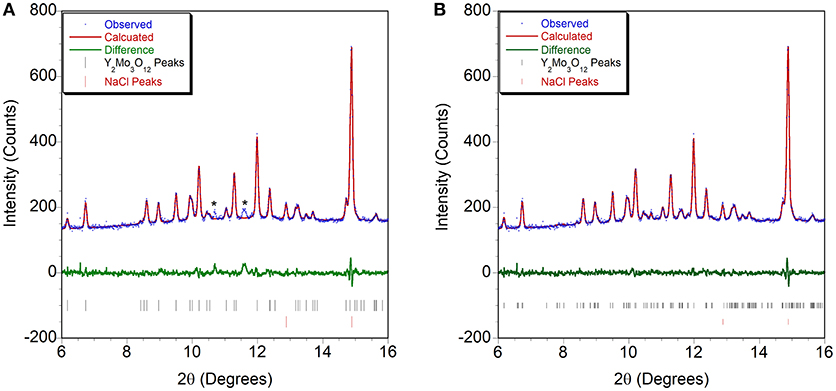
Figure 6. Rietveld plots of PXRD data collected at 0.13 GPa refined using structural models in space groups (A) Pbcn and (B) P21/a. * indicates peaks that cannot be accounted for by the orthorhombic cell.
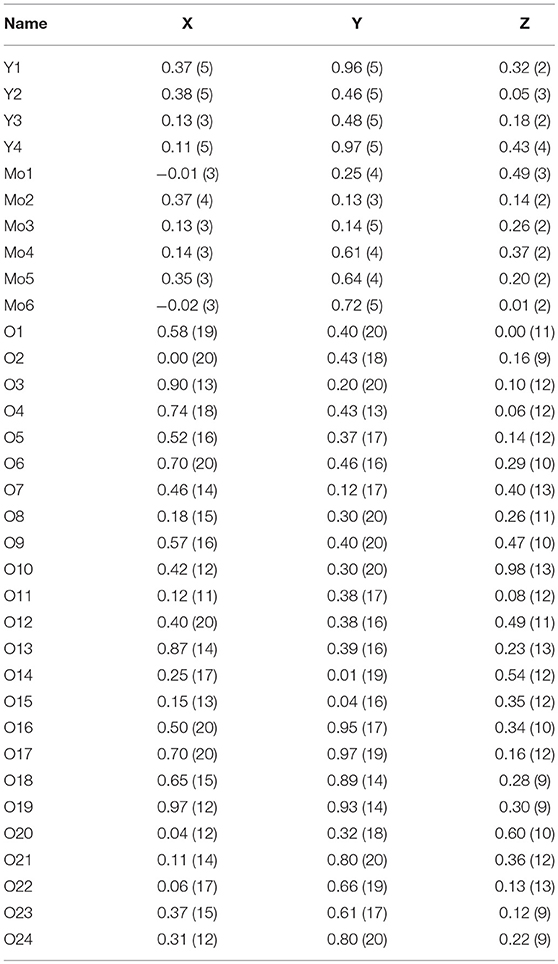
Table 2. Atomic coordinates for monoclinic Y2Mo3O12 at 0.13 GPa (space group P21/a).
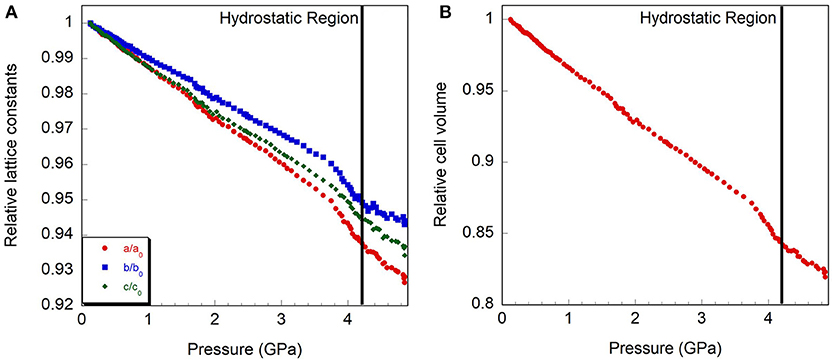
Figure 7. Relative compressibility of monoclinic Y2Mo3O12, (A) cell axes and (B) volume. The hydrostatic limit is indicated by a vertical line.
The fact that the monoclinic phases of Cr2Mo3O12 and Y2Mo3O12 remain stable up to high pressures has interesting implications for potential uses of these materials in controlled thermal expansion applications. While the monoclinic phases observed throughout the high pressure experiment display positive expansion under ambient pressure, it is known that heating can induce the monoclinic-to-orthorhombic transition in almost all monoclinic A2M3O12 compositions. This suggests that applications at increased temperatures may see a reversion to the orthorhombic structure under moderate pressures. Such temperature/pressure dependent phase transitions were observed for ZrV2O7 (Gallington et al., 2017), which shows positive expansion in a 3 × 3 × 3 superstructure below 100 °C and NTE in a simple cubic cell at higher temperatures. Chapman and Chupas have estimated that NTE materials are likely to be subjected to pressures of ~1 GPa when used in composites (Chapman and Chupas, 2007). At this pressure, the majority of A2M3O12 compositions studied adopt the monoclinic P21/a phase (Table 1). However, heating under pressure can also provide the necessary energy to overcome kinetic barriers to the formation of denser polymorphs, the existence of which has been reported for many compositions (Table 1). Such transformations may affect potential uses of Y2Mo3O12, as the thermodynamically stable polymorph (Pba2) below 550 °C is denser than the Pbcn- and P21/a-phases (Gates and Lind, 2007). In contrast, no denser phases are known for Cr2Mo3O12. It would be interesting to study the behavior of this material in pressure-temperature space to determine the orthorhombic-monoclinic phase boundary.
Conclusions
High pressure studies of Pbcn-yttrium molybdate and chromium molybdate were conducted up to 4.9 and 8.9 GPa, respectively. Pbcn-yttrium molybdate underwent a phase transition to a monoclinic P21/a phase below 0.13 GPa. This is the first time that this polymorph has been structurally characterized. The monoclinic P21/a structures of both compounds are remarkably stable and do not undergo abrupt structural phase transitions upon compression. This is unexpected, as most previously investigated isostructural A2M3O12 materials underwent at least one distinct pressure induced phase transition. Changes in the evolution of lattice constants and compressibility as a function of pressure suggest that Cr2Mo2O12 may undergo a subtle structural distortion similar to what is observed for Al2Mo3O12, AlGaMo3O12, Fe2Mo3O12, and FeAlMo3O12, while no such changes were observed for P21/a-Y2Mo3O12.
It is currently unclear what property of the A-site cation causes the remarkable stability of the P21/a polymorph in these compounds and thus whether other compositions may exhibit this behavior as well. While the monoclinic phases are not expected to exhibit NTE, their stability under pressure has important implications for composite fabrication, as the facile back-conversion to the orthorhombic phase during decompression or heating would reverse any detrimental changes that could occur during composite formation. These materials could find applications in controlled thermal expansion applications at slightly elevated temperatures, which is expected to favor the orthorhombic NTE phase even under pressure. While Y2Mo3O12 may convert to the denser Pba2-structure at moderate temperatures and pressures, the exceptional stability of Cr2Mo3O12 upon compression with respect to both formation of denser crystalline polymorphs and amorphization makes this material an attractive target.
Author Contributions
CL devised the experiments, trained students on synthesis and characterization, participated in high pressure experiments, data collection and analysis as well as writing of paper. LY selected samples for high pressure experiments, participated in high pressure experiments, data collection and analysis as well as writing of paper. JG participated in high pressure experiments, data collection and analysis.
Conflict of Interest Statement
The authors declare that the research was conducted in the absence of any commercial or financial relationships that could be construed as a potential conflict of interest.
Acknowledgments
This work is based upon research conducted at the Argonne National Laboratory Advanced Photon Source, which is supported by the U.S. Department of Energy, Office of Science, Office of Basic Energy Sciences, under Contract No. DE-AC02-06CH11357. The authors acknowledge NSF Grants DMR-0545517 and CRIF-0840474 for providing funds for this research.
Footnotes
1. ^Under ambient conditions, Y2Mo3O12 may form Pba2 α−Y2Mo3O12 or Pbcn β−Y2Mo3O12, depending on synthetic conditions. High pressure studies of both materials have been published. Two high pressure phases were observed to evolve from the Pba2 phase, γ and δ. The Pbcn phase was shown to undergo a transition to the monoclinic P21/a structure, designated the ε-phase.
References
Achary, S. N., Mukherjee, G. D., Tyagi, A. K., and Vaidya, S. N. (2002). Preparation, thermal expansion, high pressure and high temperature behavior of Al2(WO4)3. J. Mater. Sci. 37, 2501–2509. doi: 10.1023/A:1015487406446
Alabarse, F. G., Silly, G., Brubach, J. B., Roy, P., Haidoux, A., Levelut, C., et al. (2017). Anomalous compressibility and amorphization in AlPO4-17, the oxide with the highest negative thermal expansion. J. Phys. Chem. C 121, 6852–6863. doi: 10.1021/acs.jpcc.7b00974
Angel, R. J., Bujak, M., Zhao, J., Gatta, G. D., and Jacobsen, S. D. (2007). Effective hydrostatic limits of pressure media for high-pressure crystallographic studies. J. Appl. Crystallogr. 40, 26–32. doi: 10.1107/S0021889806045523
Arora, A. K., Nithya, R., Yagi, T., Miyajima, N., and Mary, T. A. (2004). Two-stage amorphization of scandium molybdate at high pressure. Solid State Commun. 129, 9–13. doi: 10.1016/j.ssc.2003.08.032
Arora, A. K., Yagi, T., Miyajima, N., and Mary, T. A. (2005). Amorphization and decomposition of scandium molybdate at high pressure. J. Appl. Phys. 97:013508. doi: 10.1063/1.1819975
Attfield, M. P., and Sleight, A. W. (1998a). Exceptional negative thermal expansion in AlPO4-17. Chem. Mater. 10, 2013–2019. doi: 10.1021/cm9801587
Attfield, M. P., and Sleight, A. W. (1998b). Strong negative thermal expansion in siliceous faujasite. Chem. Commun. 601–602. doi: 10.1039/a707141h
Baiz, T. I. (2010). Non-Hydrolytic Sol-Gel Synthesis and Characterization of Materials of the Type AA'M3O12. Doctor of Philosophy Ph. D. The University of Toledo.
Baiz, T. I., Gindhart, A. M., Kraemer, S. K., and Lind, C. (2008). Synthesis of MgHf(WO4)3 and MgZr(WO4)3 using a non-hydrolytic sol-gel method. J Sol-Gel Sci Technol. 47, 128–130. doi: 10.1007/s10971-008-1765-5
Baiz, T. I., Heinrich, C. P., Banek, N. A., Vivekens, B. L., and Lind, C. (2012). In Situ non-ambient x-ray diffraction studies of indium tungstate. J. Solid State Chem. 187, 195–199. doi: 10.1016/j.jssc.2012.01.019
Banek, N. A., Baiz, H. I., Latigo, A., and Lind, C. (2010). Autohydration of nanosized cubic zirconium tungstate. J Am Chem Soc. 132, 8278–8279. doi: 10.1021/ja101475f
Birch, F. (1986). Equation of state and thermodynamic parameters of NaCl to 300-kbar in the high-temperature domain. J. Geophys. Res. Solid 91, 4949–4954. doi: 10.1029/JB091iB05p04949
Catafesta, J., Haines, J., Zorzi, J. E., Pereira, A. S., and Perottoni, C. A. (2008). Pressure-induced amorphization and decomposition of FeCo(CN)(6). Phys. Rev. B 77:064104. doi: 10.1103/PhysRevB.77.064104
Cetinkol, M., Wilkinson, A. P., and Chapman, K. W. (2008). Scandium tungstate above 2.5 GPa. Solid State Commun. 148, 511–515. doi: 10.1016/j.ssc.2008.10.002
Cetinkol, M., Wilkinson, A. P., and Lind, C. (2009). In Situ high-pressure synchrotron X-ray diffraction study of Zr2(WO4)(PO4)2 Up To 16 GPa. Phys. Rev. B 79:224118. doi: 10.1103/PhysRevB.79.224118
Chapman, K. W., and Chupas, P. J. (2007). Pressure enhancement of negative thermal expansion behavior and induced framework softening in zinc cyanide. J. Amer. Chem. Soc. 129, 10090–10091. doi: 10.1021/ja073791e
Chapman, K. W., and Chupas, P. J. (2009). Anomalous thermal expansion of cuprites: a combined high resolution pair distribution function and geometric analysis. Chem. Mater. 21, 425–431. doi: 10.1021/cm802900t
Cliffe, M. J., and Goodwin, A. L. (2012). PASCal: a principal axis strain calculator for thermal expansion and compressibility determination. arXiv:1204.3007 45, 1321–1329.
Coelho, A. (2018). TOPAS and TOPAS-Academic: an optimization program integrating computer algebra and crystallographic objects written in C++ J. Appl. Crystallograp. 51, 210–218. doi: 10.1107/S1600576718000183
Duan, N., Kameswari, U., and Sleight, A. W. (1999). Further contraction of ZrW2O8. JACS 121, 10432–10433.
Evans, J. S. O., and Mary, T. A. (2000). Structural phase transitions and negative thermal expansion in Sc2(MoO4)3. Int. J. Inorg. Mater. 2, 143–151. doi: 10.1016/S1466-6049(00)00012-X
Evans, J. S. O., Mary, T. A., and Sleight, A. W. (1998). Negative thermal expansion in Sc2(WO4)3. J. Solid State Chem. 137, 148–160. doi: 10.1006/jssc.1998.7744
Evans, J. S. O., Mary, T. A., Vogt, T., Subramanian, M. A., and Sleight, A. W. (1996). Negative thermal expansion in ZrW2O8 and HfW2O8. Chem. Mater. 8, 2809–2823. doi: 10.1021/cm9602959
Fang, H., and Dove, M. T. (2013). Pressure-induced softening as a common feature of framework structures with negative thermal expansion. Phys. Rev. B 87:214109. doi: 10.1103/PhysRevB.87.214109
Fang, H., and Dove, M. T. (2014). A phenomenological expression to describe the temperature dependence of pressure-induced softening in negative thermal expansion materials. J Phys Condens Matter 26:115402. doi: 10.1088/0953-8984/26/11/115402
Fang, H., Phillips, A. E., Dove, M. T., Tucker, M. G., and Goodwin, A. L. (2013). Temperature-dependent pressure-induced softening in Zn(CN)(2). Phys. Rev. B 88:144103. doi: 10.1103/PhysRevB.88.144103
Fleming, D. A., Johnson, D. W., and Lemaire, P. J. (1997). Article Comprising a Temperature Compensated Optical Fiber Refractive Index Grating. USA 5,694,503 patent application.
Forster, P. M., and Sleight, A. W. (1999). Negative thermal expansion in Y2W3O12. Int. J. Inorg. Mater. 1, 123–127. doi: 10.1016/S1466-6049(99)00021-5
Gallington, L. C., Chapman, K. W., Morelock, C. R., Chupas, P. J., and Wilkinson, A. P. (2014). Dramatic softening of the negative thermal expansion material HfW2O8 upon heating through its WO4 orientational order-disorder phase transition. J. Appl. Phys. 115:053512. doi: 10.1063/1.4864258
Gallington, L. C., Hester, B. R., Kaplan, B. S., and Wilkinson, A. P. (2017). Pressure-dependence of the phase transitions and thermal expansion in zirconium and hafnium pyrovanadate. J. Solid State Chem. 249, 46–50. doi: 10.1016/j.jssc.2017.02.014
Garg, N., Murli, C., Taru, B., Karmakar, S., Tyagi, A. K., and Sharma, S. M. (2001). Pressure induced phase transitions in Sc2(WO4)3 and Al2(WO4)3. Solid State Phys. 44, 39–40.
Garg, N., Murli, C., Tyagi, A. K., and Sharma, S. M. (2005a). Phase Transitions In Sc2(WO4)3 Under High Pressure. Phys. Rev. B 72, 064106. doi: 10.1103/PhysRevB.72.064106
Garg, N., Panchal, V., Tyagi, A. K., and Sharma, S. M. (2005b). Pressure-induced phase transitions in Al2(WO4)3. J. Solid State Chem. 178, 998–1002. doi: 10.1016/j.jssc.2004.11.024
Gates, S. D. (2008). Cation Influence of Negative Thermal Expansion In the A2M3O12 Family. Doctor of Philosophy in Chemistry Ph.D. The University of Toledo.
Gates, S. D., Colin, J. A., and Lind, C. (2006). Non-hydrolytic sol-gel synthesis, properties, and high-pressure behavior of gallium molybdate. J. Mater. Chem. 16, 4214–4219. doi: 10.1039/B608864C
Gates, S. D., and Lind, C. (2007). Polymorphism in yttrium molybdate Y2Mo3O12. J. Solid State Chem. 180, 3510–3514. doi: 10.1016/j.jssc.2007.10.011
Gindhart, A. M. (2007). Synthesis and Characterization of AA'W3O12 Compounds. Masters of Science in Chemistry Masters, The University of Toledo.
Gindhart, A. M., Lind, C., and Green, M. (2008). Polymorphism in the negative thermal expansion material magnesium hafnium tungstate. J. Mater. Res. 23, 210–213. doi: 10.1557/JMR.2008.0013
Greve, B. K., Martin, K. L., Lee, P. L., Chupas, P. J., Chapman, K. W., and Wilkinson, A. P. (2010). Pronounced negative thermal expansion from a simple structure: cubic ScF3. J. Am. Chem. Soc. 132, 15496–15498. doi: 10.1021/ja106711v
Hancock, J. C., Chapman, K. W., Halder, G. J., Morelock, C. R., Karlan, B. S., Gallington, L. C., et al. (2015). Large negative thermal expansion and anomalous behavior on compression in cubic ReO3-type A(II)B(IV)F(6): CaZrF6 and CaHfF6. Chem. Mater. 27, 3912–3918. doi: 10.1021/acs.chemmater.5b00662
Hester, B. R., Dos Santos, A. M., Molaison, J. J., Hancock, J. C., and Wilkinson, A. P. (2017a). Synthesis of defect perovskites (He2−x□(x))(CaZr)F6 by inserting helium into the negative thermal expansion material CaZrF6. J. Am. Chem. Soc. 139, 13284–13287. doi: 10.1021/jacs.7b07860
Hester, B. R., Hancock, J. C., Lapidus, S. H., and Wilkinson, A. P. (2017b). Composition, response to pressure, and negative thermal expansion in (MBF6)-B-II-F-IV (M = Ca, Mg; B = Zr, Nb). Chem. Mater. 29, 823–831. doi: 10.1021/acs.chemmater.6b04809
Holzer, H., and Dunand, D. C. (1999). Phase transformation and thermal expansion of Cu/ZrW2O8 metal matrix composites. J. Mater. Res. 14, 780–789. doi: 10.1557/JMR.1999.0104
Hu, Z., Jorgensen, J. D., Teslic, S., Short, S., Argyriou, D. N., Evans, J. S. O., et al. (1997). Pressure-induced phase transformation in ZrW2O8 - Compressibility and thermal expansion of the orthorhombic phase. Physica B 241, 370–372. doi: 10.1016/S0921-4526(97)00591-7
Huang, Y. M. (1998). IR spectroscopic study of the effects of high pressure on zeolites Y, A and sodalite. J. Mater. Chem. 8, 1067–1071. doi: 10.1039/a707631b
Karmakar, S., Deb, S. K., Tyagi, A. K., and Sharma, S. M. (2004). Pressure-induced amorphization in Y2(WO4)3: In Situ X-ray diffraction and raman studies. J. Solid State Chem. 177, 4087–4092. doi: 10.1016/j.jssc.2004.08.020
Keen, D. A., Goodwin, A. L., Tucker, M. G., Dove, M. T., Evans, J. S. O., Crichton, W. A., et al. (2007). Structural description of pressure-induced amorphization in ZrW2O8. Phys. Rev. Lett. 98:225501. doi: 10.1103/PhysRevLett.98.225501
Klotz, S., Chervin, J. C., Munsch, P., and Le Marchand, G. (2009). Hydrostatic limits of 11 pressure transmitting media. J. Phys. D Appl. Phys. 42:075413. doi: 10.1088/0022-3727/42/7/075413
Kol'tsova, T. N. (2001). X-ray diffraction study of Y2W3O12 • 3H2O. Inorg. Mater. 37, 1175–1177. doi: 10.1023/A:1012557411736
Korthuis, V., Khosrovani, N., Sleight, A. W., Roberts, N., Dupree, R., and Warren, W. W. (1995). Negative Thermal Expansion and Phase Transitions In the ZrV2−xPxO7 Series. Chem. Mater. 7, 412–417. doi: 10.1021/cm00050a028
Kozy, L. C., Tahir, M. N., Lind, C., and Tremel, W. (2009). Particle size and morphology control of the negative thermal expansion material cubic zirconium tungstate. J. Mater Chem. 19, 2760–2765. doi: 10.1039/b820014a
Li, J., Yokochi, A., Amos, T. G., and Sleight, A. W. (2002). Strong negative thermal expansion along the O-Cu-O linkage in CuScO2. Chem. Mater. 14, 2602–2606. doi: 10.1021/cm011633v
Lind, C. (2012). Two decades of negative thermal expansion research: where do we stand? Materials 5, 1125–1154. doi: 10.3390/ma5061125
Lind, C., Coleman, M. R., Kozy, L. C., and Sharma, G. R. (2011). Zirconium tungstate/polymer nanocomposites: challenges and opportunities. Phys. Stat. Sol. B 248, 123–129. doi: 10.1002/pssb.201083967
Lind, C., Wilkinson, A. P., Hu, Z. B., Short, S., and Jorgensen, J. D. (1998). Synthesis and properties of the negative thermal expansion material cubic ZrMo2O8. Chem. Mater. 10, 2335–2337. doi: 10.1021/cm980438m
Liu, H., Secco, R. A., Imanaka, N., and Adachi, G. (2002). X-ray diffraction study of pressure-induced amorphization in Lu2(WO4)3. Solid State Commun. 121, 177–180. doi: 10.1016/S0038-1098(01)00458-6
Liu, H., Secco, R. A., Imanaka, N., Rutter, M. D., Adachi, G., and Uchida, T. (2003). Ionic to electronic dominant conductivity in Al2(WO4)3 at high pressure and high temperature. J. Phys. Chem. Solids 64, 287–294. doi: 10.1016/S0022-3697(02)00297-4
Liu, H. J., Secco, R. A., and Huang, Y. N. (2001). Pressure-induced amorphization of hydrated Na-X zeolite. PhysChemComm 4, 37–39. doi: 10.1039/b102080n
Lommens, P., De Meyer, C., Bruneel, E., De Buysser, K., Van Driessche, I., and Hoste, S. (2005). Synthesis and thermal expansion of ZrO2/ZrW2O8 composites. J. Eur. Ceram. Soc. 25, 3605–3610. doi: 10.1016/j.jeurceramsoc.2004.09.015
Maczka, M., Paraguassu, W., Souza, A. G., Freire, P. T. C., Mendes, J., Melo, F. E. A., et al. (2004). High-pressure raman study of Al2(WO4)3. J. Solid State Chem. 177, 2002–2006. doi: 10.1016/j.jssc.2004.01.021
Maczka, M., Souza, A. G., Paraguassu, W., Freire, P. T. C., Mendes, J., and Hanuza, J. (2012). Pressure-induced structural phase transitions and amorphization in selected molybdates and tungstates. Prog. Mater. Sci. 57, 1335–1381. doi: 10.1016/j.pmatsci.2012.01.001
Marinkovic, B. A., Ari, M., De Avillez, R. R., Rizzo, F., Ferreira, F. F., Miller, K. J., et al. (2009). Correlation between AO6 polyhedral distortion and negative thermal expansion on orthorhombic Y2Mo3O12 and related materials. Chem. Mater. 21, 2886–2894. doi: 10.1021/cm900650c
Marinkovic, B. A., Jardim, P. M., De Avillez, R. R., and Rizzo, F. (2005). Negative thermal expansion in Y2Mo3O12. Solid State Sci. 7, 1377–1383. doi: 10.1016/j.solidstatesciences.2005.08.012
Matsumoto, A., Kobayashi, K., Nishio, T., and Ozaki, K. (2003). “Fabrication and thermal expansion of Al-ZrW2O8 composites by pulse current sintering process,” in Thermec'2003, Pts 1-5, eds. T. Chandra, J. M. Torralba and T. Sakai. (Zurich-Uetikon: Trans Tech Publications Ltd), 2279–2283.
Mendonça, R., Paraguassu, W., Filho, J. M., Marinkovic, B. A., Filho, A. G. S., Maczka, M., et al. (2016). Pressure-induced structural transformations in In2−xYx(MoO4)3 systems. J. Raman. Spectrosc. 47, 350–356. doi: 10.1002/jrs.4814
Morelock, C. R., Greve, B. K., Gallington, L. C., Chapman, K. W., and Wilkinson, A. P. (2013). Negative thermal expansion and compressibility of Sc1−xYxF3 (x <= 0.25). J. Appl. Phys. 114:213501. doi: 10.1063/1.4836855
Moura, J. V. B., Pinheiro, G. S., Freire, P. T. C., Filho, J. M., Saraiva, G. D., Viana, B. C., et al. (2016). High-pressure Raman scattering on Fe2(MOo4)3 microcrystals obtained by a hydrothermal method. Vibration. Spectroscop. 87, 88–93. doi: 10.1016/j.vibspec.2016.09.011
Mukherjee, G. D., Achary, S. N., Tyagi, A. K., and Vaidya, S. N. (2003). High pressure AC resistivity and compressibility study on Al2(WO4)3. J. Phys. Chem. Solids 64, 611–614. doi: 10.1016/S0022-3697(02)00361-X
Mukherjee, G. D., Vijaykumar, V., Achary, S. N., Tyagi, A. K., and Godwal, B. K. (2004). Phase transitions in Al2(WO4)3: high pressure investigations of low frequency dielectric constant and crystal structure. J. Phys. Condens. Mat. 16, 7321–7330. doi: 10.1088/0953-8984/16/41/013
Nassau, K., Levinstein, H. J., and Loiacono, G. M. (1965). A comprehensive study of trivalent tungstates and molybdates of the type L2(MO4)3. Phys. Chem. Solids 26, 1815–1816. doi: 10.1016/0022-3697(65)90213-1
Nassau, K., Shiever, J. W., and Keve, E. T. (1971). Structural and phase relationships among trivalent tungstates and molybdates. J. Solid State Chem. 3, 411–419. doi: 10.1016/0022-4596(71)90078-8
Pantea, C., Migliori, A., Littlewood, P. B., Zhao, Y., Ledbetter, H., Lashley, J. C., et al. (2006). Pressure-induced elastic softening of monocrystalline zirconium tungstate at 300 K. Phys. Rev. B 73:214118. doi: 10.1103/PhysRevB.73.214118
Paraguassu, W., Maczka, M., Souza, A. G., Freire, P. T. C., Mendes, J., Melo, F. E. A., et al. (2004). Pressure-induced structural transformations in the molybdate Sc2(MoO4)3. Phys. Rev. B 69:094111. doi: 10.1103/PhysRevB.69.094111
Perottoni, C. A., and da Jornada, J. A. H. (1998). Pressure-induced amorphization and negative thermal expansion in ZrW2O8. Science 280, 886–889. doi: 10.1126/science.280.5365.886
Phillips, A. E., Goodwin, A. L., Halder, G. J., Southon, P. D., and Kepert, C. J. (2008). Nanoporosity and exceptional negative thermal expansion in single-network cadmium cyanide. Angew. Chem. Int. Ed. 47, 1396–1399. doi: 10.1002/anie.200704421
Reisner, B. A., Lee, Y., Hanson, J. C., Jones, G. A., Parise, J. B., Corbin, D. R., et al. (2000). Understanding negative thermal expansion and 'trap door' cation relocations in zeolite rho. Chem. Comm. 2000, 2221–2222. doi: 10.1039/b006929i
Roy, R., Agrawal, D. K., and Mckinstry, H. A. (1989). Very low thermal expansion coefficient materials. Annu. Rev. Mater. Sci. 19, 59–81. doi: 10.1146/annurev.ms.19.080189.000423
Salke, N. P., Rao, R., Achary, S. N., Nayak, C., Garg, A. B., Krishna, P. S. R., et al. (2018). High pressure phases and amorphization of a negative thermal expansion compound TaVO5. Inorg. Chem. 57, 6973–6980. doi: 10.1021/acs.inorgchem.8b00590
Secco, R. A., Liu, H., Imanaka, N., and Adachi, G. (2001). Pressure-induced amorphization in negative thermal expansion Sc2(WO4)3. J. Mater. Sci. Lett. 20, 1339–1340. doi: 10.1023/A:1010967021588
Secco, R. A., Liu, H., Imanaka, N., and Adachi, G. (2002a). Anomalous ionic conductivity of Sc2(WO4)3 mediated by structural changes at high pressures and temperatures. J. Phys. Condens. Mat. 14, 11285–11289. doi: 10.1088/0953-8984/14/44/468
Secco, R. A., Liu, H., Imanaka, N., Adachi, G., and Rutter, M. D. (2002b). Electrical conductivity and amorphization of Sc2(WO4)3 at high pressures and temperatures. J. Phys. Chem. Solids 63, 425–431. doi: 10.1016/S0022-3697(01)00156-1
Shannon, R. D. (1976). Revised effective ionic-radii and systematic studies of interatomic distances in halides and chalcogenides. Acta Crystallogr. A 32, 751–767. doi: 10.1107/S0567739476001551
Sleight, A. W. (1998). Isotropic negative thermal expansion. Ann. Rev. Mater. Sci. 28, 29–43. doi: 10.1146/annurev.matsci.28.1.29
Sullivan, L. M., and Lukehart, C. M. (2005). Zirconium tungstate (ZrW2O8)/polyimide nanocomposites exhibiting reduced coefficient of thermal expansion. Chem. Mater. 17, 2136–2141. doi: 10.1021/cm0482737
Takenaka, K. (2012). Negative thermal expansion materials: technological key for control of thermal expansion. Sci. Technol. Adv. Mater. 13:013001. doi: 10.1088/1468-6996/13/1/013001
Tani, J.-I., Kimura, H., Hirota, K., and Kido, H. (2007). Thermal expansion and mechanical properties of phenolic resin/ZrW2O8 composites. J. Appl. Polym. Sci. 106, 3343–3347. doi: 10.1002/app.27025
Tani, J.-I., Takahashi, M., and Kido, H. (2010). Fabrication and thermal expansion properties of ZrW2O8/Zr2WP2O12 composites. J. Eur. Ceram. Soc. 30, 1483–1488. doi: 10.1016/j.jeurceramsoc.2009.11.010
Ticknor, J. O., Hester, B. R., Adkins, J. W., Xu, W. Q., Yakovenko, A. A., and Wilkinson, A. P. (2018). Zero thermal expansion and abrupt amorphization on compression in anion excess ReO3-type cubic YbZrF7. Chem. Mater. 30, 3071–3077. doi: 10.1021/acs.chemmater.8b00845
Toby, B. H., and Von Dreele, R. B. (2013). GSAS-II: the genesis of a modern open-source all purpose crystallography software package. J. Appl. Crystallogr. 46, 544–549. doi: 10.1107/S0021889813003531
Torres Dias, A. C., Luz Lima, C., Paraguassu, W., Pereira Da Silva, K., Freire, P. T. C., Mendes Filho, J., et al. (2013). Pressure-induced crystal-amorphous transformation in Y2Mo3O12. Vib. Spectrosc. 68, 251–256. doi: 10.1016/j.vibspec.2013.08.004
Tyagi, A. K., Achary, S. N., and Mathews, M. D. (2002). Phase transition and negative thermal expansion in A2(MoO4)3 system (A = Fe3+, Cr3+ and Al3+). J. Alloy. Compd. 339, 207–210. doi: 10.1016/S0925-8388(01)02003-5
Varga, T. (2011). “Materials that shrink on heating: pressure-induced phase transitions in negative thermal expansion materials, and their energetics,” in Advances in Chemistry Research, ed. J. C. Taylor (Nova Publishers), 1–54.
Varga, T., Wilkinson, A. P., Jorgensen, J. D., and Short, S. (2006). Neutron powder diffraction study of the orthorhombic to monoclinic transition in Sc2W3O12 on compression. Solid State Sci. 8, 289–295. doi: 10.1016/j.solidstatesciences.2006.02.022
Varga, T., Wilkinson, A. P., Lind, C., Bassett, W. A., and Zha, C. S. (2005a). High pressure synchrotron X-ray powder diffraction study of Sc2Mo3O12 and Al2W3O12. J. Phys.-Condens. Mat. 17, 4271–4283. doi: 10.1088/0953-8984/17/27/004
Varga, T., Wilkinson, A. P., Lind, C., Bassett, W. A., and Zha, C. S. (2005b). In Situ high-pressure synchrotron X-ray diffraction study of Sc2W3O12 At Up To 10 GPa. Phys. Rev. B 71:214106. doi: 10.1103/PhysRevB.71.214106
Verdon, C., and Dunand, D. C. (1997). High-temperature reactivity in the ZrW2O8-Cu system. Scripta Mater. 36, 1075–1080. doi: 10.1016/S1359-6462(96)00481-2
Young, L., Gadient, J., Xiaodong, G., and Lind, C. (2016). High pressure studies of A2Mo3O12 negative thermal expansion materials (A2 = Al2, Fe2, FeAl, AlGa). J. Solid State Chem. 237, 121–128. doi: 10.1016/j.jssc.2016.02.004
Keywords: negative thermal expansion, high pressure, synchrotron radiation, in-situ studies, scandium tungstate family
Citation: Young L, Gadient J and Lind C (2018) High Pressure Behavior of Chromium and Yttrium Molybdate (Cr2Mo3O12, Y2Mo3O12). Front. Chem. 6:478. doi: 10.3389/fchem.2018.00478
Received: 30 May 2018; Accepted: 20 September 2018;
Published: 11 October 2018.
Edited by:
Andrea Sanson, Università degli Studi di Padova, ItalyReviewed by:
Valerio Cerantola, European Synchrotron Radiation Facility, FranceKoshi Takenaka, Nagoya University, Japan
Copyright © 2018 Young, Gadient and Lind. This is an open-access article distributed under the terms of the Creative Commons Attribution License (CC BY). The use, distribution or reproduction in other forums is permitted, provided the original author(s) and the copyright owner(s) are credited and that the original publication in this journal is cited, in accordance with accepted academic practice. No use, distribution or reproduction is permitted which does not comply with these terms.
*Correspondence: Cora Lind, cora.lind@utoledo.edu