Metabolic Reprogramming in the Heart and Lung in a Murine Model of Pulmonary Arterial Hypertension
 Jose L. Izquierdo-Garcia1,2,3
  Teresa Arias2,3 Yeny Rojas3 Victoria Garcia-Ruiz3,4
  Arnoldo Santos2
  Silvia Martin-Puig3 Jesus Ruiz-Cabello1,2,5,6*
- 1CIC biomaGUNE, San Sebastian-Donostia, Spain
- 2CIBER de Enfermedades Respiratorias, Madrid, Spain
- 3Centro Nacional de Investigaciones Cardiovasculares, Madrid, Spain
- 4Unidad de Gestion Clinica del Corazon, Hospital Universitario Virgen de la Victoria, Málaga, Spain
- 5IKERBASQUE, Basque Foundation for Science, Bilbao, Spain
- 6Universidad Complutense Madrid, Facultad de Farmacia, Departamento de Quimica en Ciencias Farmaceuticas, Madrid, Spain
A significant glycolytic shift in the cells of the pulmonary vasculature and right ventricle during pulmonary arterial hypertension (PAH) has been recently described. Due to the late complications and devastating course of any variant of this disease, there is a great need for animal models that reproduce potential metabolic reprograming of PAH. Our objective is to study, in situ, the metabolic reprogramming in the lung and the right ventricle of a mouse model of PAH by metabolomic profiling and molecular imaging. PAH was induced by chronic hypoxia exposure plus treatment with SU5416, a vascular endothelial growth factor receptor inhibitor. Lung and right ventricle samples were analyzed by magnetic resonance spectroscopy. In vivo energy metabolism was studied by positron emission tomography. Our results show that metabolomic profiling of lung samples clearly identifies significant alterations in glycolytic pathways. We also confirmed an upregulation of glutamine metabolism and alterations in lipid metabolism. Furthermore, we identified alterations in glycine and choline metabolism in lung tissues. Metabolic reprograming was also confirmed in right ventricle samples. Lactate and alanine, endpoints of glycolytic oxidation, were found to have increased concentrations in mice with PAH. Glutamine and taurine concentrations were correlated to specific ventricle hypertrophy features. We demonstrated that most of the metabolic features that characterize human PAH were detected in a hypoxia plus SU5416 mouse model and it may become a valuable tool to test new targeting treatments of this severe disease.
Introduction
Pulmonary arterial hypertension (PAH) is a rare form of pulmonary hypertension that primarily affects the lung microvasculature. In PAH, the gradual obliteration of the arterial lumen results in a progressive increase in pulmonary vascular resistance, leading to right ventricle (RV) dysfunction and death (1). The pulmonary vascular pathology of PAH is characterized by a major remodeling of small arteries and arterioles due to the proliferation of resident and migrating inflammatory cells. Mitochondrial dysfunction in these cells plays an essential role in the pathogenesis of the disease (2, 3). Pulmonary artery smooth muscle and endothelial cells of PAH patients proliferate and exhibit a shift in glucose metabolism from oxidative phosphorylation to glycolysis (4, 5). Mitochondrial dysfunction has been reported in human PAH lung samples (6) and human pulmonary endothelial cells genetically mutated to reflect PAH-related traits (7). In parallel with the increase in pulmonary vascular resistance, RV myocytes develop a mitochondrial metabolic switch similar to that observed in lung samples (8). Metabolic adaptations in the heart for improving RV function involve cellular and molecular events that ultimately affect glycolysis and fatty acid oxidation (9). In accordance with these results, some authors have suggested a common metabolic remodeling in the vascular cells of the pulmonary circulation and extrapulmonary tissues (10, 11). Therefore, the study of the metabolic reprogramming in PAH as a multiorgan event may reveal several key metabolic targets that are directly involved in PAH pathogenesis and may form the basis of biomarker and drug discovery programs.
One of the primary difficulties for PAH biomarker development and drug discovery programs is the absence of any preclinical model that recapitulates most of the clinical features of human PAH (12, 13). Hence, experimental animal models that display a clustering of proliferated cells in the lumen of pulmonary arteries are essential to monitor the molecular mechanisms of the disease. Among the described PAH models, the mouse model that combines hypoxia exposure with the inhibition of vascular endothelial growth factor receptor (VEGF) using Semaxanib (SU5416) has been used to study several of the etiologic mechanisms involved in cell hyperproliferation (14, 15). This PAH model develops a more profound and sustained pulmonary hypertension phenotype than that induced by 3 weeks of chronic hypoxia alone (14) and is characterized by neointimal smooth muscle cell proliferation and obliteration, leading to increased RV pressure, RV hypertrophy, and evidence of incipient heart failure (15). Due to the relevance of this process in the cardiopulmonary progression of PAH, the aim of this study was to characterize the metabolic changes associated with cell proliferation in this mouse model of PAH. To achieve this objective, energy metabolism was studied in vivo by (18F)-2-fluoro-2-deoxy-D-glucose (FDG) positron emission tomography (PET). Intact lung and heart tissues were also analyzed by high resolution magic angle spinning (HR-MAS) nuclear magnetic resonance (NMR) spectroscopy.
Materials and Methods
Animals and Ethical Approval
The Madrid Government Animal Care and Use Committee approved all experimental protocols (Proex 381/15). All animals were treated in accordance with the guidelines approved by the Spanish scientific procedures act (32/2007) and European Union Directive 86/609/EEC. The study was performed using an established model of PAH in mice that is generated by hypoxia exposure combined with Semaxanib (SU5416) administration (HPX+SU model). Healthy normoxic mice (NMX group) and healthy hypoxic mice (HPX group) were used as controls. The HPX+SU murine PAH model has been well-characterized in previous studies (14–16). Briefly, ten-weak-old male C57BL/6 mice (Charles River Laboratories) were exposed to normobaric hypoxia (10% of oxygen) for 3 weeks (n = 25) and were only removed from the chamber once per week for the administration of subcutaneous injections of the VEGF inhibitor, SU5416 (MedChem Express. Stockholm, Sweden). SU5416 was suspended in carboxymethyl cellulose (CMC) (0.5% [w/v] CMC sodium, 0.9% [w/v] sodium chloride, 0.4% [v/v] polysorbate 80, 0.9% [v/v] benzyl alcohol in deionized water) and injected at 20 mg/kg. HPX mice (n = 12) were exposed to the same hypoxic conditions and weekly sham injections. NMX mice (n = 25) were maintained in a room with normal oxygen levels.
Mice were monitored weekly to check for changes in body weight, external physical appearance or the presence of labored respiration. After 3 weeks, mice were euthanized using a ketamine-xylazine overdose (300 and 30 mg/kg, respectively). Lung tissue was exsanguinated and immediately collected for histological and/or metabolomic profiling. The heart was removed, and RV hypertrophy (Fulton's index) was measured by weighing the RV relative to the left ventricle (LV) plus septum (LV+S). RV and LV samples were snap frozen for metabolomic analysis.
Histology
Lung tissue samples were preserved for 24 h after collection in 10% formalin, stored in 70% ethanol, and then paraffin-embedded for histological studies. Paraffin-embedded lung tissue sections of 4-μm thickness were stained with Verhoeff-van Gieson to measure the medial thickness of the lung arteries or with picrosirius red to measure lung collagen deposition. Medial wall thickness was measured using the equation described by Vitali et al. (14). Lung macrophage infiltration was determined by immunohistochemistry using the F4/80 antibody. All sections were digitally imaged and analyzed by a NanoZoomer Digital Pathology Imaging system (NDP, Hamamatsu. Japan). Picrosirius red-stained sections were also analyzed using polarized light in a Nikon ECLIPSE 90i upright microscope (with NIS-Elements 3.22.11 acquisition software). Presented values are the mean of 10 fields taken from 10 lung sections per mouse (n = 8 per group).
Echocardiography
Echocardiographic studies were conducted before (basal condition) and 3 weeks after exposure to normoxia/hypoxia conditions. Mice were anesthetized using a 1–2% isoflurane/O2 gas mixture. Cardiac function (ejection fraction), chamber dilatation, and wall thickness were analyzed by transthoracic echocardiography using a Vevo 2100 system and a 45-MHz probe (Visualsonics, Toronto, Canada). Images were taken by a blinded, experienced operator, and measurements were performed offline by two experienced readers. The mice were placed on a heating pad under light anesthesia, and sevoflurane levels (~1%) were adjusted to obtain a target heart rate of ~500 bpm. 2D and M-mode parasternal echocardiographic long-axis and short-axis views at three levels were recorded to obtain accurate measurements.
Color and pulse-wave Doppler images were acquired by positioning images for the LV at the tip of the pulmonary valve leaflets and aligned to show maximum laminar flow. Angled parasternal long-axis views were used to study pulmonary artery flows. Integrals of pulmonary flow, pulmonary acceleration times and RV ejection times were measured to estimate RV systolic pressure (17). These values were averaged across a minimum of five cardiac cycles (n = 8 per group).
Positron Emission Tomography and Computed Tomography (PET/CT) Imaging
In vivo FDG uptake was analyzed using a dual-head PET combined with CT (Bioscan system, manufactured by Mediso). Mice were fasted overnight prior to scanning, and blood glucose levels were tested prior to contrast agent injection. Nuclear imaging was conducted prior to the induction of hypoxia (basal condition) and after one, 2 and 3 weeks of hypoxia (n = 8 per group). The animals were anesthetized using a 1–2% isoflurane/O2 gas mixture administered through a nose mask and maintained at a temperature of approximately 30°C from the time of the injection until the scans were completed.
FDG contrast agent was obtained from the PET Technological Institute (ITP) (Madrid, Spain). After measuring the exact concentration in a radioisotope calibrator, FDG (21.07 ± 1.094 MBq) was intravenously administered 1 h before PET imaging.
OsiriX Software was used to analyze the PET/CT sequences. For FDG uptake in the RV, LV and lungs, three-dimensional regions of interest (3D-ROIs) were drawn for each tissue, and the maximum standardized uptake value (SUV) was quantified.
NMR Data Acquisition
Intact lung, RV and LV tissue samples were examined by HR-MAS NMR using a Bruker AMX500 spectrometer (11.7 T). Samples were placed into a 50-μl zirconium oxide rotor using a rinsed cylindrical insert with 15 μl of a 0.1 mM solution of TSP in deuterium water (D2O) and spun at 4,000 Hz to remove the effects of spinning side bands from the acquired spectra. Shimming and NMR preparation times were reduced to a minimum, while the sample was chilled to 4°C to minimize metabolic changes. A number of two-dimensional homonuclear and heteronuclear experiments, such as standard gradient-enhanced correlation spectroscopy (COSY), 1H–1H total correlated spectroscopy (TOCSY) and gradient-selected heteronuclear single quantum correlation (HSQC), were performed to carry out component assignments. A control 1H NMR spectrum was measured between consecutive two-dimensional (2D) spectra. No gross degradation was noted in the signals of multiple spectra acquired under the same conditions.
Standard solvent-suppressed spectra were grouped into 32,000 data points, which were averaged over 256 acquisitions. The data acquisition lasted a total of 15 min using a sequence based on the first increment of the nuclear Overhauser effect spectroscopy (NOESY) pulse sequence to suppress the effects of water. Sample acquisition was performed using a spectral width of 8,333.33 Hz prior to Fourier transformation, and the free induction decay (FID) signals were multiplied by an exponential weight function corresponding to a line broadening of 0.3 Hz. The spectra were referenced to the TSP singlet at a chemical shift of 0 ppm.
The NMR spectra were processed as described previously (18). Briefly, 1H-NMR spectra were data-reduced to equal-length integral segments (δ = 0.01 ppm), and they were normalized to the total sum of the spectral regions.
Statistical Analysis
The required sample size for imaging studies was calculated using G Power software (19). The variables were compared using two-tail Student's t-tests and are expressed as the mean ± standard deviation (SD).
Metabolomics Profiling
Principal components analysis (PCA) (20) was applied to full NMR spectra in order to extract the most discriminative spectral subset from the total pool of metabolites and to remove outliers. The data obtained from this analysis were centered and scaled. The potential statistically significant differences NMR areas selected from the PCA loading matrix were confirmed by Hoteling's T2 test (21). A minimum of 10 samples per group were included in the PCA analysis to guarantee a classification error lower than 10%. Multivariate statistical analysis was performed with the Metabonomic package (rel.3.3.1) (22). In addition, the resonances highlighted as significantly different by the PCA loading matrix were identified and individually integrated for metabolic quantification using the Global Spectral Deconvolution algorithm of MestRenova v. 8.1 (Mestrelab Research S.L., Santiago de Compostela, Spain). The resonances were identified according to the Human Metabolome Database (23), and characteristic cross-peaks from 2D spectra to help in unequivocal assignation of these metabolites. For metabolic quantification, statistical significance was determined using a Bonferroni-corrected Student's t-test (24) assuming unequal variance, and p < 0.05 was considered statistically significant.
Results
Pulmonary Hypertension Characterization
Vascular remodeling was confirmed in HPX+SU mice, which displayed a significant increment in medial wall blood vessel thickness (Figure 1A) compared to NMX mice (P < 0.0001). Compared to NMX mice, a substantial deposition of collagen was detected in the vascular media and the lung parenchyma from HPX+SU (P < 0.05) (Figure 1B). HPX+SU mice also exhibited macrophage infiltration (P < 0.001) (Figure 1C).
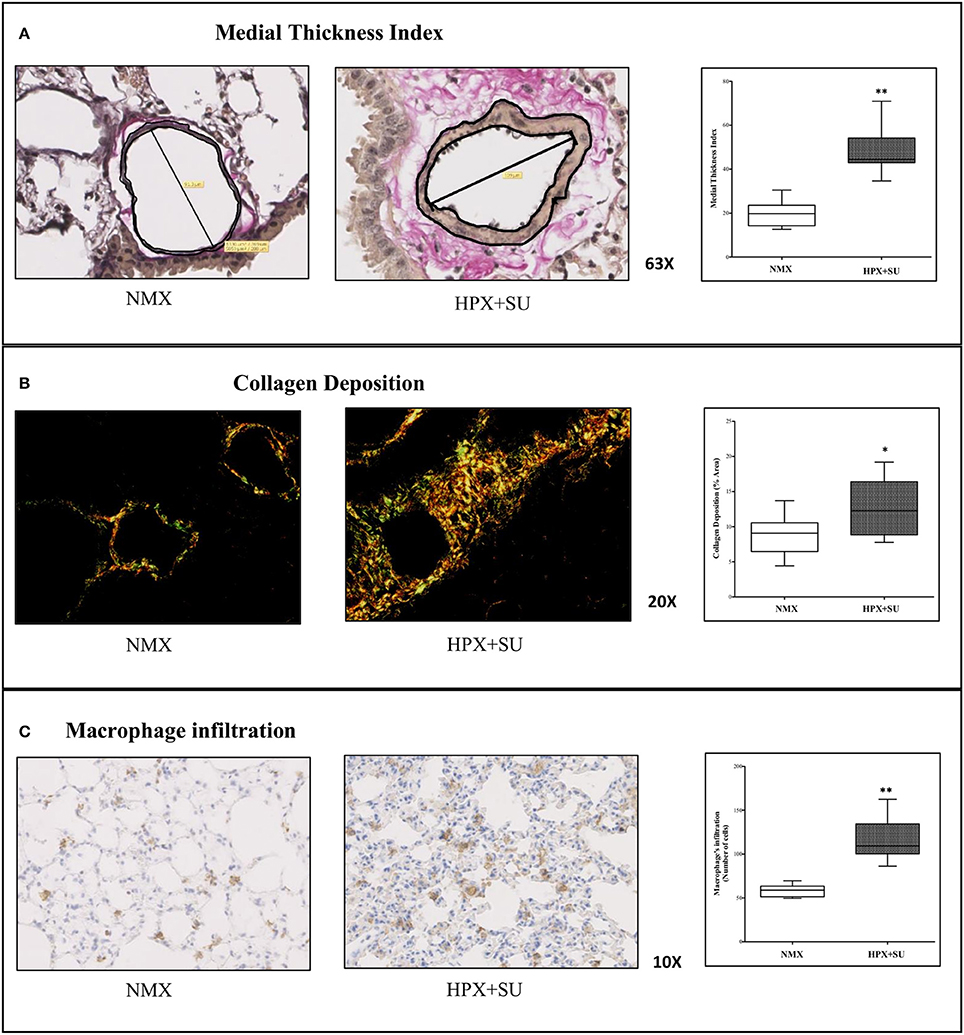
Figure 1. Hypoxia and SU5416 treatment induces pulmonary vascular remodeling. (A) Representative pulmonary arterioles stained with Verhoeff-van Gieson stain (upper) and medial wall thickness index values (lower). (B) Representative picture of picrosirius red staining (upper) and percentage of lung collagen deposition (lower). (C) Representative picture of macrophage infiltration using the F4/80 antibody (upper) and macrophage quantification (lower). Statistical differences (*P < 0.05, **P < 0.01) were detected using an analysis of variance and two-tailed Student's t-test.
RV wall thickness (Figure 2A) was increased in HPX+SU mice after 3 weeks of hypoxia (P < 0.001 vs. basal conditions, P < 0.01 vs. NMX). The tricuspid annular plane systolic excursion (TAPSE) was significantly decreased in the HPX+SU group (P < 0.01 vs. basal conditions, P < 0.05 vs. NMX) (Figure 2B). The velocity–time integral across the pulmonary valve (PV-VTI) was also significantly decreased in HPX+SU mice (P < 0.01 vs. basal conditions, P < 0.001 vs. NMX) (Figure 2C). The ratio of pulmonary acceleration time (PAT) relative to ejection time (ET) was significantly reduced in HPX+SU versus NMX mice and basal conditions (P < 0.05 vs. basal conditions, P < 0.01 vs. NMX mice) (Figure 2D). Finally, RV weight was significantly increased in HPX+SU mice compared with NMX mice after 3 weeks of hypoxia (P < 0.05) (Figure 2E).
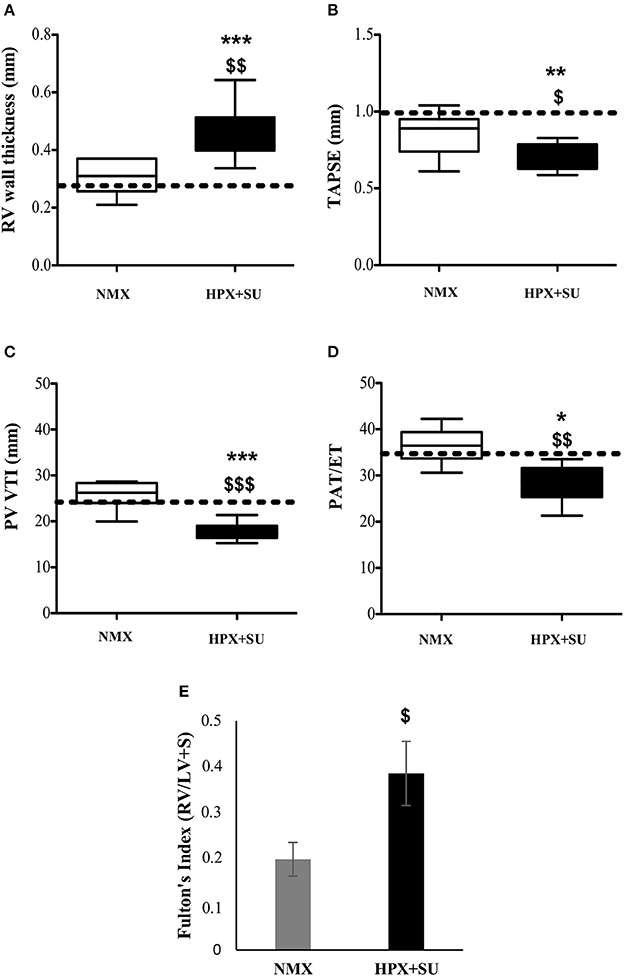
Figure 2. Right Ventricle (RV) weight and echocardiographic measurements change after hypoxia and SU5416 treatment. (A) RV wall thickness. (B) Tricuspid annular plane systolic excursion (TAPSE). (C) The velocity–time integral across the pulmonary valve (PV-VTI). (D) Ratio of pulmonary acceleration time (PAT) to ejection time (ET). (E) Fulton's index. The dotted line indicates basal conditions. Statistical differences were detected using an analysis of variance and two-tailed Student's t-test (*P < 0.05; **P < 0.01; ***P < 0.001 vs. basal conditions. $P < 0.05; $$P < 0.01; $$$P < 0.001 vs. NMX group). HPX+SU = hypoxia plus SU5416 group, n = 8; NMX = normoxia group, n = 12.
Pulmonary Metabolic Reprogramming
Metabolomic profiling of lung samples discriminated between NMX and both HPX and HPX+SU groups (Figure 3A). A slight difference between HPX+SU and HPX mice was also detected and further confirmed after removing NMX group from the PCA analysis, showing a clear separation between HPX+SU and HPX mice (Figure 3B). The PCA loading plots highlight the most significant metabolites that distinguish between groups (Figures 3C,D). Specifically, we observed a reduction in the concentration of glucose and free fatty acids, and an increase in lactate, alanine, glycine, glutamate, glutamine, taurine, glycerophosphocholine (GPC), and phosphocholine concentrations in HPX and HPX+SU mice compared to NMX mice (Figure 3E, Table 1). When we compared HPX+SU mice to HPX mice, we found significant differences in glucose and lactate concentrations. Lactate, alanine, and glycerophosphocholine concentrations showed a good correlation with the histologic features of PAH such as arterial medial thickness index (Figure 4).
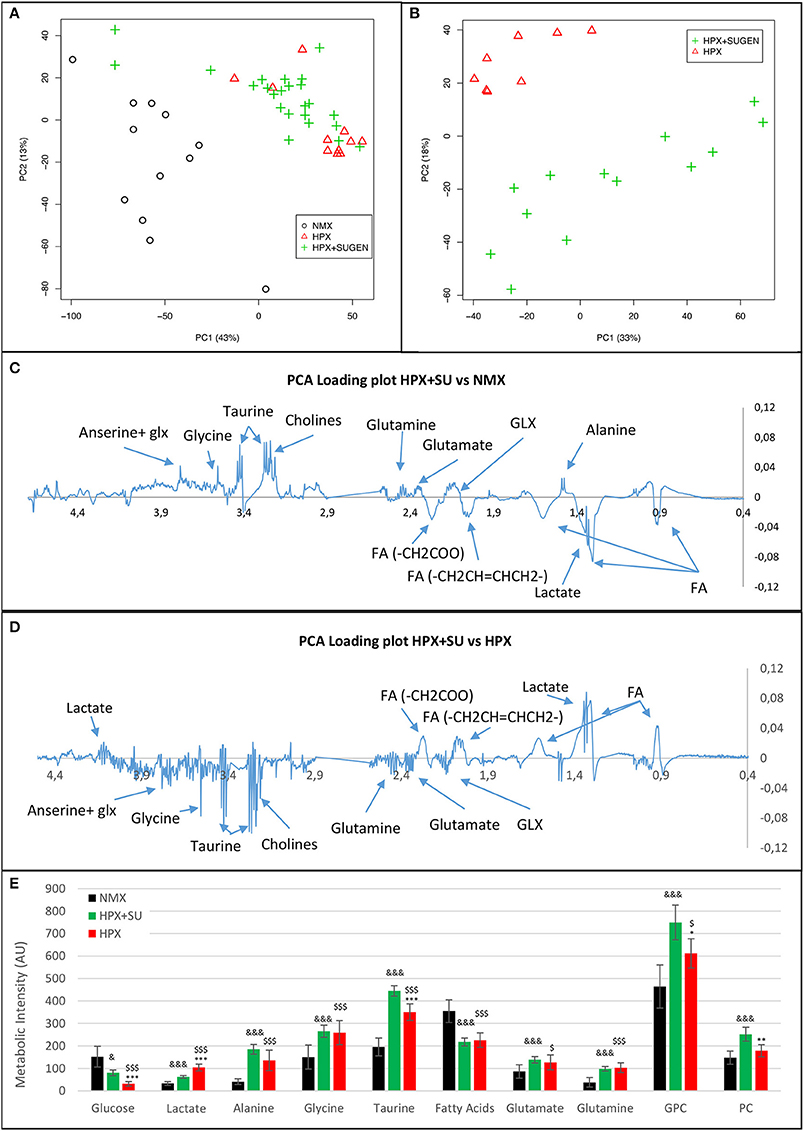
Figure 3. Metabolomic profiling of lung samples. (A) Principal components analysis (PCA) performed on 1H-MRS data from lung reveals a clear separation between NMX, HPX, and HPX+SU groups. (B) Second PCA reveals also a clear separation between HPX and HPX+SU groups. PCA loading plots identify metabolites that discriminate between NMX and HPX+SU groups (C) and between HPX and HPX+SU groups (D). The resonance that best distinguished the groups was selected based on a significance level lower than 5.00e-02 by Hoteling's T2 test. (E) Metabolites with the potential to distinguish the groups were quantified. NMX (n = 15); HPX+SU (n = 22); HPX (n = 12). Statistical significance was determined using a Bonferroni-corrected Student's t-test (HPX+SU vs. HPX: *P < 0.05; **P < 0.01; ***P < 0.001. HPX+SU vs. NMX: &P < 0.05; &&&P < 0.001. HPX vs. NMX: $P < 0.05; $$$P < 0.001). PC, principal component; AU, arbitrary units; GPC, glycerophosphocholine; GLX, glutathione; FA, fatty acid.
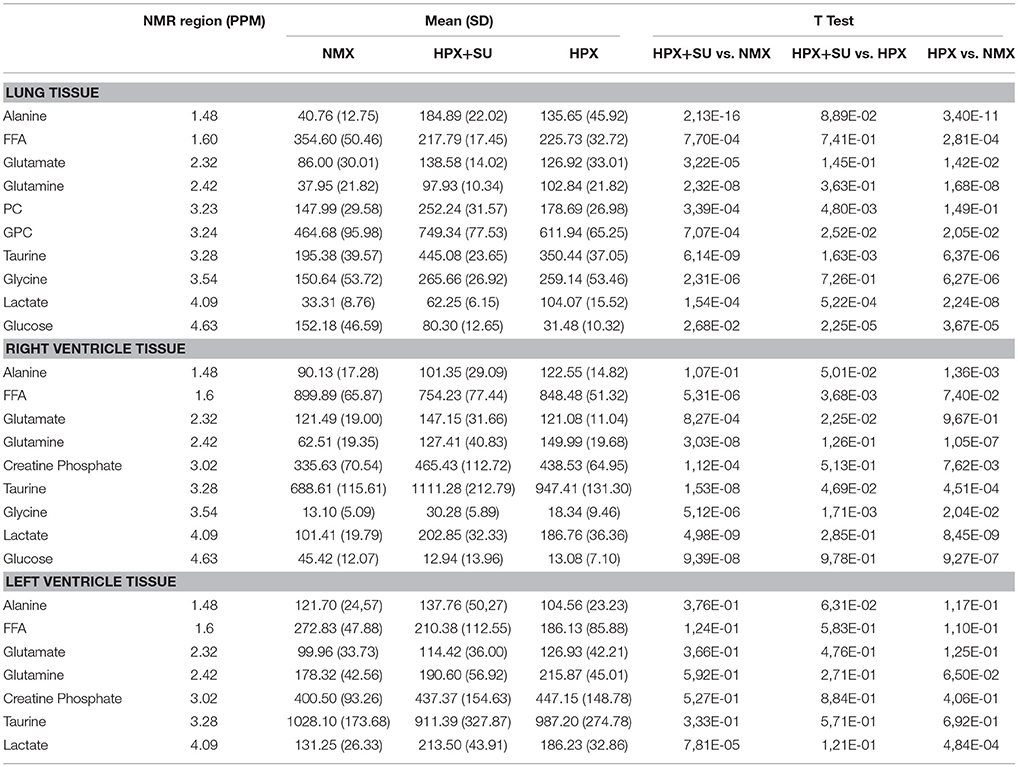
Table 1. Summary of postulated metabolites and their relative amounts from NMX, HPX, and HPX+SU groups.
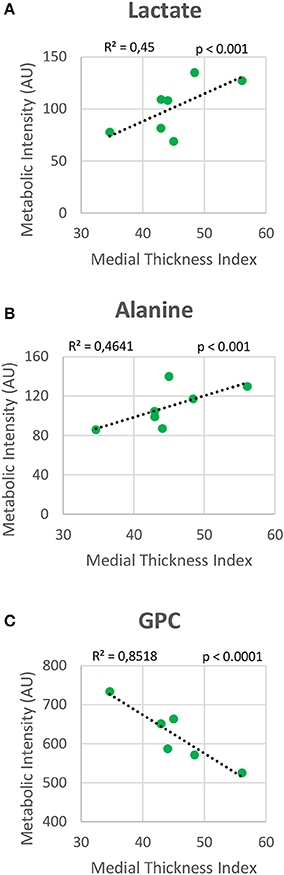
Figure 4. Correlation plot between lung metabolic intensities of lactate (A), alanine (B), and glycerophosphocholine (GPC) (C), and medial thickness index. Correlations were assessed using Pearson's R-squared correlation coefficient (R2).
The altered or adapted energy metabolism was confirmed by in vivo PET imaging (Figures 5A,B). 18F-FDG uptake in HPX+SU mice significantly increased after the first week vs. the initial pre-hypoxic exposure conditions and compared to values for NMX mice (Figure 5C). At the end of the protocol for up to 3 weeks of exposure, HPX+SU and HPX mice showed significantly higher 18F-FDG uptake than NMX mice (Figure 5D). HPX+SU also showed higher (no significant) 18F-FDG uptake than HPX mice.
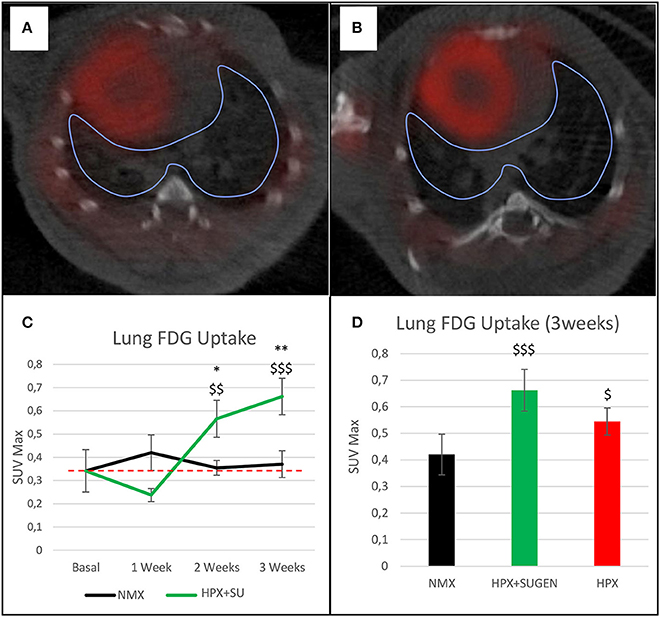
Figure 5. Fused positron emission tomography (PET)/computed tomography (CT) images of the lung parenchyma. Representative images of NMX (A) and HPX+SU (B) mice at the end of the 3-week protocol. 18F-FDG uptake in HPX+SU mice significantly increased after the first week vs. the initial prehypoxic exposure conditions and compared to NMX mice (C). Standardized uptake value maximum (SUVmax) at 3-weeks also shows an increase in 18F-FDG uptake in HPX+SU and HPX groups (D). The dotted line indicates basal conditions. Statistical differences were determined by analysis of variance with a two-tailed Student's t-test (*P < 0.05; **P < 0.01 vs. basal conditions. $P < 0.05;$$P < 0.01; $$$P < 0.001 vs. NMX group).
Cardiac Metabolic Reprogramming in PAH Models
RV NMR spectra provided a nearly perfect discrimination between the three groups along the first two principal components (Figure 6A). The PCA loading plots show the metabolites that changed between groups (Figures 6C,D). We found a shift in energy metabolism, with higher metabolic concentrations of glutamine, creatine phosphate, lactate, taurine and glycine, and lower concentration of glucose in HPX+SU and HPX groups (Figure 6B, Table 1). Focusing on the differences between HPX+SU and HPX groups, we found that taurine, glycine, and glutamate concentrations were significantly lower in HPX group, whereas free fatty acids and alanine concentrations were increased. We also confirmed the correlation between metabolic data and echocardiography parameters. Glutamine and taurine intensities showed a strong correlation with RV wall thickness (Figure 7).
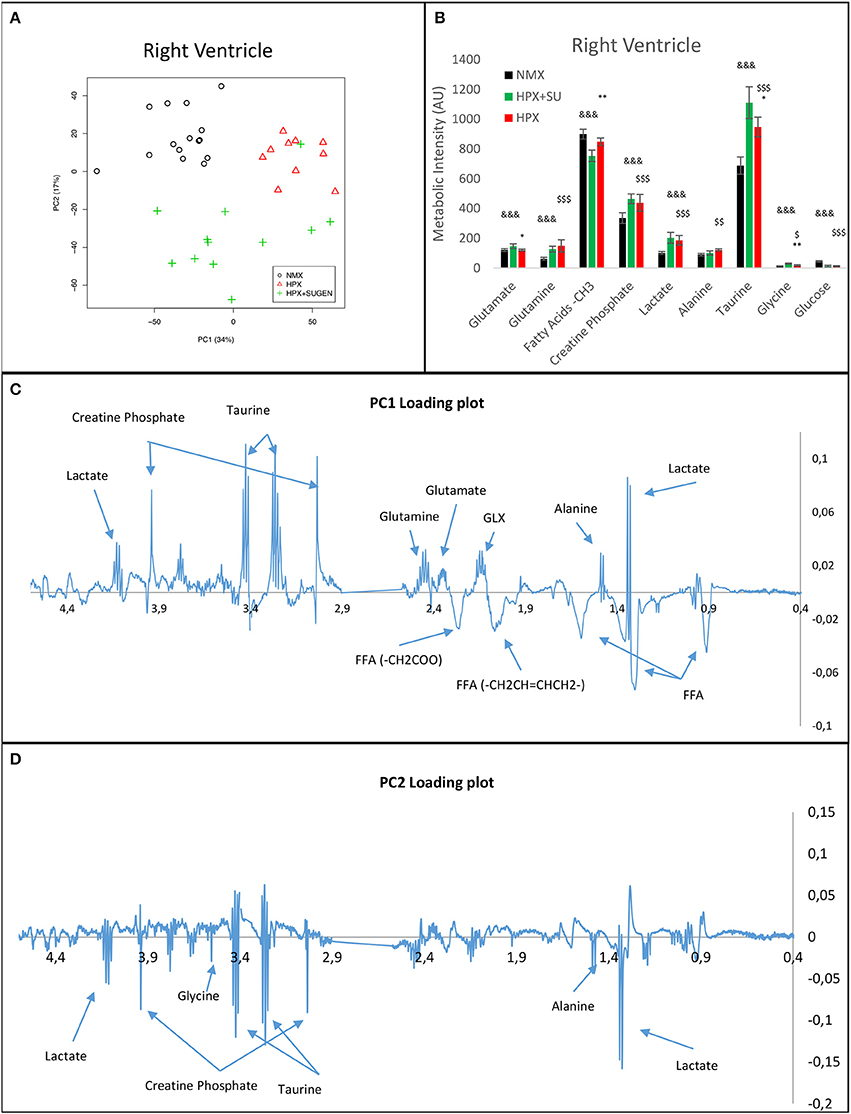
Figure 6. Metabolomic profiling of right ventricle samples. Principal components analysis (PCA) performed on 1H-MRS data from lung reveals a clear separation between NMX, HPX, and HPX+SU groups (A). PC1 (C) and PC2 (D) loading plots identify metabolites that discriminate between the groups. The resonance that best distinguished the groups was selected based on a significance level lower than 5.00e-02 by Hoteling's T2 test. Metabolites with the potential to distinguish the groups were quantified (B). NMX (n = 15); HPX (n = 10); HPX+SU (n = 11). Statistical significance was determined using a Bonferroni-corrected Student's t-test (HPX+SU vs. HPX: *P < 0.05; **P < 0.01. HPX+SU vs. NMX: &&&P < 0.001. HPX vs. NMX: $P < 0.05; $$P < 0.01; $$$P < 0.001). PC, principal component; AU, arbitrary units; GLX, glutathione; FA, fatty acid.
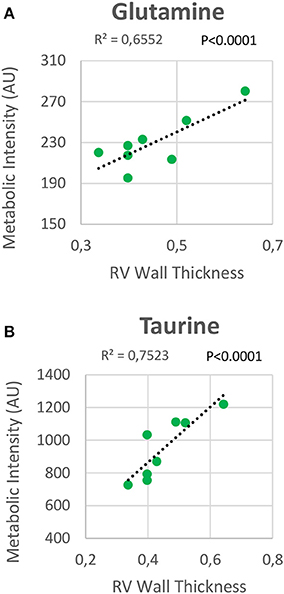
Figure 7. Correlation plot between the right ventricle (RV) metabolic intensities of glutamine (A) and taurine (B), and the RV thickness. Correlations were assessed using Pearson's R-squared correlation coefficient (R2).
Metabolomic analysis of LV samples indicated a much less acute metabolic effect in this ventricle than in the RV. PCA scores plot (Figure 8A) shows the discrimination between NMX and both hypoxic groups, but not between HPX+SU and HPX mice (Figure 8B). We detected higher lactate signals in the HPX and HPX+SU groups, but concentrations of other metabolites are not significantly different (Figure 8C, Table 1).
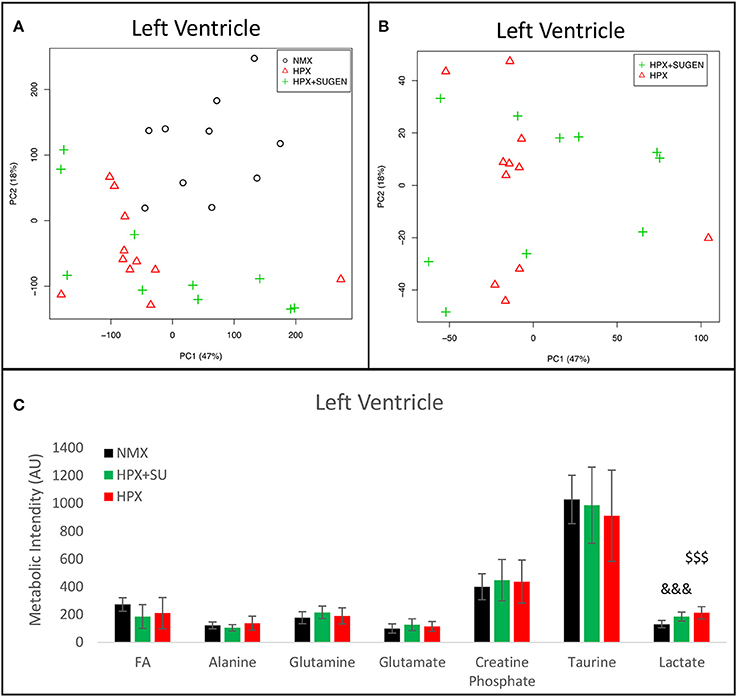
Figure 8. Metabolomic profiling of left ventricle (LV) samples. (A) Principal components analysis (PCA) performed on 1H-MRS data from LV reveals a clear separation between NMX, HPX, and NMX+SU groups. (B) Second PCA cannot show a separation between the hypoxia (HPX) and hypoxia plus SU5416 treatment (HPX+SU) groups. (C) Metabolic quantification in left ventricle tissue. NMX (n = 10); HPX+SU (n = 10); HPX (n = 11). Statistical significance was determined using a Bonferroni-corrected Student's t-test (HPX+SU vs. NMX: &&&P < 0.001. HPX vs. NMX: $$$P < 0.001). AU, Arbitrary Units.
Finally, 18F-FDG uptake was significantly increased in HPX+SU ventricles compared to uptake under basal conditions and in NMX mice (Figures 9A,B) after the first week of hypoxia exposure (Figures 9C,D). After 3 weeks under hypoxia, HPX+SU and HPX mice showed higher 18F-FDG uptake than NMX mice in both ventricles (Figures 9E,F).
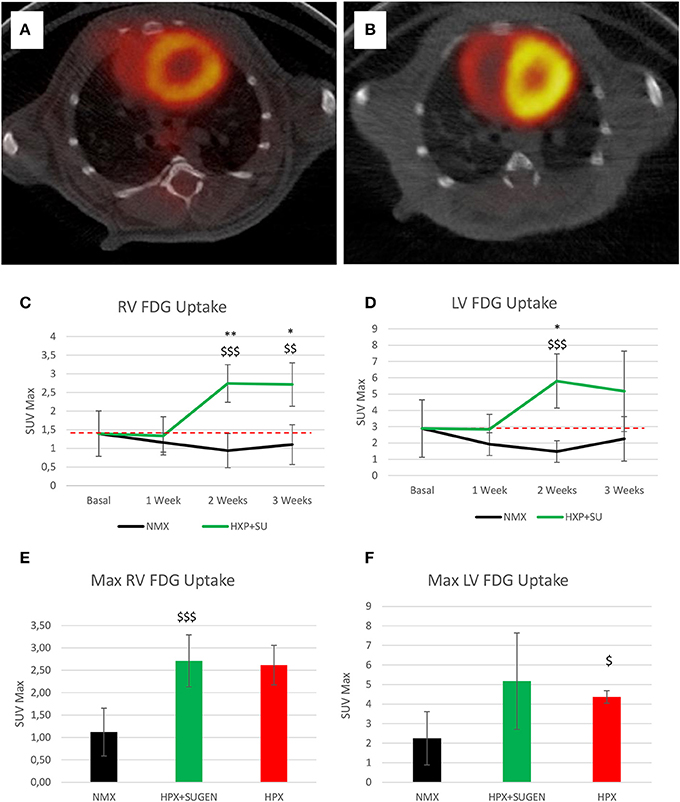
Figure 9. Fused positron emission tomography (PET)/computed tomography (CT) images of the left and right ventricles. Representative images of NMX (A) and HPX+SU (B) mice at the end of the 3-week protocol. 18F-FDG uptake in HPX+SU mice significantly increased after the first week vs. the initial prehypoxic exposure conditions and compared to NMX mice in the right (C) and left (D) ventricles. Standardized uptake value maximum (SUVmax) at 3-weeks also shows an increase in 18F-FDG uptake in HPX+SU and hypoxia (HPX) groups in the right ventricle (E) and HPX group in the left ventricle (F). The dotted line indicates basal conditions. Statistical differences were determined by analysis of variance with a two-tailed Student's t-test (*P < 0.05; **P < 0.01 vs. basal conditions. $P < 0.05; $$P < 0.01; $$$P < 0.001 vs. NMX group).
Discussion
Robust animal models that reproduce the pathological features of human PAH are needed to improve our understanding of the pathobiology of PAH, particularly in a dynamic scenario, in order to develop new therapeutic strategies that target alternative pathways in PAH. Here, we characterized the metabolic profile of an established PAH mouse model using NMR-based metabolomics and 18F-FDG PET imaging. PET imaging has been used previously to characterize PAH in animal models (25, 26) and patients (27, 28), and the 1H-MRS analysis of intact tissues provides an excellent tool for understanding biochemical processes associated with diseases (29). It should be noted that previous metabolomic studies on PAH were performed in cellular models (7), in plasma samples of PAH patients (30–32), in human lung tissue obtained at the time of lung transplantation (6) and in RV tissue from a PAH rat model (33). To the best of our knowledge, this is the first metabolomic study designed to assess the metabolic reprogramming associated with PAH in lung and heart tissues from a mouse model.
We chose a murine model of PAH that combines hypoxia exposure and VEGF inhibition because it addresses most of the etiologic mechanisms involved pulmonary vascular cell hyperproliferation. Hence, this model could serve to identify subtle metabolic changes specifically associated with smooth muscle cell proliferation and subsequent RV hypertrophy. We confirmed the development of human PAH features in our mouse model. HPX+SU mice showed a significant increase in blood vessel medial wall thickness, deposition of collagen in the vascular media and macrophage infiltration. We also confirmed RV hypertrophy (Fulton's index) and dysfunction by echocardiography. Thus, our results are consistent with PAH clinical data (34) and with data from previous studies in animal models (14, 15). However, previous studies using a mouse model of hypoxia and VEGF inhibition (14, 15) did not probe the metabolic profiles of the animals, which was the focus and a major strength of our study.
Metabolic reprogramming in PAH is now recognized as a major contributor to the pathogenesis of pulmonary vascular disease (35). The pulmonary vasculature in PAH displays a normoxic activation of hypoxia-inducible factor 1-alpha (HIF-1α), which creates a “pseudo-hypoxic” environment despite normal oxygen availability (36). One of the consequences of HIF-1α activation is a metabolic shift toward aerobic glycolysis. The “Warburg effect,” or the upregulation of glycolysis in the presence of oxygen, has been described in the development of the PAH (4). Previous studies have shown that HIF-1α activates over 100 genes involved in the development of hypoxic pulmonary hypertension (8, 37). Specifically, Kim et al. (38) reported the upregulation of glucose transporters (GLUT1 and GLUT3) and of pyruvate dehydrogenase kinase 1 and 4 (PDK1 and PDK4), which promote the inhibition of pyruvate dehydrogenase (PDH) activity and block the entrance of pyruvate into the Krebs cycle. These significant alterations induce an increase in glucose uptake and a reduction of glucose flux into the mitochondria. As a consequence, TCA cycle activity is decreased, and the activity of anaplerotic pathways that replenish the intermediates of the TCA cycle is increased (7). Lipid metabolism has also been highlighted as one of the hallmarks of PAH progression. Sutendra et al. (39) showed that the inhibition of fatty acid oxidation due to the absence of malonyl-coenzyme A decarboxylase (MCD) promotes glucose oxidation and prevents the metabolic shift toward glycolysis. Furthermore, metabolic modulators that are used clinically and that mimic the lack of MCD can reverse PAH induced by hypoxia or monocrotaline (39, 40). Our results confirm the presence of these metabolic adaptations in the HPX+SU mouse model (Figure 10). We have identified significant alterations in the glycolytic pathway that are characterized by an increase in pulmonary FDG uptake, higher lactate and alanine concentrations, and a decrease in pulmonary glucose concentrations in HPX+SU mice. We have also confirmed the upregulation of glutamine metabolism, with a significant increase in glutamine and glutamate concentrations in the lungs of HPX+SU mice may maintain mitochondrial functionality. Alterations in lipid metabolism were also confirmed by the reduction of free fatty acid concentration that may indicate an upregulation of beta-oxidation and/or de novo lipid biosynthesis.
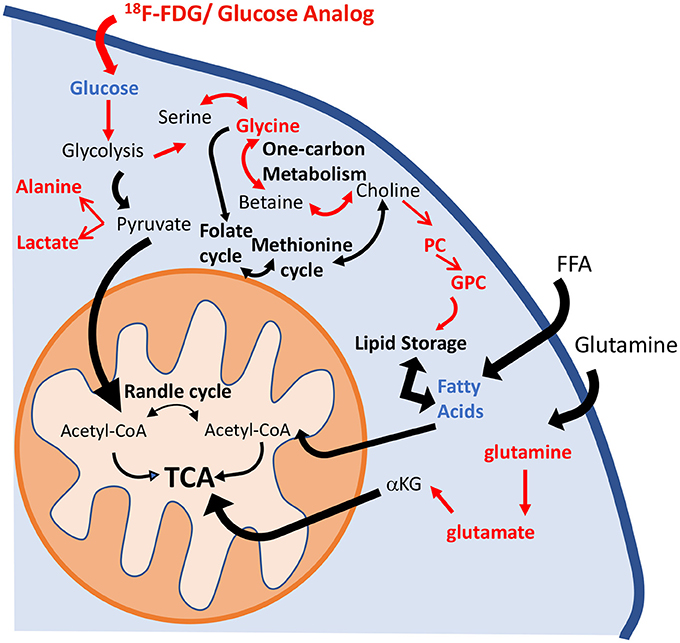
Figure 10. Schematic illustration of the metabolic pathways found to be altered in the lung parenchyma. Enhancement of the glycolytic pathway, including an increase in pulmonary FDG uptake, higher lactate and alanine concentrations, and a decrease in the pulmonary glucose concentrations in HPX+SU mice. The increased glycine concentration is characteristic of an upregulation of one-carbon metabolism. Higher levels of phosphocholine and glycerophosphocholine also point to an increase in lipid biosynthesis. Glutaminolysis was increased to support maybe TCA activity. For clarity, increased pathways/metabolites are displayed in red, decreased pathways/metabolites are displayed in blue, and some intermediate metabolic steps are not illustrated. PC, phosphocholine; GPC, glycerophosphocholine; FFA, free fatty acids; αKG, α-ketoglutarate.
In addition, we have identified other new significant alterations in glycine and choline metabolism. The reversible interconversion of serine and glycine is directly coupled to one-carbon metabolism and is involved in nucleotide, lipid and protein biosynthesis (41–43). These reactions proceed in a cyclical manner in which a carbon unit is transferred to other metabolic pathways and eventually replenished from several sources. Glycine metabolism integrates metabolic input from central carbon (glycolysis) and nitrogen (glutamine) metabolism, and this pathway has recently been highlighted as essential for the biosynthesis required for cell proliferation (44). In addition, glycine is especially interesting because of its direct anti-inflammatory and anti-angiogenic effects on endothelial cells (45). Aberrant choline metabolism with upregulated levels of GPC has been recognized as a feature of cancer cell proliferation (46). Elevated levels of choline-containing precursors and breakdown products of membrane phospholipids were also detected in pulmonary arterial vascular smooth muscle cells from patients with PAH, pointing to a link between PAH progression and a cancer-like growth pattern (47).
The metabolic alterations detected in RV are in line with the alterations recently published by Graham et al. (48) in a very early mouse model of PAH (SU5416+ 1 week of hypoxia). In the RV, these changes are likely induced by ischemia rather than by impaired oxygen sensing (36). However, the RV undergoes a number of metabolic changes that are transcriptionally mediated. Although the role played by HIF-1α in the metabolic remodeling of the RV in PAH is not completely clear, several investigators have found that HIF-1α is increased in RV hypertrophy models (25, 49). As a result of HIF-1α activation, angiogenesis was increased, and PDH activity was decreased (34). The PDH-mediated metabolic switch to glycolysis is associated with the impairment of RV function, decreased cardiac output and reduced RV contractility (9). Increased lactate production further impairs RV function secondary to acidosis. The shift to the less energetically efficient process of glycolysis results in an increased glucose flux that can be quantified using 18F-FDG PET imaging (50). We confirmed these metabolic features in our model of PAH, which showed significantly increased lactate and alanine concentrations in the RV, lower glucose concentration and higher FDG uptake. However, HPX-SU mice also showed increased FDG uptake in the LV and alterations in glycolytic pathway were detected in the HPX control group. Previous studies using hypoxia to induce PAH reported that key enzymes in the glycolytic pathway were upregulated in both ventricles, along with the upregulation of HIF-1α (51, 52), suggesting that changes occurred in response to hypoxia and not to RV overload. We have detected similar features where FDG uptake and lactate production are significantly altered in both HPX+SU and HPX mice. We also detected an alteration in lipid metabolism in the RV characterized by lower concentration of free fatty acids in HPX+SU RV tissue. During hypoxia, free fatty acids are metabolized to de novo lipogenesis, with a concomitant reduction in lipid oxidation, resulting in lipid accumulation inside the cells (53, 54).
The increase in glutamine and taurine concentrations in RV tissue are proposed as significant biomarkers of RV hypertrophy in HPX+SU mice. Both metabolites showed a high correlation with RV wall thickness. In a normal heart, the glutaminolysis rate is very low; however, it is selectively induced in the RV in PAH via the c-Myc transcriptional pathway, likely as a consequence of RV ischemia (55). Although further studies are needed to completely understand the function of glutaminolysis in RV hypertrophy, extrapolation from studies of cancer and endothelial cells metabolism in PAH would suggest that glutaminolysis supports rapid myocyte growth in RV hypertrophy. The physiological role of taurine is more difficult to understand (56). Taurine is the most abundant amino acid in the heart and likely plays an important role in heart failure, especially as taurine deficiency results in LV dysfunction (57). Taurine can directly inhibit hypertrophy produced by angiotensin II in ventricular myocytes (58); therefore, taurine accumulation can be considered an adaptation to the development of the disease.
Limitations
The PAH model combing hypoxia and SU5416 treatment addresses several of the etiologic mechanisms involved in pulmonary vascular cell hyperproliferation (16), although it also presents several limitations. In PAH, normoxic HIF-1α activation in the pulmonary vasculature initiates the metabolic reprogramming. In this animal model, we reproduced this trigger by inducing chronic hypoxia, which activates the HIF-1α pathway not only in the lung but also in the heart and other tissues. Therefore, the metabolic reprogramming observed in the RV will be induced by both pulmonary vasculature overpressure and exposure to chronic hypoxia. The inclusion of a second control group of healthy mice under hypoxia and the analysis of metabolic alterations in the LV allows us to discriminate the metabolic effects of each contribution, but some minor metabolic changes caused by RV overload could be obscured by the metabolic effects of chronic hypoxia. Second, we did not measure RV systolic pressure (RVSP) to avoid the metabolic response to the procedure. Although RVSP is the gold standard for determining pulmonary hypertension in mice, it is determined with a microtip catheter inserted through the jugular vein that may induce a metabolic alteration in the heart. We confirmed the PAH phenotype previously reported in this animal model (14, 15) by measuring Fulton's and medial thickness indices. Finally, further studies are required to completely understand the role of VEGF inhibition in this model. Several lines of evidence indicate that SU5416 may play a critical role in initial endothelial cell death and in the selection of apoptosis-resistant proliferating cells, which eventually obliterate the pulmonary arteries (59).
Conclusions
We demonstrated that the PAH mouse model induced by the combination of hypoxia and SU5416 treatment reproduces the metabolic abnormalities observed in the RV and pulmonary circulation in PAH patients. Specifically, we detected an upregulation of glycolysis and the presence of glutamine and fatty acid metabolic pathways in lung vasculature. We also detected alterations in some metabolites related to cell proliferation that may represent new therapeutic targets for PAH. In addition, we monitored the specific RV metabolic alterations induced by pulmonary overpressure. In summary, our study demonstrates that metabolomic analysis in a murine model of PAH induced by hypoxia and VEGF inhibition may become a valuable tool for testing new treatments for this severe disease.
Data Availability
The datasets generated for this study can be found in the figshare repository https://figshare.com/s/9823b75c9bf0ff15fc8f.
Author Contributions
JI-G designed studies, performed experiments, analyzed data, and prepared and reviewed the manuscript. TA designed studies, performed experiments, and analyzed data. YR performed experiments. VG-R. analyzed data. AS and SM-P reviewed the manuscript. JR-C designed studies and prepared and reviewed the manuscript.
Funding
This work was supported by the Spanish Ministry of Economy, Industry and Competitiveness (MEIC-AEI) grant SAF2017-84494-C2-1-R and the Comunidad de Madrid (B2017-BMD3731 and B2017-BMD3875). JI-G. is a CNIC IPP COFUND Fellow and has received funding from the People Programme (Marie Curie Actions) of the FP7/2007-2013 under REA grant agreement n° 600396. TA is a M+Visión COFUND Advanced Fellow and has received funding from Consejería de Educación, Juventud y Deporte of the Comunidad de Madrid and FP7-PEOPLE-291820 programme. The CNIC is supported by MEIC-AEI and the Pro CNIC Foundation and is a Severo Ochoa Center of Excellence (MEIC award SEV-2015-0505).
Conflict of Interest Statement
The authors declare that the research was conducted in the absence of any commercial or financial relationships that could be construed as a potential conflict of interest.
Acknowledgments
The authors thank the technician Palmira Villa, B.Sc. of the Nuclear Magnetic Resonance Centre of Complutense University of Madrid, Madrid, Spain, for nuclear magnetic resonance spectra acquisition. The manuscript was edited by American Journal Experts team.
References
1. Farber HW, Loscalzo J. Pulmonary arterial hypertension. N Engl J Med. (2004) 351:1655–65. doi: 10.1056/NEJMra035488
2. Marsboom G, Toth PT, Ryan JJ, Hong Z, Wu X, Fang YH, et al. Dynamin-related protein 1-mediated mitochondrial mitotic fission permits hyperproliferation of vascular smooth muscle cells and offers a novel therapeutic target in pulmonary hypertension. Circ Res. (2012) 110:1484–97. doi: 10.1161/CIRCRESAHA.111.263848
3. Freund-Michel V, Khoyrattee N, Savineau JP, Muller B, Guibert C. Mitochondria: roles in pulmonary hypertension. Int J Biochem Cell Biol. (2014) 55:93–7. doi: 10.1016/j.biocel.2014.08.012
4. Rehman J, Archer SL. A proposed mitochondrial-metabolic mechanism for initiation and maintenance of pulmonary arterial hypertension in fawn-hooded rats: the Warburg model of pulmonary arterial hypertension. Adv Exp Med Biol. (2010) 661:171–85. doi: 10.1007/978-1-60761-500-2_11
5. Xu W, Koeck T, Lara AR, Neumann D, DiFilippo FP, Koo M, et al. Alterations of cellular bioenergetics in pulmonary artery endothelial cells. Proc Natl Acad Sci USA. (2007) 104:1342–7. doi: 10.1073/pnas.0605080104
6. Zhao Y, Peng J, Lu C, Hsin M, Mura M, Wu L, et al. Metabolomic heterogeneity of pulmonary arterial hypertension. PLoS ONE (2014) 9:e88727. doi: 10.1371/journal.pone.0088727
7. Fessel JP, Hamid R, Wittmann BM, Robinson LJ, Blackwell T, Tada Y, et al. Metabolomic analysis of bone morphogenetic protein receptor type 2 mutations in human pulmonary endothelium reveals widespread metabolic reprogramming. Pulm Circ. (2012) 2:201–13. doi: 10.4103/2045-8932.97606
8. Tuder RM, Davis LA, Graham BB. Targeting energetic metabolism: a new frontier in the pathogenesis and treatment of pulmonary hypertension. Am J Respir Crit Care Med. (2012) 185:260–6. doi: 10.1164/rccm.201108-1536PP
9. Piao L, Marsboom G, Archer SL. Mitochondrial metabolic adaptation in right ventricular hypertrophy and failure. J Mol Med. (2010) 88:1011–20. doi: 10.1007/s00109-010-0679-1
10. Sutendra G, Michelakis ED. The metabolic basis of pulmonary arterial hypertension. Cell Metab. (2014) 19:558–73. doi: 10.1016/j.cmet.2014.01.004
11. Paulin R, Michelakis ED. The metabolic theory of pulmonary arterial hypertension. Circ Res. (2014) 115:148–64. doi: 10.1161/CIRCRESAHA.115.301130
12. Stenmark KR, Meyrick B, Galie N, Mooi WJ, McMurtry IF. Animal models of pulmonary arterial hypertension: the hope for etiological discovery and pharmacological cure. Am J Physiol Lung Cell Mol Physiol. (2009) 297:L1013–32. doi: 10.1152/ajplung.00217.2009
13. Santos A, Fernandez-Friera L, Villalba M, Lopez-Melgar B, Espana S, Mateo J, et al. Cardiovascular imaging: what have we learned from animal models? Front Pharmacol. (2015) 6:227. doi: 10.3389/fphar.2015.00227
14. Vitali SH, Hansmann G, Rose C, Fernandez-Gonzalez A, Scheid A, Mitsialis SA, et al. The Sugen 5416/hypoxia mouse model of pulmonary hypertension revisited: long-term follow-up. Pulm Circ. (2014) 4:619–29. doi: 10.1086/678508
15. Ciuclan L, Bonneau O, Hussey M, Duggan N, Holmes AM, Good R, et al. A novel murine model of severe pulmonary arterial hypertension. Am J Respir Crit Care Med. (2011) 184:1171–82. doi: 10.1164/rccm.201103-0412OC
16. Bueno-Beti C, Hadri L, Hajjar RJ, Sassi Y. The sugen 5416/Hypoxia mouse model of pulmonary arterial hypertension. Methods Mol Biol. (2018) 1816:243–52. doi: 10.1007/978-1-4939-8597-5_19
17. Thibault HB, Kurtz B, Raher MJ, Shaik RS, Waxman A, Derumeaux G, et al. Noninvasive assessment of murine pulmonary arterial pressure: validation and application to models of pulmonary hypertension. Circ Cardiov Imaging (2010) 3:157–63. doi: 10.1161/CIRCIMAGING.109.887109
18. Izquierdo-Garcia JL, Nin N, Ruiz-Cabello J, Rojas Y, de Paula M, Lopez-Cuenca S, et al. A metabolomic approach for diagnosis of experimental sepsis. Intensive Care Med. (2011) 37:2023–32. doi: 10.1007/s00134-011-2359-1
19. Faul F, Erdfelder E, Lang AG, Buchner A. G*Power 3: a flexible statistical power analysis program for the social, behavioral, and biomedical sciences. Behav Res Methods (2007) 39:175–91. doi: 10.3758/BF03193146
20. Hotelling H. Analysis of a complex of statistical variables into principal components. J Educ Psychol. (1933) 24:417.
21. Hotelling H. The generalization of student's ratio. Ann Math Stat. (1931) 2:360–78. doi: 10.1214/aoms/1177732979
22. Izquierdo-Garcia JL, Rodriguez I, Kyriazis A, Villa P, Barreiro P, Desco M, et al. A novel R-package graphic user interface for the analysis of metabonomic profiles. BMC Bioinformatics (2009) 10:363. doi: 10.1186/1471-2105-10-363
23. Wishart DS, Jewison T, Guo AC, Wilson M, Knox C, Liu Y, et al. HMDB 3.0–The human metabolome database in 2013. Nucleic Acids Res. (2013) 41:D801–7. doi: 10.1093/nar/gks1065
24. Vinaixa M, Samino S, Saez I, Duran J, Guinovart JJ, Yanes O. A guideline to univariate statistical analysis for LC/MS-Based untargeted metabolomics-derived data. Metabolites (2012) 2:775–95. doi: 10.3390/metabo2040775
25. Sutendra G, Dromparis P, Paulin R, Zervopoulos S, Haromy A, Nagendran J, et al. A metabolic remodeling in right ventricular hypertrophy is associated with decreased angiogenesis and a transition from a compensated to a decompensated state in pulmonary hypertension. J Mol Med. (2013) 91:1315–27. doi: 10.1007/s00109-013-1059-4
26. Marsboom G, Wietholt C, Haney CR, Toth PT, Ryan JJ, Morrow E, et al. Lung (1)(8)F-fluorodeoxyglucose positron emission tomography for diagnosis and monitoring of pulmonary arterial hypertension. Am J Respir Crit Care Med. (2012) 185:670–9. doi: 10.1164/rccm.201108-1562OC
27. Hagan G, Southwood M, Treacy C, Ross RM, Soon E, Coulson J, et al. (18)FDG PET imaging can quantify increased cellular metabolism in pulmonary arterial hypertension: a proof-of-principle study. Pulm Circ. (2011) 1:448–55. doi: 10.4103/2045-8932.93543
28. Lundgrin EL, Park MM, Sharp J, Tang WH, Thomas JD, Asosingh K, et al. Fasting 2-deoxy-2-[18F]fluoro-D-glucose positron emission tomography to detect metabolic changes in pulmonary arterial hypertension hearts over 1 year. Ann Am Thorac Soc. (2013) 10:1–9. doi: 10.1513/AnnalsATS.201206-029OC
29. Izquierdo-Garcia JL, Naz S, Nin N, Rojas Y, Erazo M, Martinez-Caro L, et al. A metabolomic approach to the pathogenesis of ventilator-induced Lung Injury. Anesthesiology (2014) 120:694–702. doi: 10.1097/ALN.0000000000000074
30. Bujak R, Mateo J, Blanco I, Izquierdo-Garcia JL, Dudzik D, Markuszewski MJ, et al. New biochemical insights into the mechanisms of pulmonary arterial hypertension in humans. PLoS ONE (2016) 11:e0160505. doi: 10.1371/journal.pone.0160505
31. Rhodes CJ, Ghataorhe P, Wharton J, Rue-Albrecht KC, Hadinnapola C, Watson G, et al. Plasma metabolomics implicates modified transfer RNAs and altered bioenergetics in the outcomes of pulmonary arterial hypertension. Circulation (2017) 135:460–75. doi: 10.1161/CIRCULATIONAHA.116.024602
32. Deidda M, Piras C, Cadeddu Dessalvi C, Locci E, Barberini L, Orofino S, et al. Distinctive metabolomic fingerprint in scleroderma patients with pulmonary arterial hypertension. Int J Cardiol. (2017) 241:401–6. doi: 10.1016/j.ijcard.2017.04.024
33. Wang X, Shults NV, Suzuki YJ. Oxidative profiling of the failing right heart in rats with pulmonary hypertension. PloS ONE (2017) 12:e0176887. doi: 10.1371/journal.pone.0176887
34. Ryan JJ, Huston J, Kutty S, Hatton ND, Bowman L, Tian L, et al. Right ventricular adaptation and failure in pulmonary arterial hypertension. Can J Cardiol. (2015) 31:391–406. doi: 10.1016/j.cjca.2015.01.023
35. Assad TR, Hemnes AR. Metabolic dysfunction in pulmonary arterial hypertension. Curr Hypertens Rep. (2015) 17:20. doi: 10.1007/s11906-014-0524-y
36. Ryan JJ, Archer SL. Emerging concepts in the molecular basis of pulmonary arterial hypertension: part I: metabolic plasticity and mitochondrial dynamics in the pulmonary circulation and right ventricle in pulmonary arterial hypertension. Circulation (2015) 131:1691–702. doi: 10.1161/CIRCULATIONAHA.114.006979
37. Shimoda LA, Manalo DJ, Sham JS, Semenza GL, Sylvester JT. Partial HIF-1alpha deficiency impairs pulmonary arterial myocyte electrophysiological responses to hypoxia. Am J Physiol Lung Cell Mol Physiol. (2001) 281:L202–8. doi: 10.1152/ajplung.2001.281.1.L202
38. Kim JW, Tchernyshyov I, Semenza GL, Dang CV. HIF-1-mediated expression of pyruvate dehydrogenase kinase: a metabolic switch required for cellular adaptation to hypoxia. Cell Metab. (2006) 3:177–85. doi: 10.1016/j.cmet.2006.02.002
39. Sutendra G, Bonnet S, Rochefort G, Haromy A, Folmes KD, Lopaschuk GD, et al. Fatty acid oxidation and malonyl-CoA decarboxylase in the vascular remodeling of pulmonary hypertension. Sci Transl Med. (2010) 2:44ra58. doi: 10.1126/scitranslmed.3001327
40. Guarnieri C, Muscari C. Beneficial effects of trimetazidine on mitochondrial function and superoxide production in the cardiac muscle of monocrotaline-treated rats. Biochem Pharmacol. (1988) 37:4685–8
41. Goveia J, Stapor P, Carmeliet P. Principles of targeting endothelial cell metabolism to treat angiogenesis and endothelial cell dysfunction in disease. EMBO Mol Med. (2014) 6:1105–20. doi: 10.15252/emmm.201404156
42. Amelio I, Cutruzzola F, Antonov A, Agostini M, Melino G. Serine and glycine metabolism in cancer. Trends Biochem Sci. (2014) 39:191–8. doi: 10.1016/j.tibs.2014.02.004
43. Padron-Barthe L, Villalba-Orero M, Gomez-Salinero JM, Acin-Perez R, Cogliati S, Lopez-Olaneta M, et al. Activation of serine one-carbon metabolism by Calcineurin Abeta1 reduces myocardial hypertrophy and improves ventricular function. J Am Coll Cardiol. (2018) 71:654–67. doi: 10.1016/j.jacc.2017.11.067
44. Jain M, Nilsson R, Sharma S, Madhusudhan N, Kitami T, Souza AL, et al. Metabolite profiling identifies a key role for glycine in rapid cancer cell proliferation. Science (2012) 336:1040–4. doi: 10.1126/science.1218595
45. McCarty MF, Barroso-Aranda J, Contreras F. The hyperpolarizing impact of glycine on endothelial cells may be anti-atherogenic. Med Hypotheses (2009) 73:263–4. doi: 10.1016/j.mehy.2008.12.021
46. Glunde K, Bhujwalla ZM, Ronen SM. Choline metabolism in malignant transformation. Nat Rev Cancer (2011) 11:835–48. doi: 10.1038/nrc3162
47. Kudryashova TV, Goncharov DA, Pena A, Ihida-Stansbury K, DeLisser H, Kawut SM, et al. Profiling the role of mammalian target of rapamycin in the vascular smooth muscle metabolome in pulmonary arterial hypertension. Pulm Circ. (2015) 5:667–80. doi: 10.1086/683810
48. Graham BB, Kumar R, Mickael C, Kassa B, Koyanagi D, Sanders L, et al. Vascular adaptation of the right ventricle in experimental pulmonary hypertension. Am J Respir Cell Mol Biol. (2018). doi: 10.1165/rcmb.2018-0095OC. [Epub ahead of print].
49. Bohuslavova R, Kolar F, Kuthanova L, Neckar J, Tichopad A, Pavlinkova G. Gene expression profiling of sex differences in HIF1-dependent adaptive cardiac responses to chronic hypoxia. J Appl Physiol. (2010) 109:1195–202. doi: 10.1152/japplphysiol.00366.2010
50. Bogaard HJ, Natarajan R, Henderson SC, Long CS, Kraskauskas D, Smithson L, et al. Chronic pulmonary artery pressure elevation is insufficient to explain right heart failure. Circulation (2009) 120:1951–60. doi: 10.1161/CIRCULATIONAHA.109.883843
51. Nouette-Gaulain K, Malgat M, Rocher C, Savineau JP, Marthan R, Mazat JP, et al. Time course of differential mitochondrial energy metabolism adaptation to chronic hypoxia in right and left ventricles. Cardiovasc Res. (2005) 66:132–40. doi: 10.1016/j.cardiores.2004.12.023
52. Bruns DR, Brown RD, Stenmark KR, Buttrick PM, Walker LA. Mitochondrial integrity in a neonatal bovine model of right ventricular dysfunction. Am J Physiol Lung Cell Mol Physiol. (2015) 308:L158–67. doi: 10.1152/ajplung.00270.2014
53. Talati MH, Brittain EL, Fessel JP, Penner N, Atkinson J, Funke M, et al. Mechanisms of lipid accumulation in the bone morphogenetic protein receptor type 2 mutant right ventricle. Am J Respir Crit Care Med. (2016) 194:719–28. doi: 10.1164/rccm.201507-1444OC
54. Hemnes AR, Brittain EL, Trammell AW, Fessel JP, Austin ED, Penner N, et al. Evidence for right ventricular lipotoxicity in heritable pulmonary arterial hypertension. Am J Respir Crit Care Med. (2014). 189:325–34. doi: 10.1164/rccm.201306-1086OC
55. Piao L, Fang YH, Parikh K, Ryan JJ, Toth PT, Archer SL. Cardiac glutaminolysis: a maladaptive cancer metabolism pathway in the right ventricle in pulmonary hypertension. J Mole Med. (2013) 91:1185–97. doi: 10.1007/s00109-013-1064-7
56. Schaffer SW, Jong CJ, Ramila KC, Azuma J. Physiological roles of taurine in heart and muscle. J Biomed Sci. (2010) 17(Suppl. 1):S2. doi: 10.1186/1423-0127-17-S1-S2
57. Pion PD, Kittleson MD, Rogers QR, Morris JG. Myocardial failure in cats associated with low plasma taurine: a reversible cardiomyopathy. Science (1987) 237:764–8.
58. Azuma M, Takahashi K, Fukuda T, Ohyabu Y, Yamamoto I, Kim S, et al. Taurine attenuates hypertrophy induced by angiotensin II in cultured neonatal rat cardiac myocytes. Eur J Pharmacol. (2000) 403:181–8. doi: 10.1016/S0014-2999(00)00483-0
59. Taraseviciene-Stewart L, Kasahara Y, Alger L, Hirth P, McMahon G, Waltenberger J, et al. Inhibition of the VEGF receptor 2 combined with chronic hypoxia causes cell death-dependent pulmonary endothelial cell proliferation and severe pulmonary hypertension. FASEB J. (2001) 15:427–38. doi: 10.1096/fj.00-0343com
Keywords: pulmonary arterial hypertension, metabolomics, preclinical models, molecular imaging, NMR spectroscopy
Citation: Izquierdo-Garcia JL, Arias T, Rojas Y, Garcia-Ruiz V, Santos A, Martin-Puig S and Ruiz-Cabello J (2018) Metabolic Reprogramming in the Heart and Lung in a Murine Model of Pulmonary Arterial Hypertension. Front. Cardiovasc. Med. 5:110. doi: 10.3389/fcvm.2018.00110
Received: 16 May 2018; Accepted: 27 July 2018;
Published: 15 August 2018.
Edited by:
Manfredi Tesauro, Università degli Studi di Roma Tor Vergata, ItalyReviewed by:
A. A. Roger Thompson, University of Sheffield, United KingdomShizuka Uchida, Cardiovascular Innovation Institute (CII), United States
Copyright © 2018 Izquierdo-Garcia, Arias, Rojas, Garcia-Ruiz, Santos, Martin-Puig and Ruiz-Cabello. This is an open-access article distributed under the terms of the Creative Commons Attribution License (CC BY). The use, distribution or reproduction in other forums is permitted, provided the original author(s) and the copyright owner(s) are credited and that the original publication in this journal is cited, in accordance with accepted academic practice. No use, distribution or reproduction is permitted which does not comply with these terms.
*Correspondence: Jesus Ruiz-Cabello, jruizcabello@cicbiomagune.es