Magma Budget From Lava and Tephra Volumes Erupted During the 25-26 October 2013 Lava Fountain at Mt Etna
 Daniele Andronico1*
  Boris Behncke1
  Emanuela De Beni1 Antonino Cristaldi1 Simona Scollo1 Manuela Lopez2 Maria D. Lo Castro1
- 1Istituto Nazionale di Geofisica e Vulcanologia, Osservatorio Etneo, Catania, Italy
- 2Istituto Nazionale di Geofisica e Vulcanologia, Palermo, Italy
Determining the volume of the various types of products of a highly frequent active volcano can be very difficult, especially if most of them are deposited on a growing volcanic cone. The New South-East Crater (NSEC) of Mt Etna, Italy, may be considered one of the best case studies because of tens of paroxysmal episodes which it produced in the last few years. On 25-26 October 2013, a lava fountain at the NSEC produced magma jets up to 500 m high, a maximum ~8 km high column, a multilobate lava flow field 1.3–1.5 km long, and almost 30 m of growth in height of the NSEC cone. Mapping of explosive and effusive deposits allowed us to calculate the total volume of erupted products, including lava flows, proximal, and distal tephra fallout, and the amount of coarse pyroclastics on the cone. The estimation of the latter products was also confirmed subtracting digital elevation models (DEMs) obtained at different stages of the NSEC growth. Results show that the volume of tephra fallout away from the cone was only <5 % of the total erupted magma, while the total volume of pyroclasts (distal plus proximal fallout) was about a third of the lava volume. Our analysis suggests that, at least for the studied event, three fourth of the involved magma was already partially degassed and thus emitted as lava flows. Hence, the main distinctive character of lava fountains at Etna, i.e., formation of eruption column and propagation of tephra-laden volcanic plumes to tens of km away from the volcano, would not contribute significantly to the final budget of erupted magma of the 25-26 October 2013 eruption. We therefore propose that the same magma dynamics, i.e., similar magma distribution, probably occur also during most of the common lava fountain episodes. Finally, we infer that quantifying the magma budget from lava and tephra volumes erupted during the 25-26 October lava fountain can give new insights into the mechanisms driving the eruptive behavior of Etna during paroxysmal activity from the summit craters, and provide useful indications also in terms of volcanic hazard.
Introduction
The simultaneous occurrence of intense explosive and effusive activity—often in brief, paroxysmal eruptive episodes—has been observed at a number of basaltic volcanoes, such as Pacaya (Rose et al., 2013) and Fuego in Guatemala (Lyons et al., 2010), Klyuchevskoy in Kamchatka (Zharinov and Demyanchuk, 2016), Manam in Papua New-Guinea (Tupper et al., 2007), Pavlof in Alaska (Waythomas et al., 2014), Llaima in Chile (Romero et al., 2013), and Mt Etna in Italy (Behncke et al., 2006; Calvari et al., 2018). However, the exact volumetric contribution of lava flows vs. proximal vs. distal tephra deposits has thus far not been precisely evaluated for any of these volcanoes, although it potentially bears significant implications for volcanic hazard assessments.
The New South-East Crater (NSEC) of Etna (Figure 1) is a young and still growing volcanic cone, which formed by accumulation of lava and proximal pyroclastics (Figure 2a; Behncke et al., 2014). These products were mostly emplaced around a primordial pit-shaped vent located on the eastern flank of the South-East Crater (SEC; Andronico et al., 2013, 2014a,b), one of the summit craters of Etna, between 2011 and 2013, when 48 paroxysmal episodes or “paroxysms” took place (Corsaro et al., 2017; Giuffrida and Viccaro, 2017). Eruptive activity after 2013 has led to the coalescence of the NSEC with the SEC, while most recently, in the spring of 2017, effusive and Strombolian activity from new vents caused the growth of a small cone in between, and on top of, the two craters (Andronico et al., 2017).
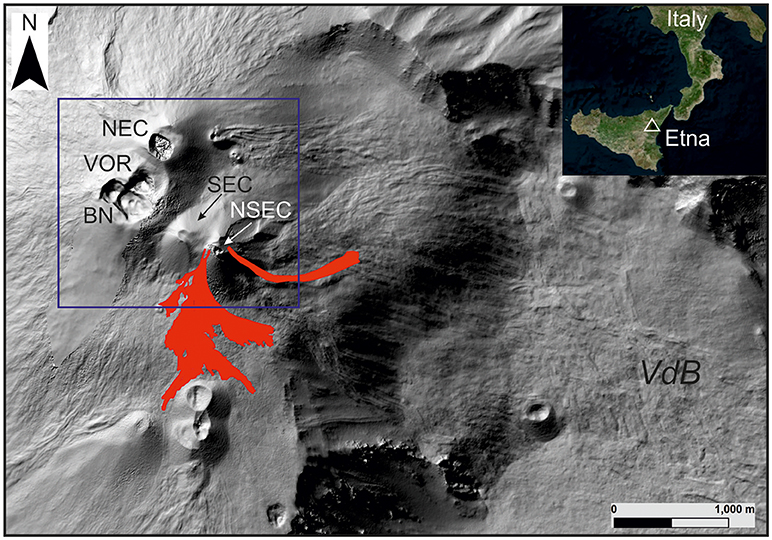
Figure 1. Shaded relief of Mount Etna summit area. The blue square encloses the summit craters: NSEC, New South-East Crater; SEC, South-East Crater, BN, Bocca Nuova; VOR, Voragine; NEC, North-East Crater; VdB, Valle del Bove. Red polygons are the 25-26 October lava flows. Top right inset: map of southern Italy showing the location of Sicily.
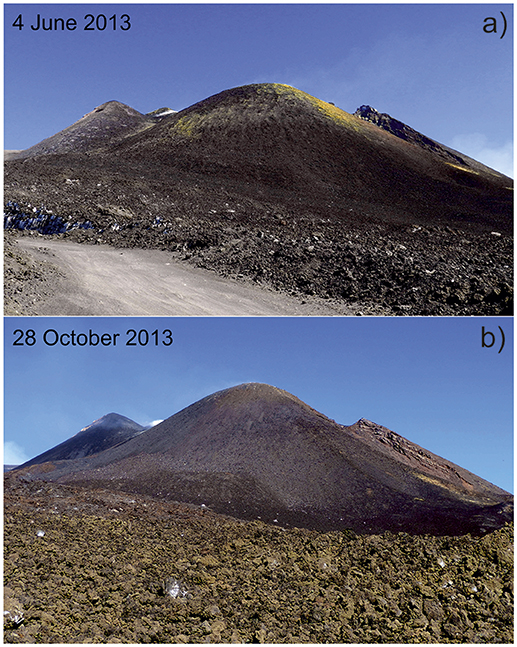
Figure 2. The NSEC cone seen from south-southeast (a) before and (b) after the 26 October 2013 paroxysmal episode. Vertical growth of the cone, by ~30 m, is well visible in (b). Photos by B. Behncke.
The 25-26 October 2013 lava fountain followed a quiescent interval of 6 months after a paroxysmal episode on 27 April 2013; it also opened a new “episodic eruption,” the third in the period 2011–2013 (Andronico et al., 2014b), consisting of a sequence of 8 paroxysmal episodes, the last of which ended on 1 January 2014. Rather fine weather conditions allowed continuous observation of the 25-26 October eruptive activity: while lava flows were confined to a radius of 1.5 km from the NSEC, the more coarse-grained, cone-building fraction of pyroclastics (hereafter proximal tephra) was mostly deposited on the southern half of the NSEC cone (significantly contributing to its growth; Figure 2b), and distal tephra fallout (hereafter distal tephra) was dispersed up to several tens of kilometers distance from Etna. Remote sensing measurements, furthermore, retrieved aerosol particle size dispersal to far as Lampedusa, more than 350 km downwind (Sellitto et al., 2016).
Both effusive and explosive products were mapped and sampled within the first few days after the end of the eruption. This mapping allowed to quantify for the first time the relationships between effusive and explosive activity in terms of magma volume. In fact, although we consider the 25-26 October episode as a unique eruptive event, during paroxysmal episodes effusive and explosive activity occur from closed-space vents, reflecting the different types of magma erupted, i.e., degassed (lava flows) vs. gas-rich (tephra).
Here we consider dense rock equivalent (DRE) values for volumes and Mass Eruption Rates (MER) estimated for the output of lava and tephra (both distal and proximal), in order to discuss the magma dynamics and its partition in the shallow plumbing system during the 25-26 October 2013 lava fountain. By detailing the effusive and explosive contribution of volcanics, we take an in-depth look at the mechanisms that may drive the eruptive behavior of Etna during a paroxysmal episode from one of its summit craters.
The 2011-2013 Paroxysmal Activity
Eruptive activity at Etna characteristically occurs either as eruptions from vents on the flanks of the volcano (Neri et al., 2011), or eruptions from one or more of the four summit craters, NSEC, SEC, Voragine (VOR), Bocca Nuova (BN), and Northeast Crater (NEC). Summit eruptions are often long-lived, and especially in recent decades occur in the form of multiple sequences of paroxysmal eruptive episodes. This type of activity has been very common in recent years at Etna and particularly at the SEC in 1998-2008 (~130 episodes; e.g., Andronico et al., 2014a) and the NSEC thereafter, when both craters displayed “episodic eruptions,” i.e., sequences of paroxysmal episodes (Andronico and Corsaro, 2011). These events are characterized by powerful Strombolian to lava fountaining activity, accompanied by the formation of eruption columns (with tephra fallout extending over distances of several tens, and rarely, hundreds, of kilometers from the volcano) and spawning of lava flows onto the upper slopes of Etna (e.g., Alparone et al., 2003; Andronico et al., 2014a; Behncke et al., 2014; De Beni et al., 2015).
On 12 January 2011, summit activity resumed at Etna after 3 years of mild explosive activity mainly consisting of Strombolian bursts and ash emissions (Andronico et al., 2013). The last paroxysmal episode, in fact, had occurred on 10 May 2008 at the SEC (Andronico et al., 2008b), 3 days before the beginning of the 2008–2009 flank eruption (e.g., Aloisi et al., 2009). The 12 January episode opened a sequence of paroxysmal episodes consisting of 25 lava fountains up to 24 April 2012 (Andronico et al., 2014b; Behncke et al., 2014). Two shorter paroxysmal sequences occurred also in 2013 (De Beni et al., 2015), exactly between 19 February and 27 April (13 episodes), and between 25 October and 30 December (8 episodes).
As reported in several papers (e.g., Alparone et al., 2003), each paroxysmal episode may be subdivided into three eruption phases. The resumption phase is marked by the onset of increasingly intense explosive activity at the summit vents of the cone, which typically is accompanied by the opening of one or more lower effusive vents producing low-rate lava emission. The transition from powerful Strombolian activity to sustained lava fountaining leads to the paroxysmal phase, the most critical phase being characterized by the formation of an eruption column for several kilometers above the vent and an exponential increase in the effusion rate at the effusive vent(s). Finally, the rapid decline of all eruptive phenomena up to their total cessation represents the conclusive phase of the paroxysmal episode.
Episode after episode, the 2011–2012 sequence built the NSEC cone on the eastern flank of the SEC. On this side, a WNW-ESE trending eruptive vent-fissure repeatedly opened during the paroxysmal activity, feeding virtually all of the lava flows down toward the Valle del Bove. The 25 episodes in 2011-2012 were initially characterized by a low occurrence frequency, which then increased in the period July-September 2011 with episodes recurring every 5-10 days. Moreover, the 2011–12 paroxysmal activity produced tephra fallout deposits of similar order of magnitude in terms of mass loading and areal extension.
During the two sequences in 2013, the NSEC started to produce almost regularly lava flows also toward NE (February-April) and SE (October-December). Furthermore, the 2013 activity was characterized by episodes strongly varying in intensity. The 23 February and 23 November 2013 episodes are among the most intense summit paroxysms observed in the recent history of Etna: they produced tephra fallout up to 400 km from the volcano (Poret et al., 2018a,b). Conversely, the last 2 episodes in December 2013 consisted of prevalently powerful Strombolian activity alternating with rather discontinuous fountaining.
The 25-26 October 2013 Paroxysmal Episode
After about 6 weeks of sporadic ash emissions and weak Strombolian activity from the NSEC, since the morning of 25 October 2013 the video-camera monitoring system and the seismic surveillance networks of the Istituto Nazionale di Geofisica e Vulcanologia, Osservatorio Etneo—Sezione di Catania (INGV-OE) recorded a gradual buildup in Strombolian activity accompanied by a marked rise of the volcanic tremor amplitude. On the early morning of 26 October, the Strombolian explosions blended into a continuous lava fountain about 250 m tall (Figures 3a,b), and an eruption column started to rise (Figures 3c, 4a,b) above the summit of the volcano before being bent toward WSW by the wind (Figure 3d). Initially this plume consisted mostly of gas, but as the activity intensified, the amount of pyroclastics in the eruption column increased, causing tephra fallout on the slopes of the volcano and beyond (Figure 5). At 06:21 GMT (= local time−2) on 26 October 2013 vigorous ash emissions at the nearby Northeast Crater, the tallest of Etna's four summit craters at 3,329 m above sea level (a.s.l.) (Figures 1, 3b, 4c,d, 5), accompanied the magma jets from the NSEC (Figures 4b,e,f), while occasional explosions occurred also at the Bocca Nuova crater (Figures 1, 4g–i). Lava fountaining continued at gradually increasing intensity up to about 500 m in height but without significant variations over the next few hours, while the eruption column rose to up to ~8 km a.s.l. (Corradini et al., 2018) and then started to diminish at about 10:00 GMT. The paroxysmal phase (Alparone et al., 2003) of the whole episode, i.e., the time during which we observed the volcanic plume fed by the eruption column extending away from the volcano, lasted ~8 h, with the most intense activity occurring between 06:00 and 09:00 GMT. Shortly after 02:00 GMT on 26 October, lava had started to spill through a notch in the southwestern rim of the NSEC, feeding a flow that expanded downslope to the southern base of the cone, and then bifurcated into two main lobes on the relatively flat terrain to its south and southeast. The effusion rate increased notably at 04:00 GMT, when a portion of the crater rim collapsed and widened the notch through which the lava was overflowing.
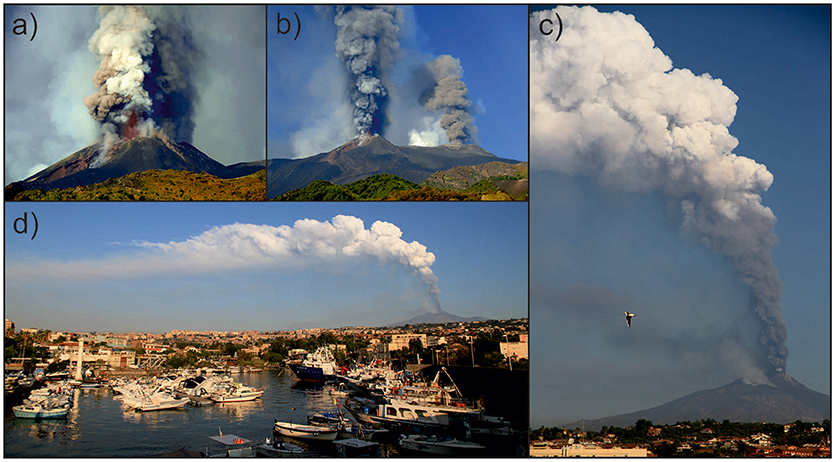
Figure 3. Images showing the evolution of the eruption plume of the 25-26 October 2013 paroxysm between 07:00 and 12:00 of 26 October. (a) Lava fountaining and associated steam, ash and tephra plumes; (b) fountaining jets at the NSEC (left) and coeval dense ash plume from the NEC (right); (c) the dark gray eruption column rising above the NSEC and culminating into a whitish, gas-enriched volcanic plume viewed from S; (d) eruption plume extending to the west of the volcano viewed from the Ognina harbor in Catania. Photos by B. Behncke (a,b) and D. Andronico (c,d).
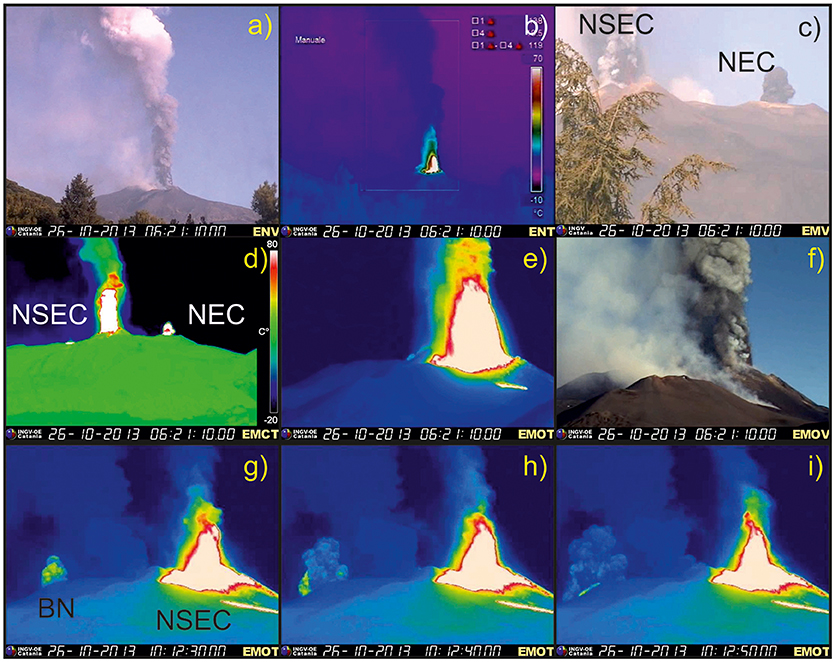
Figure 4. (a) Lava fountaining activity as recorded by the INGV video-surveillance network: (a) Nicolosi visible camera (ENV), (b) Nicolosi thermal camera (ENT), (c) Milo visible camera (EMV) (d) Monte Cagliato thermal (EMCT), (e) Montagnola thermal camera (EMOT), (f) Montagnola visible camera (EMOV); (g,h,i) sequence of frames showing an explosion at the Bocca Nuova Crater (EMOT). Nicolosi and Montagnola cameras are recording from the S, the Milo camera from the SE and the Monte Cagliato from the E. Times are GMT (local time: + 2 h). Frames (a,b,c,d,e,f) show the same eruption time (06:21).
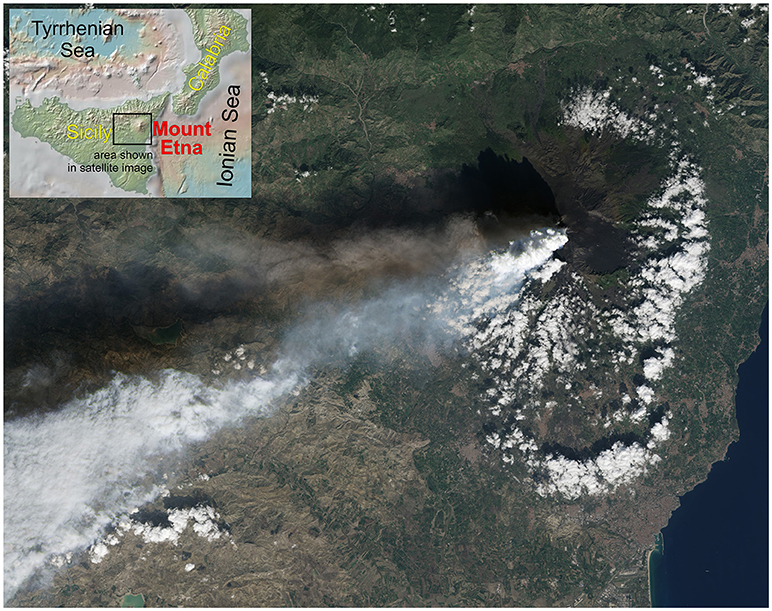
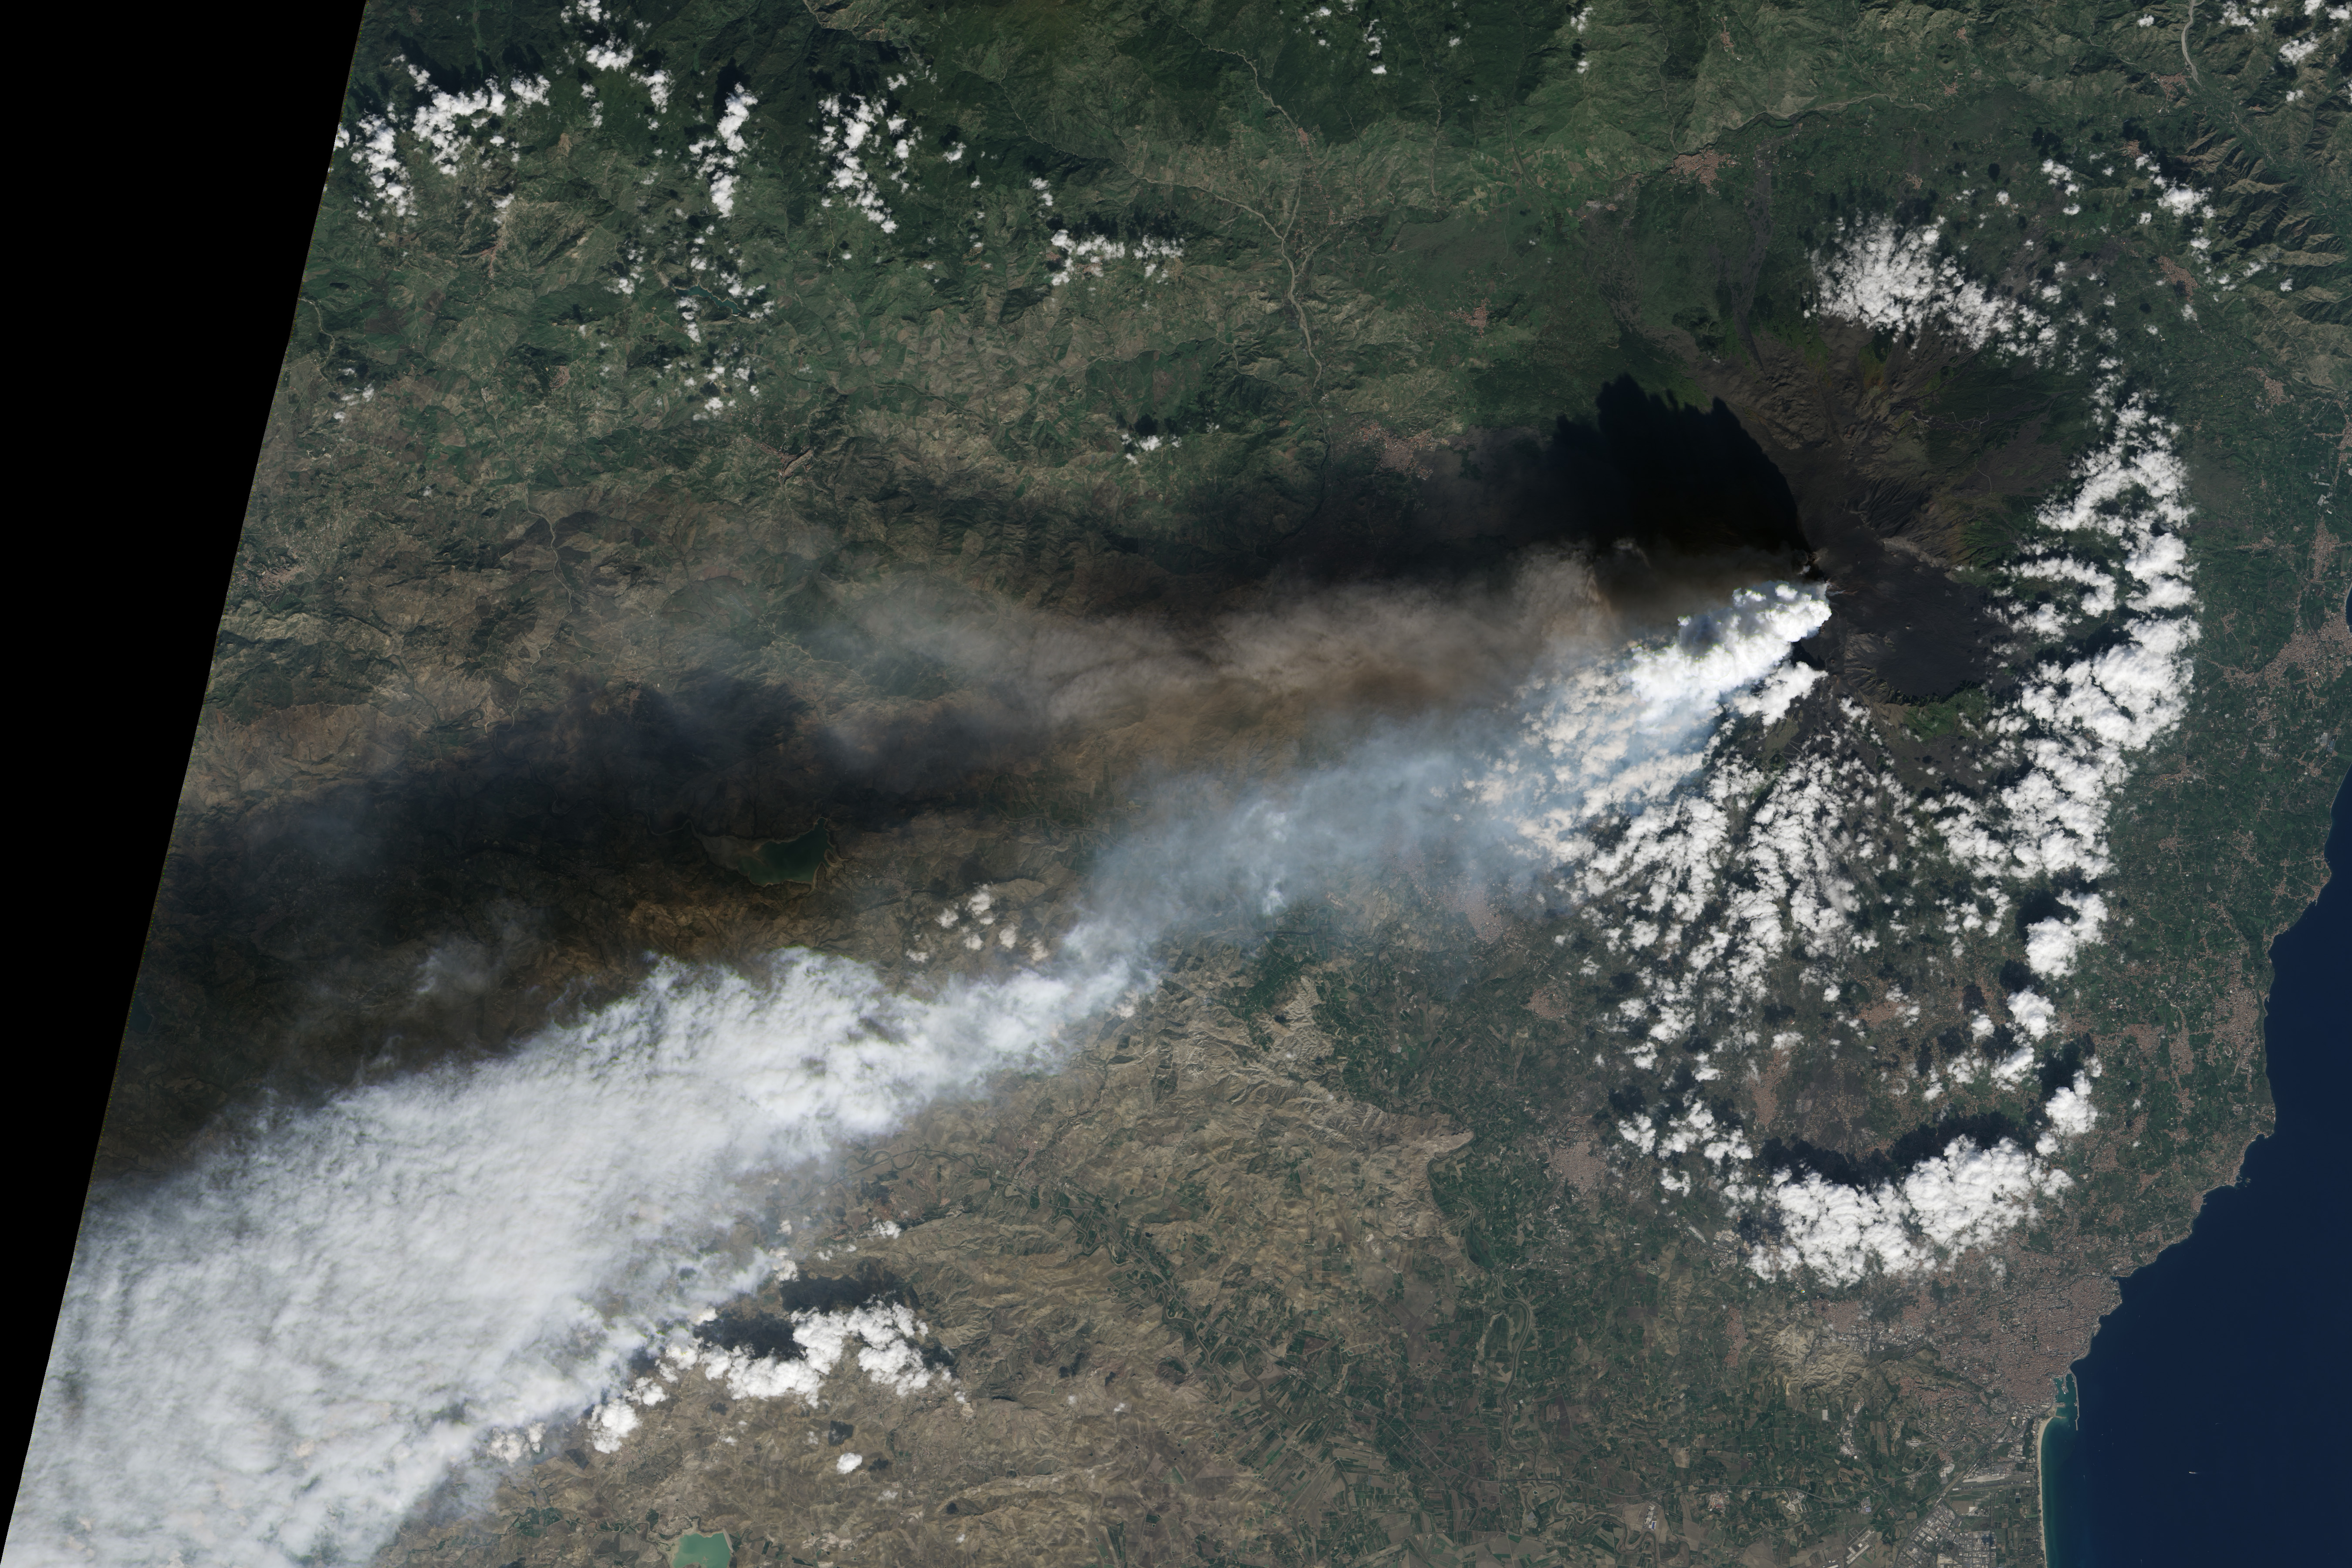
Figure 5. Natural-color image collected by Landsat 8, showing the whitish eruption plume from the NSEC dispersed toward ~WSW of 26 October, 2013 at 11:38 (local time). The darker, shorter volcanic plume above the NSEC plume is emitted from the Northeast Crater and is traveling at a lower elevation than the NSEC plume. NASA Earth Observatory image by Jesse Allen and Robert Simmon, using Landsat data from the USGS Earth Explorer. Area of the image is shown in the index map at upper left. Photograph 2013, at https://eoimages.gsfc.nasa.gov/images/imagerecords/82000/82287/etna_oli_2013299_lrg.jpg.
In the ensuing waning activity, lava overflowed the southeastern rim of the crater, feeding a flow that slowly advanced through a deep trench that had been carved out of the flank of the cone during the previous paroxysmal eruptive episode, on 27 April 2013. This flow eventually reached a length of 1.3 km, burying a part of a lava flow emitted on 27 April. Meanwhile, lava fountaining at the NSEC passed into violent Strombolian activity, often producing powerful explosions caused by the bursting of huge lava blisters, which sent sprays of meter-sized incandescent bombs up to several hundred meters high; most of these bombs were observed to fall onto the northern base of the NSEC cone. By 13:00 GMT, eruptive activity was essentially over, although renewed Strombolian activity occurred in the evening before the eruptive episode ended for good shortly before midnight on 26 October.
The 25-26 October episode brought a few surprises, activity at the NSEC was accompanied by prolonged ash emission at the NEC and episodic explosive bursts at the Bocca Nuova. The breaching of the south rim of the NSEC also opened a path southward for lava flows during this and following episodes. However, the effusive and explosive activity did not show any evident qualitative differences in terms of eruptive style with respect to other paroxysmal episodes, apart from the relatively long duration of its paroxysmal phase.
Methods
During a field survey carried out on 28 October 2013, GPS measurements were performed along the lava flow boundaries to map the lava flows, and at the NSEC in order to update existing maps of the crater and its cone. In particular, 36 thickness measurements were acquired along the lava boundary of the main lava field located on the south flank; 4.5 km of the lava flow boundary were mapped in track mode (i.e., about 60% of the lava flow field). GNSS receivers were connected (via cable) to a binocular laser rangefinder (for details: De Beni and Proietti, 2010; Behncke et al., 2014; www.leica-geosystems.com) for the absolute positioning and dimensioning of inaccessible targets like the summit of the NSEC. The northern portion of the south lava branch, the east branch and the NSEC cone were instead mapped by integrating GPS measurements, field observations and analyses of ground and aerial visible photography. Moreover, the crater rim shape and the fractures along the south-east and north-east flanks of the NSEC were drawn thanks to a satellite image (http://earthobservatory.nasa.gov/NaturalHazards). Joining thickness measurements and camera observations carried out in the field, we subdivided the lava field in different sectors characterized by homogenous thicknesses expressed as minimum and maximum values. The volume was calculated as area per thickness for each sector, we finally summed all the values obtaining the minimum and maximum values of the total lava flow volume.
To compare the erupted magma volumes of the studied episode to previous paroxysmal activity, we completely revisited the data provided by two photogrammetric surveys in May 2012 and October 2014. In particular, we drew the base of the NSEC cone ex novo as it was after the 25-26 October episode, then we selected each lava flow emplaced on the cone and calculated the lava volume on the cone and subtracted this volume from the NSEC cone in order to obtain the volume of proximal pyroclastics constituting the cone.
When mapping the fallout deposit, 13 tephra samples (NSEC261013-1 to 13), representative of the whole area covered, were collected on measured surfaces between 0.7 and 90 km from the NSEC. This allowed us to cover proximal to very distal outcrops based on increasing distances of mass per unit area and grain-size of the fallout deposit (Andronico et al., 2014b). Ten of the samples were dried in oven to quantify the ground load per m2, draw an isomass map and measure grain-sizes by CAMSIZER® (Lo Castro and Andronico, 2008). Further, using a binocular stereoscopic microscope (Nikon SMZ1500) we evaluated the ash componentry of two, differently grain-sized samples by counting 500 clasts for each one in the modal classes 0.250–0.5 and 0.125–0.250 mm on the coarser (NSEC261013-3) and the finer (NSEC261013-5), respectively.
Of the fallout deposit, we estimated the Total Erupted Mass (TEM) by averaging the values from four different methods, i.e., the model following the exponential thinning decay (Pyle, 1989), and its extended version (Fierstein and Nathenson, 1992), power law fit (Bonadonna and Houghton, 2005), and Weibull distribution (Bonadonna and Costa, 2012).
To evaluate the density of lava and tephra, we used values of vesicularity from the literature. In particular, a range of vesicularity has been assumed for lava due to the difficulty of establishing a single value (e.g., Gaonac'h et al., 1996; Herd and Pinkerton, 1997; Harris et al., 2007), that is an average porosity of 20%. As well as for lava, a wide range exists also for tephra density. In this case, in fact, the density values may vary significantly based on the grain-size of the clasts. Fine-grained clasts (e.g., ash particles) have poor or almost no porosity, while lapilli may display a rather broad range of vesicularity. At Etna, however, the commonly low thickness of tephra fallout deposits constrains us to measure the weight per unit area instead of the thickness at selected sites. Therefore, the total mass obtained for the total deposit provides its DRE volume simply subdividing the TEM (in kg) by the density of magma (2.7 g/cm3).
Evaluating an average density for the NSEC cone, instead, is a major challenge due to its rather high heterogeneity, since it is constituted mostly by tephra ranging in grain-size from large clasts (up to meter-sized bombs) to lapilli and ash particles (with varying degrees of compaction and welding) and minor intercalated lava flows. For the purposes of our work, we collected 10 decimeter-sized fragments taken from a portion of the crater rim that collapsed and was rafted downslope during the effusive activity (Figure 6a), and we assumed them to be representative of the cone for providing density measurements. These fragments were dried, weighted, waterproofed with plastic wraps and finally immersed in water, resulting in weights and volumes ranging between 113 and 857 g, and 120 and 700 cm3, respectively, which is equal to clasts from 8 to 18 cm (in dimension). By measuring the excess water volume, we obtained a mean value of density of 1.22 g/cm3, providing a vesicularity of ~55% for the cone. This value agrees well enough with the density value estimated by Mulas et al. (2016) for the 1669 Monti Rossi cone, considering it as consisting of coarse lapilli and bombs (without lava intercalations), of 1.8 g/cm3. So far, in this paper we adopted the value of 50% in order to compare our volume estimation with the value used by Behncke et al. (2014) and De Beni et al. (2015) to evaluate the growth of the NSEC in the period 2011–13. Due to the irregular packing of volcanic particles (strongly varying in size and density) which compose the NSEC, we believe that this value can be considered reasonably realistic though conservative, unless new estimates of volcanic cone density will be published.
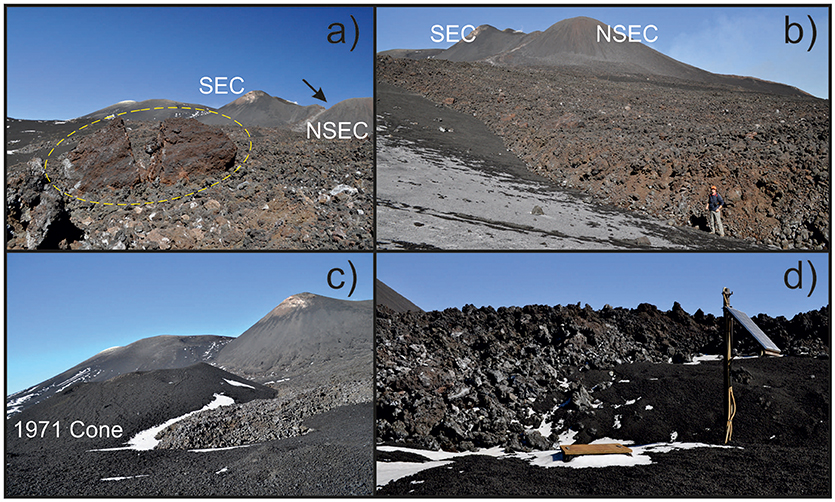
Figure 6. (a) Mega-block of sub-decametric size (dotted yellow line) that collapsed from the rim crater of the NSEC and was rafted downslope by the S lava flows during the 25-26 October 2013 paroxysm. (b) The main lava flow lobe propagating toward South, in the background the peaks of the SEC and NSEC (on the left and right, respectively); see person at top right for scale; (c) the lava flow surrounding the 1971 cone; (d) the southern lava flow threating the TdF seismic station. Photos by D. Andronico.
Results
Growth of the Cone During Paroxysmal Events
The cone of the NSEC grew over a pre-existing subsidence depression formed between 2007 and 2009 and significantly enlarged due to minor explosive activity in 2010 (Andronico et al., 2013); its growth has been then documented by repeated GPS surveys starting from 2011 (Behncke et al., 2014). The NSEC at the time of our study was mostly composed of large welded scoriaceous bombs and blocks; on 26 October, some sizeable blocks (3–5 m) were torn from the crater rim and carried along by the southern lava flow close to the 2002–03 cones (Figures 6a,b). These blocks permitted insights into the structure of the inner portion of the crater rim, consisting of scoria, spatter, and ash layers of reddish-brown color. In Table 1 we reported the values of the cone volumes for the 2011–12 and 2013 sequences. The volume of the cone was estimated at 19 × 106 m3 by Behncke et al. (2014) after the 2011–12 lava fountaining episodes, i.e., 0.76 × 10⁶ m3 per episode. Furthermore, the difference between the May 2012 and October 2014 DEMs (De Beni et al., 2015), when 22 paroxysmal events and a few Strombolian-effusive episodes took place, provides a volume increase for the NSEC of 27.0 ± 0.8 × 10⁶ m3. However, considering that the base of the cone was smaller on 26 October 2013 than the base on October 2014, as deduced from field observation and GPS measurements, we calculate a volume of 23.28 ±1.57 × 10⁶ m3 for the scoria cone in October 2013. By subtracting the volume of the lava flows emplaced over the cone in that period, we obtained a total volume for the NSEC of 20.48 ± 1.69 × 10⁶ m3. Dividing this value per the number of events, we derived an average increase of the cone volume of 1.08 ± 0.08 x 10⁶ m3 for each paroxysm. By averaging the previous two estimates, we assume that, from 2011 to 2013 the NSEC has grown by 0.90 × 10⁶ m3 during each paroxysm, a value we consider representative also for the volume increase caused by the 25-26 October 2013 episode (Table 2).
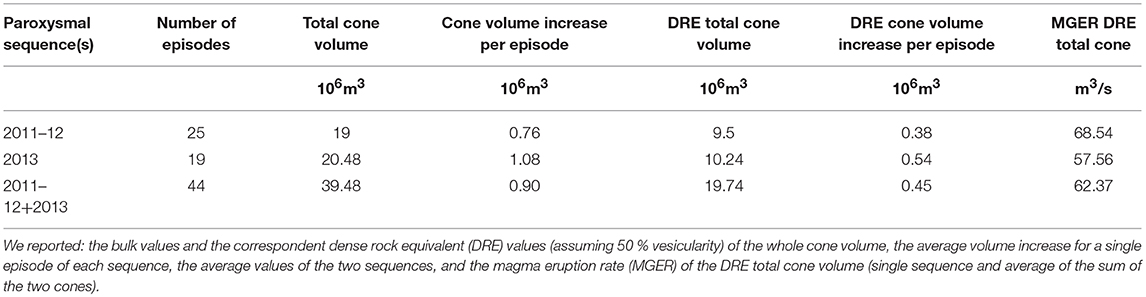
Table 1. Volcanological parameters of the NSEC cone during the 2011–12 and 2013 lava fountaining sequences.
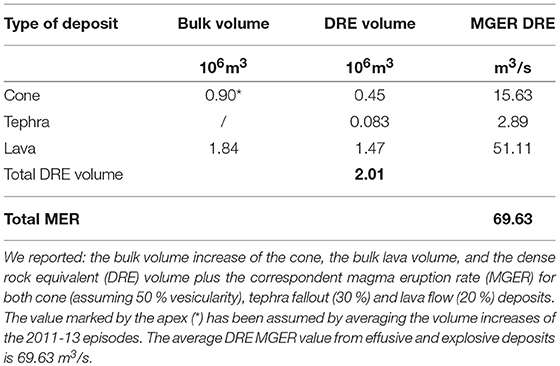
Table 2. Volcanological parameters of the 25–26 October 2013 lava fountain episode.
Distal Tephra Fallout Deposit
During the paroxysmal phase, on 26 October, tephra fallout extended to at least 130 km distance from the vent, beyond the southern coast of Sicily (Figure 7a). The dispersal area of the tephra was quite symmetrical and the deposit well-visible on the ground due to almost constant direction of wind above the volcano from ENE to WSW during the eruption. The load on unit area declined very rapidly orthogonally to the dispersal axis. Adrano, Centuripe (~10 km WSW from Adrano), Caltanissetta and, to a lesser degree, Enna were the towns most affected by tephra fallout (principally ash); small amounts of fine-grained ash reached also the urban settlements of Leonforte and Montedoro.
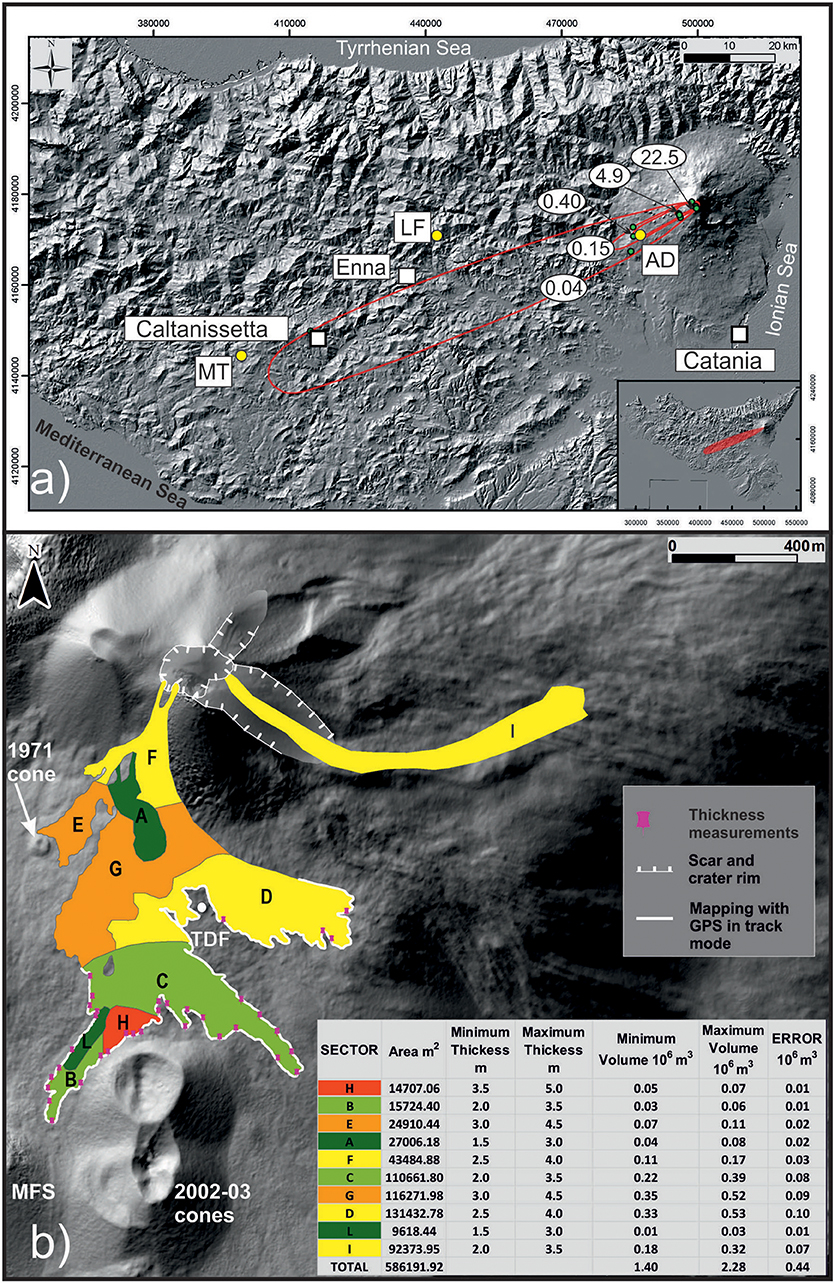
Figure 7. Mapping of the volcanic deposits erupted during the 25-26 lava fountain 2013 episode. (a) Tephra fallout on the shaded relief of Sicily; the red lines are the isomasses in kg per square meter (values in full white circles). Full white squares are the main cities in this part of Sicily (Catania, Enna e Caltanissetta). Full yellow circles indicate some localities affected by the fallout (AD, Adrano; LF, Leonforte; MT, Montedoro). The bottom right inset shows the fallout deposit drawn over the map showing all of Sicily. (b) The NSEC cone and the associated lava flows on the shaded relief of Mount Etna volcano. TDF is the location of a former alpine shelter buried under recent tephra and lava, MFS is Monte Frumento Supino.
Along the dispersal axis, in the proximal area (at ~1.4 km from the NSEC), the fallout deposit formed a 3-cm thick bed made of coarse ash to prevalently fine, black and iridescent, poorly porphyritic, vesicular scoriaceous lapilli (85% of particles in the range 1–8 mm) with scattered pluridecimetric scoria (Figure 8a), amounting to a mass load of 22.25 kg/m2. At medial sites (~5 km distant), we measured 4.7 kg/m2 of mostly fine lapilli forming a continuous < 2 cm-thick layer on the ground. Further away, the tephra fall dropped to 0.4 kg/m2 in Adrano (16 km distant), where we found a continuous, thin layer of medium-sized ash (~85% of clasts sized between 0.25 and 1 mm; Figure 8b). Finally, at distal sites the fallout consisted of fine to medium ash particles, ~99% of which were <0.25 mm in Caltanissetta (~90 km from the vent).
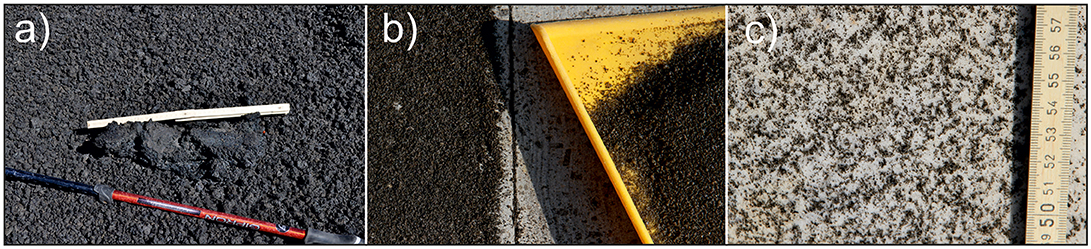
Figure 8. The tephra deposit associated with the 25-26 October 2013 distal fallout. (a) Proximal lapilli layer and 40-cm sized scoria deposited at about 1 km of distance from the NSEC; (b) continuous layer of ash deposit along the dispersal axis at 16 km distant in Adrano; (c) lateral outcrop showing a scattered ash deposit in Adrano. Photos by D. Andronico.
Laterally away from the fallout axis, the tephra cover became rapidly discontinuous; for example, close to Torre del Filosofo (~1 km from the NSEC; Figure 7b), the deposit consisted of scattered 5–10 cm-sized scoria, with larger clots up to 40 cm, while we measured 0.16 and 0.087 kg/m2 of tephra at only 2 km N and 3.3 km ~S (Figure 8c), respectively, off-axis from the Adrano sample (16 km from the vent). Furthermore, within <1 km from the NSEC, we found a low number of spindle- to fusiform-shaped bombs with diameters mostly around 20–40 cm.
The two different analyzed grain-size classes of ash show comparable componentry in both samples, the ash being almost totally composed of juvenile particles (~97% both), mainly sideromelane (87.2% in the coarser sample and 91% in the finer) with minor percentages of tachylite (9.8% and 5.8%, respectively). The few present lithics are mostly gray-dark to gray lava particles and secondarily reddish clasts, while crystals (mainly plagioclase) are negligible (0.2 and 1.6%, respectively).
The fallout deposit was estimated having a TEM of 2.25 ± 0.76 × 10⁸ kg, which is equivalent to a mean MER of 7.81 × 10³ kg/s providing a DRE magma volume of 8.33 × 10⁴ m3 (assuming an average density value of 2700 kg/m3; Harris et al., 2010) (Table 2).
Lava Flows
On early 26 October, lava overflowed from the crater above the NSEC cone in three spots, two on the SW crater rim and one on the E rim (Figure 7b). The first overflow from the SW rim fed a narrow lava tongue that spilled southward, broadening on the flat terrain at the southern base of the cone and expanding into several lobes. Later, as lava fountaining intensified the effusion rate increased, leading to the breaching of the crater rim in the place where the lava was overflowing (Figures 6a,b), and to a second overflow a few tens of meters further west, which fed a rather narrow lava flow that spilled down the south flank of the cone for about 100 m before uniting with the earlier lava flow.
The resulting lava flow-field to the south of the NSEC expanded into four main lobes (Figure 7b): one toward SW, stopping at the base of the small 1971 cinder cone (Figure 6c); another circled the NW base of the 2002–2003 cone (stopping short of the “Torre del Filosofo” monitoring station that fortuitously survived, only to be destroyed by the next lava fountaining episode, on 11 November 2013; Figure 6d) and coming then to a halt near the N base of the prehistoric cone Monte Frumento Supino; the third advanced SSE near the NE base of the 2002–2003 cone; finally, the fourth went toward SE, reaching the site of the monitoring station “Belvedere” on the rim of the Valle del Bove. The most advanced lava front, near Monte Frumento Supino, was about 1.5 km from the NSEC. The eastern lava flow was emitted at a late stage of the paroxysm, and spilled down through a deep notch formed on 27 April 2013 in the flank of the NSEC cone, largely covering a lava flow emitted at that date, and stopping at a distance of about 1.3 km from the crater.
Based on the minimum and maximum values of thicknesses, we estimate an average total volume of lava emitted on 26 October 2013 of 1.84 ± 0.44 × 10⁶ m3 (Table 2), 86% of which constitutes the main southern lava flow-field.
Discussion
How Representative Is the 25-26 October 2013 Eruption Within the Paroxysmal Activity of Etna?
In order to ascertain the representativeness of the 25-26 October eruption among the almost 200 paroxysms that occurred in 1998–2015 from the SEC and NSEC, in the following we compare physical parameters, textural features and observations on lava and tephra deposits with previous, well-studied paroxysmal episodes at Etna and particularly with the 2011–12 and 2013 sequences (Table 1). Our study shows that the paroxysmal phase of the 25-26 October lava fountain lasted ~8 h, producing 1.84 ± 0.44 × 10⁶ m3 of lava flows, and 2.25 × 0.76 × 108 kg of distal tephra as fallout deposit (corresponding to a mean MER of 7.81 × 10³ kg/s). Lava flows reached a maximum length of 1.5 km from the vent, extending for 0.59 km2 at a mean effusion rate of ~65 m3/s. During the paroxysmal activity, lava jets reached a maximum height of 500 m and the eruption column is estimated to have risen to up to ~8 km a.s.l. (i.e., ~4.7 km above the NSEC).
Paroxysmal Phase Length
The 25-26 October episode produced magma jets rising on average between 300 and 400 m (and maximum height of 500 m), a height range commonly observed for lava fountains at Etna (Carbone et al., 2015). However, the 8 h-duration of the paroxysmal phase (characterized by continuous fountaining) was much longer than usual. Lava fountain episodes exceeding 3 h, in fact, were only 12, 13 and 20%, respectively, of the total number of episodes during the 2000 (64 episodes; Alparone et al., 2003), 2011–12 (25 episodes; Behncke et al., 2014), and 2013 (20 episodes; De Beni et al., 2015) sequences. In particular, the paroxysmal phase duration is much longer than during the 2011–12 (from 0.5 to 4.5 h with mean duration of 1.54 h) and the 2013 episodes (from 0.2 to 8 h with mean duration of 2.6 h for 19 episodes).
Cone Growth
For the cone constructed during the 25 episodes of the 2011–12 sequence from the NSEC, Behncke et al. (2014) evaluated by field surveys a growth of ~190 m and a DRE volume of 9.5 × 10⁶ m3 (proximal tephra; vesicularity of 50%). These values are on average equivalent to a DRE volume of 0.38 × 10⁶ m3 per episode (Table 1). We also derived a DRE volume for the 2013 cone (De Beni et al., 2015) of 20.48 × 10⁶ m3, corresponding to a DRE volume of 0.54 × 10⁶ m3 per episode (averaging 19 of the 21 episodes). By elaborating DEMs from different periods, for the 25-26 October activity we assume, in terms of erupted DRE volume, the average of the 2011–13 period (44 episodes) of 0.45 × 10⁶ m3 (Table 1). Such a value is in good agreement with any average episode of the 2011–12 (slightly higher) and of the 2013 sequences (lower), which was mostly characterized by large-scale fountaining episodes (e.g., Andronico et al., 2015; Poret et al., 2018a,b in revision).
Distal Tephra
The distal tephra fallout was characterized by a TEM of 2.25 ± 0.76 × 10⁸ kg, which is equivalent to a mean MER of 7.81 × 10³ kg/s. These values are slightly lower than the 4–5 September 2007 (3.9 × 10⁸ kg−1.1 × 10⁴ kg/s) and 12–13 January 2011 (1.5 × 10⁸ kg−2.5 ± 0.7 × 10⁴ kg/s) lava fountaining episodes (Andronico et al., 2008a, 2014b), but a little higher than those calculated for the 24 November 2006 paroxysm (1.9 × 10⁸ kg−5 × 10³ kg/s; Andronico et al., 2014a), characterized by alternating powerful Strombolian activity and pulsating fountaining. Physical parameters, therefore, would suggest that, during its 8 h of paroxysmal activity, the style and intensity of the 25-26 October 2013 eruption was that of a small-scale lava fountain (Andronico et al., 2015). Expressed in DRE magma volume they provided TEM and MER equivalent to 0.083 × 10⁶ m3 and 2.89 m3/s respectively (Table 2).
The componentry analysis shows that nearly all of the ash-sized products (~97 %) were constituted by juvenile material (of which sideromelane particles were >87 %). In agreement with the physical parameters, such high values are common during fountaining activity (e.g., Andronico et al., 2008a) as it is well suggested by the steady eruptive dynamics without any evidence of significant variations in the magma flux throughout the long paroxysmal phase, i.e., absence of significant syn-eruptive phenomena (like inner sliding and collapses within the eruptive conduit). This also permits to establish that the tephra forming the distal fallout is almost all represented by new, fresh magma.
Lava Flows
The 25-26 October 2013 lava flows show unusual geometric features when compared with other lavas of the 2011–2013 effusive activity (Behncke et al., 2014; De Beni et al., 2015). The morphology of the two lava fields reflects the different slopes of the NSEC cone, i.e., the smooth south flank and steep east flank, over which lava flows propagated from the respective vents up to only 1.3 and 1.5 km in around 8 h, covering a total area of 0.59 km2 (Table 3) with average thicknesses of 3 m. In spite of the longer paroxysmal phase, the 25-26 October lava-covered area is comparable to areas measured for the lava flows emitted during the sequences in 2011-12 (25 episodes) and 2013 (11 episodes), which were respectively between 0.29 and 1.32 km2 (mean value of 0.76 km2) and between 0.02 and 1.3 km2 (mean value of 0.55 km2) (data estimated from Behncke et al., 2014 and De Beni et al., 2015) (Table 3). Conversely, the lava flow length is significantly lower than the mean length measured in 2011–12 (2.94 km for 25 episodes) and 2013 (2.06 for 11 episodes). The DRE volume of lava emitted on 25-26 October 2013 is 1.47 × 10⁶ m3 (Table 2), higher than the mean DRE values of the 2011–12 and 2013 sequences of 0.90 × 10⁶ m3 (averaged for 25 episodes) and 1.04 × 10⁶ m3 (19 episodes), respectively (Table 4).
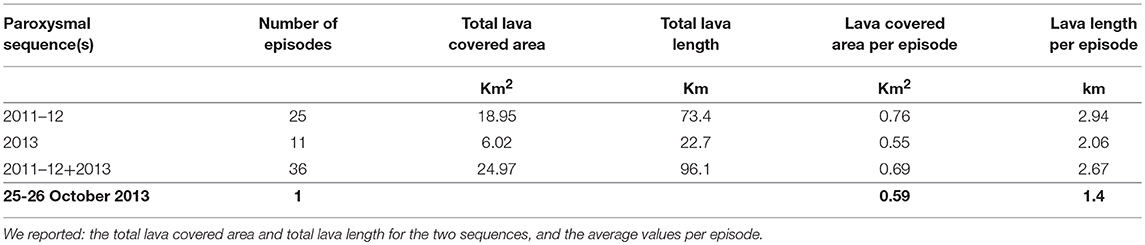
Table 3. Volcanological parameters of the NSEC cone during the 2011–12 and 2013 lava fountaining sequences, and the single 25-26 October 2013 paroxysm.
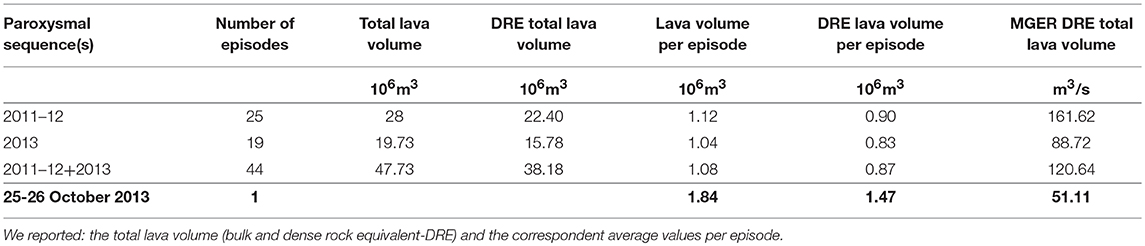
Table 4. Volcanological parameters of the NSEC cone during the 2011–12 and 2013 lava fountaining sequences, and the single 25-26 October 2013 paroxysm.
The 25-26 October lava flows were emitted at a DRE effusion rate of 51.11 m3/s (Table 2), a value much lower than episodes during the 2011–2013 sequences, where the mean effusion rates are estimated 161.62 m3/s in 2011–12 (25 episodes) and 88.72 m3/s in 2013 (19 episodes) (Table 4).
Comparison between the 25-26 October event and selected events or averaged values of the physical parameters/durations of the 2000, 2011–12, and 2013 sequences shows that the study event has a similar areal extent and DRE volume on the one hand, and minor lava flow length and DRE effusion rate on the other hand (compared to the 2011–13 paroxysmal sequences). Conversely, the fallout deposit erupted as distal tephra is only slightly smaller than other studied deposits, and the volume increase of the cone during this event is comparable to the average volume increase derived from the 2011-2013 sequences. However, the longer duration of the paroxysmal phase along with a significant lower DRE effusion rate during the 25-26 October event seem to indicate a relatively slow emplacement of the lava flows. We infer that their limited capability of advancing could be related to the low content of gas in the lava, possibly fed from a residual, degassed magma batch inherited from the first paroxysmal sequence in 2013, which started on 19 February and ended on 27 April. We conclude that, although eruptive style and dynamics are fully overlapping and comparable with previous events, the 25-26 October 2013 event is a small-scale paroxysmal episode as confirmed by the longer duration of the paroxysmal phase associated with a lower magma output.
Magma Budget Estimation From Explosive and Effusive Deposits
In general, the estimation of the magma budget provided by a volcano during its history is a good proxy for understanding its magma dynamics, how the feeding system works (e.g., Wadge et al., 2006), and how magma (degassed or undegassed) is transferred to the surface (Allard, 1997). The peculiarity of a volcano, which erupts as frequently and often displays episodic eruptions as Etna, also bears significant implications for volcanic hazard assessments. Estimating the magma budget available during paroxysmal events, in particular from the SEC or NSEC, and as long as this value is constant or at least similar within the same paroxysmal sequences, may be therefore crucial for assessing their potential impact with time on the territory. In other terms, how much is the magma erupted as tephra (distal plus proximal) and lava? Does the ratio between these two amounts change or remain constant as suggested by recent studies based on the analysis of borehole dilatometers (Bonaccorso et al., 2014)? While the lava flows may be evaluated both using standard methods (mainly direct mapping and subtraction of DEMs extracted from remote sensing data; Coltelli et al., 2007; Behncke et al., 2014) and new techniques such as infrared data from geostationary sensors (Ganci et al., 2012) and near real-time production of DEMs (De Beni et al. under review), calculating the portion of magma fragmented “explosively” is more difficult. The most common models used for the fallout deposits, in fact, do not sufficiently take into account the coarse-grained tephra which does not enter into convection within the eruption column. Conversely, during low- to mid-intensity explosive eruptions, like lava fountaining and powerful Strombolian events at Etna, which typically produce low, <10 km-high eruption columns a.s.l., the contribution of very coarse clasts that coevally fall back into and closely around the active vent of a rapidly growing scoria cone is significant.
Considering the contribution of proximal tephra and lava flows emitted during the 2011–12 and 2013 sequences, we quantified the average DRE magma volume erupted for episode. For the 25 episodes of the 2011–12 sequence, we obtain a total DRE volume of 31.9 × 10⁶ m3, i.e., 1.28 × 10⁶ m3 per episode, a value similar to the mean DRE volume of 1.47 × 10⁶ m3 estimated averaging 19 of 25 episodes by Ganci et al. (2012) using a geostationary sensor (SEVIRI). Considering 138,600 s for the combined duration of the paroxysmal activity of all eruptive episodes (Behncke et al., 2014), we obtain a total mean DRE magma eruption rate (MGER) of ~230.16 m3/s, i.e., 68.54 × 10⁶ m3/s and 161.62 × 10⁶ m3/s the contributions from the cone and the lava, respectively, without including the magma volume erupted as distal tephra. By the same calculation averaging 19 of the 21 episodes in 2013, we derived a DRE volume of lava plus cone of 3.00 × 10⁷ m3, and a DRE MGER of 168.47 m3/s.
Considering the 25-26 October activity, in terms of DRE erupted volumes we estimated 15.63 m3/s for the cone and 51.11 m3/s for the lava flows, respectively (Table 2). Such estimations indicate that the cone increase was on average a fourth than during the 2011-13 episodes (Table 1), while the lava output value is almost a third of the mean value obtained for the 2011-12 episodes from Behncke et al. (2014), and ~half the value obtained for 19 of 21 episodes in 2013 by De Beni et al. (2015) (Table 4), suggesting that the lava effusion from the studied episode occurred at a lower rate compared to the averaged values of the 2011-13 paroxysmal activity. In addition, we obtained 0.083 × 10⁶ m3 of magma DRE volume erupted as distal tephra, which accounts for a further DRE MGER of 2.89 m3/s (Table 2); for the 2011-12 lava fountains, this parameter was only approximately estimated by Behncke et al. (2014) and not calculated by Ganci et al. (2012). Summing together proximal tephra, lava flows, and distal tephra, for the 25-26 October paroxysmal activity we have a total mean DRE MGER of 69.63 m3/s (Table 5). This value is significantly lower than 230.16 and 146.28 m3/s derived by Behncke et al. (2014) and De Beni et al. (2015) for the 2011-12 and 2013 episodic activity (lava and cone contribution without distal tephra).
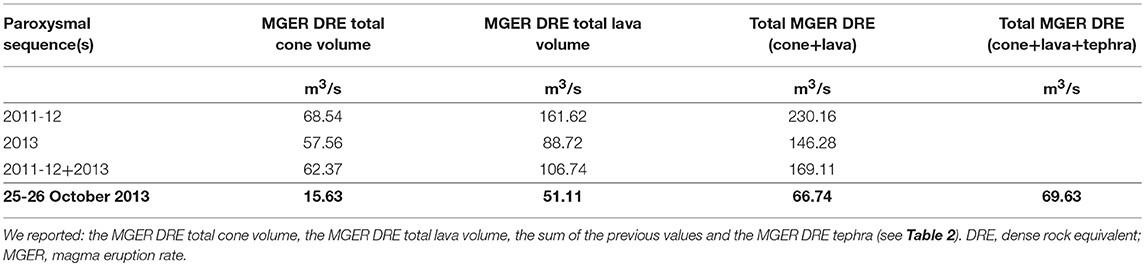
Table 5. Volcanological parameters of the NSEC cone during the 2011–12 and 2013 lava fountaining sequences, and the single 25-26 October 2013 paroxysm.
Magma Dynamics During Paroxysmal Activity at Etna
In the literature, the eruptive mechanism invoked for describing sustained lava fountains from the summit craters of Etna (e.g., Allard et al., 2005; Andronico and Corsaro, 2011) is the separate ascent of a bubble foam layer related to a gas-melt separation. This is the collapsing foam model, which implies the accumulation of volatiles at the top of the plumbing system, the formation of a foam layer (e.g., Jaupart and Vergniolle, 1988, 1989; Vergniolle and Jaupart, 1990), and its dramatic collapse emptying the magma reservoir. Allard et al. (2005) postulated that the 14 June 2000 lava fountain at Etna was supplied by a shallow magma body on top of which “repeated growth and collapse of a bubble foam may have triggered periodic lava fountaining.” They also measured distinct chemical compositions of the gas driving the magma jets and the lava flows, suggesting someway the separation from the parcel already stored in the shallow reservoir resulting into the emission of fragmented magma and degassed magma by distinct vents. Polacci et al. (2006) inferred that the foam collapse process may be followed and accompanied by syneruptive, although minor, volatile degassing. Consequently, the occurrence of lava fountaining suggests in general the availability of a pressurized volume of magma (composed of solid, liquid and abundant volatiles) in the shallow reservoir.
The 25-26 October lava fountain had a longer duration but lower mean MGER than the respective mean values calculated for the 2011–12 and 2013 sequences. Volcanological data, camera recordings and direct observations show that the intensity of the paroxysmal activity was relatively low. Noteworthily, most of the magma emitted was discharged as lava flows and proximal tephra. The distal tephra, in fact, represents only around 4% of the total erupted DRE volume, while the total volume of pyroclasts (proximal plus distal tephra) is lower (around 36%) than the magma volume erupted as lava flow (Table 1). This means that approximately three-quarters (i.e., 73%) of the magma was emitted as lava flows, i.e., it was already degassed and/or crystallized for the most part. The remaining >25 % of magma was erupted explosively, and mostly (>80 %) fragmented and deposited as coarse tephra clasts above the NSEC cone. Figure 9 summarizes the DRE magma volume (%) distribution as derived from our work in terms of lava, distal tephra and proximal tephra deposits.
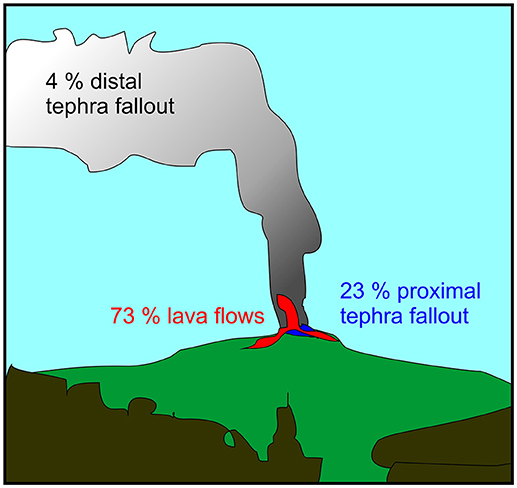
Figure 9. Schematic diagram of proposed magma (DRE %) distribution in terms of lava, distal tephra and proximal tephra deposits erupted during the 25-26 October 2013 lava fountain at Etna.
In other terms, on 26 October 2013 the fraction of magma erupted as tephra and transported in convection above the NSEC was rather small compared to the magma emitted as lava flows and cone-building tephra. The importance of the extruded lava mass and of the effusive process in general is also suggested by the detachment of blocks from the NSEC summit and carriage downward. Noteworthy, the presence of a dark eruption column above the volcano which then becomes progressively lighter-colored for tens of km away from Etna could be related to high amounts of water vapor (Figures 3c,d), but foremost points to a relatively low discharge of tephra, the fine-grained part of which diluted in the atmosphere.
Although the eruption column that typically accompanies the common lava fountains at Etna is the most striking eruptive phenomenon, and possibly the one, which distinguishes this activity from the “fire-fountaining” activity at Hawaiian volcanoes, its contribution in terms of magma volume, at least for the studied event (but probably also for other small-scale lava fountain episodes), was only a small fraction of the total budget of erupted magma.
In conclusion, we infer that before 25 October, as already proposed for past episodic eruptions (Andronico and Corsaro, 2011; Behncke et al., 2014), a cooling magma batch was resident below the NSEC. This batch was extruded for the most part as lava flows, possibly as result of degassing during the 6-months-long residence in the shallow plumbing system since the previous paroxysmal episode on 27 April. However, it opened the plumbing system to the rise of more gas-rich magma, which was erupted during the following five lava fountains episodes (e.g., the exceptionally powerful 23 November 2013 episode; Bonaccorso et al., 2014; Poret et al., 2018a) up to 2 December 2013, plus two powerful Strombolian events in the following month. Similarly, for the 64 paroxysmal episodes that occurred in January-June 2000, Andronico and Corsaro (2011) showed that the ascent of new, more primitive and volatile-rich magma triggered the start of this long episodic eruption, progressively intruding into the SEC reservoir and mixing with the resident and more evolved magma, finally determining the composition of erupted volcanics. Noteworthy, in the case of the 2000 sequence, the more primitive magma was emitted only during the last events.
The latter hypothesis is also in agreement with two recent studies from Viccaro et al. (2014) and Giuffrida et al. (2018) about the triggering mechanisms of paroxysmal episodes at Etna. Viccaro et al. (2014) infer that textures and compositional zoning in selected plagioclase crystals of lavas can explain the relations between the duration of the paroxysms and dynamics of pre-eruptive magmatic processes at depth. They proposed a recharge by more mafic, gas-rich magma in case of prolonged, ramp-shaped tremor increase, and conversely a prominent role of gas injections into the residing system when recording a sudden increase of the seismic amplitude before the climax of the eruption. The 25-26 October 2013 episode, indeed, shows intermediate features between the previous end-members, because the tremor increase accompanying the initial Strombolian phase was neither long nor short, while the paroxysmal phase was clearly longer than usual. At the same time, by studying lithium gradients in plagioclase crystals, Giuffrida et al. (2018) suggest that, during the 2011–2013 paroxysmal episodes, the fast recharge of gas-rich magma would have caused the re-activation of the magmatic system after quiet eruptive periods, thus enhancing powerful eruptions. We therefore cannot exclude the presence of two distinct mechanisms which concurred to open a short sequence of 8 paroxysmal events after 6 months of quiescence. We finally suggest that the rise of a new mafic, gas-rich magma batch triggered the 25-26 October episode and provoked the extrusion of degassed resident magma, accompanied by the resumption of the Strombolian activity and sustaining a long-lasting paroxysmal phase.
Concluding Remarks
The ascent of magma during paroxysmal eruptions and its partition to produce disproportionate values of lava/tephra ratios as well as a wide range of MERs have been never properly investigated and debated at Etna. In spite of various research on single paroxysmal episodes in recent years, to date only this study quantifies, on the base of field data, the DRE magma volumes erupted as proximal tephra, distal tephra, and lava flows. The 25-26 October 2013 lava fountain deposited a proximal tephra deposit of 0.45 × 10⁶ m3 on top of the NSEC cone (causing ~30 m growth of the cone), dispersed a distal tephra fallout deposit of ~0.083 × 10⁶ m3, and emitted ~1.47 × 10⁶ m3 of lava flows. Considering 8 h of paroxysmal activity, the mean rate at which all the erupted magma was supplied is 69.63 m3/s. The estimation of the total mass and the relative percentages of lava and tephra may address the evaluation of the eruption dynamics during paroxysmal episodes at Etna, and gain insights into the wide spectrum of eruption intensity (MER) and style (powerful Strombolian to large-scale lava fountain events) observed in the last years at the summit craters. Most importantly, our study highlights that, at least for ordinary paroxysmal episodes, the magma budget distribution is strongly balanced in favor of lava flows and proximal tephra (accumulating around the NSEC cone and enhancing its fast growth), while the distal tephra fallout seems to have a rather modest importance in quantitative terms (i.e., only <5% of the total erupted magma). A similar distribution of magma (predominant output of lava flows/coarse tephra around the cone than distal tephra) is coherent with the eruptive behavior observed during the paroxysmal phase of most of the lava fountain episodes at Etna, i.e., the start of lava fountaining and formation of the eruption column, which are accompanied by high-rate lava effusion.
In the future, further and more reliable estimations of the different contributions of magma discharged as lava and tephra during paroxysmal events are desirable. The application of new measurement techniques (like drones and ground-based photogrammetry) is likely to allow swift calculation of detailed and reliable volume values, not only of lava flows but also of the proximal tephra which accumulates on top of the cone; for example, by subtraction of DEMs focused on the NSEC cone just before and after an eruption. Moreover, coeval and punctual geochemical measurements of the gas plumes are recommended to correlate the total SO2 flux and in situ measurements of gas phases (e.g., SO2, HCL, HF, and their relative ratios) with the eruptive activity, thus allowing to validate the total volume of erupted magma and possibly, its partitioning in terms of lava and tephra.
Understanding the relationships between effusive and explosive deposits (i.e., degassed vs. gas-rich magma) erupted during single paroxysms, finally, may be greatly useful to predict the evolution of such episodic eruptions and their likely conclusion, and thus also to improve the assessment of the potential volcanic hazard from future tephra fallout over the densely populated slopes of Etna.
Author Contributions
DA conceived the research and drafted the article. DA and BB made field observations during the whole duration of the lava fountain. DA carried out survey to map the tephra fallout from the proximal area to the volcanic slope, and collected representative samples. BB and ED carried out field campaigns to map the lava flow field. ED produced the cartographic maps for the lava and tephra deposits, and elaborated the obtained maps to calculate the volume of the cone and of the lava deposits. AC analyzed the products of the tephra fallout in the laboratory. SS estimated the volume of the tephra fallout. ML surveyed the distal fallout deposit and collected the relative ash samples. MLC collaborated during the laboratory analysis of the tephra samples. All authors discussed the results and reviewed the manuscript, strictly collaborating for the interpretation of the results obtained. BB also gave a substantial contribution to the draft of the manuscript.
Funding
Osservatorio Etneo—Sezione di Catania Istituto Nazionale di Geofisica e Vulcanologia.
Conflict of Interest Statement
The authors declare that the research was conducted in the absence of any commercial or financial relationships that could be construed as a potential conflict of interest.
Acknowledgments
We are strongly indebted with the INGV staff, which maintained the video-camera network during the period of the eruption, and in particular our colleagues who were in the field to make observations from different viewpoints at different time during its long paroxysmal phase. Finally, we are really indebted to reviewers, Prof. Marco Viccaro and Dr. Luis E. Lara, whose criticism and observations gave more clarity to the paper. We also thank the Editor, Prof. Clive Oppenheimer, for his continuous support and the Chief Editor, Prof. Valerio Acocella, for the final editing to the revised paper that has given greater completeness and self-sustainability to our work.
References
Allard, P. (1997). Endogenous magma degassing and storage at Mount Etna. Geophys. Res. Lett. 24, 2219–2222.
Allard, P., Burton, M., and Murè, F. (2005). Spectroscopic evidence for a lava fountain driven by previously accumulated magmatic gas. Nature 433, 407–410. doi: 10.1038/nature03246
Aloisi, M., Bonaccorso, A., Cannavò, F., Gambino, S., Mattia, M., Puglisi, G., et al. (2009). A new dike intrusion style for the Mount Etna May 2008 eruption modelled through continuous tilt and GPS data. Terra Nova 21, 316–321. doi: 10.1111/j.1365-3121.2009.00889.x
Alparone, S., Andronico, D., Lodato, L., and Sgroi, T. (2003). Relationship between tremor and volcanic activity during the Southeast Crater eruption on Mount Etna in early 2000. J. Geophys. Res. 108:B52241. doi: 10.1029/2002JB001866
Andronico, D., Coltelli, M., Cristaldi, A., Lo Castro, D., and Scollo, S. (2008b). Il Parossismo del 10 Maggio 2008 al Cratere di SE: Caratteristiche del Deposito di Caduta. INGV Internal Report No UFVG2008/043
Andronico, D., and Corsaro, R. A. (2011). Lava fountains during the episodic eruption of South-east Crater (Mt. Etna), 2000: insights into magma-gas dynamics within the shallow volcano plumbing system. Bull. Volcanol. 73, 1165–1178.
Andronico, D., Corsaro, R. A., Cristaldi, A., Lo Castro, M. D., Messina, L., Scollo, S., et al. (2017). L'attività Esplosiva del Cratere di SE tra il 15 e il 18 Marzo 2017: Dispersione del Deposito Distale di Caduta E Caratteristiche Tessiturali Delle Ceneri Eruttate. Rapporto interno N. 005/2017. Available online at: http://www.ct.ingv.it
Andronico, D., Cristaldi, A., and Scollo, S. (2008a). The 4–5 September 2007 lava fountain at South-East Crater of Mt Etna, Italy. J. Volcanol. Geotherm. Res. 173, 325–328. doi: 10.1016/j.jvolgeores.2008.02.004
Andronico, D., Lo Castro, M. D., Sciotto, M., and Spina, L. (2013). The 2010 ash emissions at the summit craters of Mt Etna: relationship with seismo-acoustic signals. J. Geophys. Res. Solid Earth. 118, 51–70. doi: 10.1029/2012JB009895
Andronico, D., Scollo, S., and Cristaldi, A. (2015). Unexpected hazards fromtephra fallouts at Mt Etna: the 23 November 2013 lava fountain. J. Volcanol. Geotherm. Res. 304, 118–125. doi: 10.1016/j.jvolgeores.2015.08.007
Andronico, D., Scollo, S., Cristaldi, A., and Lo Castro, M. D. (2014b). Representivity of incompletely sampled fall deposits in estimating eruption source parameters: a test using the 12–13 January 2011 lava fountain deposit from Mt. Etna volcano, Italy. Bull. Volcanol. 76:861. doi: 10.1007/s00445-014-0861-3
Andronico, D., Scollo, S., Lo Castro, M. D., Cristaldi, A., Lodato, L., and Taddeucci, J. (2014a). Eruption dynamics and tephra dispersal from the 24 November 2006 paroxysm at South-East Crater, Mt Etna, Italy. J. Volcanol. Geotherm. Res. 274, 78–91. doi: 10.1016/j.jvolgeores.2014.01.009
Behncke, B., Branca, S., Corsaro, R. A., De Beni, E., Miraglia, L., and Proietti, C. (2014). The 2011–2012 summit activity of Mount Etna: birth, growth and products of the new SE crater. J. Volcanol. Geotherm. Res. 270, 10–21. doi: 10.1016/j.jvolgeores.2013.11.012
Behncke, B., Neri, M., Pecora, E., and Zanon, V. (2006). The exceptional activity and growth of the Southeast Crater, Mount Etna (Italy), between 1996 and 2001. Bull. Volcanol. 69, 149–173. doi: 10.1007/s00445-006-0061-x
Bonaccorso, A., Calvari, S., Linde, A., and Sacks, S. (2014). Eruptive processes leading to the most explosive lava fountain at Etna volcano: the 23 November 2013 episode. Geophys. Res. Lett. 41, 4912–4919. doi: 10.1002/2014GL060623
Bonadonna, C., and Costa, A. (2012). Estimating the volume of tephra deposits: a new simple strategy. Geology 40, 415–418. doi: 10.1130/G32769.1
Bonadonna, C., and Houghton, B. F. (2005). Total grain-size distribution and volume of tephra-fallout deposits. Bull. Volcanol. 67, 441–456. doi: 10.1007/s00445-004-0386
Calvari, S., Cannavò, F., Bonaccorso, A., Spampinato, L., and Pellegrino, A. (2018). Paroxysmal explosions, lava fountains and ash plumes at Etna volcano: eruptive processes and hazard implications. Front. Earth Sci. 6:107. doi: 10.3389/feart.2018.00107
Carbone, D., Zuccarello, L., Messina, A., Scollo, S., and Rymer, H. (2015). Balancing bulk gas accumulation and gas output before and during lava fountaining episodes at Mt. Etna. Sci. Rep. 5:18049. doi: 10.1038/srep18049
Coltelli, M., Proietti, C., Branca, S., Marsella, M., Andronico, D., and Lodato, L. (2007). Analysis of the 2001 lava flow eruption of Mt. Etna from three-dimensional mapping. J. Geophys. Res. 112:F02029. doi: 10.1029/2006JF000598
Corradini, S., Guerrieri, L., Lombardo, V., Merucci, L., Musacchio, M., Prestifilippo, M., et al. (2018). Proximal monitoring of the 2011-2015 Etna lava fountains using MSG-SEVIRI data. Geosciences 8:140. doi: 10.3390/geosciences8040140
Corsaro, R. A., Andronico, D., Behncke, B., Branca, S., De Beni, E., Caltabiano, T., et al. (2017). Monitoring the December 2015 summit eruptions of Mt. Etna (Italy): implications on eruptive dynamics. J. Volcanol. Geotherm. Res. 341, 53–69. doi: 10.1016/j.jvolgeores.2017.04.018
De Beni, E., Behncke, B., Branca, S., Nicolosi, I., Carluccio, R., D'Aiello Caracciolo, F., et al. (2015). The continuing story of Etna's New Southeast Crater (2012-2014): evolution and volume calculations based on field surveys and aerophotogrammetry. J. Volcanol. Geotherm. Res. 303, 175–186. doi: 10.1016/j.jvolgeores.2015.07.021
De Beni, E., and Proietti, C. (2010). Un Geodatabase a Supporto Della Mappatura Sineruttiva di Colate Laviche al Monte Etna. INGV Rapporti Tecnici. Available online at: http://istitutoingv.it/l-ingv/produzione-scientifica/rapporti-tecnici-ingv/archivio/rapporti-tecnici-2010/2010-10-25.5202754525
Fierstein, J., and Nathenson, M. (1992).Another look at the calculation of fallout tephra volumes. Bull. Volcanol. 54, 156–167. doi: 10.1007/BF00278005
Ganci, G., Harris, A. J. L., Del Negro, C., Guehenneux, Y., Cappello, A., Labazuy, P., et al. (2012). A year of lava fountaining at Etna: volumes from SEVIRI. Geophys. Res. Lett. 39:L06305. doi: 10.1029/2012GL051026
Gaonac'h, H., Stix, J., and Lovejoy, S. (1996). Scaling effects on vesicle shape, size and heterogeneity of lavas from Mount Etna. J. Volcanol. Geotherm. Res. 74, 131–153. doi: 10.1016/S0377-0273(96)00045-5
Giuffrida, M., and Viccaro, M. (2017). Three years (2011-2013) of eruptive activity at Mt. Etna: working modes and timescales of the modern volcano plumbing system from micro-analytical studies of crystals. Earth Sci. Rev. 171, 289–322. doi: 10.1016/j.earscirev.2017.06.003
Giuffrida, M., Viccaro, M., and Ottolini, L. (2018). Ultrafast syn-eruptive degassing and ascent trigger high-energy basic eruptions. Sci. Rep. 8:147. doi: 10.1038/s41598-017-18580-8
Harris, A. J. L., Dehn, J., and Calvari, S. (2007). Lava effusion rate definition and measurement: a review. Bull. Volcanol. 70, 1–22. doi: 10.1007/s00445-007-0120-y
Harris, A. J. L., Favalli, M., Steffke, A., Fornaciai, A., and Boschi, E. (2010). A relation between lava discharge rate, thermal insulation, and flow area set using lidar data. Geophys.Res. Lett. 37:L20308. doi: 10.1029/2010GL044683
Herd, R. A., and Pinkerton, H. (1997). Bubble coalescence in basaltic lava: its impact on the evolution of bubble populations. J. Volcanol. Geotherm. Res. 75, 137–157. doi: 10.1016/S0377-0273(96)00039-X
Jaupart, C., and Vergniolle, S. (1988). Laboratory models of Hawaiian and Strombolian eruptions. Nature 33, 58–60.
Jaupart, C., and Vergniolle, S. (1989). The generation and collapse of foam layer at the roof of a basaltic magma chamber. J. Fluid. Mech. 203, 347–380.
Lo Castro, M. D., and Andronico, D. (2008). Operazioni di Base per la Misura Della Distribuzione Granulometrica di Particelle Vulcaniche Tramite il CAMSIZER. Rapporti Tecnici INGV. 79, 1–35. Available online at: https://www.earth-prints.org/bitstream/2122/5614/1/rapporto79.pdf
Lyons, J. J., Waite, G. P., Rose, W. I., and Chigna, G. (2010). Patterns in open vent, strombolian behavior at Fuego volcano, Guatemala, 2005–2007. Bull. Volcanol. 72, 1–15. doi: 10.1007/s00445-009-0305-7
Mulas, M., Cioni, R., Andronico, D., and Mundula, F. (2016). The explosive activity of the 1669 Monti Rossi eruption at Mt. Etna (Italy). J. Volcanol. Geotherm. Res. 303, 25–40. doi: 10.1016/j.jvolgeores.2016.10.012
Neri, M., Acocella, V., Behncke, B., Giammanco, S., Mazzarini, F., and Rust, D. (2011). Structural analysis of the eruptive fissures at Mount Etna (Italy). Ann. Geophys. 54, 464–479. doi: 10.4401/ag-5332
Polacci, M., Corsaro, R., and Andronico, D. (2006). Coupled textural and compositional characterization of basaltic scoria: insights into the transition from Strombolian to fire fountain activity at Mount Etna, Italy. Geology 34, 201–204. doi: 10.1130/G223181.1
Poret, M., Corradini, S., Merucci, L., Costa, A., Andronico, D., Montopoli, M., et al. (2018a). Reconstructing volcanic plume evolution integrating satellite and ground-based data: application to the 23 November 2013 Etna eruption. Atmos. Chem. Phys. 18, 4695–4714. doi: 10.5194/acp-18-4695-2018
Poret, M., Costa, A., Andronico, D., Scollo, S., Gouhier, M., and Cristaldi, A. (2018b). Modelling eruption source parameters by integrating field, ground-based and satellite-based measurements: the case of the 23rd February 2013 Etna paroxysm. J. Geophys. Res. 123, 1–24. doi: 10.1029/2017JB015163
Pyle, D. M. (1989). The thickness, volume and grain size of tephra fall deposits. Bull. Volcanol. 51, 1–15.
Romero, J. E., Keller, W., and Marfull, V. (2013). Short chronological analysis of the 2007-2009 eruptive cycle and its nested cones formation at Llaima volcano. J. Technol. Possib. 2, 1–9. Available online at: http://www.revistas.usach.cl/ojs/index.php/jotp/article/view/1395/1301
Rose, W. I., Palma, J. L., Escobar-Wolf, R., and Matías Gomez, R. O. (2013). A 50 yr eruption of a basaltic composite cone: Pacaya, Guatemala. Geol. Soc. Am. Spec. Pap. 498, 1–21. doi: 10.1130/2013.2498(01)
Sellitto, P., di Sarra, A., Corradini, S., Boichu, M., Herbin, H., Dubuisson, P., et al. (2016). Synergistic use of Lagrangian dispersion and radiative transfer modelling with satellite and surface remote sensing measurements for the investigation of volcanic plumes: the Mount Etna eruption of 25–27 October 2013. Atmos. Chem. Phys. 16, 6841–6861. doi: 10.5194/acp-16-6841-2016
Tupper, A., Itikarai, I., Richards, M., Prata, F., Carn, S., and Rosenfeld, D. (2007). Facing the challenges of the international airways volcano watch: the 2004/05 eruptions of Manam, Papua New Guinea. Weather Forecast. 22, 175–191. doi: 10.1175/WAF974.1
Vergniolle, S., and Jaupart, C. (1990). The dynamics of degassing at Kilauea volcano, Hawaii. J. Geophys. Res. 95, 2793–2809.
Viccaro, M., Garozzo, I., Cannata, A., Di Grazia, G., and Gresta, S. (2014). Gas burst vs. gas-rich magma recharge: a multidisciplinary study to reveal factors controlling triggering of the recent paroxysmal eruptions at Mt. Etna. J. Volcanol. Geotherm. Res. 278, 1–13. doi: 10.1016/j.jvolgeores.2014.04.001
Wadge, G., Oramas Dorta, D., and Cole, P. D. (2006). The magma budget of Volcán Arenal, Costa Rica from 1980 to 2004. J. Volcanol. Geotherm. Res. 157, 60–74. doi: 10.1016/j.jvolgeores.2006.03.037
Waythomas, C. F., Haney, M. M., Fee, D., Schneider, D. J., and Wech, A. (2014). The 2013 eruption of Pavlof Volcano, Alaska: a spatter eruption at an ice- and snow-clad volcano. Bull. Volcanol. 76:862. doi: 10.1007/s00445-014-0862-2
Keywords: Mt Etna, lava fountain, erupted volume, lava flows, tephra, magma budget, effusion rate, digital elevation models
Citation: Andronico D, Behncke B, De Beni E, Cristaldi A, Scollo S, Lopez M and Lo Castro MD (2018) Magma Budget From Lava and Tephra Volumes Erupted During the 25-26 October 2013 Lava Fountain at Mt Etna. Front. Earth Sci. 6:116. doi: 10.3389/feart.2018.00116
Received: 15 March 2018; Accepted: 30 July 2018;
Published: 23 August 2018.
Edited by:
Clive Oppenheimer, University of Cambridge, United KingdomReviewed by:
Marco Viccaro, Università degli Studi di Catania, ItalyLuis E. Lara, Sernageomin, Chile
Copyright © 2018 Andronico, Behncke, De Beni, Cristaldi, Scollo, Lopez and Lo Castro. This is an open-access article distributed under the terms of the Creative Commons Attribution License (CC BY). The use, distribution or reproduction in other forums is permitted, provided the original author(s) and the copyright owner(s) are credited and that the original publication in this journal is cited, in accordance with accepted academic practice. No use, distribution or reproduction is permitted which does not comply with these terms.
*Correspondence: Daniele Andronico, daniele.andronico@ingv.it