Census-Block-Level Property Risk Estimation Due to Extreme Cold Temperature, Hail, Lightning, and Tornadoes in Louisiana, United States
 Rubayet Bin Mostafiz1*
  Carol J. Friedland2
  Robert V. Rohli1
  Melanie Gall3
  Nazla Bushra1
  Joshua M. Gilliland4
- 1Department of Oceanography and Coastal Sciences, Louisiana State University, Baton Rouge, LA, United States
- 2Bert S. Turner Department of Construction Management, Louisiana State University, Baton Rouge, LA, United States
- 3Center for Emergency Management and Homeland Security, Arizona State University, Phoenix, AZ, United States
- 4Department of Geography and Anthropology, Kennesaw State University, Kennesaw, GA, United States
Rising property losses from natural hazards are typically the result of increased vulnerability, reduced resilience, low hazard mitigation effectiveness, or increased hazard intensities. Such property losses are frequently projected through population and asset growth, without considering changes in hazard frequency or intensity. This research describes a method of estimating risk, defined as projected annual property loss, anticipated to result from extreme cold temperature, hail, lightning, and tornado hazards through 2050 in the State of Louisiana, U.S.A. Our approach improves previous hazard risk assessments by 1) weighting risk by 2010 and 2050-projected population; 2) adjusting future hazard intensity based on recent climate model projections; and 3) producing results at the “microscale” census block, rather than previous county-wide or larger assessments. On a statewide basis, extreme cold temperature and tornado hazards incur by far the most risk of the four hazards. Extreme cold temperature and hail risk are projected to decrease as temperatures warm, especially in the New Orleans area. The lightning risk, while small, is projected to increase, both on an absolute and per capita basis. The proposed method and Louisiana results are appropriate to assist environmental, community, and emergency management planners in protecting life and property.
Introduction
According to Smith (2013), a hazard is a threat to people, goods, and the environment. Here we define risk as the product of probability and consequence of a hazardous event that has negative consequences. Cardona et al. (2012) emphasized that risk is not only a function of climate or weather phenomena but also relates to the exposure and vulnerability to the hazard. Therefore, the level of risk is determined by the relationship between a hazard and the probability of causing loss to human lives, property, and/or their associated environment. Continued development magnifies risk by exacerbating vulnerability to property losses and decreasing resilience to the hazard (Hauer et al., 2016). Kelman (2020) noted that coping capacity, a critical element of community resilience, modulates risk and the likelihood of a hazard and its impact to escalate into a disaster.
As coastal populations and development continue to increase over the last several decades, the risk of coastal natural hazards, defined as probability of occurrence multiplied by the potential loss during an occurrence, has risen sharply. In fact, in some ways, coastal development (including both population and economic growth) is incentivized without considering the additional burden of preventing, mitigating, and adapting to the increased risk exposure to the hazard. Siegel (2020) reported that more than 800 million people, or almost 10% of the Earth’s population, live in the 166 coastal cities having at least one million inhabitants. The sharp growth of these cities and other coastal populations rapidly increases the risk to natural hazards. The risk in coastal regions is increased by multiple, often simultaneous, hazards, especially related to flooding, such as coastal erosion, tidal flooding, sea level rise, storm surge, tsunami, and saltwater intrusion. Human-made structures often exacerbate this risk.
A wide range of geospatially-based risk estimation methods exists in the literature, particularly motivated by flooding. Kebede and Nicholls (2012) applied an elevation-based, geographic information system- (GIS-) analysis to assess exposure and vulnerability to coastal flooding under a range of climate and socioeconomic scenarios. Their results show that the spatial distribution of socio-economic changes, including population growth, urbanization, and economic development, play a significant role in exposure. While many flood-hazard risk estimation methods exist (Merz et al., 2019), uncertainty results primarily from spatial variability in rainfall, network topology, surface and sub-surface configuration, and channel-floodplain hydraulics (Quinn et al., 2019), in addition to coastal effects such as tidal storm duration, movement, and stage boundary conditions. Wing et al. (2018) found that population and GDP growth are the major factors contributing to future coastal flood risk which can also be accelerated by climate change. Salman and Li (2018) emphasized the need for understanding changes in flood risk associated with changes in climate and population. Similarly, the compound nature of flooding and other natural hazards has also been considered. For example, Wahl et al. (2015) evaluated the compound impacts of storm surge and precipitation on urban flooding. Gori et al. (2020) examined the role of tropical cyclones as agents of compound flooding. Zscheischler et al. (2018) found that the interplay and feedbacks between flood, wildfire, heat wave, and drought hazards could exacerbate their collective impacts.
More broadly, such synergistic natural phenomena could lead to an increase in economic risk from weather and climate by 3- to 5.4-fold for the United States by 2060 (Franzke and Czupryna 2020). In estimating county-level socioeconomic exposure for projecting future economic losses from natural hazards across the United States based on population size and inflation-adjusted wealth proxies, Preston (2013) found that regardless of disaster risk management, extreme weather events will cause increasing economic losses. In projecting European weather-related risk in 2100 due to heatwaves and cold waves, wildfires, droughts, river and coastal floods, and windstorm hazards by combining population, hazard, and disaster records, Forzieri et al. (2017) emphasized that the risk level due to global warming and population growth may increase 50-fold by 2100.
Similar geospatial analyses exist with foci around the world. Wu et al. (2018) used a spatial weighting methodology that requires population growth projections, in combination with other variables at the county scale in China to produce a grid-based asset value map usable for hazard risk assessment. Similar recent GIS-based natural hazards risk assessments are available for such areas as Bangladesh (Islam et al., 2013; Quader et al., 2017), China (Liu et al., 2013; Zhou et al., 2015; Qi and Du 2018), Taiwan (Hsieh 2014), Ukraine (Stepanova and Rubel 2015), Spain (Alcasena et al., 2016), British Columbia (Klassen and Allen 2017), Russia (Frolova et al., 2017; Osipov et al., 2017), and Vietnam (Vu and Ranzi. 2017).
Other approaches, including theoretical ones such as the Resilience Inference Measurement (RIM; Lam et al., 2016) that measure resilience, may be more effective for some applications but also may require input data that are not readily available. Furthermore, resilience measurements vis-à-vis hazards often cannot be known at the planning stage for development.
As environmental models continue to improve, their output, including the changing frequency and magnitude of the hazard in a changing climate, becomes an increasingly important tool to inform risk exposure assessment, as a prerequisite to enhancing resilience. Likewise, an understanding of the changing population structure and demographics is an important component that is often ignored. Moreover, wide spatial disparities exist in the factors contributing to risk, including property losses, even within a county, yet risk is usually expressed in spatial units at the county scale or coarser. Such simplified approaches to modeling future risk exposure underutilize available information and lead to planning goals that may not align optimally with the eventual outcomes.
The methods employed here offer improvement over previous hazard risk assessments in several ways. First, because hazard-induced property loss can only occur in the presence of a population exposed to the event, our approach, which weighs the property loss by the exposed population, may provide a more realistic assessment of risk than previous natural hazard risk assessments based on severe weather frequency maps. Second, our examination relies upon the most widely accepted model projections of the future severe weather event frequencies, downscaled to the state level. Third, this analysis produces results at the “microscale” census block, rather than previous county-wide or larger assessments. It also improves on work that emphasizes solely the structural resilience of material assets due to natural hazards (e.g., Gebbeken et al., 2016; Attary et al., 2017; Hatzikyriakou and Lin 2017).
The purpose of this research is to assess future property risk exposure in Louisiana, which is one of the most disaster-vulnerable United States states. We focus on the risk due to four hazards: extreme cold temperature, hail, lightning, and tornadoes, using a weight-based system of estimating future property loss, at a finer spatial scale than has been previously available, to enhance assessment of future risk exposure. The technique, and results from it, will be valuable to communities as they can inform land use planning, capital investments strategies, and hazard mitigation planning.
Materials and Method
Study Area and Selected Hazards
Louisiana is an example of a vulnerable coastal environment where risk assessment is an important endeavor. Thirteen tropical cyclones that have affected Louisiana since 2000 have each caused over $1 billion in damage (National Centers for Environmental Information (NCEI, formerly known as the National Climatic Data Center (NCDC)) National Centers for Environmental Information, 2020). Other events, most notably the August 2016 floods, have added to the list of federally declared disasters. In addition, coastal Louisiana is affected by insidious hazards that may potentially cause catastrophic loss, such as eustatic sea level rise with its attendant increased vulnerability to salt water intrusion and storm surge, and levee and dam failure, in addition to those that are common in adjacent inland areas, such as lightning, thunderstorms, hail, tornadoes, drought, wildfire, and winter storms. The hazards selected for analysis are those that appear in the 2014 and 2019 updates of the Louisiana State Hazard Mitigation Plan (SHMP) and produce widespread losses statewide; they include extreme cold temperature, hail, lightning, and tornadoes. Losses due to these hazards are also discrete and relatively straightforward to identify and attribute to each hazard.
Data
Historical property loss data for extreme cold temperature, hail, lightning, and tornado hazards were retrieved from the Spatial Hazards Events and Losses database for the United States (SHELDUSTM) produced by the Center for Emergency Management and Homeland Security (CEMHS 2017), which sources its data from the Storm Events reports by NCEI. The parish-level (analogous to county-level in other United States states) loss data covered the time period from 1960 through 2016 and were adjusted by inflation to 2016 dollars (2016$). With the exception of tornadoes, these property losses are largely unverified third-party estimates reported by emergency managers, media, and the highway patrol, among others. While other indicators of risk, such as human casualties, may be more appropriate for addressing many important research questions about hazards, the complications in projecting such behavior-based indicators into the future make property loss the most appropriate indicator for this analysis.
Each hazard was represented somewhat differently, contingent on data availability. Table 1 shows details of the years of analysis by hazard, along with the data source. Future projection of hazards relied on information from the fourth National Climate Assessment (NCA4; U.S. Global Change Research Program 2017) and population projections were based on data from United States Census Bureau (2020). NCA4 (2017) follows the method of the Intergovernmental Panel on Climate Change (IPCC) by running climate change scenarios termed “representative concentration pathways” (RCPs). As in the vast majority of contemporary climate change-based research, the model results using the RCPs are based on the Climate Model Intercomparison Project (CMIP). Results from IPCC’s fifth assessment report were available in NCA4.
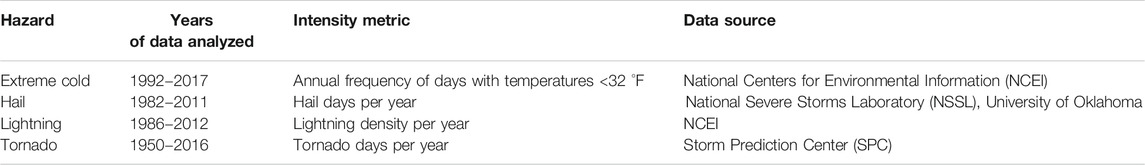
TABLE 1. Years analyzed and data sources, for property losses, by hazard in Louisiana.
Method for Projecting Population
Historical annual population estimates from the United States Census Bureau (2020) were used to generate future census-block level population estimates for the year 2050. For each parish i, parish-level overall average rate (
After
This method was chosen after experimentation with other methods of assessing population growth was unsuccessful. Specifically, because only 47 of Louisiana’s 64 parishes showed a significant trend line in population growth, and others displayed low R-squared values, use of growth rates were deemed to be inappropriate for downscaling to the census-block level. Likewise, use of the parish-level population trend line itself was accompanied by similar uncertainties. Moreover, the abrupt, sizable, and temporary population redistribution both within and beyond Louisiana resulting from significant hurricanes (most notably Katrina in 2005) made the approach selected most appropriate.
Method for Assessing Historical Hazard Intensity
For extreme cold temperature analysis, daily temperature data at 139 stations within and adjacent to Louisiana (available from NCEI from January 1, 1992 to October 14, 2017) were downloaded. Global Historical Climate Network-Daily (GHCND) quality flags available online were used to identify and delete erroneous values, along with cases with spurious temperature data (e.g., minimum temperature exceeds maximum temperature for the day). Any station for which plausible data existed for less than 90 percent of days were removed, as were stations with data sets extending for less than five years. These data quality criteria allowed 102 stations to be included in the extreme cold temperature analysis. Mean annual number of days in Louisiana having temperatures below 32 °F were mapped using ordinary kriging with a spherical semivariogram, cell size of 0.0005 × 0.0005 decimal degrees, and variable search radius of 12 points in ArcGIS®.
To analyze the hail hazard intensity, a triangulated irregular network (TIN) was created from a digitized map of mean annual hail days 1982–2011 acquired from National Severe Storms Laboratory (2020), with contour lines depicted as “hard edge” in ArcGIS®. The TIN was then rasterized at a cell size of 0.005 × 0.005 decimal degrees, using linear interpolation. Mean annual lightning count data, available from 1986 to 2012, were acquired from NCEI, in netCDF format and rasterized lightning density (flashes mi−2 yr−1) was calculated. Tornado touchdown point data (available from 1950 to 2016) were acquired from the United States Storm Prediction Center (SPC) (Storm Prediction Center, 2020) website and the mean annual number of days having a touchdown within 40 km (25 miles) was mapped across Louisiana using a spatial probability density created from kernel density estimation (Epanechnikov 1969) in the open-source cross-platform desktop QGIS®, using a cell size of 100 m × 100 m.
The four raster datasets described previously in this section were used to characterize the hazard intensity at each census block centroid. Centroids were calculated in ArcGIS® using shapefiles provided by United States Census Bureau (2020). To represent historical annual average hazard intensity
Method for Assessing Future Hazard Intensity
To account for changing frequencies and/or magnitudes of the hazard in the future, statewide adjustment coefficients for hazard k in future year f,
Changes to the extreme cold temperature hazard are assumed here to follow the projected changes to the annual number of days per year with temperatures <32 °F. Vose et al. (2017); their Figure 6.9) provided estimates of such changes. Thus, we assume that
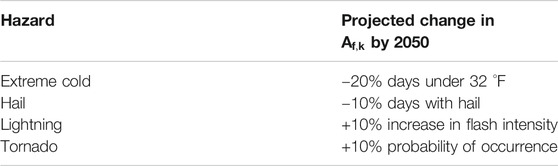
TABLE 2. Estimates of statewide future hazard intensity, by hazard.
For the severe storm hazards (hail, lightning, and tornadoes),
However, the other factors that also affect thunderstorm and tornado frequencies must also be considered. Because thunderstorm and tornadic activity is also favored when high-enthalpy air near the surface underlies air that is much colder aloft, amplification of the temperature difference between the surface and the overlying atmosphere (i.e., destabilizing the atmosphere) might be considered to enhance the probability of such severe storm development. Brooks (2013) summarized the work using climate model simulations by concluding that indeed, that vertical gradient, as represented by convective available potential energy (CAPE) that could be used to “fuel” disturbed weather, is projected to increase into the future. However, Brooks (2013) also noted that the vertical wind shear needed for tornadic development is generally weakening under global change climate simulations. Gensini et al. (2014) found through the use of a regional model simulation that extreme destabilization of the atmosphere (in the form of the number of days having an extreme CAPE) is likely to increase over a large section of the northeastern United States while it decreases over nearly all of Louisiana, at least when the 2041–2065 period is compared to the 1981–1995 interval. Collectively, this research leads to our assumption that for hail is −10% by the mid-21st century as compared to the present, while that for lightning and tornadoes is +10% (Table 2).
Method of Quantifying Historical per Capita Property Loss
Historical per capita property loss is used to represent the economic consequences of past hazard events. These data have been inflation-adjusted to represent 2016$ and use of per capita data alleviates dependence of historical loss data on the population at that time. Thus, per capita loss basis is flexible for both historical and projected future population. For each hazard k, parish-level (i) mean annual per capita property loss (
Method of Projecting Future Property Loss
Baseline average annual parish(i)-level loss for each hazard k (
Baseline parish-level hazard- and population-adjusted loss ratio
To achieve an estimate of future property loss at the census block level for each hazard k (
Results
Population Changes
Figures 1A,B shows the projected changes in population and population density from 2010 to 2050. The 2050 values were calculated using Eqs 1 and 2, assuming that the 102,781 census blocks from among the 203,447 total in Louisiana that were inhabited in 2010 remain the only blocks inhabited in 2050. Supplementary Appendix A shows these values by parish, along with 2050-projected annual property loss by hazard.
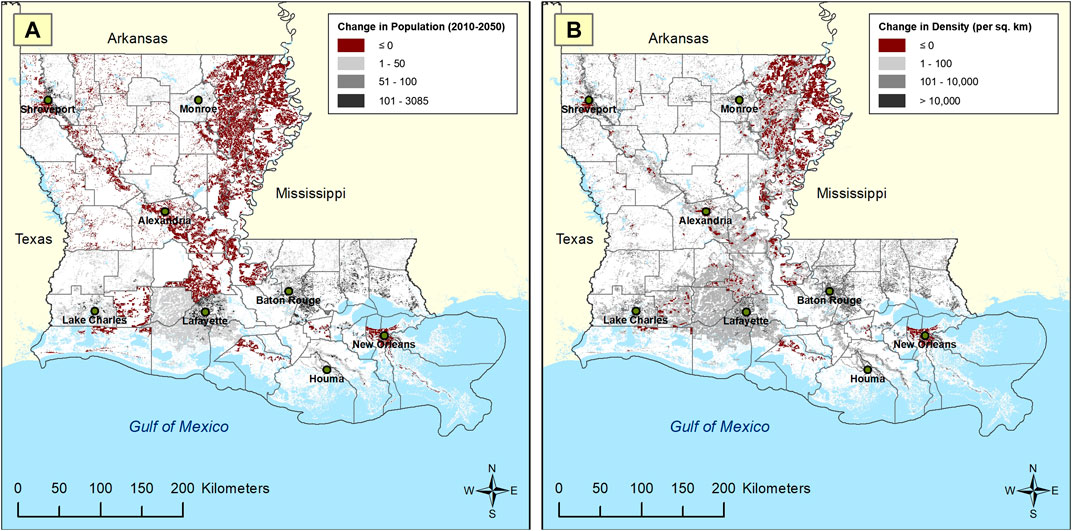
FIGURE 1. Change in population (A) and population density (B) by census block in Louisiana from 2010 to projection for 2050.
Hazard Intensity
Current hazard intensity is shown individually by hazard in Figures 2A–D. Extreme cold temperatures are most prominent throughout the northern part of the state, while hail is most concentrated in the northwest, lightning density in the heavy population centers especially in the southeast, and tornado shows a peak in south-central Louisiana. The geographical distribution of these hazards is projected to change only minimally by 2050, but frequencies of the hazards may change (Figures 3A–D). Some notable decreases in the extreme cold temperature and hail frequencies are also notable by comparing Figure 2A to Figure 3A and Figure 2B to Figure 3B. The most obvious increase is a widening of the lightning-intensity hazard across southeastern Louisiana (compare Figure 2C to Figure 3C).
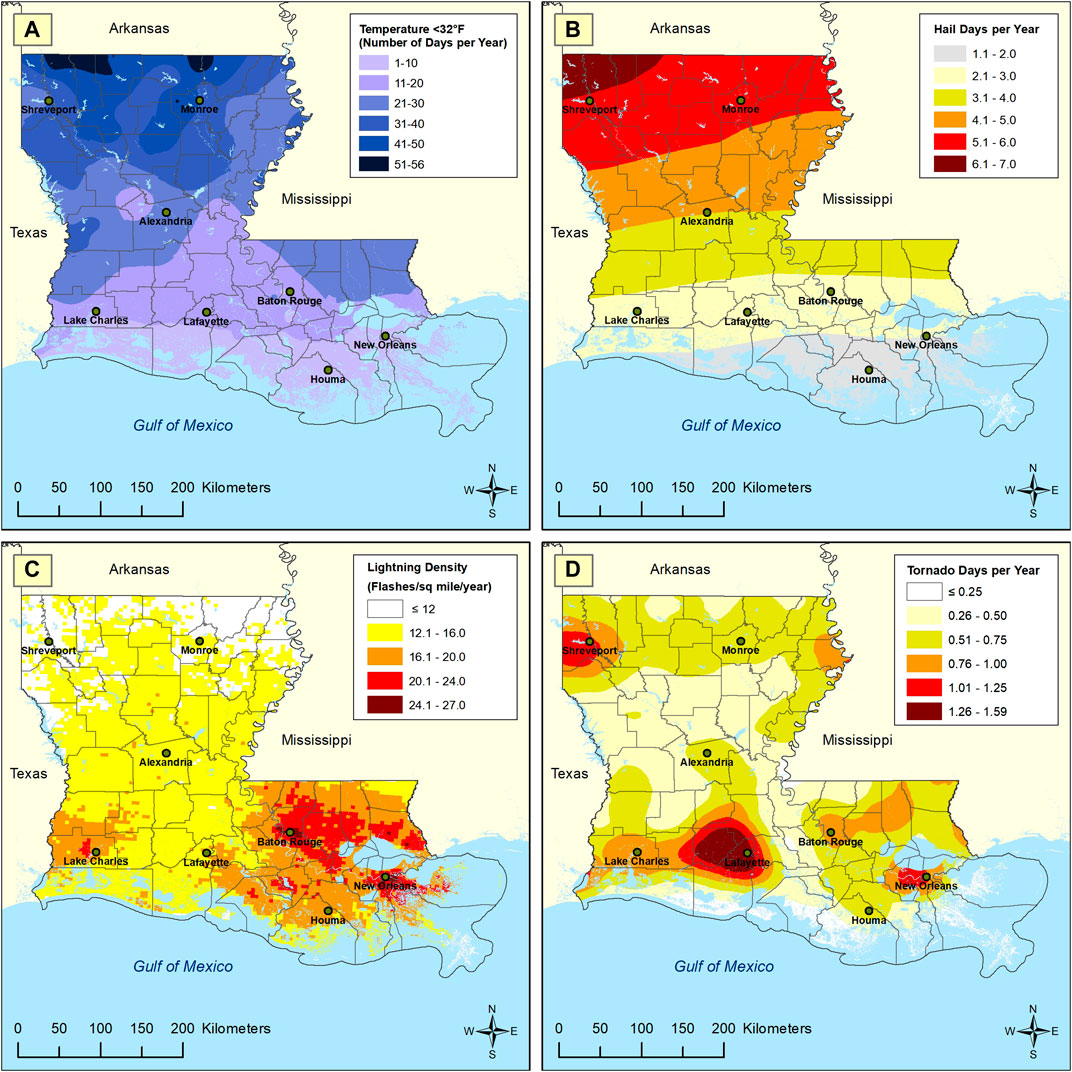
FIGURE 2. Average hazard intensity in Louisiana: extreme cold temperature (A), hail (B), lightning (C), and tornado (D).
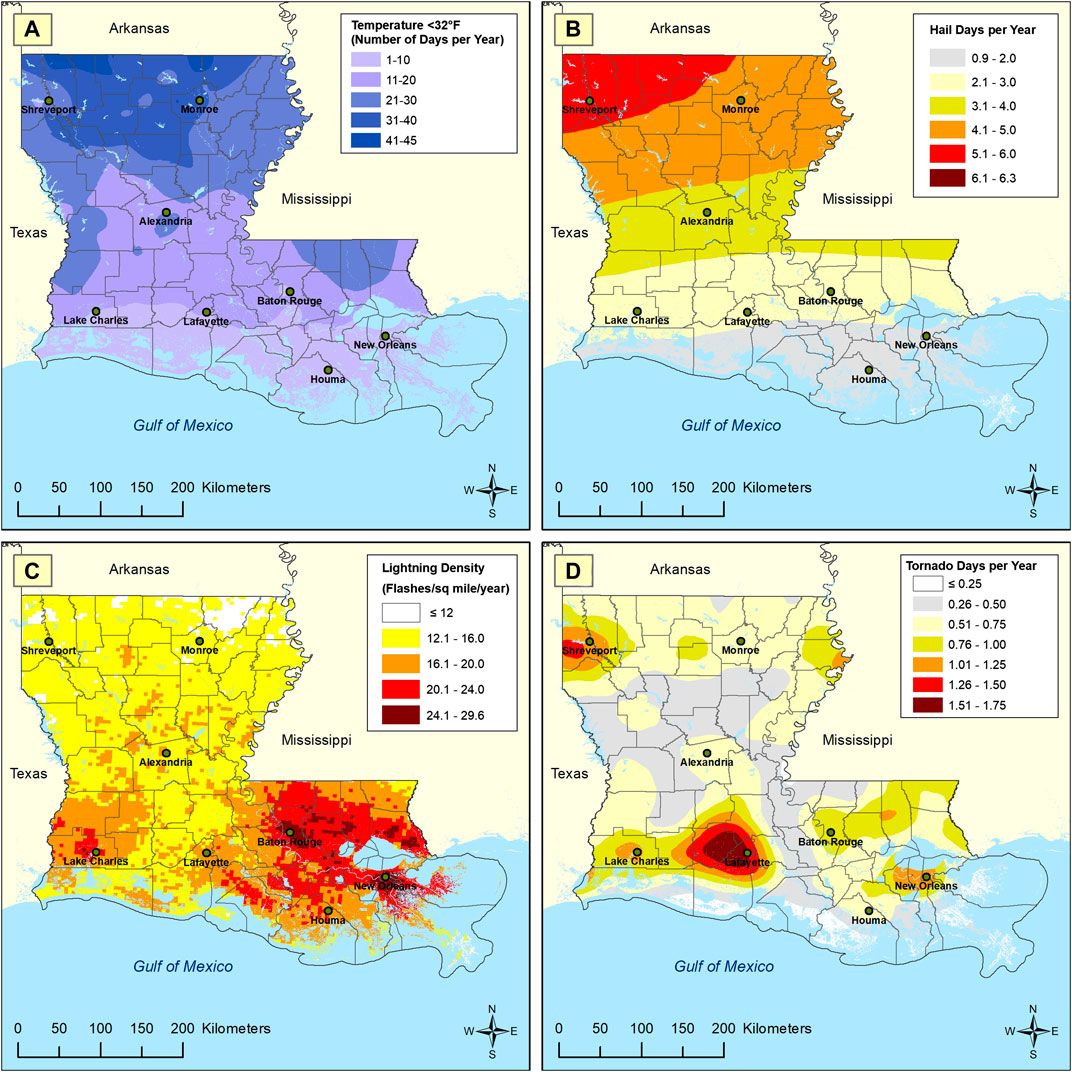
FIGURE 3. As in Figure 2, but projected for 2050.
Projected Property Loss
On a statewide basis, of the four hazards analyzed here, the vast majority (89.1 percent) of historical average annual property losses occurred because of extreme cold temperatures and tornadoes (Table 3). By 2050, total annual property loss, and therefore risk, is likely to increase by about 80 percent (2016$), with the same two hazards continuing to comprise the vast majority (87.5%) of the total (Table 3). Mean per capita annual property loss in 2050, for the four hazards, is estimated to amount to about $9.50 (in 2016$). While both hail and lightning will increase in projected property loss yet remain a relatively small percentage of total losses, hail is projected to become an even smaller percentage of the total, while lightning losses are projected to increase substantially.
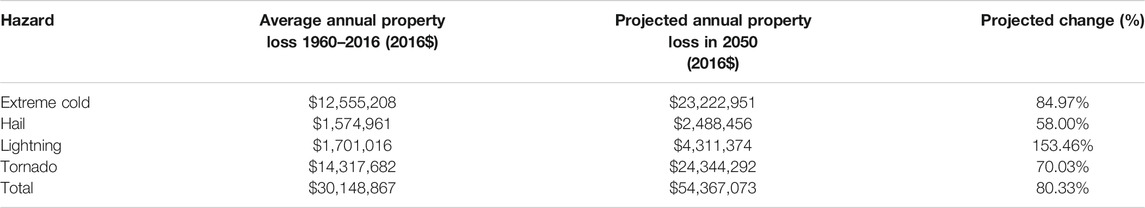
TABLE 3. Comparison of Louisiana statewide property loss, by hazard: Historical vs. 2050-projected.
Figures 4A–D shows the projected property loss (2016$) for extreme cold temperature, hail, lightning, and tornadoes, respectively, by census block, and Figures 5A–D shows the same phenomena for per capita losses. The absence of property loss (i.e., risk) in a given area infers that the area is unpopulated rather than that there is no severe weather. Interestingly, both total and per capita property loss in the New Orleans metropolitan region are projected to be disproportionately less affected than other heavily-populated areas by each of the four hazards.
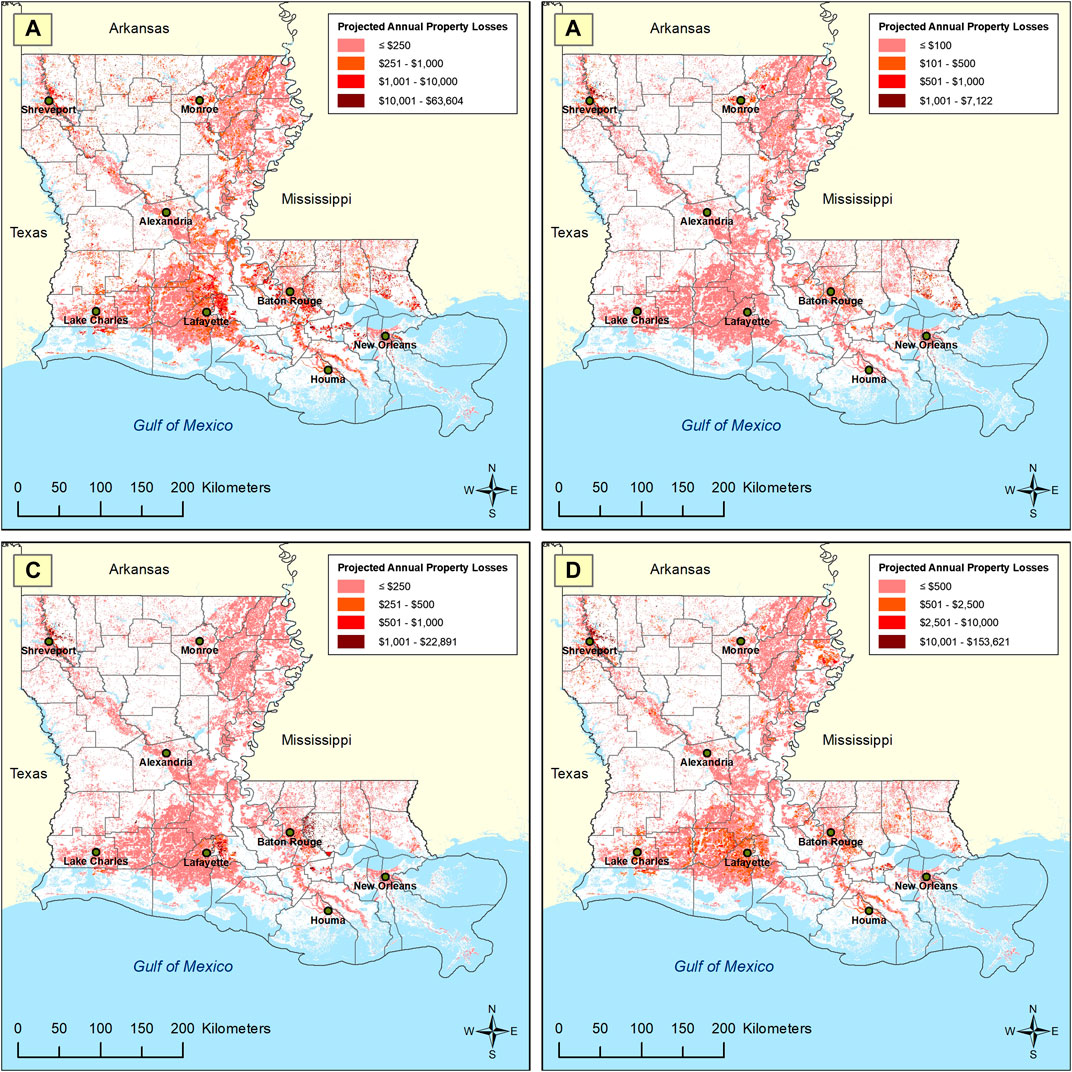
FIGURE 4. Projected risk represented by annual property loss (2016$) by census block in Louisiana, 2050: Extreme cold temperatures (A); hail (B); lightning (C); and tornado (D).
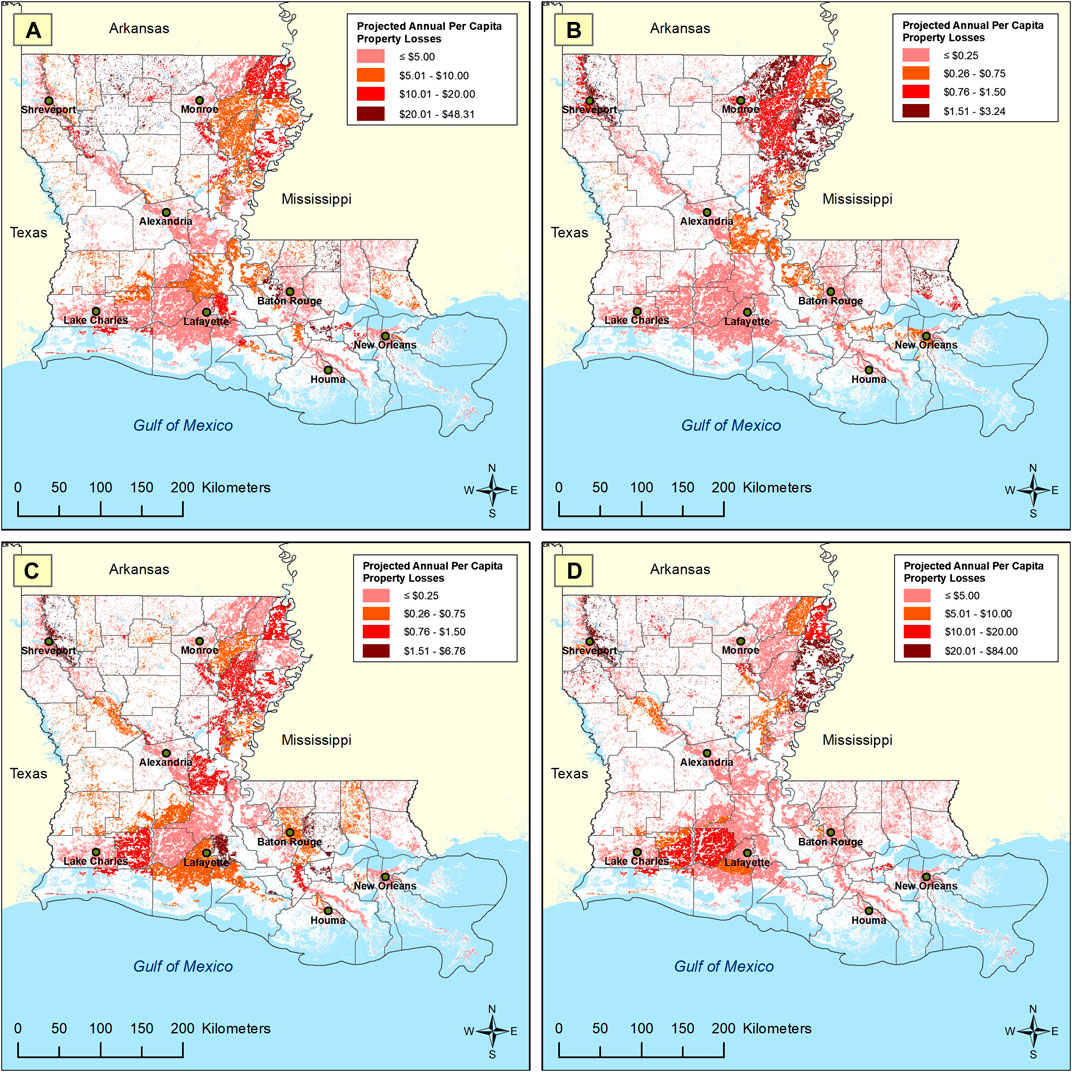
FIGURE 5. As in Figure 4, but for per capita projections, 2050.
The risk due to extreme cold temperature by 2050 is projected to be heaviest where there is a combination of hazard exposure (i.e., northern location), population concentration (i.e., larger cities), and a history of losses. For these reasons, south-central Louisiana and the isolated population centers in northern Louisiana are projected to have the highest losses (Figure 4A). Notably, as with all losses described in this research, these include property losses only–not crops; the largely agricultural parishes will also experience disproportionately heavy crop losses not shown here. St. Tammany is projected to have the greatest property loss among the parishes (17.3% of Louisiana’s total; Supplementary Appendix A). The census block (220279502003010) with the highest projected total property loss due to extreme cold temperature is in Claiborne Parish, which is projected to have a parish-wide annual average property loss of about $24.36 per person (Supplementary Appendix B). On a per capita basis (Figure 5A), the largest cold-temperature extreme losses are in census block 220919512003034 in sparsely-populated St. Helena Parish, where parish-wide values are projected at $45.56, compared with $4.05 for the state, where results are influenced by high historical per capita loss (Supplementary Appendix B).
The hail hazard in 2050 is likely to have the greatest property losses (i.e., risk) in northwestern Louisiana, including Shreveport, in the northeast, including Monroe, and St. Tammany Parish (just north of Lake Pontchartrain; Figure 4B). The census block with the highest projected total annual property loss due to hail ($7,122 in block 220150106011000) is in Bossier Parish, which has a parish-wide annual average property loss of about $2.61 per person. On a per capita basis (Figure 5B), a census block (221070001001017) in sparsely-populated Tensas Parish (northeastern Louisiana) is projected to have the greatest annual per capita loss due to hail ($3.24/year), and Tensas is estimated to have the highest parish-wide per capita annual hail damage ($3.07, compared to $0.43 for the state).
Lightning risk is projected to be concentrated in the urban areas of Baton Rouge (especially East Baton Rouge and Livingston parishes), Shreveport (especially Bossier and Caddo parishes), and Lafayette (especially Lafayette and St. Martin parishes; Figure 4C). Total annual property loss on an absolute basis peaks at $22,891 in Livingston Parish census block 220630403033000, or about $6.05 per person. On a per capita basis (Figure 5C), maximum values are in the Lafayette and Shreveport areas, and to a lesser extent near Baton Rouge and The Delta. Per capita annual losses are projected to be highest ($6.75) in census block 220630408062023 of Livingston Parish, with Livingston, which has had a history of relatively high losses, having the highest per capita loss among the parishes ($6.23, compared to $0.75 for the state).
Risk due to tornadoes is expected to remain much higher than that due to hail and lightning, because of the massive potential for damage and impact. Peak absolute losses are projected to be near Shreveport, with Bossier Parish showing the highest absolute property loss ($9,876,829) due to tornado in 2050, and near Lafayette and other metropolitan areas (Figure 4D). The greatest absolute annual tornado loss is in census block 220150106011000 in Bossier Parish ($153,621). Per capita annual damage due to tornado (Figure 5D) is projected to peak at $83.87 in census block 220659601001438 of Madison Parish (northeastern Louisiana), with Madison and Bossier Parishes having the highest parish-wide total ($68.06 and $52.55, respectively, compared with $4.24 statewide; Supplementary Appendix B).
Discussion
Interpretation of Results
Many of the 2050 hazard loss projections (i.e., risk) are driven by, and dependent on the accuracy of, the projected changes in population. According to Figures 1A,B, the most substantial increases are projected in metropolitan Baton Rouge, the north shore of Lake Pontchartrain north of New Orleans (i.e., the so-called Florida Parishes), and in sections of southwestern Louisiana. Figures 1A,B also shows that depopulation is projected for much of the New Orleans and Shreveport metropolitan areas, along with most of impoverished, lowland, northeastern Louisiana (known as “The Delta”), the Red River Valley extending from the northwestern corner of the state southeastward toward the Baton Rouge metropolitan area, and some of the coastal wetland areas, the latter of which are plagued with threats of sea level rise and coastal subsidence.
Likewise, hazard loss projections are highly dependent on the accuracy of the hazard intensity projections, with several results being particularly noteworthy. First, our results suggest that on an absolute basis, cities of southern Louisiana are at least as vulnerable to the extreme cold temperature hazard as those in the northern part of the state, presumably due to the larger population and lack of mitigation procedures for buffering the effects of cold weather. Second, the relatively minor projected damage in New Orleans due to cold temperatures and hail are likely largely a function of the projected warming, but the total property losses due to all hazards are also undoubtedly affected by the projected population decrease. Third, the generally minor anticipated damage due to lightning is interesting because lightning is well-known to be the most life-threatening hazard of those examined here, with Louisiana among the most lightning-stricken parts of the nation. If property damage due to lightning is truly proportionate to loss of life due to lightning, it seems likely that much lightning damage either goes unreported or is attributed to the type of storm (such as high winds, thunderstorm, or other event) in which the lightning was embedded. Furthermore, despite the relatively small risk for lightning, which can be mitigated relatively effectively by installation of lightning rods, it is important to remember that our calculations only involve property; the risk to life would likely cause lightning to emerge as a much more substantial hazard. Fourth, caution should be exercised in the interpretation of the tornado projections, as specific tornado tracks are unpredictable even at lead times of a few hours, and a singular tornado could cause devastating impacts far beyond those predicted using techniques employed here.
Study Limitations
The reliability of the 2050-projected risk depends on the accuracy of the input data (historical property loss, hazard frequency and magnitude), population projections, and model assumptions (
A brief sensitivity analysis to demonstrate the impact of different model assumptions regarding future conditions for each hazard, taken one at a time, is presented in Table 4. Column 4 in Table 4 shows the estimated change in annual property loss if an underestimate or overestimate in modeled values of ten percent occurs. Interestingly, due to compensating effects of hazard intensities that are projected to increase (i.e., lightning and tornado) vs. those expected to decrease (i.e., extreme cold and hail), an “across-the-board” underestimation or overestimation for all four hazards leads to very similar bulk total property losses (i.e., bottom row of Table 4). Changes in human behavior, including wealth/GDP, adaptation, and policy that result in changes in mitigation, resilience, and/or vulnerability are not incorporated.
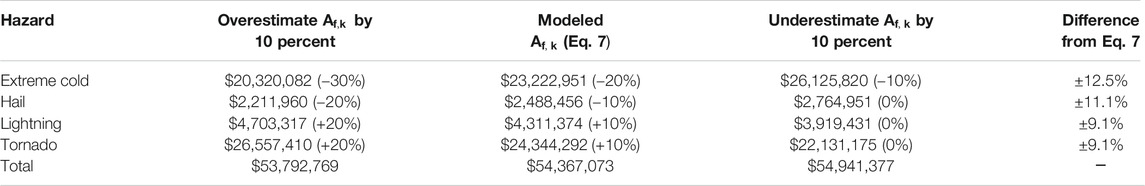
TABLE 4. Sensitivity analysis of 2050 annual property loss (i.e., risk) statewide in Louisiana for each hazard, with +10% of the change reported in Table 2 (2016$).
Furthermore, historical property loss data in SHELDUS are not without limitations. Although SHELDUS includes loss estimates across all hazard types and magnitudes—ranging from low impact events of a few hundred dollars to catastrophic events causing more than $1 billion dollars in damage—there are inherent gaps and biases in these estimates. For example, prior to 1996, NCEI (NCDC) reported loss estimates in logarithmic categories (e.g., $50,000 to $500,000) rather than as actual values. Since SHELDUS utilizes the lower bound for these categorical estimates, loss estimates tend to be much lower for earlier decades. Indirect losses, such as lost hours of employment, deterioration of health during evacuation, and many other storm-induced stressors, are missing due to a lack of information (Gall et al., 2009). Aside from limited data availability, there are also data management decisions that introduce estimate uncertainty. Although the National Weather Service strives to report losses at the county level, some hazards such as extreme cold temperatures are often reported as a multi-county event. In those instances, SHELDUS georeferences losses as equal shares among the affected counties, regardless of whether the disaster and/or its impacts (which are affected directly by population, population density, and development) were distributed unevenly throughout the affected counties. Despite the limitations, SHELDUS has been used extensively in similar studies (e.g., Rohli et al., 2016; Hahn et al., 2017; Paul and Sharif 2018) because it represents the best available property loss data for the United States.
Summary and Conclusion
One perennial complication of assessing natural hazard risk is that the scale of the damage, especially from extreme events, is so spatially heterogeneous and/or localized that aggregating data to a county-level risk is spurious. Another complication is that future changes in either local hazard intensity or population are often ignored in projecting risk. This research seeks to enhance risk assessment by offering a more localized approach, using weighted, model-based projections of population and future hazard frequencies and intensities to estimate census-block-level risk of property loss due to several severe weather hazards in Louisiana, United States, by 2050. These projections are robust, for three reasons: a) they rest largely on “official” output in the form of the Fourth National Climate Assessment (NCA4; United States Global Change Research Program 2017), developed by a team of more than 300 federal and non-federal experts, supervised by National Oceanic and Atmospheric Administration; b) instead of using any single specific prediction from NCA4, we aggregate the output from NCA4 to a simple percentage increase or decrease in the magnitude/severity of the hazard; and c) we performed a sensitivity analysis (Table 4) on our projections.
Results suggest that both present and future losses to the four hazards are generally concentrated in the heavily-populated parts of Louisiana, but with some modifications due to spatial variability in historical and projected hazard intensities. For Louisiana as a whole, extreme cold temperature and tornado are by far the costliest of the four hazards in terms of property loss, although tornado loss is inherently difficult to project due to the unpredictable nature of individual tornado paths. Both extreme temperatures and hail are projected to decrease in loss as temperatures warm, especially in the New Orleans area, where population may decrease. The lightning hazard, while small and likely underestimated due to assignment of lightning damage to the phenomena in which it is embedded, is projected to increase, both on an absolute and per capita basis. These results are important because they will guide environmental planners as they allocate resources for mitigating and adapting to these natural hazards in one of the most weather-hazard-vulnerable states in the United States.
Future research should use this methodology for assigning risk to future losses due to other hazards, such as flood, extreme heat, and winds. Moreover, more sophisticated demographic projections, including changes to the population pyramids, along with changes in land use, should also be incorporated into model projections of future losses. Finally, more comprehensive risk assessment must include the difficult or impossible task of quantifying ecosystem services. Nevertheless, this research represents an important “next step” in the protection of life and property.
Data Availability Statement
The raw data supporting the conclusions of this article will be made available by the authors, without undue reservation.
Author Contributions
RM developed the methodology, collected and analyzed the data, and developed the initial text. CF provided original ideas and advice on the overall project methodology and edited the text. RR developed the atmospheric projections and edited early and late drafts of the text. MG provided the SHELDUS data, assisted in developing methodology regarding the population projections and use of SHELDUS data, and edited the text. NB expanded the literature review and provided oversight on analysis, particularly regarding the population projections. JG provided early assistance on population projections and edited the text.
Funding
This project resulted from the 2019 Louisiana State Hazard Mitigation Plan update, for which CF and RR received funding from FEMA, via Louisiana’s Governor’s Office of Homeland Security and Emergency Preparedness (GOHSEP), grant number: 2000301135. Any opinions, findings, conclusions, and recommendations expressed in this manuscript are those of the authors and do not necessarily reflect the views of FEMA or GOHSEP.
Conflict of Interest
The authors declare that the research was conducted in the absence of any commercial or financial relationships that could be construed as a potential conflict of interest.
Acknowledgments
Publication of this article was subsidized by the LSU Libraries Open Access Author Fund. The authors warmly appreciate the assistance and support of Jeffrey Giering of GOHSEP for overall project support, and David Dunaway of LSU Libraries for assistance in acquiring population data.
Supplementary Materials
The Supplementary Material for this article can be found online at: https://www.frontiersin.org/articles/10.3389/feart.2020.601624/full#supplementary-material
References
Alcasena, F. J., Salis, M., Nauslar, N. J., Aguinaga, A. E., and Vega-García, C. (2016). Quantifying economic losses from wildfires in black pine afforestations of northern Spain. For. Pol. Econ. 73 (C), 153–167. doi:10.1016/j.forpol.2016.09.005. CrossRef Full Text
Attary, N., Unnikrishnan, V. U., van de Lindt, J. W., Cox, D. T., and Barbosa, A. R. (2017). Performance-based tsunami engineering methodology for risk assessment of structures. Eng. Struct. 141, 676–686. doi:10.1016/j.engstruct.2017.03.071. CrossRef Full Text
Brooks, H. E. (2013). Severe thunderstorms and climate change. Atmos. Res. 123, 129–138. doi:10.1016/j.atmosres.2012.04.002. CrossRef Full Text
Cardona, O. D., van Aalst, M. K., Birkmann, J., Fordham, M., McGregor, G., Perez, R., et al. (2012). “Determinants of risk: exposure and vulnerability,” in Managing the Risks of extreme Events and Disasters to advance climate change adaptation: a special Report of working groups I and II of the intergovernmental Panel on climate change (IPCC). Editors Field, C. B., Barros, V., Stocker, T. F., Qin, D., Dokken, D. J., Ebi, K. L.et al. (Cambridge, United Kingdom and New York, NY, United States: Cambridge University Press), 65–108.
Center for Emergency Management and Homeland Security (CEMHS) (2017). Spatial hazard events and losses Database for the United States, version 16.1. Center for Emergency Management and Homeland Security, Arizona State University. Availble at: https://cemhs.asu.edu/sheldus. Accessed August 31, 2020.
Epanechnikov, V. A. (1969). Non-parametric estimation of a multivariate probability density. Theory Probab. Appl. 14 (1), 153–158. doi:10.1137/1114019. CrossRef Full Text
Forzieri, G., Cescatti, A., e Silva, F. B., and Feyen, L. (2017). Increasing risk over time of weather-related hazards to the European population: a data-driven prognostic study. Lancet Planet. Health 1 (5), e200−e208. doi:10.1016/S2542-5196(17)30082-7. CrossRef Full Text
Franzke, C. L. E., and Czupryna, M. (2020). Probabilistic assessment and projections of US weather and climate risks and economic damages. Climat. Change 158 (3), 503–515. doi:10.1007/s10584-019-02558-8. CrossRef Full Text
Frolova, N. L., Kireeva, M. B., Magrickiy, D. V., Bologov, M. B., Kopylov, V. N., Hall, J., et al. (2017). Hydrological hazards in Russia: origin, classification, changes and risk assessment. Nat. Hazards 88 (Suppl. 1), 103–131. doi:10.1007/s11069-016-2632-2. CrossRef Full Text
Gall, M., Borden, K. A., and Cutter, S. L. (2009). When do losses count? Bull. Am. Meteorol. Soc. 90 (6), 799–810. doi:10.1175/2008BAMS2721.1. CrossRef Full Text
Gebbeken, N., Videkhina, I., Pfeiffer, E., Garsch, M., and Rüdiger, L. (2016). Risikobewertung und Schutz von baulichen Infrastrukturen bei Hochwassergefahr. Bautechnik 93 (4), 199–213. doi:10.1002/bate.201600003. CrossRef Full Text
Gensini, V. A., Ramseyer, C., and Mote, T. L. (2014). Future convective environments using NARCCAP. Int. J. Climatol. 34 (5), 1699–1705. doi:10.1002/joc.3769. CrossRef Full Text
Gori, A., Lin, N., and Smith, J. (2020). Assessing compound flooding from landfalling tropical cyclones on the North Carolina coast. Water Resour. Res. 56 (4), e2019WR026788. doi:10.1029/2019wr026788. CrossRef Full Text
Hahn, D. J., Viaud, E., and Corotis, R. B. (2017). Multihazard mapping of the United States. ASCE-ASME J. Risk Uncertainty Eng. Syst. Part A Civ. Eng. 3, 04016016. doi:10.1061/AJRUA6.0000897. CrossRef Full Text
Hatzikyriakou, A., and Lin, N. (2017). Impact of performance interdependencies on structural vulnerability: a systems perspective of storm surge risk to coastal residential communities. Reliab. Eng. Syst. Saf. 158, 106–116. doi:10.1016/j.ress.2016.10.011. CrossRef Full Text
Hauer, M. E., Evans, J. M., and Mishra, D. R. (2016). Millions projected to be at risk from sea-level rise in the continental United States. Nat. Clim. Change 6 (7), 691–695. doi:10.1038/nclimate2961. CrossRef Full Text
Hsieh, C.-H. (2014). Disaster risk assessment of ports based on the perspective of vulnerability. Nat. Hazards 74 (2), 851–864. doi:10.1007/s11069-014-1214-4. CrossRef Full Text
Islam, M. N., Malak, M. A., and Islam, M. N. (2013). Community-based disaster risk and vulnerability models of a coastal municipality in Bangladesh. Nat. Hazards 69 (3), 2083–2103. doi:10.1007/s11069-013-0796-6. CrossRef Full Text
Kebede, A. S., and Nicholls, R. J. (2012). Exposure and vulnerability to climate extremes: population and asset exposure to coastal flooding in Dar es Salaam, Tanzania. Reg. Environ. Change 12 (1), 81–94. doi:10.1007/s10113-011-0239-4. CrossRef Full Text
Klassen, J., and Allen, D. M. (2017). Assessing the risk of saltwater intrusion in coastal aquifers. J. Hydrol. 551, 730–745. doi:10.1016/j.jhydrol.2017.02.044. CrossRef Full Text
Lam, N. S., Reams, M., Li, K., Li, C., and Mata, L. P. (2016). Measuring community resilience to coastal hazards along the northern Gulf of Mexico. Nat. Hazards Rev. 17 (1), 04015013. doi:10.1061/(ASCE)NH.1527-6996.0000193. CrossRef Full Text
Liu, B., Siu, Y. L., Mitchell, G., and Xu, W. (2013). Exceedance probability of multiple natural hazards: risk assessment in China's Yangtze River Delta. Nat. Hazards 69 (3), 2039–2055. doi:10.1007/s11069-013-0794-8. CrossRef Full Text
Merz, B., Kundzewicz, Z. W., Delgado, J., Hundecha, Y., and Kreibich, H. (2019). “Detection and attribution of changes in flood hazard and risk,” in Changes in flood Risk in Europe. Editor Kundzewicz, Z. W. (London, UK: e-book co-published by the International Association of Hydrological Sciences and CRC Press), 435–458.
National Centers for Environmental Information. (2020). National oceanic and atmospheric administration. Available at: https://www.ncei.noaa.gov/. Accessed August 31, 2020.
National Severe Storms Laboratory. (2020). National oceanic and atmospheric administration. Available at: https://www.nssl.noaa.gov/. Accessed August 11, 2020].
Osipov, V. I., Larionov, V. I., Burova, V. N., Frolova, N. I., and Sushchev, S. P. (2017). Methodology of natural risk assessment in Russia. Nat. Hazards 88 (Suppl. 1), 17–41. doi:10.1007/s11069-017-2780-z. CrossRef Full Text
Paul, S., and Sharif, H. (2018). Analysis of damage caused by hydrometeorological disasters in Texas, 1960-2016. Geosciences 8 (10), 384. doi:10.3390/geosciences8100384. CrossRef Full Text
Preston, B. L. (2013). Local path dependence of U.S. socioeconomic exposure to climate extremes and the vulnerability commitment. Global Environ. Change 23 (4), 719–732. doi:10.1016/j.gloenvcha.2013.02.009. CrossRef Full Text
Qi, P., and Du, M. (2018). Multi-factor evaluation indicator method for the risk assessment of atmospheric and oceanic hazard group due to the attack of tropical cyclones. Int. J. Appl. Earth Obs. Geoinf. 68, 1–7. doi:10.1016/j.jag.2018.01.015. CrossRef Full Text
Quader, M., Khan, A., and Kervyn, M. (2017). Assessing risks from cyclones for human lives and livelihoods in the coastal region of Bangladesh. Ijerph 14 (8), 831. doi:10.3390/ijerph14080831. CrossRef Full Text
Quinn, N., Bates, P. D., Neal, J., Smith, A., Wing, O., Sampson, C., et al. (2019). The spatial dependence of flood hazard and risk in the United States. Water Resour. Res. 55 (3), 1890–1911. doi:10.1029/2018WR024205. CrossRef Full Text
Rohli, R. V., Bushra, N., Lam, N., Zou, L., Mihunov, V., Reams, M. A., and Argote, J. E. (2016). Drought indices as drought predictors in the south-central United States. Nat. Hazards 83 (3), 1567–1582. doi:10.1007/s11069‒016‒2376‒z
Salman, A. M., and Li, Y. (2018). Flood risk assessment, future trend modeling, and risk communication: a review of ongoing research. Nat. Hazards Rev. 19 (3), 04018011. doi:10.1061/(ASCE)NH.1527-6996.0000294. CrossRef Full Text
Siegel, F. R. (2020). Adaptations of coastal cities to global warming, sea level rise, climate change and endemic hazards. Cham, Switzerland: Springer. doi:10.1007/978-3-030-22669-5
Smith, K. (2013). Environmental hazards: assessing risk and reducing disaster. 6th Edition. New York: Routledge.
Stepanova, K., and Rubel, O. (2015). Approaches to natural hazard risk assessment and management in Ukraine. J. Environ. Prot. Ecol. 16 (3), 908–918.
Storm Prediction Center. (2020). National oceanic and atmospheric administration. Available at: https://www.spc.noaa.gov/. Accessed August 11, 2020.
United States Global Change Research Program. (2017). Climate science special report: fourth national climate assessment, volume I. Editors Wuebbles, D. J., Fahey, D. W., Hibbard, K. A., Dokken, D. J., Stewart, B. C., and Maycock, T. K. (Washington, D.C., United States: U.S. Global Change Research Program), 470. doi:10.7930/J0J964J6
United States Census Bureau. (2020). Available at: https://www.census.gov/. Accessed July 24, 2020.
Vose, R. S., Easterling, D. R., Kunkel, K. E., LeGrande, A. N., and Wehner, M. F. (2017). “Temperature changes in the United States,” in Climate science special report: fourth national climate assessment, volume I. Editors Wuebbles, D. J., Fahey, D. W., Hibbard, K. A., Dokken, D. J., Stewart, B. C., and Maycock, T. K. (Washington D.C.: U.S. Global Change Research Program), 185–206. doi:10.7930/J0N29V45
Vu, T. T., and Ranzi, R. (2017). Flood risk assessment and coping capacity of floods in central Vietnam. J. Hydro Environ. Res. 14, 44–60. doi:10.1016/j.jher.2016.06.001. CrossRef Full Text
Wahl, T., Jain, S., Bender, J., Meyers, S. D., and Luther, M. E. (2015). Increasing risk of compound flooding from storm surge and rainfall for major US cities. Nat. Clim. Change 5 (12), 1093–1097. doi:10.1038/NCLIMATE2736. CrossRef Full Text
Wing, O. E. J., Bates, P. D., Smith, A. M., Sampson, C. C., Johnson, K. A., Fargione, J., et al. (2018). Estimates of present and future flood risk in the conterminous United States. Environ. Res. Lett. 13 (3), 034023. doi:10.1088/1748-9326/aaac65. CrossRef Full Text
Wu, J., Li, Y., Li, N., and Shi, P. (2018). Development of an asset value map for disaster risk assessment in China by spatial disaggregation using ancillary remote sensing data. Risk Anal. 38 (1), 17–30. doi:10.1111/risa.12806. CrossRef Full Text
Zhou, Y., Liu, Y., Wu, W., and Li, N. (2015). Integrated risk assessment of multi-hazards in China. Nat. Hazards 78 (1), 257–280. doi:10.1007/s11069-015-1713-y. CrossRef Full Text
Zscheischler, J., Westra, S., van den Hurk, B. J. J. M., Seneviratne, S. I., Ward, P. J., Pitman, A., et al. (2018). Future climate risk from compound events. Nat. Clim. Change 8 (6), 469–477. doi:10.1038/s41558-018-0156-3. CrossRef Full Text
Keywords: natural hazards, risk assessment, extreme cold temperature, lightning, hail, tornado, property loss, Louisiana
Citation: Mostafiz RB, Friedland CJ, Rohli RV, Gall M, Bushra N and Gilliland JM (2020) Census-Block-Level Property Risk Estimation Due to Extreme Cold Temperature, Hail, Lightning, and Tornadoes in Louisiana, United States. Front. Earth Sci. 8:601624. doi: 10.3389/feart.2020.601624
Received: 01 September 2020; Accepted: 13 October 2020;
Published: 09 November 2020.
Edited by:
Mark Bebbington, Massey University, New ZealandReviewed by:
Christian L. E. Franzke, University of Hamburg, GermanyJia-wen Zhou, Sichuan University, China
Copyright © 2020 Mostafiz, Friedland, Rohli, Gall, Bushra and Gilliland. This is an open-access article distributed under the terms of the Creative Commons Attribution License (CC BY). The use, distribution or reproduction in other forums is permitted, provided the original author(s) and the copyright owner(s) are credited and that the original publication in this journal is cited, in accordance with accepted academic practice. No use, distribution or reproduction is permitted which does not comply with these terms.
*Correspondence: Rubayet Bin Mostafiz, rbinmo1@lsu.edu