Rock Physics Model and Seismic Dispersion and Attenuation in Gas Hydrate-Bearing Sediments
 Zhiqi Guo
 Xueying Wang
 Jian Jiao1*
 - 1College of Geo-Exploration Science and Technology, Jilin University, Changchun, China
- 2BGP Inc., CNPC, Zhuozhou, China
A rock physics model was established to calculate the P-wave velocity dispersion and attenuation caused by the squirt flow of fluids in gas hydrate-bearing sediments. The critical hydrate saturation parameter was introduced to describe different ways of hydrate concentration, including the mode of pore filling and the co-existence mode of pore filling and particle cementation. Rock physical modeling results indicate that the P-wave velocity is insensitive to the increase in gas hydrate saturation for the mode of pore filling, while it increases rapidly with increasing gas hydrate saturation for the co-existence mode of pore filling and particle cementation. Meanwhile, seismic modeling results show that both the PP and mode-converted PS reflections are insensitive to the gas hydrate saturation that is lower than the critical value, while they tend to change obviously for the hydrate saturation that is higher than the critical value. These can be interpreted that only when gas hydrate begins to be part of solid matrix at high gas hydrate saturation, it represents observable impact on elastic properties of the gas hydrate-bearing sediments. Synthetic seismograms are calculated for a 2D heterogeneous model where the gas hydrate saturation varies vertically and layer thickness of the gas hydrate-bearing sediment varies laterally. Modeling results show that larger thickness of the gas hydrate-bearing layer generally corresponds to stronger reflection amplitudes from the bottom simulating reflector.
Introduction
Elastic behaviors of gas hydrate-bearing sediments can be modeled using various rock physics methods by considering different ways of concentration for the gas hydrate in sediments. Lee et al. (1996) used the weight equation to estimate the amount of gas hydrate from seismic velocities where the gas hydrate exists as pore filling. Based on the modified Biot-Gassmann theory, Lee (2002a; 2002b) calculated the Biot coefficient and predicted elastic velocities for unconsolidated and consolidated sediments with or without gas hydrate concentration using real well data. Helgerud et al. (1999) used the Hertz-Mindlin theory to model the effect of gas hydrate on sediment elastic modulus by considering two scenarios where the hydrate modifies the pore fluid elastic properties without affecting the frame, and the hydrate modifies the elasticity of the frame when it becomes a component of the solid phase. Ecker (2001) considered three modes of aggregation for gas hydrate in reservoirs, including pore filling, particle contact and cementation, and proposed corresponding methods of calculating elastic modulus of the hydrate-bearing sediments for the three cases. Gei and Carcione (2003) proposed a Biot-type three-phase theory that considers the existence of two solids and fluid mixture, and calculate the wave velocities and quality factors of gas hydrate-bearing sediments as a function of pore pressure, temperature, frequency, and partial saturation. Since wave-induced flow of the pore fluid is one major cause of elastic wave attenuation in heterogeneous porous media, Toms et al. (2006) and Muller et al. (2010) reviewed various models that describe different mechanisms of seismic wave attenuation and dispersion resulting from wave-induced flow in porous rocks. Sun et al. (2014) compared P-wave attenuation models of wave-induced flow and pointed out that wave-induced oscillatory fluid flow in the vicinity of inclusions embedded in porous rocks is one of the main causes for P-wave dispersion and attenuation at seismic frequencies. Zhang et al. (2016) employed the BISQ model to analyzed the velocity dispersion and attenuation of the marine unconsolidated hydrate-bearing sediments, and found that the velocity and attenuation increase with the increasing amount of gas hydrate, while porosity and clay content show little impact on the attenuation.
Many efforts had also been made on seismic characterization of gas hydrate-bearing sediments. By using rock-physics-based synthetic seismic models, Ecker et al. (1998) interpreted amplitude variation with offset (AVO) data from a bottom simulating reflector (BSR). They found that only when the hydrate depositing in the pore space is located away from grain contacts and does not affect the stiffness of the sediment frame, the modeling can qualitatively reproduce the observed AVO response. Thus, the sediment above the BSR was inferred as uncemented and mechanically weak. Song (2002) analyzed the AVO characteristics of the BSR and investigated the combined impacts of hydrate saturation and free gas saturation on seismic reflection coefficients. Marc-André et al. (2007) showed the applicability of the nonlinear Bayesian AVO inversion for seismic responses from the BSR to estimate marine gas hydrate and free-gas concentrations. Based on synthetic seismogram modeling of the BSR, Petersen et al. (2007) presented a detailed workflow of using seismic amplitude variation with offset (AVO) to quantify the amount of hydrate and free gas in the sediment, and showed the importance of multi-frequency and shear wave data for determining hydrate reservoir properties. Zhang et al. (2015) conducted AVO inversion of parameter consistency for the BSR in predicting gas hydrate in sediments and obtained the vertical and lateral features as well as saturation of gas hydrate.
In this study, we proposed a rock physical modeling method using poroelastic theories to quantify the P-wave velocity dispersion and attenuation of gas hydrate-bearing formations. The critical gas hydrate saturation parameter was introduced in the model to describe different ways of gas hydrate concentration in sediments. Elastic behaviors and dispersion and attenuation were predicted and analyzed using rock physic modeling. Then, the propagator matrix method was used to model seismic PP and mode-converted PS reflections from the gas hydrate-bearing sediments for varying gas hydrate saturation. Finally, seismic responses are modeled and analyzed for a heterogeneous model of the gas hydrate-bearing sediment where the gas hydrate saturation varies vertically and the layer thickness varies laterally.
Rock Physics Model for Gas Hydrate-Bearing Sediments
Gas Hydrate Concentration and Critical Saturation
The core observations made by Berge et al. (1999) showed that when the gas hydrate saturation exceeds a certain critical value, gas hydrate starts to cement around the sandstone particles. Corresponding laboratory core measurements indicated that when the gas hydrate saturation is greater than a certain critical value (i.e., 0.35), the acoustic velocity of the gas hydrate-bearing sandstone increases significantly with increasing gas hydrate saturation. While for the gas hydrate saturation less than this critical value, the acoustic velocity of the sandstone is not sensitive to changes in the hydrate saturation. The laboratory measurements made by Yun et al. (2005) also show that for high gas hydrate saturation, the shear modulus of the gas hydrate-bearing sandstone increases significantly. Therefore, it is inferred that the variation in the gas hydrate saturation affects depositional modes of the hydrate in sediments, and thus represents significant impact on elastic behaviors of the gas hydrate-bearing rocks.
In this study, we introduced the critical hydrate saturation parameter Sc in the rock physics model to describe various patterns of gas hydrate concentration. Figure 1A shows the case when the gas hydrate saturation S is less than the critical hydrate saturation Sc (S < Sc), where the hydrate exists only as pore filling. Figure 1B shows the case for S ≥ Sc, where the gas hydrate begins to attach to the solid mineral particles, becoming a part of the solid skeleton. At this time, the gas hydrate exists both as pore filling and particle cementation. Priest et al. (2006) showed that when existing as solid skeleton, the gas hydrate will have impact on porosity and permeability and can lead to squirt flow of the pore fluids, which in turn causes P-wave velocity dispersion and attenuation.
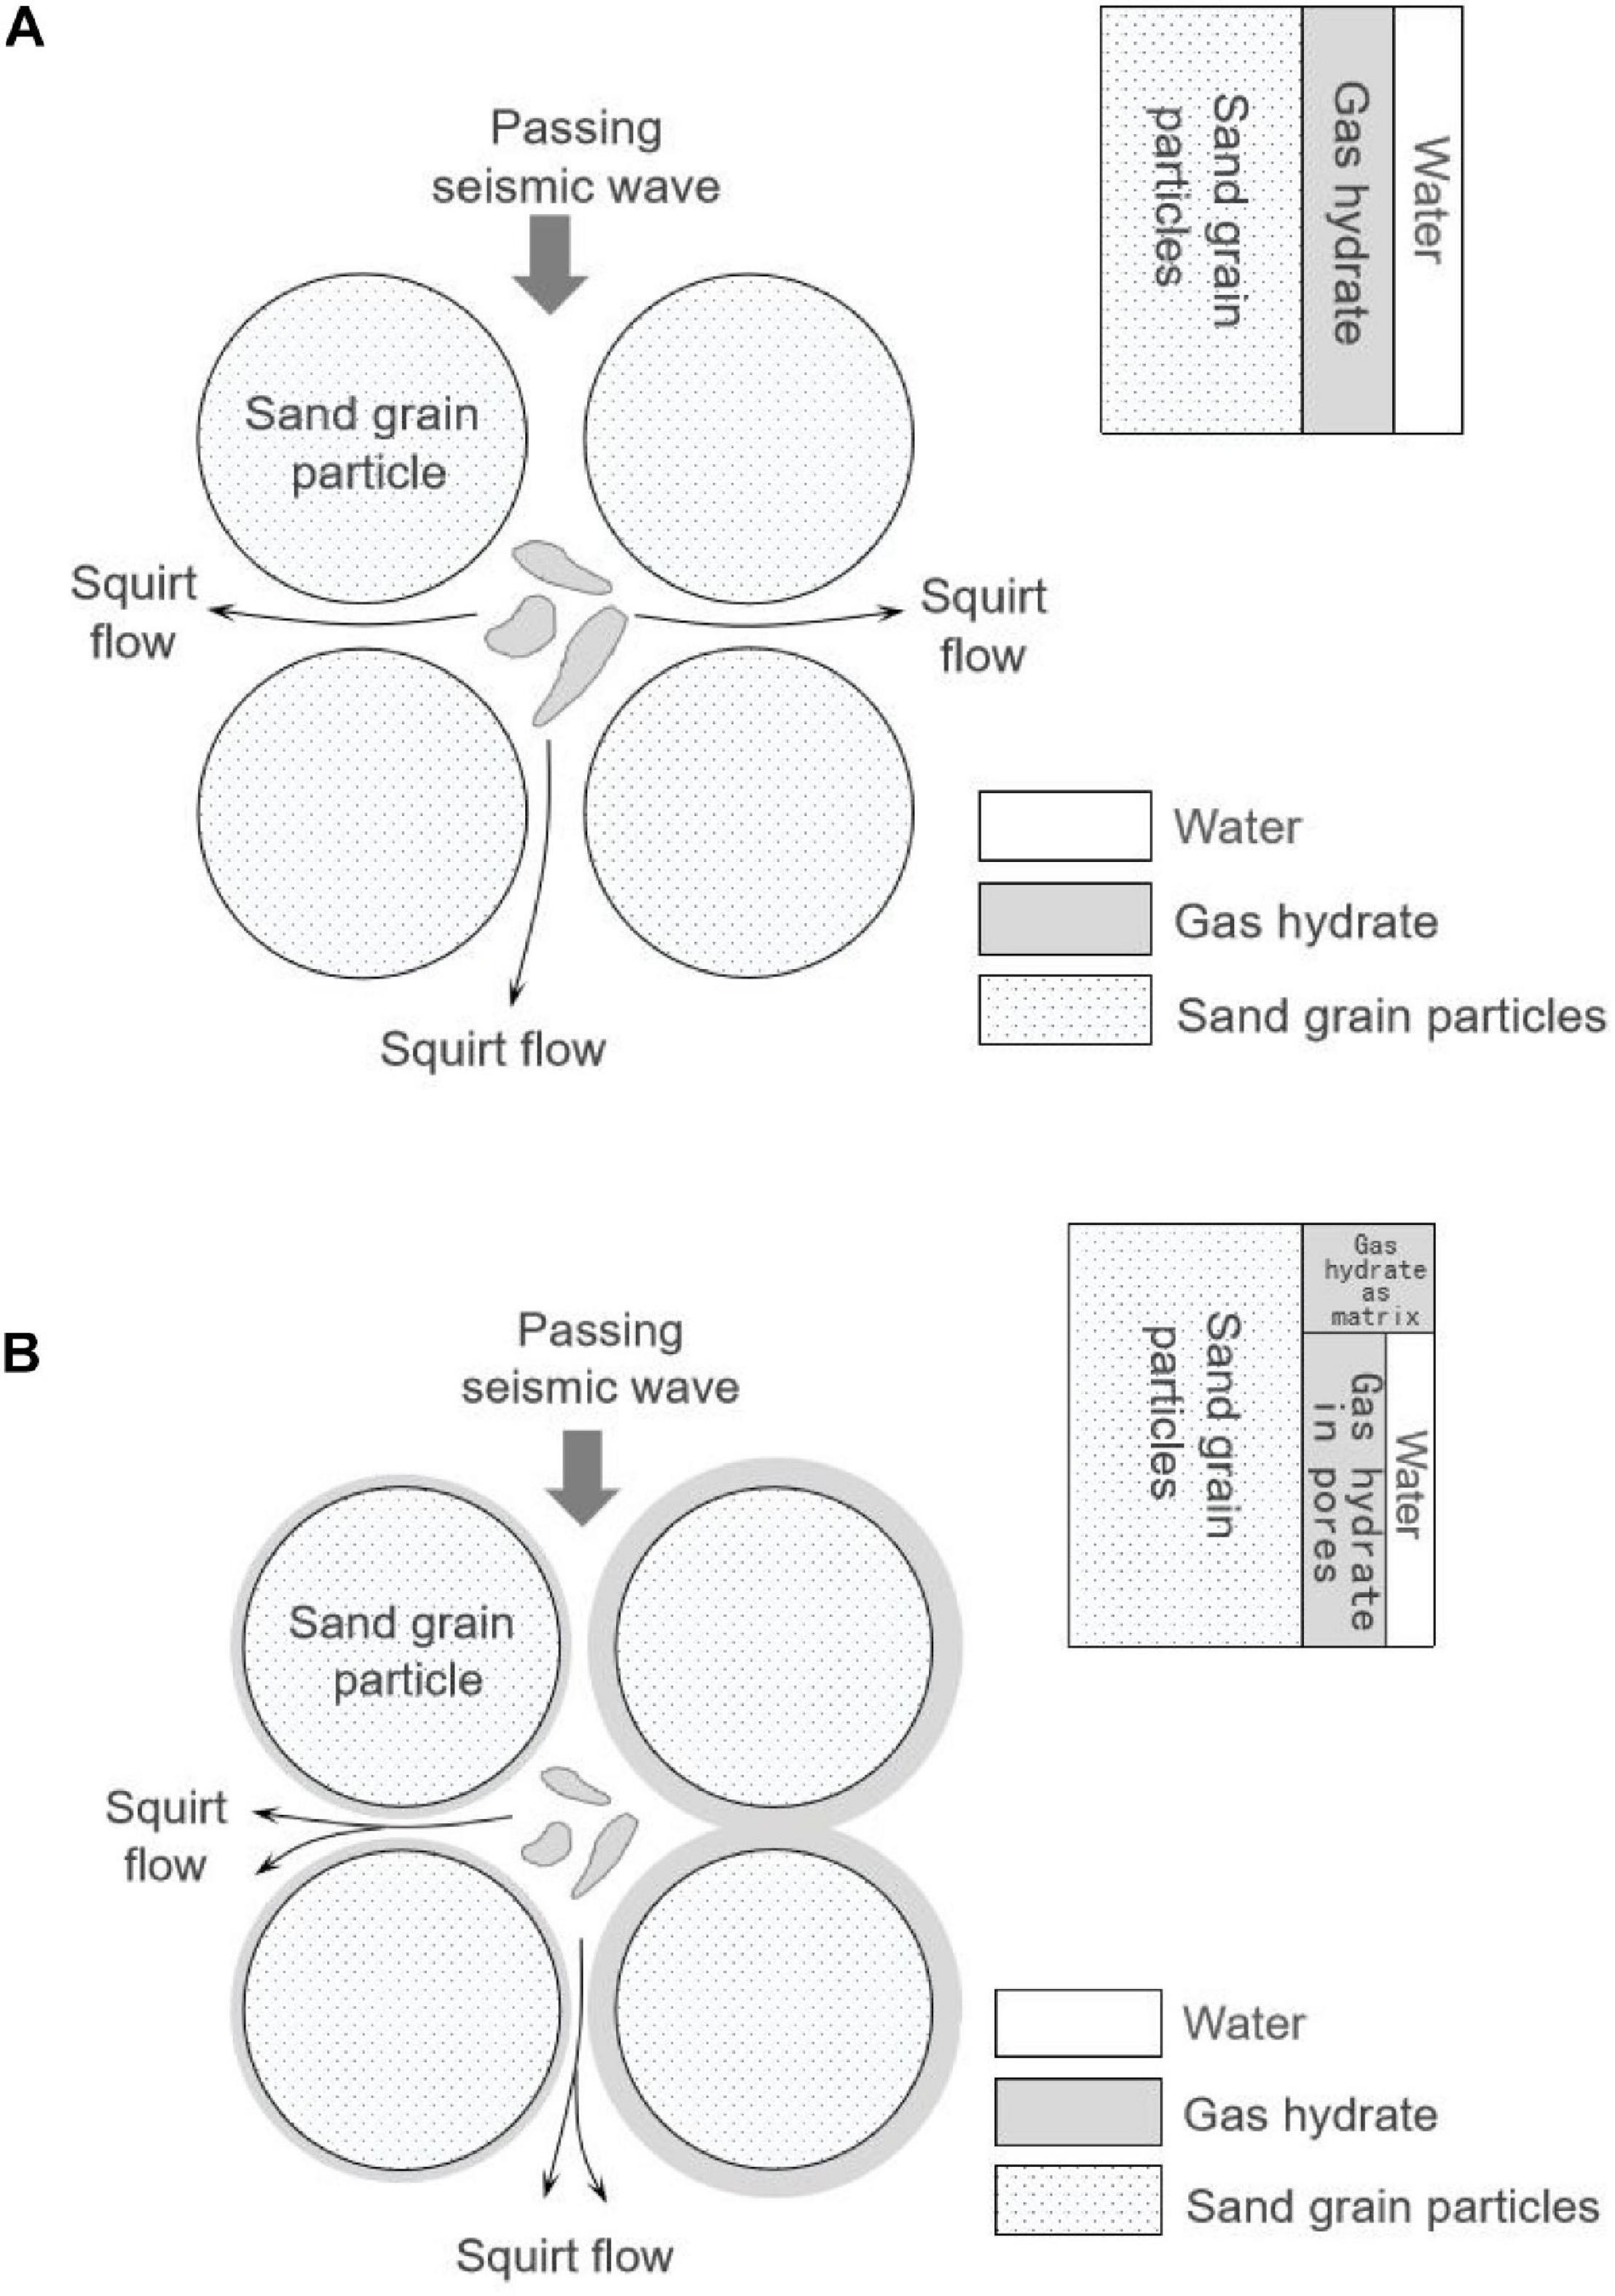
Figure 1. Schematics of the gas hydrate concentration in different ways. (A) Pore filling and (B) the co-existence of pore filling and particle cementation.
Rock Physic Model for Gas Hydrate-Bearing Sediments
Figure 2 shows the rock physical modeling workflow corresponding to Figure 1. The critical gas hydrate saturation parameter Sc was introduced into the modeling process in order to describe different concentration patterns of hydrate depositing in sediments. When S < Sc, the gas hydrates only exist as pore filling that is mixed with brine. Wood’s theory (Wood, 1955) is used to calculate the properties of the fluid mixture. When S ≥ Sc, the gas hydrate saturation of the fluid mixture remains unchanged, and the gas hydrate begins to attach to the mineral particles. At this time, the concentration mode of the gas hydrate represents as the co-existence of pore filling and cementation. The elastic properties of the solid matrix are calculated using the Hill average theory (Hill, 1952) and the elastic modulus of the hydrate-bearing rock skeleton are calculated using the Krief’s theory (Krief et al., 1990). Finally, frequency-dependent P-wave velocity Vp and the attenuation factor 1/Qp caused by the squirt flow of pore fluids in the gas hydrate-bearing sandstone are calculated by the BISQ theory.
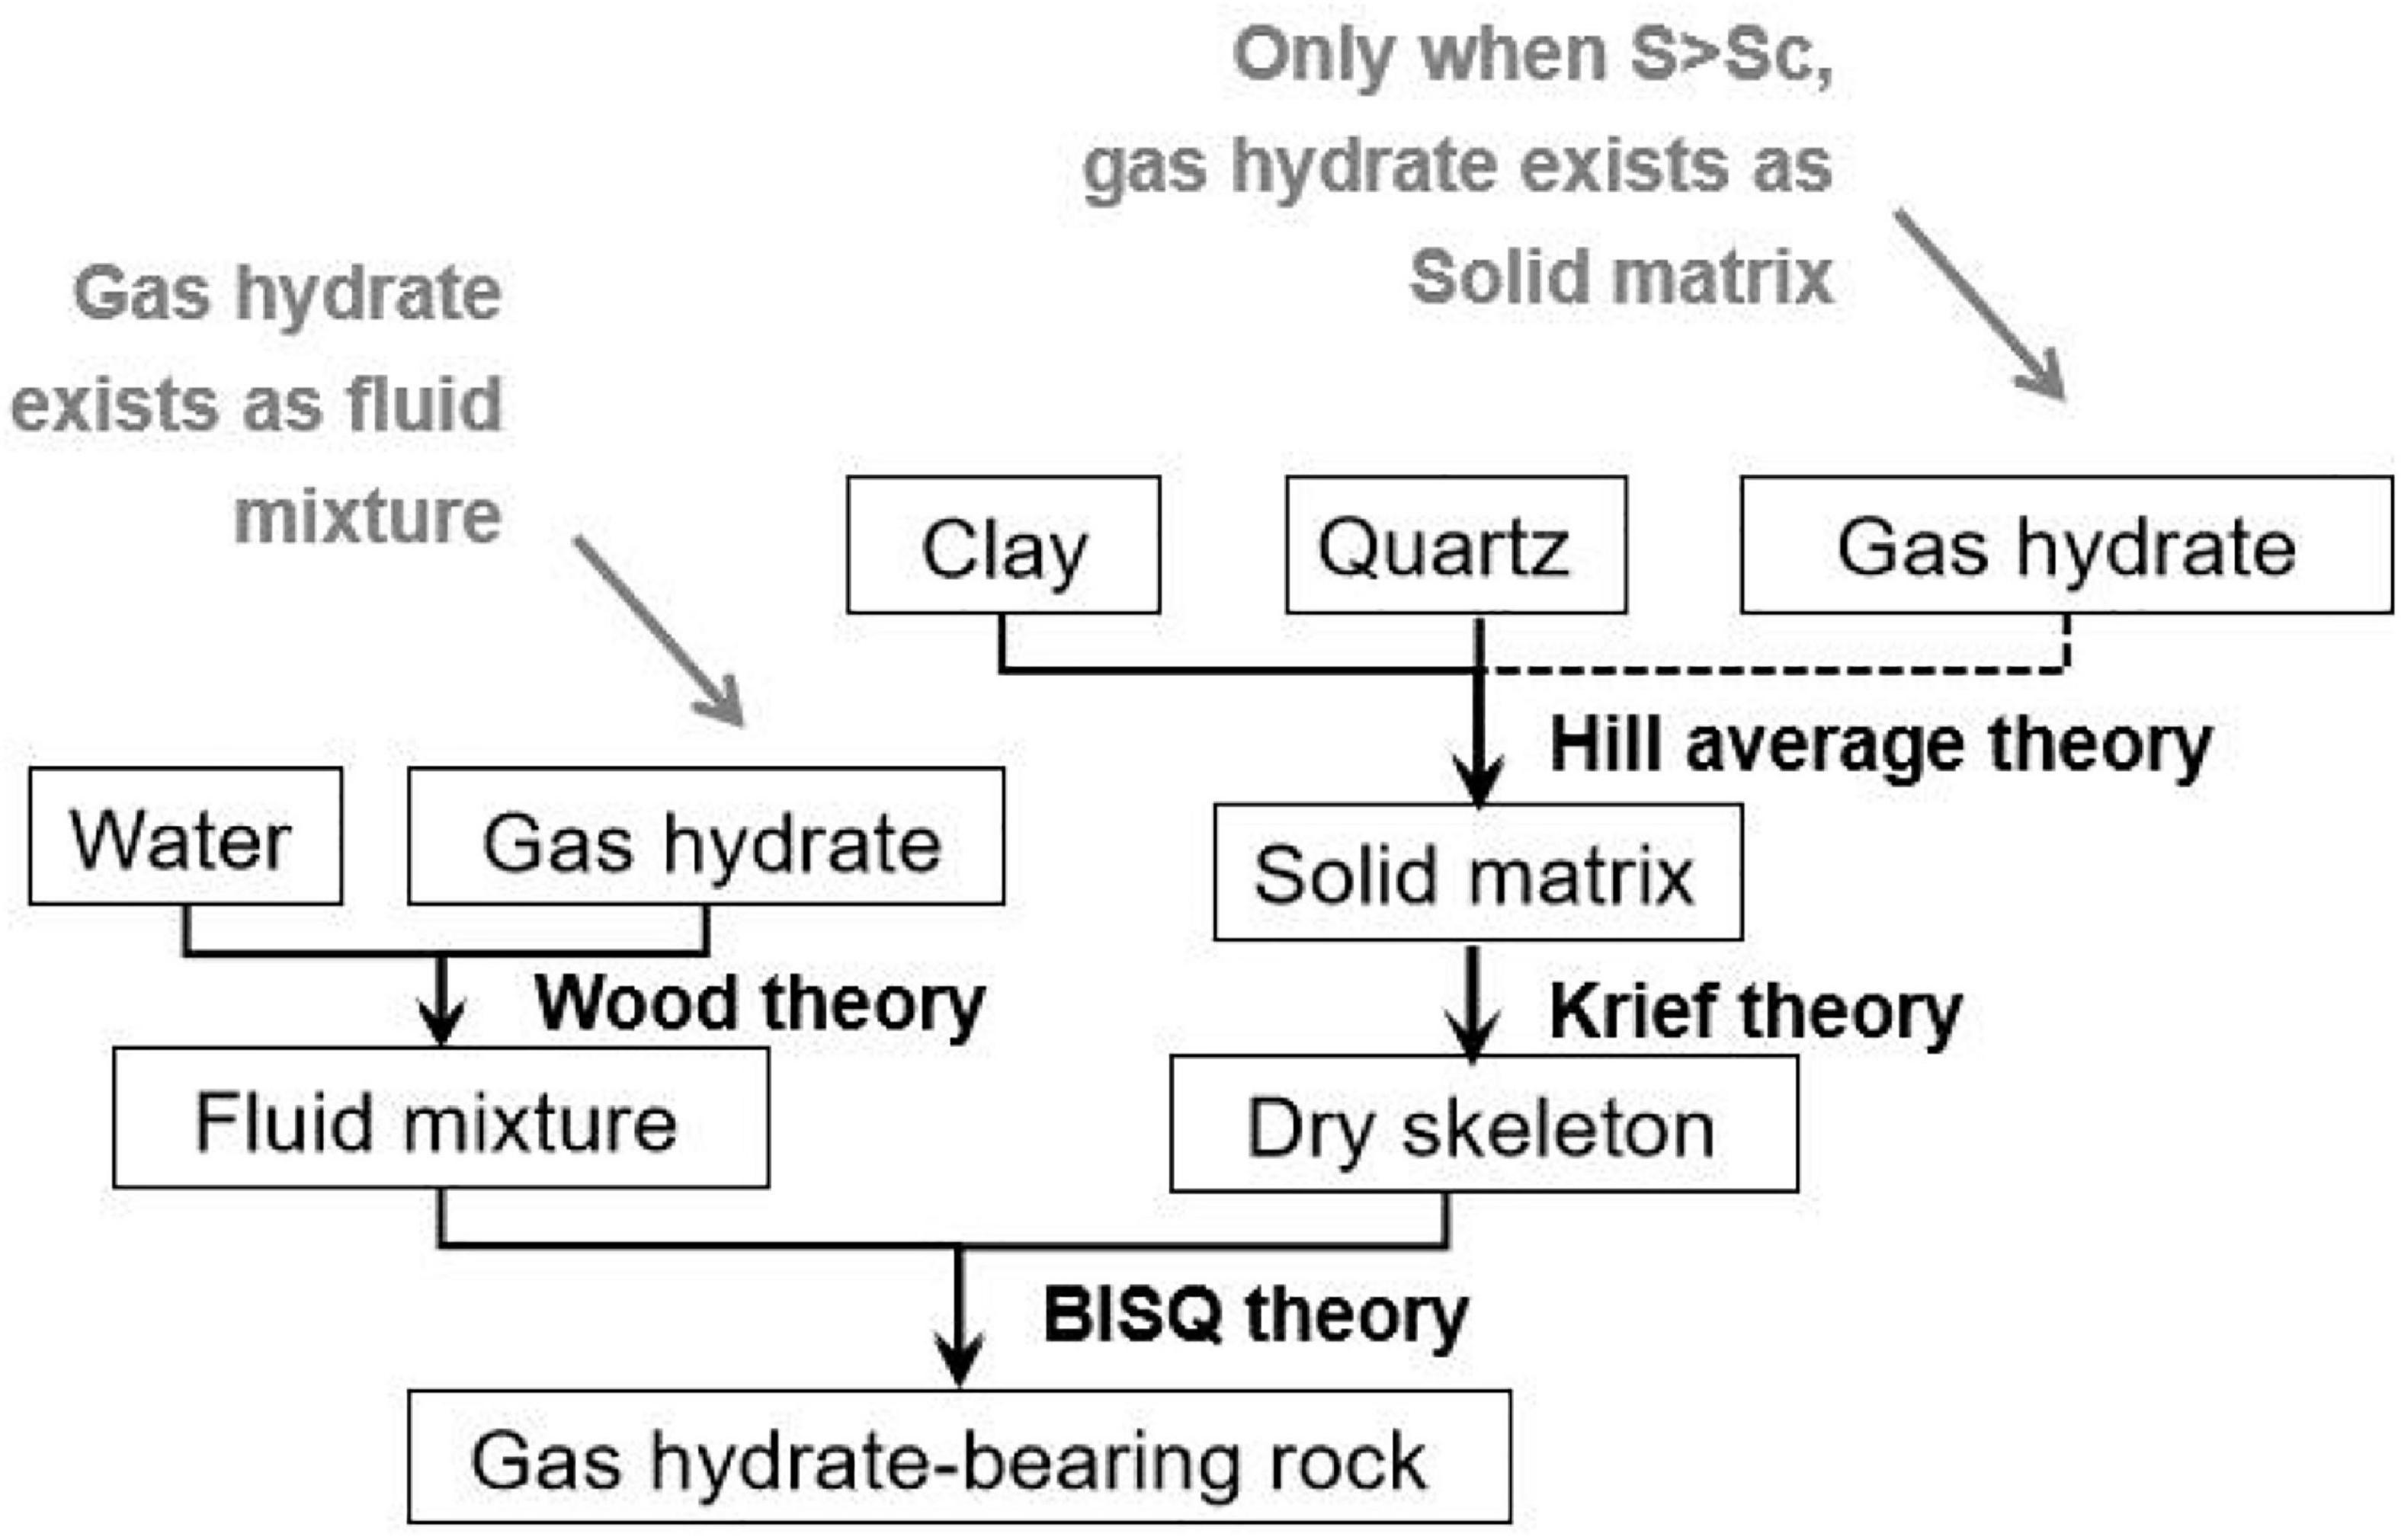
Figure 2. Workflow of the rock physics modeling for a gas hydrate-bearing rock.
Rock Physics Theories
Based on the research of Qadrouh et al. (2015), elastic modulus of the solid skeleton of the gas hydrate-bearing sediments are calculated by the Krief model (Krief et al., 1990), where the bulk modulus Kdry and shear modulus Gdry of the solid skeleton are expressed as follows:
where the empirical parameter A is set to 3 to describe the case of unconsolidated sediment; φ is the porosity; Gs and Ks are the bulk modulus and shear modulus of the rock matrix, which are calculated using the Hill average theory (Hill, 1952):
where m is the number of solid components; fi is the volume fraction of the i-th component; and Ki and Gi are the bulk modulus and shear modulus of the i-th component. In addition, the density of the solid matrix is calculated by averaging volume density of each individual component.
The bulk moduli of the fluid mixture composed of gas hydrate and brine is calculated using the Wood’s theory (Wood, 1955):
where Kh is the bulk modulus of hydrate; Kw is the bulk modulus of brine; S1 is the saturation of hydrate as pore filling. When the hydrate represents both as the pore filling and particle cementation, S1 = Sc.
For the pore filling mode, the gas hydrate saturation only affects elastic properties of the fluid mixture. For the model of hydrate co-existing as pore filling and particle cementation, the hydrate that is attached to solid particles reduces the porosity and permeability of the rock skeleton, and thus has the impact on squirt flow of pore fluids. The BISQ theory proposed by Dvorkin and Nur (1993) is used to calculate the velocity dispersion and attenuation of the gas hydrate-bearing reservoir. P-wave velocity Vp, attenuation coefficient α, and inverse quality factor Q−1 are expressed as follows:
where
and
where Kdry and Gdry are the bulk and shear moduli of dry rock; φ is the porosity; ρs and ρf are the densities of the solid and fluid phases, respectively; ρa is the additional density of the inertial coupling between the solid and fluid phases; R is the squirt flow length; K is the bulk modulus of the solid phase; Kf is the bulk modulus of the fluid phase; η is the viscosity of the fluid; k is the permeability.
In rock physics modeling, it is considered that for the co-existence mode of hydrate both as pore filling and particle cementation, the cementation reduces the porosity of the formation by φ = φ0[1−(S−Sc)], where S is the total saturation of the gas hydrate in the sandstone, and φ0 is the porosity of the gas hydrate-bearing sandstone when the hydrate has not attached to the solid minerals yet. According to the Kozeny–Carman theory used by Santos et al. (1992), the permeability k of the gas hydrate formation varies with porosity φ and φ0:
Rock Physical Modeling
Based on the rock physics model in Figures 2, 3 show the calculated P-wave velocity Vp and attenuation factor 1/Qp vary with gas hydrate saturation and frequency. Properties used for rock physical modeling are given in Tables 1, 2. The volume contents of quartz and clay were assumed to be 0.8 and 0.2, respectively.
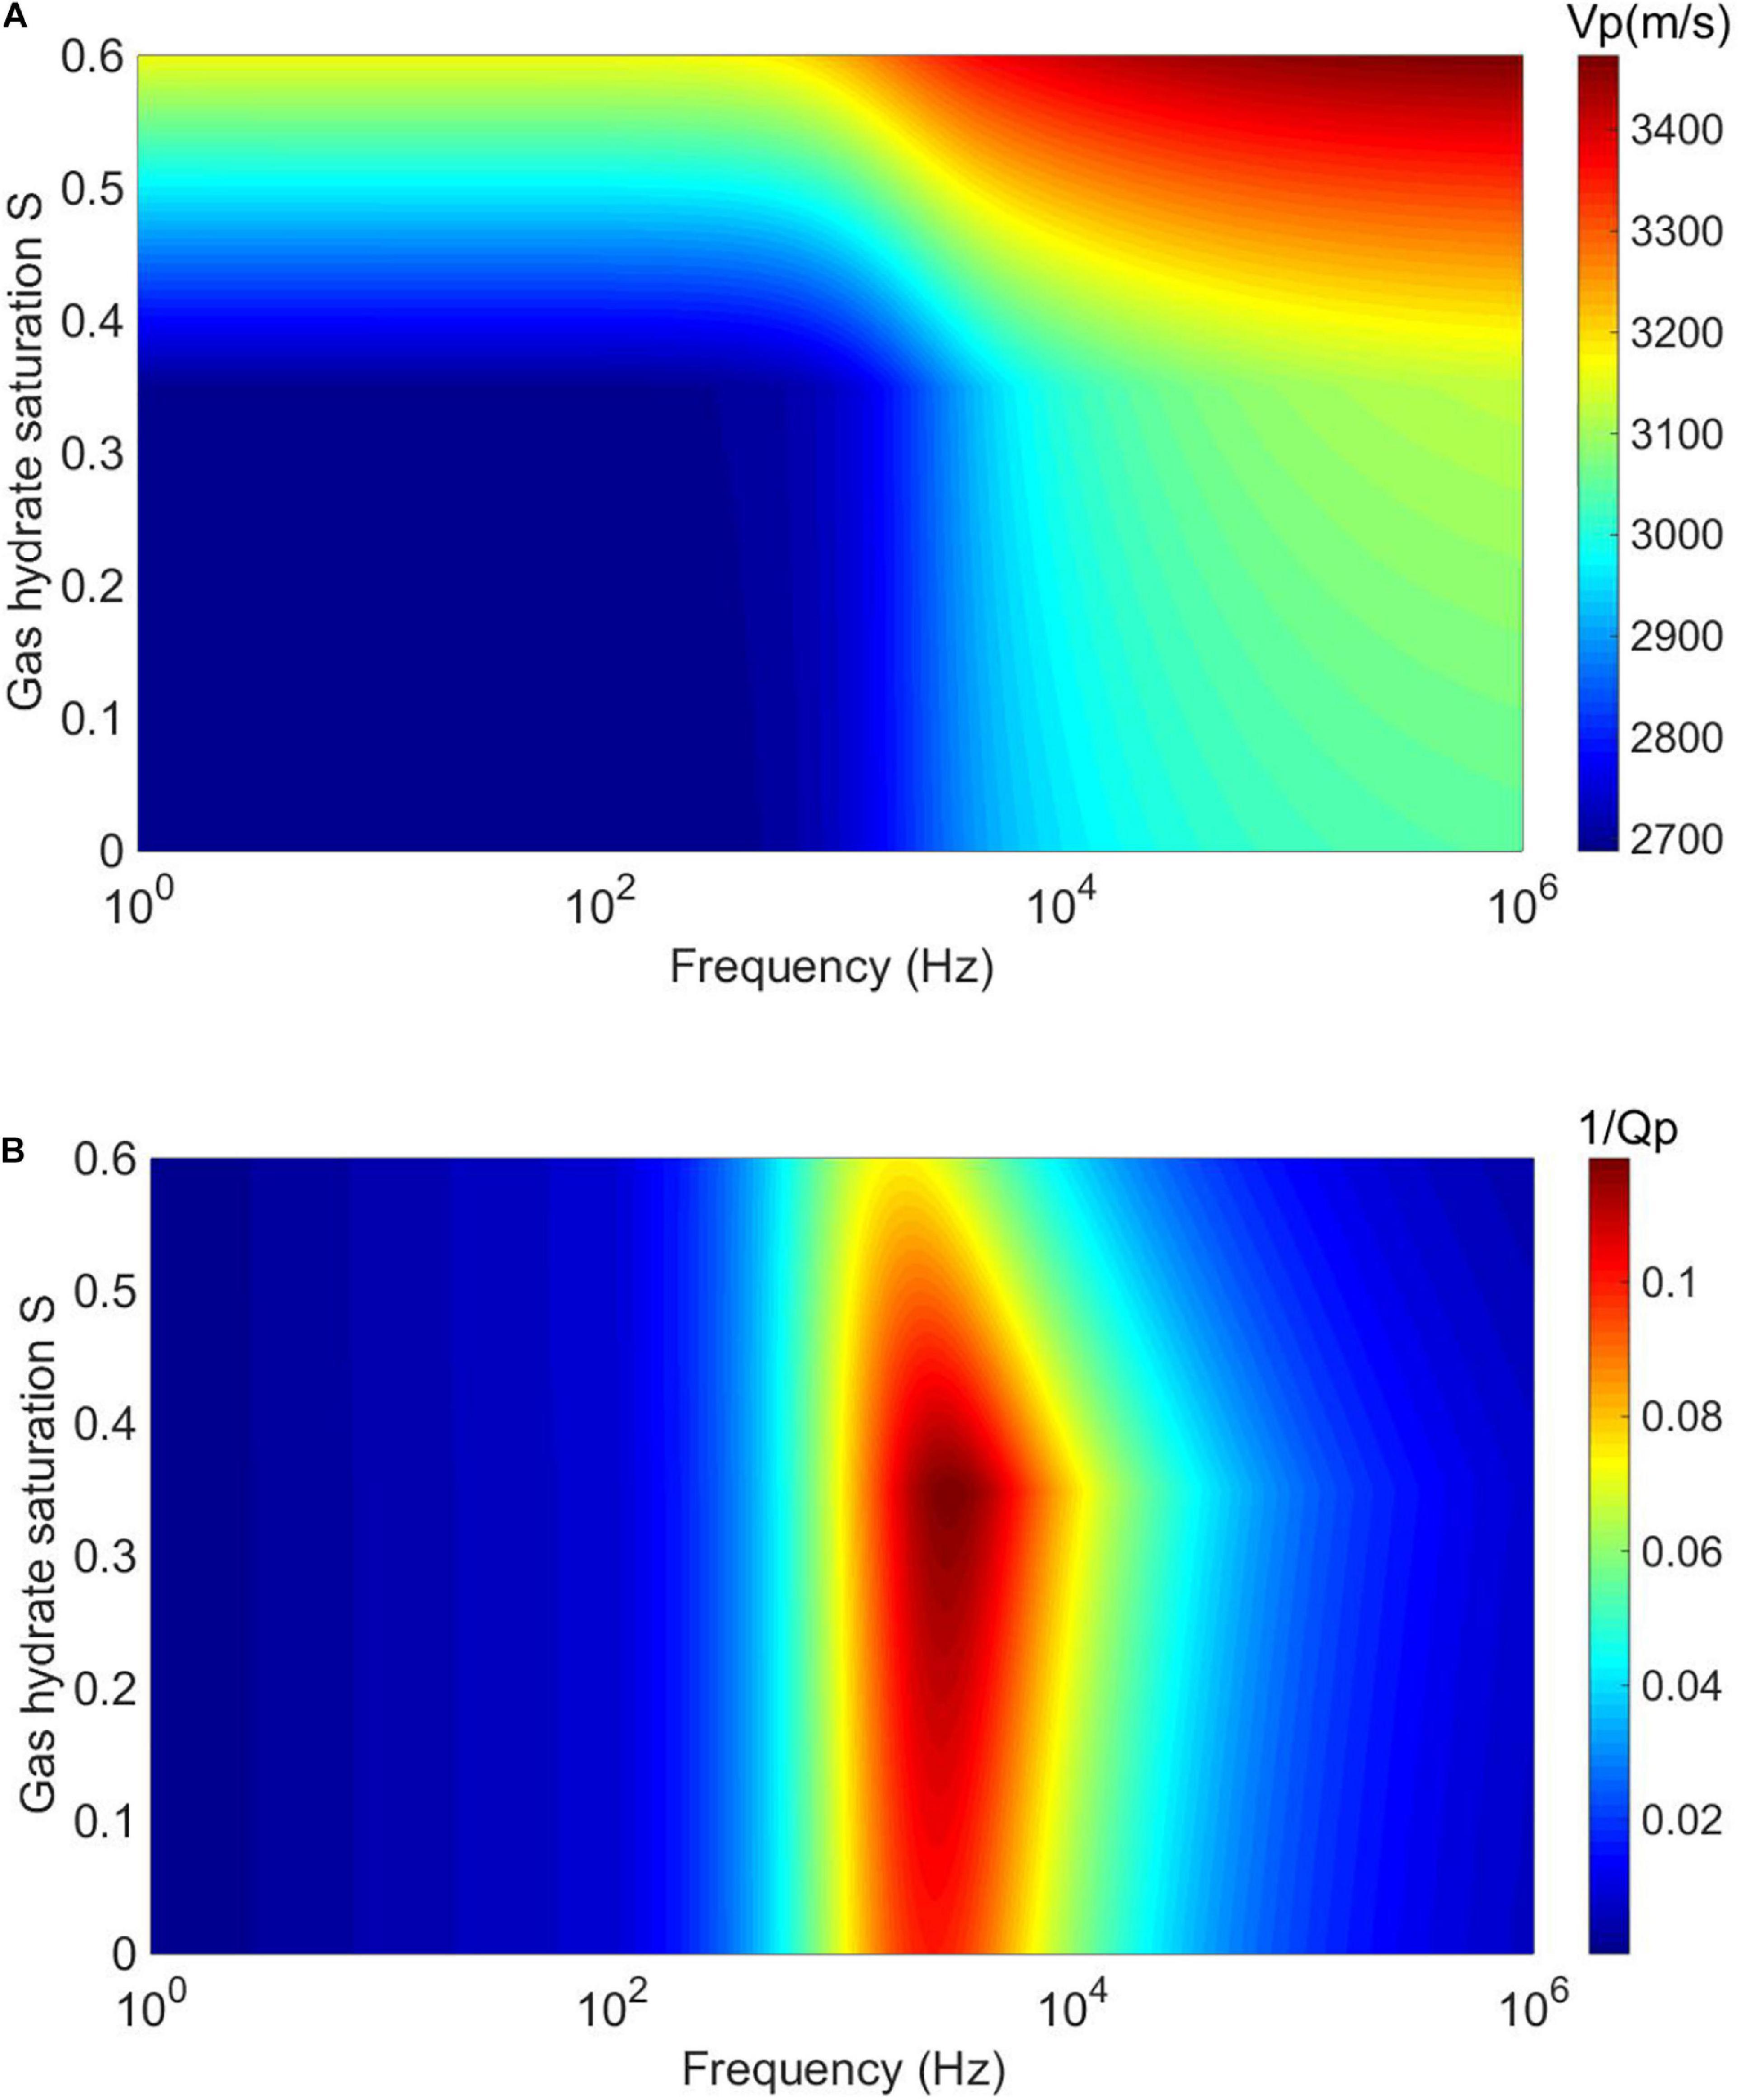
Figure 3. (A) P-wave velocity Vp and (B) attenuation factor 1/Qp vary with gas hydrate saturation and frequency.
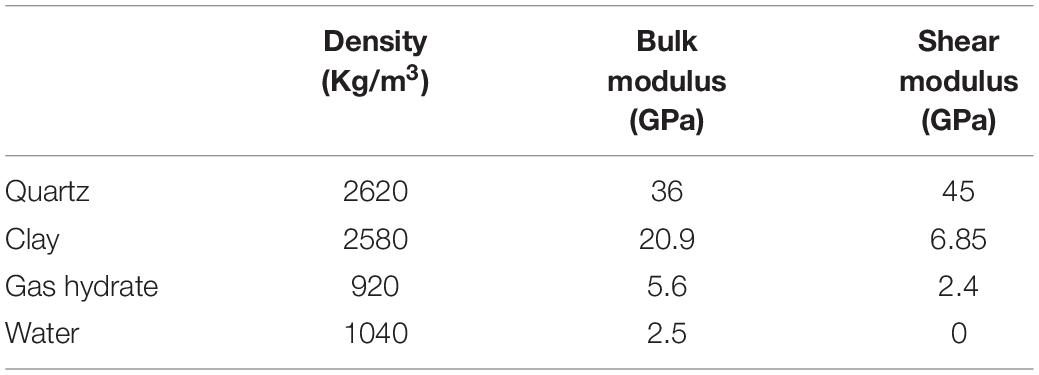
Table 1. Properties used in rock physical modeling.
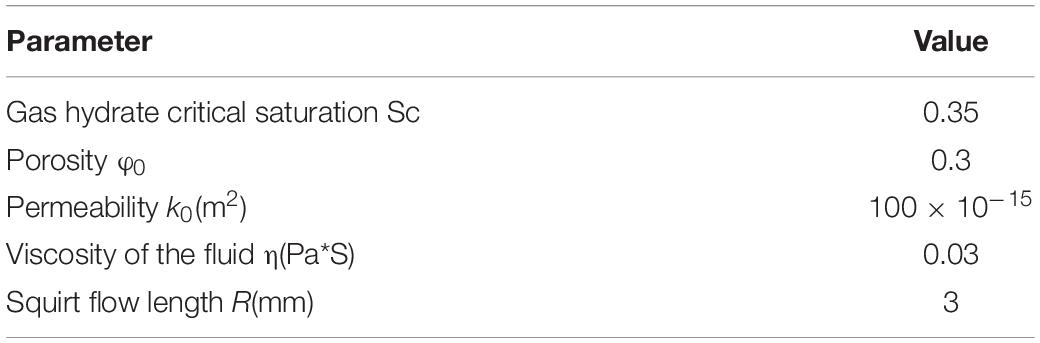
Table 2. Parameters used in the BISQ theory.
As shown in Figure 3, the Vp increases with increasing gas hydrate saturation at all frequencies. However, as the concentration pattern of the hydrate changes (below and above Sc = 0.35), the P-wave velocity Vp dispersion and the attenuation factor 1/Qp vary correspondingly.
Figure 4 shows the dispersion curves of P-wave velocity Vp under different gas hydrate saturations that are extracted from Figure 3A. For the cases of gas hydrate saturations S of 0 and 0.2, that is, less than the assumed critical saturation Sc = 0.35, when the frequency is less than about 103 Hz, the Vp is not sensitive to the existence of the gas hydrate that exists as pore filling. When the frequency is higher than about 103 Hz, the Vp increases with increasing gas hydrate saturation. For the cases of gas hydrate saturations S of 0.5 and 0.6, that is, greater than critical saturation Sc = 0.35, the Vp significantly increases with increasing gas hydrate saturation.
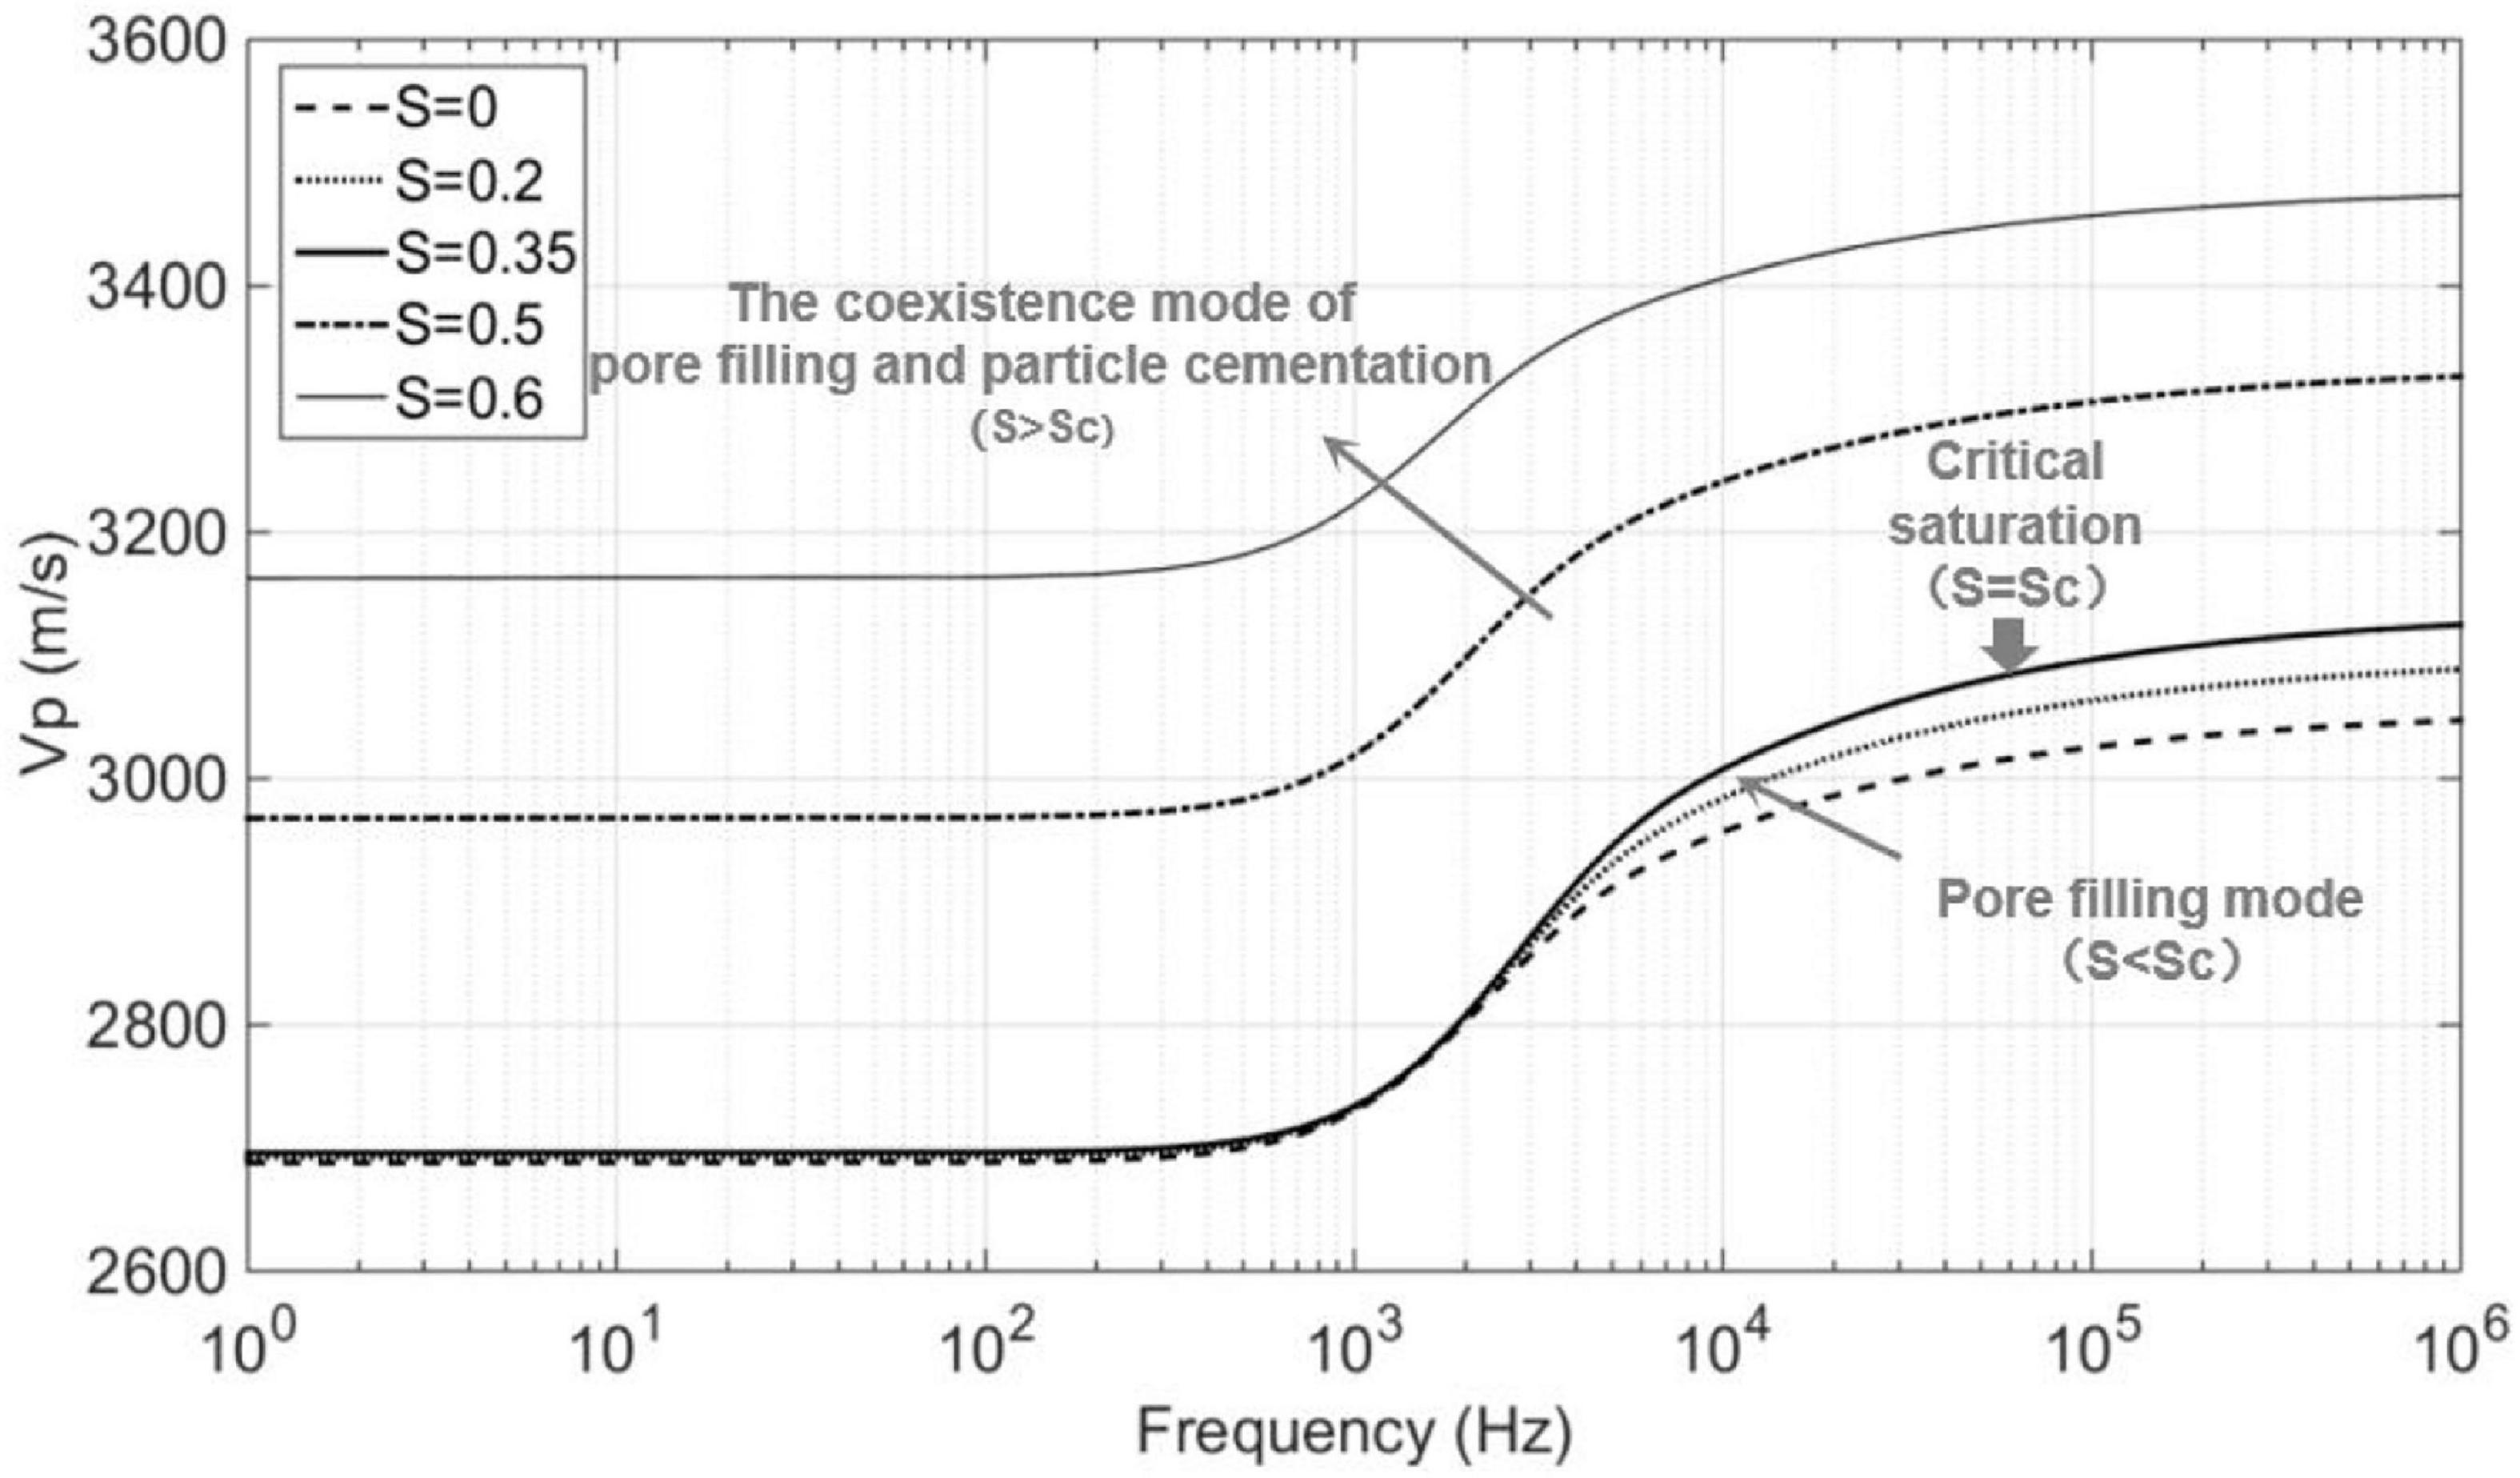
Figure 4. The P-wave velocity Vp dispersion of various gas hydrate saturations.
According to Figure 3A, the variation in Vp with gas hydrate saturation S at different frequencies is extracted and shown in Figure 5. At the laboratory ultrasonic frequencies, the Vp is higher than those at low frequencies. Meanwhile, there are two trends of Vp with increasing S. For the pore filling mode (S < Sc), the Vp is not sensitive to the change in S; and for the co-existence mode of pore filling and particle cementation (S ≥ Sc), the Vp increases significantly with increasing S.
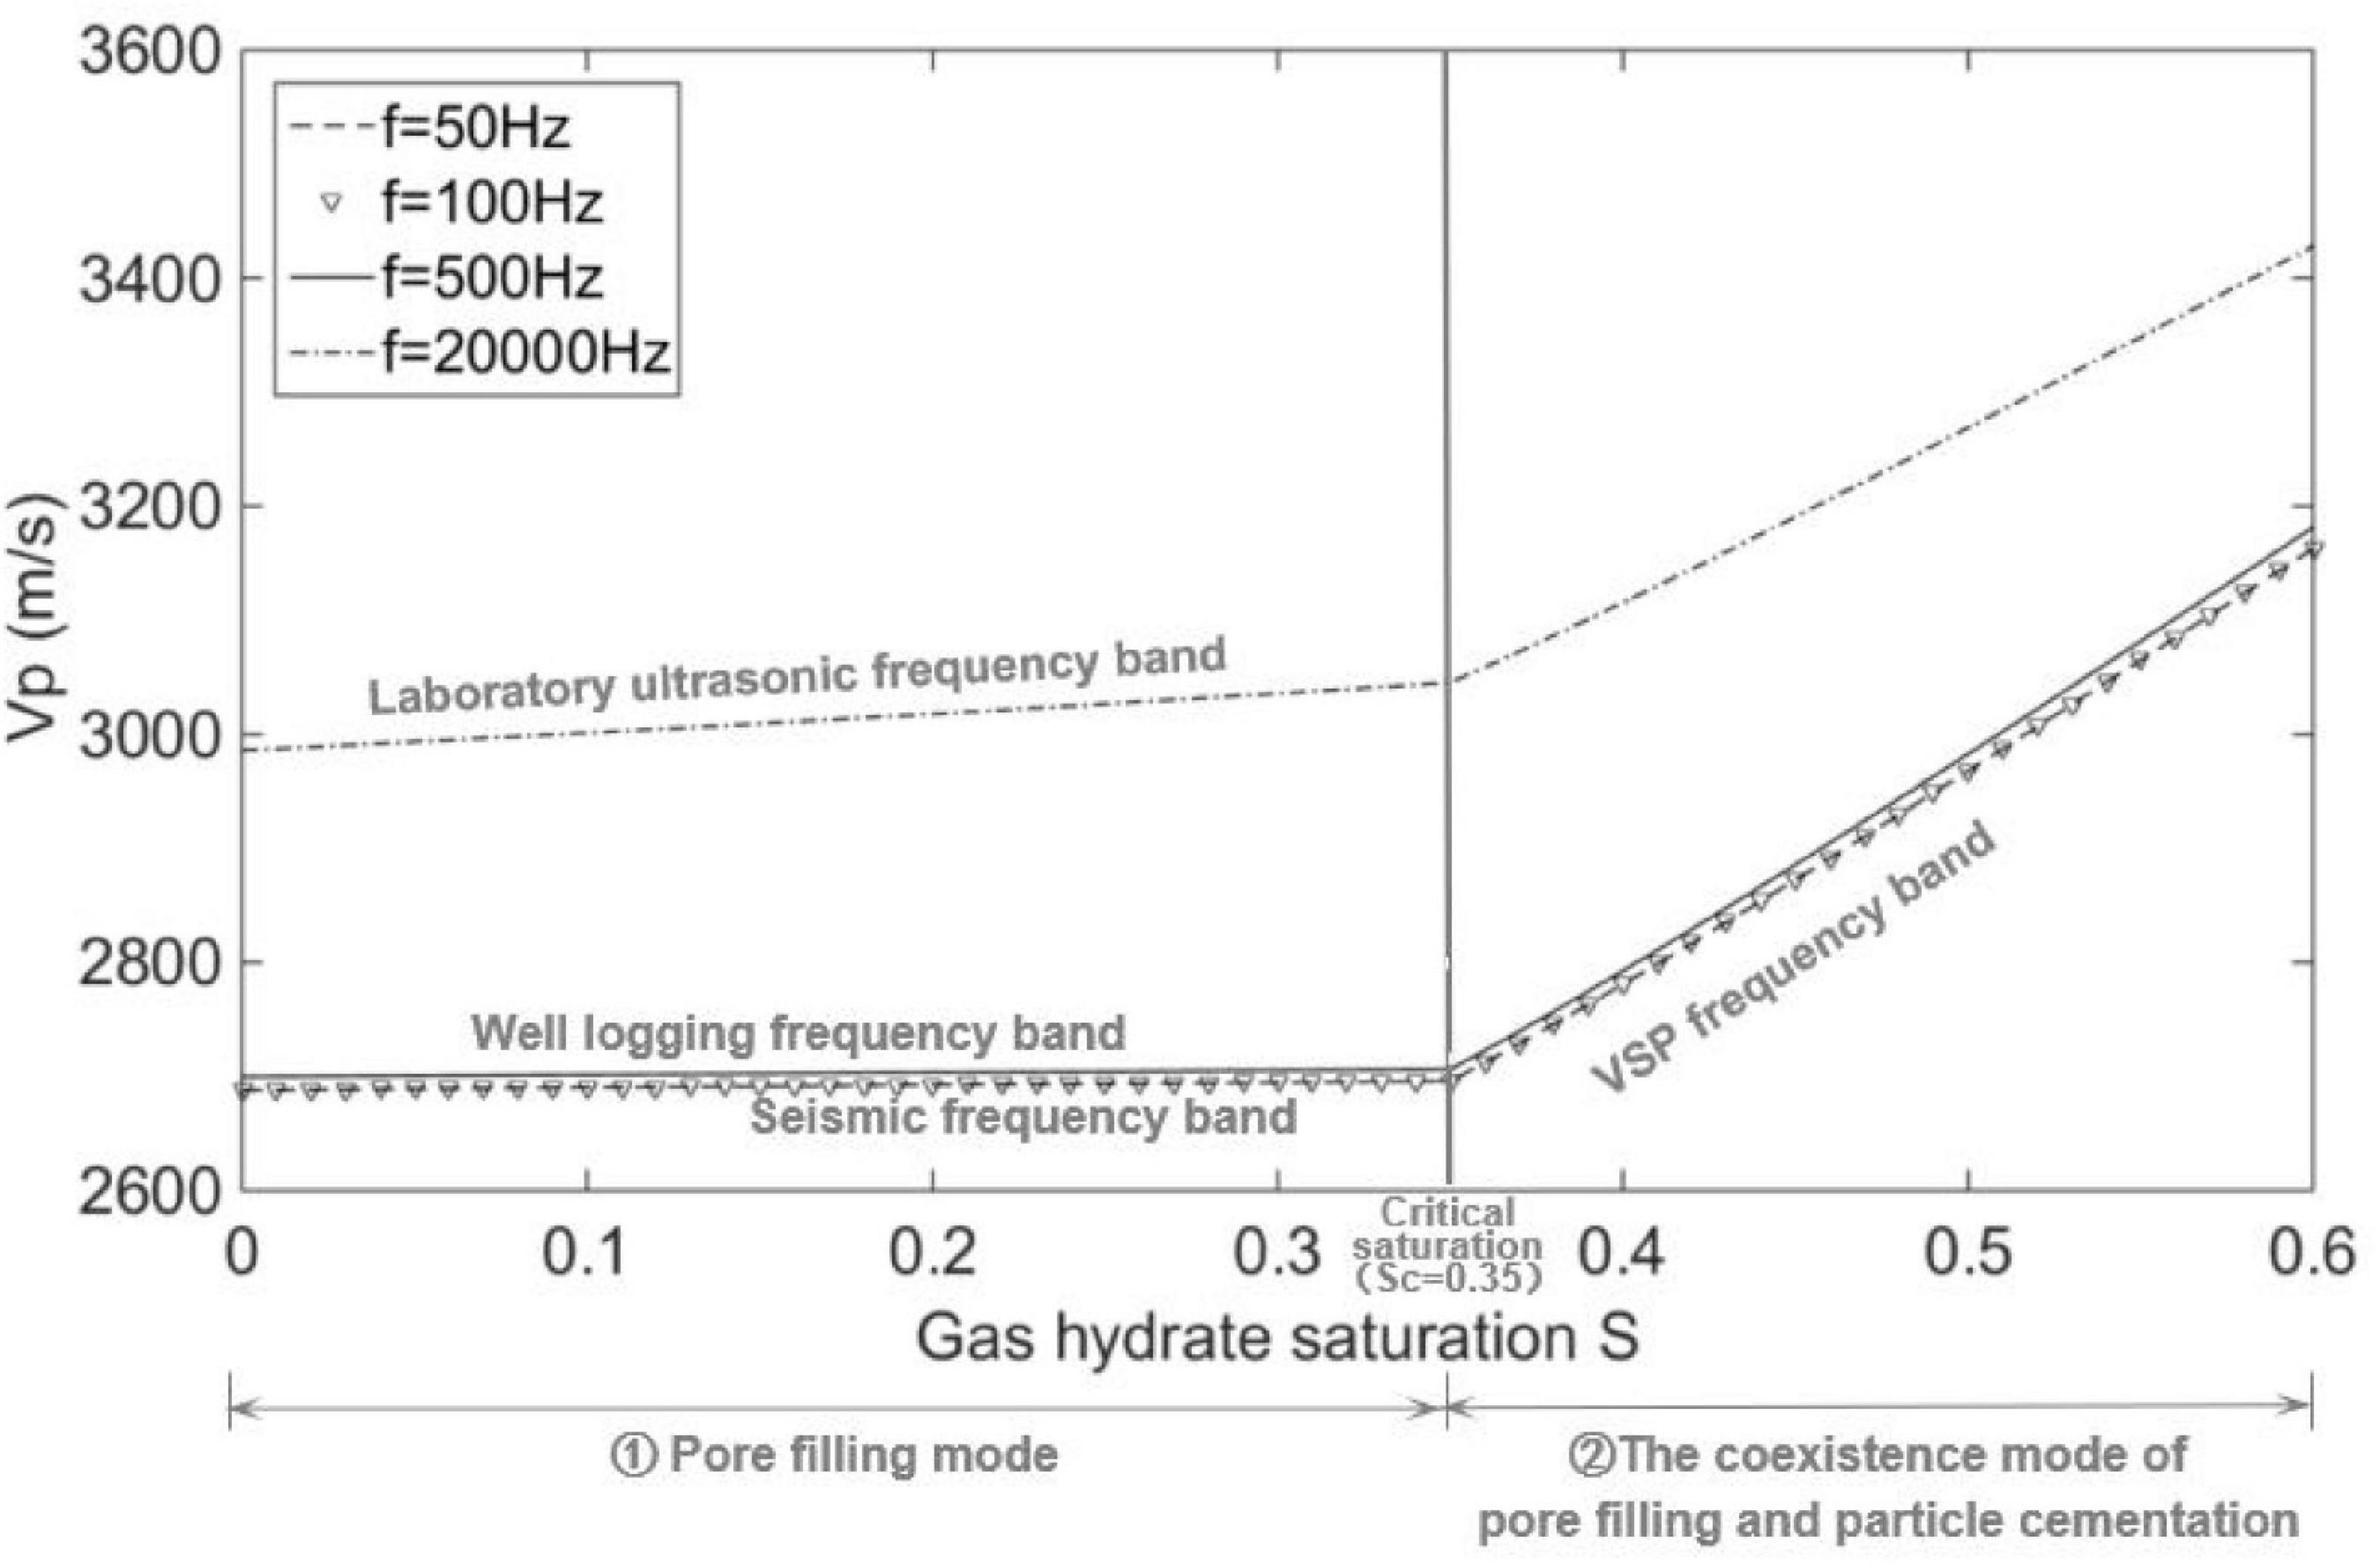
Figure 5. Variations of the P-wave velocity Vp with gas hydrate saturation S for different frequencies.
It reveals that when the gas hydrate exists as a mixture of pore fluids, it has a weak impact on elastic properties of the rock. Only when the gas hydrate exists as a part of the solid matrix, will it have a significant impact on the elastic properties of the rock. Moreover, for the same gas hydrate saturation, the P-wave velocity at high frequency (such as ultrasonic waves) is higher than that at low frequency. According to Toms et al. (2006) and Muller et al. (2010), the pore fluid pressure may be higher at high frequency compared with that at low frequency, and the unrelaxed state of pore fluid causes the high velocity at high frequency.
In addition, Dvorkin and Nur (1993) and Dvorkin et al. (1994) showed that the frequency at which the velocity dispersion and attenuation occurs can be affected by the viscosity of the fluids involved in the fluid squirt flow. Therefore, the viscosity coefficient of the mixture of gas hydrate and water may play as an important role in determining poroelastic behaviors of gas hydrate-bearing sediments. However, due to the lack of laboratory data, it is difficult to determine the viscosity coefficient of the mixture of gas hydrate and brine. Thus, we assume a set of values for the viscosity coefficient (e.g., 0.002, 0.01, 0.03, and 0.1) in order to investigate its influences on P-wave velocity dispersion and attenuation. As shown in Figure 6A, for increasing viscosity coefficient, the frequency where the P-wave velocity dispersion occurs tends to move to the low frequency, and the attenuation peak moves to the low frequency correspondingly as shown in Figure 6B.
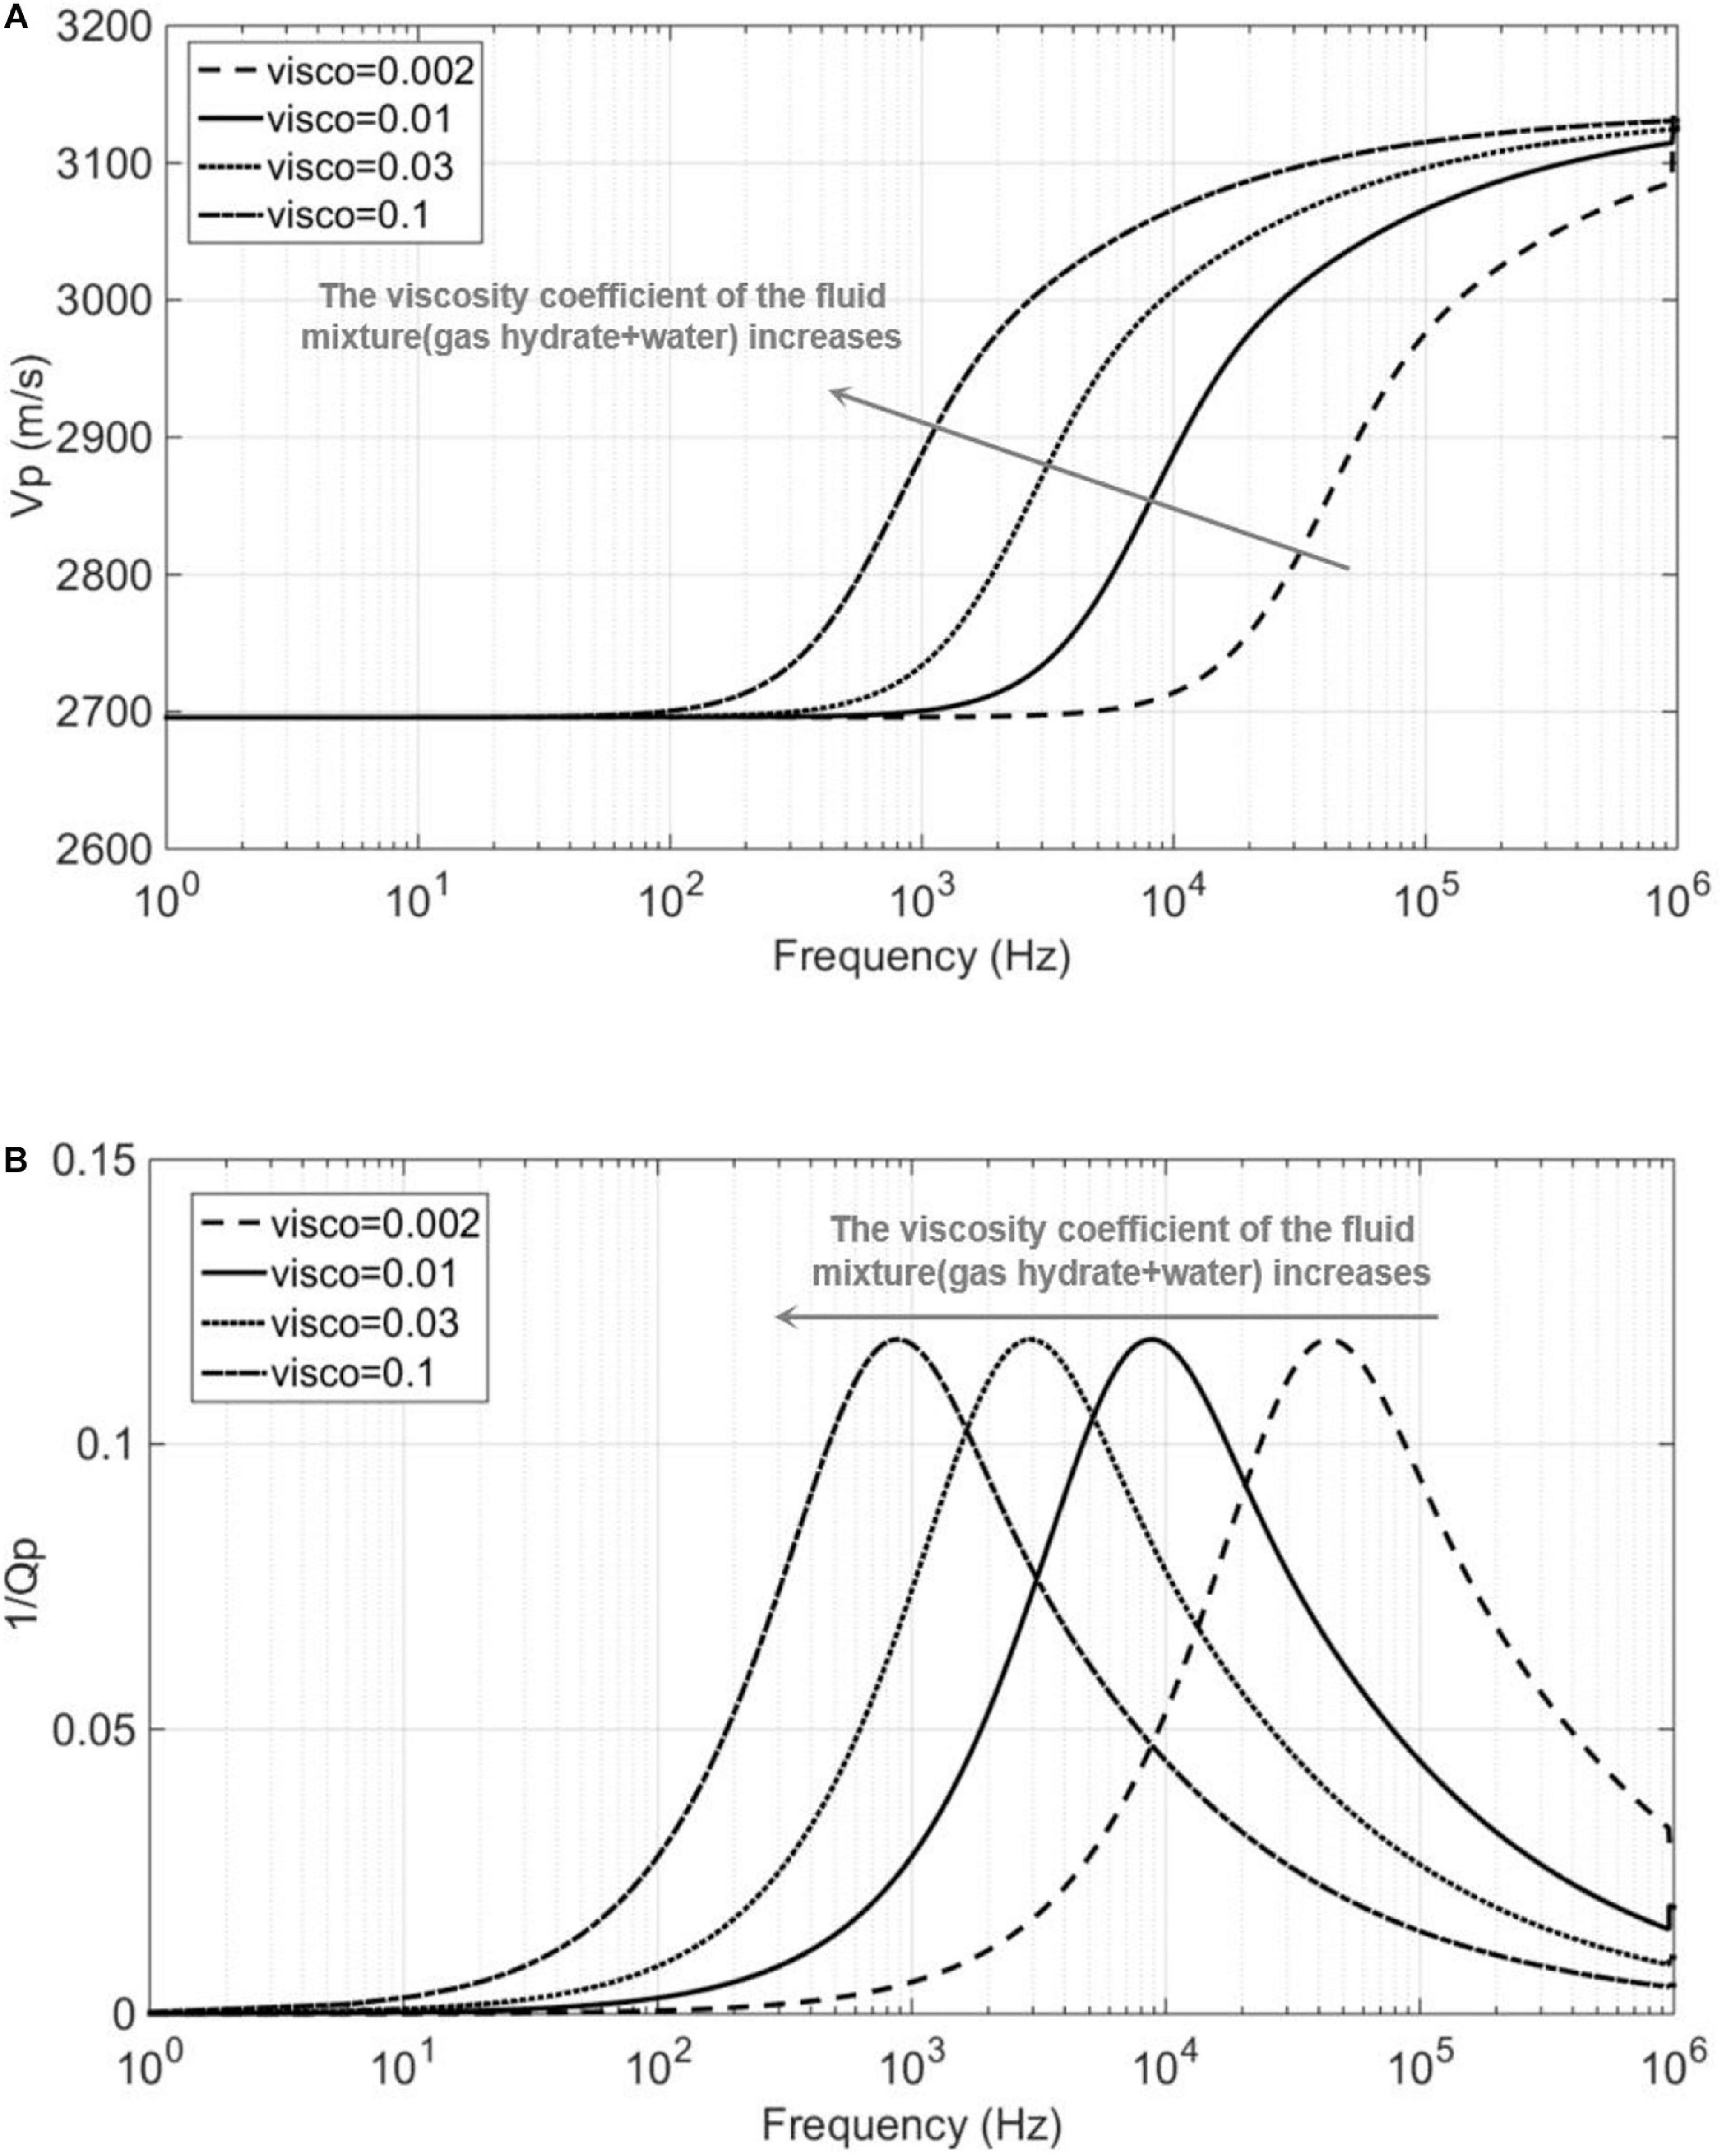
Figure 6. (A) P-wave velocity Vp dispersion and (B) attenuation factor 1/Qp for various viscosity coefficients of the fluid mixture.
Seismic Response of Gas Hydrate-Bearing Sediments
Geological Model
Figure 7 shows a geological model of a gas hydrate-bearing layer, which overlies above a layer containing free gas, and is overlaid by a brine-saturated layer. The P-wave velocity dispersion and attenuation of the gas hydrate-bearing layer are shown in Figure 3.
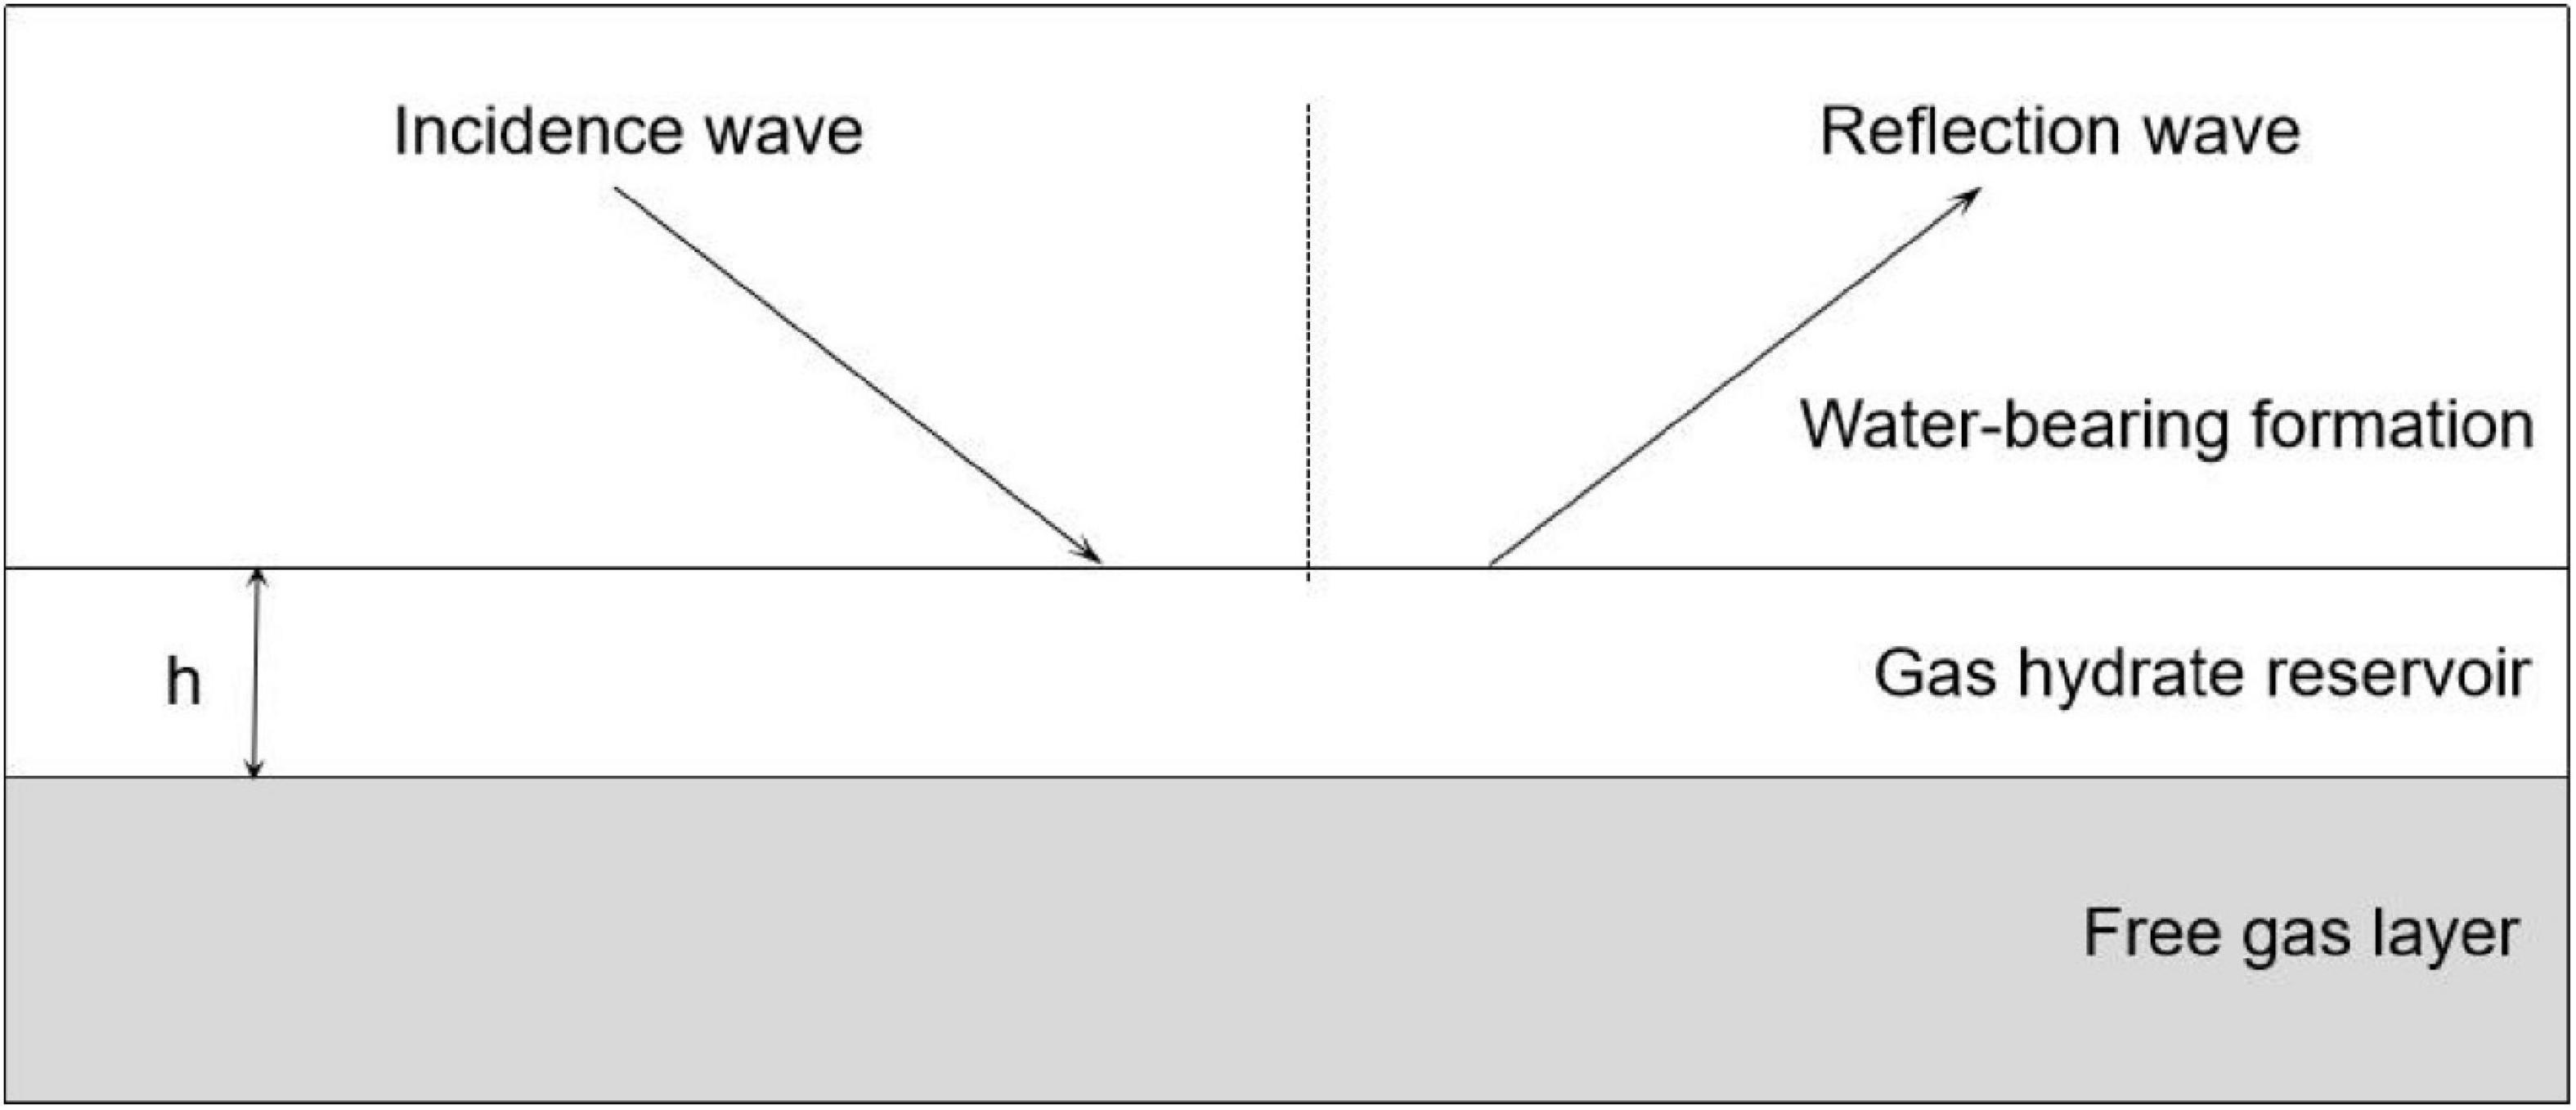
Figure 7. Geological models of a gas hydrate-bearing sediment.
The P-wave velocity of the brine-bearing formation was 2628 m/s, and the density was 2140 kg/m3. The velocity dispersion and attenuation of the free gas layer are calculated using the patchy saturation theory (White, 1975), where the bulk modulus and shear modulus of the rock matrix are calculated using the Hill average theory (Hill, 1952). Properties used in modeling are shown in Table 1. The elastic modulus of the solid skeleton are calculated using the Krief model (Krief et al., 1990). Porosity and permeability are given in Table 2. Fluid properties used in the model are given in Table 3. Calculation results of the P-wave velocity dispersion and attenuation of the free gas layer are shown in Figure 8.
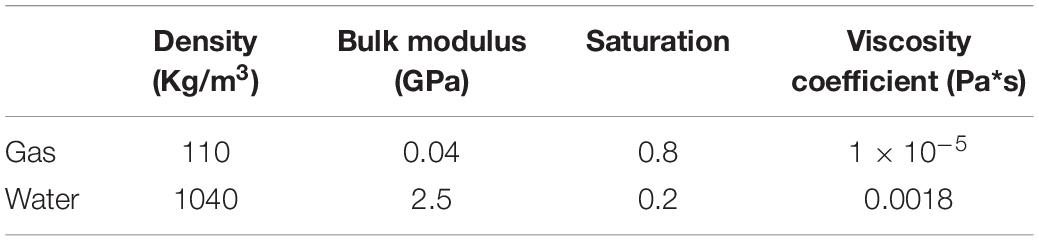
Table 3. Parameters used in the patchy saturation model.
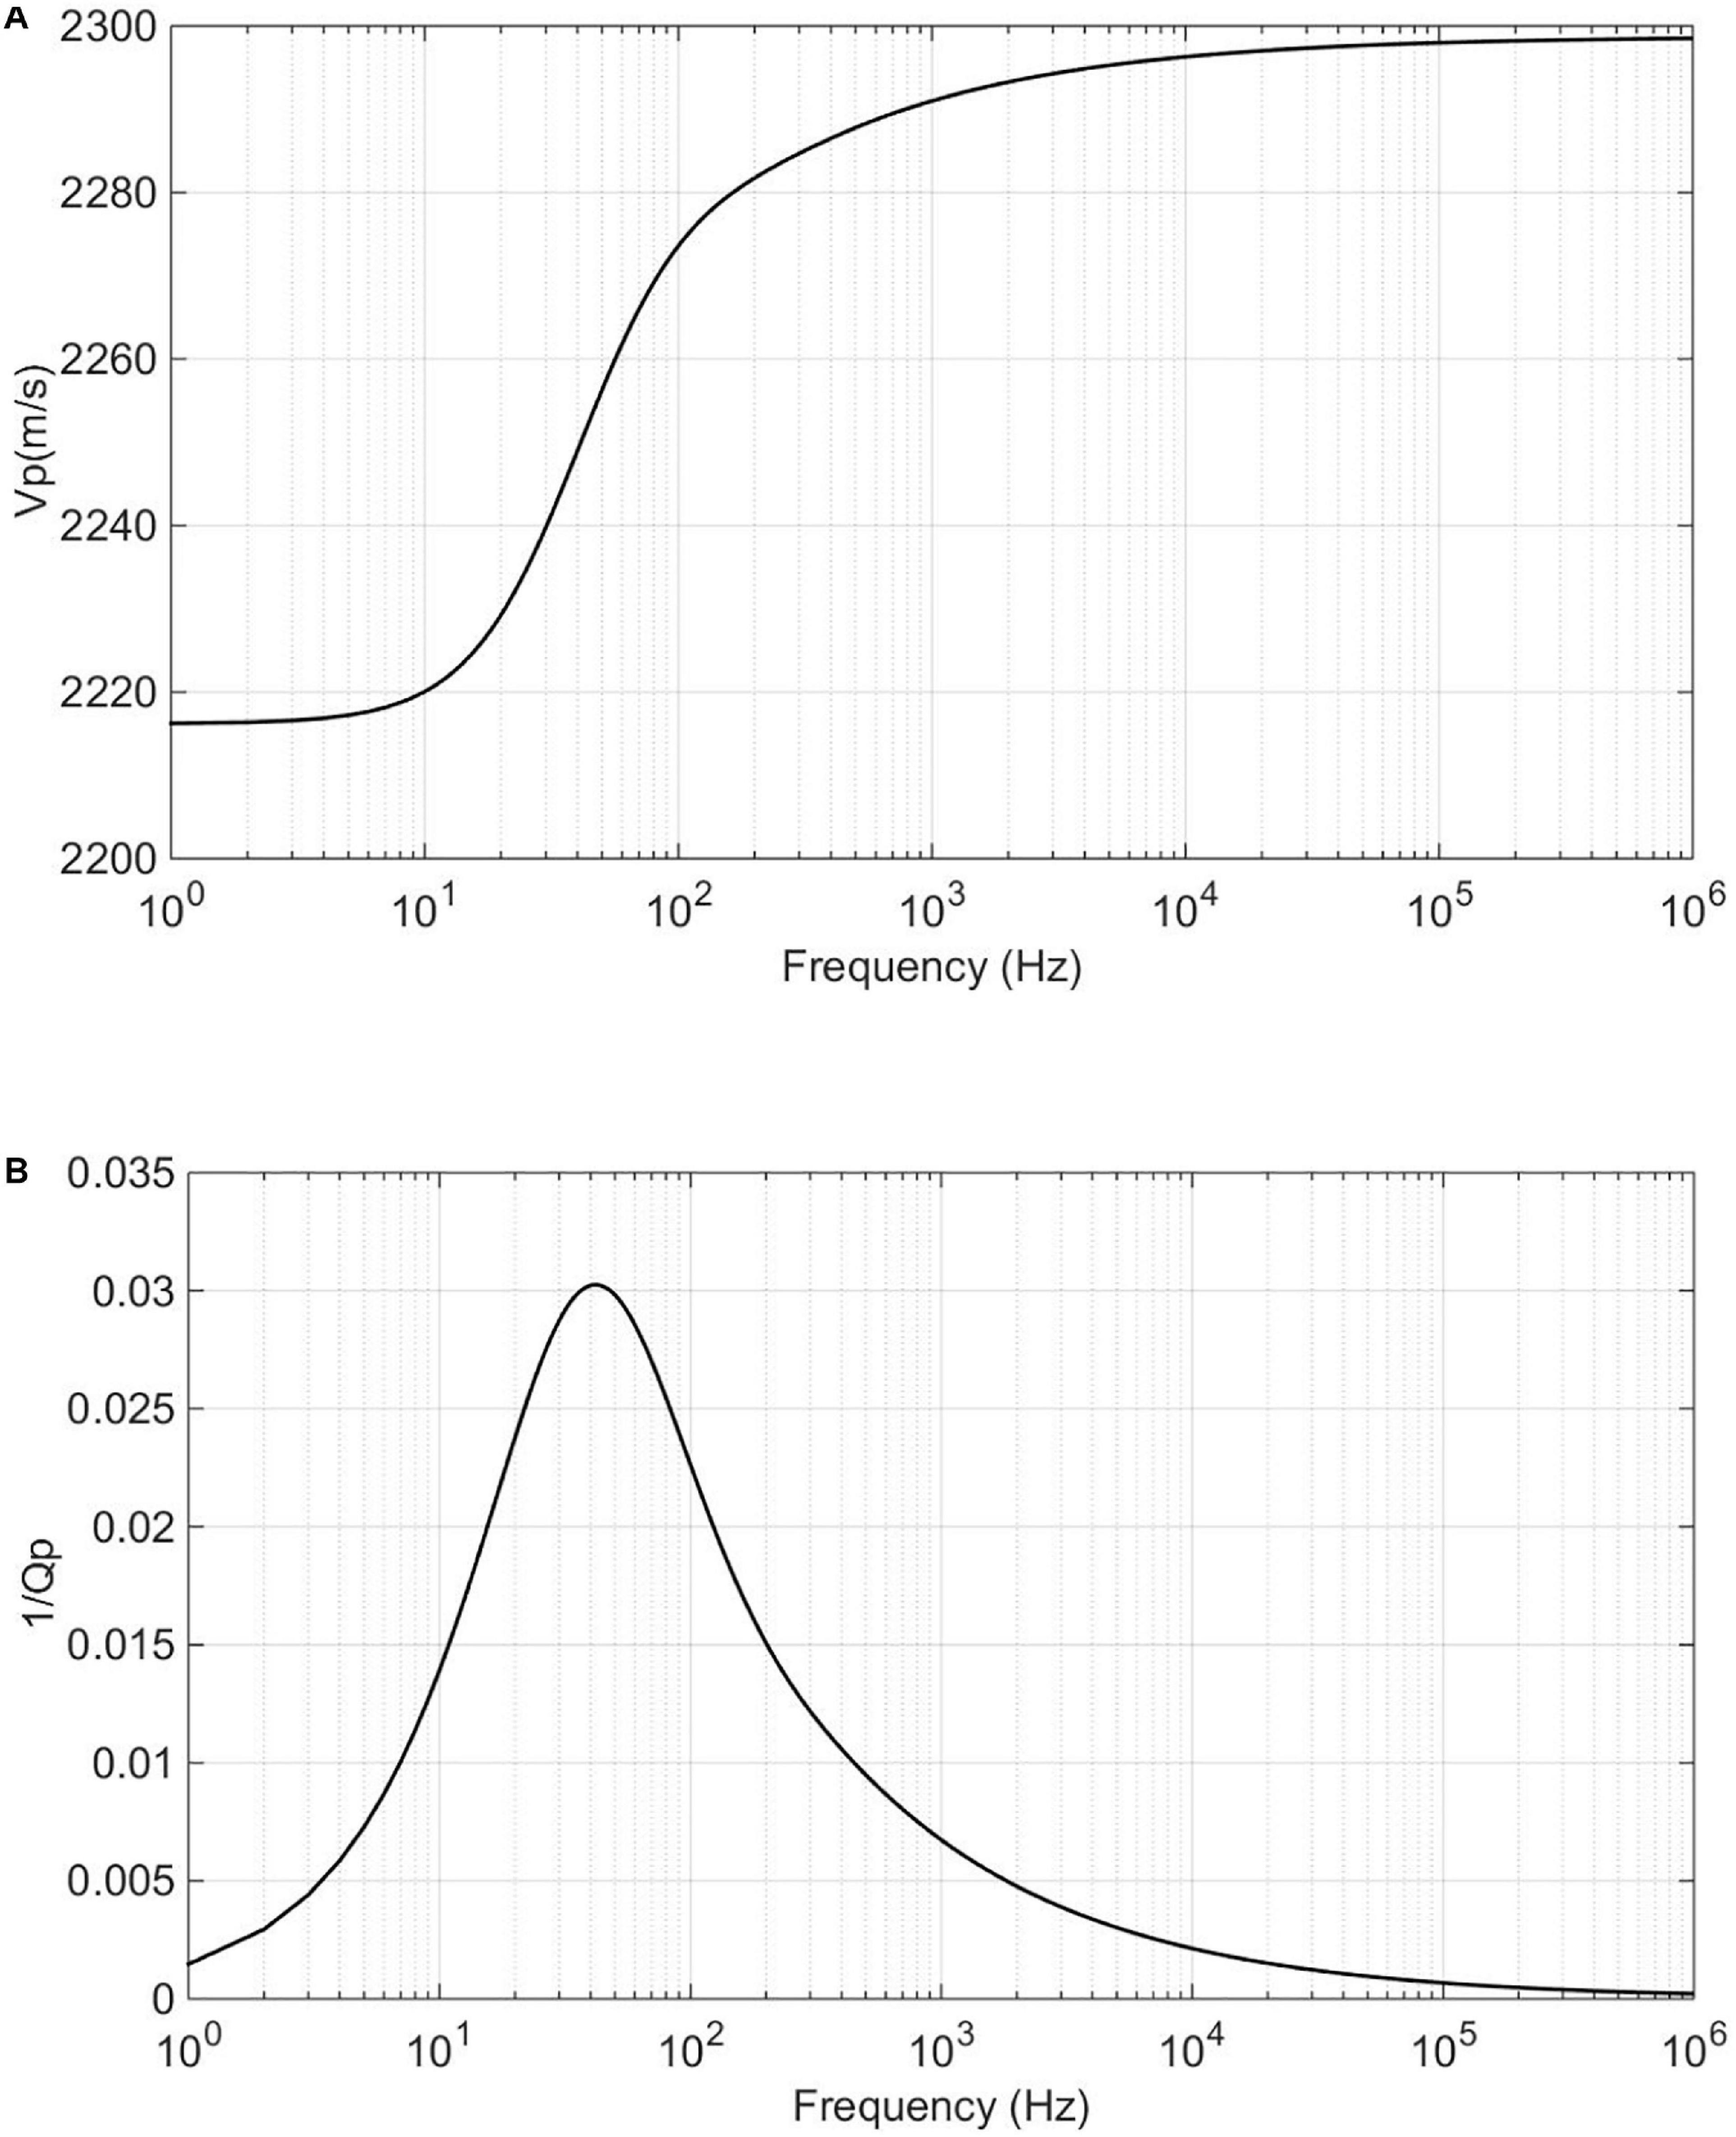
Figure 8. (A) The P-wave velocity Vp dispersion and (B) attenuation factor 1/Qp for a free gas layer.
Seismic Modeling for a Gas Hydrate-Bearing Reservoir
Seismic responses for the model in Figure 7 are calculated by integrating the built rock physics model and the propagator matrix method.
In the propagator matrix theory, the reflection and transmission coefficient vector r = [RPP,RPS,TPP,TPS]T for the P-wave incidence is given by (Carcione, 2001):
where A1 and A2 are the propagator matrices related to the elastic parameters of the upper and lower media; Bα = T(0)T−1(hα)(α = 1,…,N) is the propagator matrix of the intermediate layer with an N layer structure; hα is the thickness of each layer; and for a single-layered medium, N = 1. ip is the P-wave incident vector, which is related to the physical parameters of the incident medium. Appendix A shows details of the propagator matrix theory.
The frequency-dependent reflection coefficient Rf of the PP wave (that is, Rpp) was calculated using the propagator matrix theory. It is multiplied by the seismic wavelet Wf in the frequency domain to obtain the corresponding amplitude spectrum Uf:
By implementing the inverse Fourier transform to Uf, the waveform U of reflection wave in the time domain is obtained:
where f is the angular frequency; i is an imaginary unit; t is time.
In Figure 7, the thickness of the gas hydrate reservoir is set as 50 m, and the dominant frequency of the Ricker wavelet is set as 40 Hz. The P-wave velocity dispersion and attenuation of the gas hydrate reservoir and the free gas are shown in Figures 3, 8, respectively.
Figure 9 shows the seismic AVO responses of the PP reflections for gas hydrate saturations of 0.2, 0.35, and 0.5. Among them, and the second type of AVO response is observed at the top interface of the gas hydrate reservoir. The interface between the gas hydrate reservoir and the free gas layer has a negative reflection amplitude, known as the BSR. As shown in Figure 9, a higher gas hydrate saturation corresponds to a higher BSR amplitude.
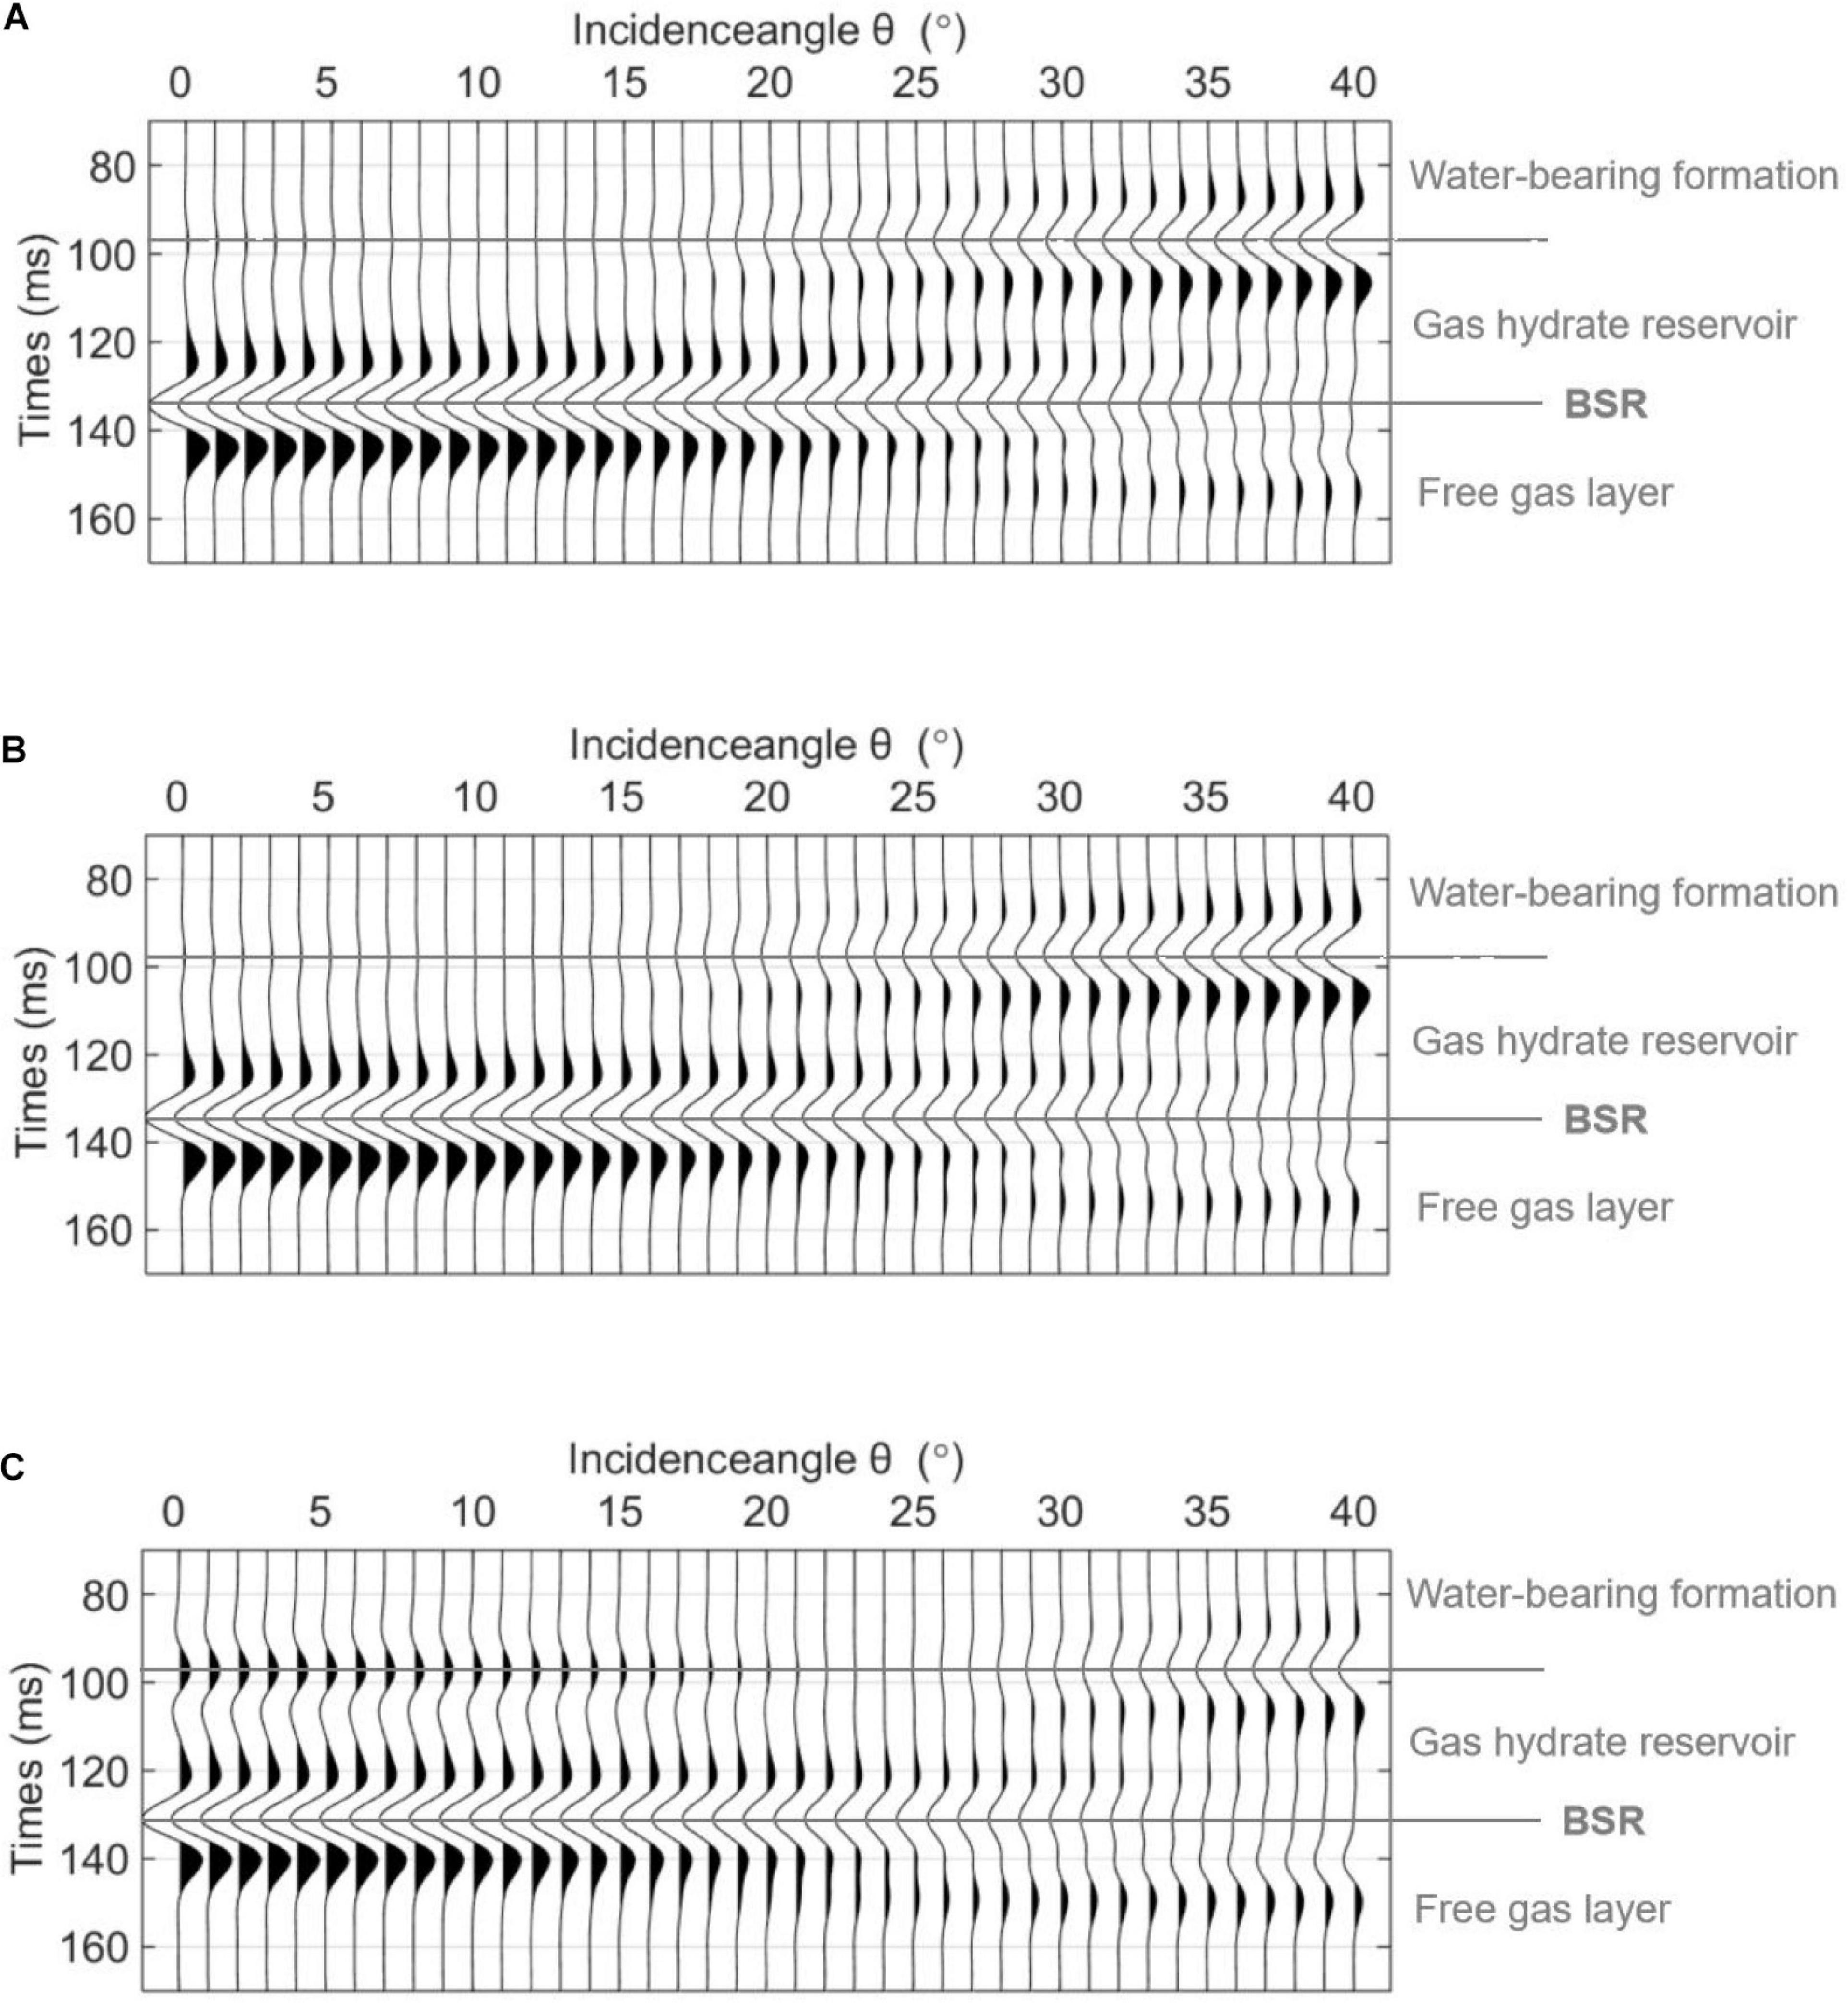
Figure 9. The PP AVO responses for different hydrate saturations S. (A) S = 0.2, (B) S = 0.35, and (C) S = 0.5.
Figure 10 shows the mode-converted PS reflections for gas hydrate saturations of 0.2, 0.35, and 0.5. The interface between the gas hydrate-bearing reservoir and the free gas layer generates a mode-converted PS wave that has a positive phase of amplitude.
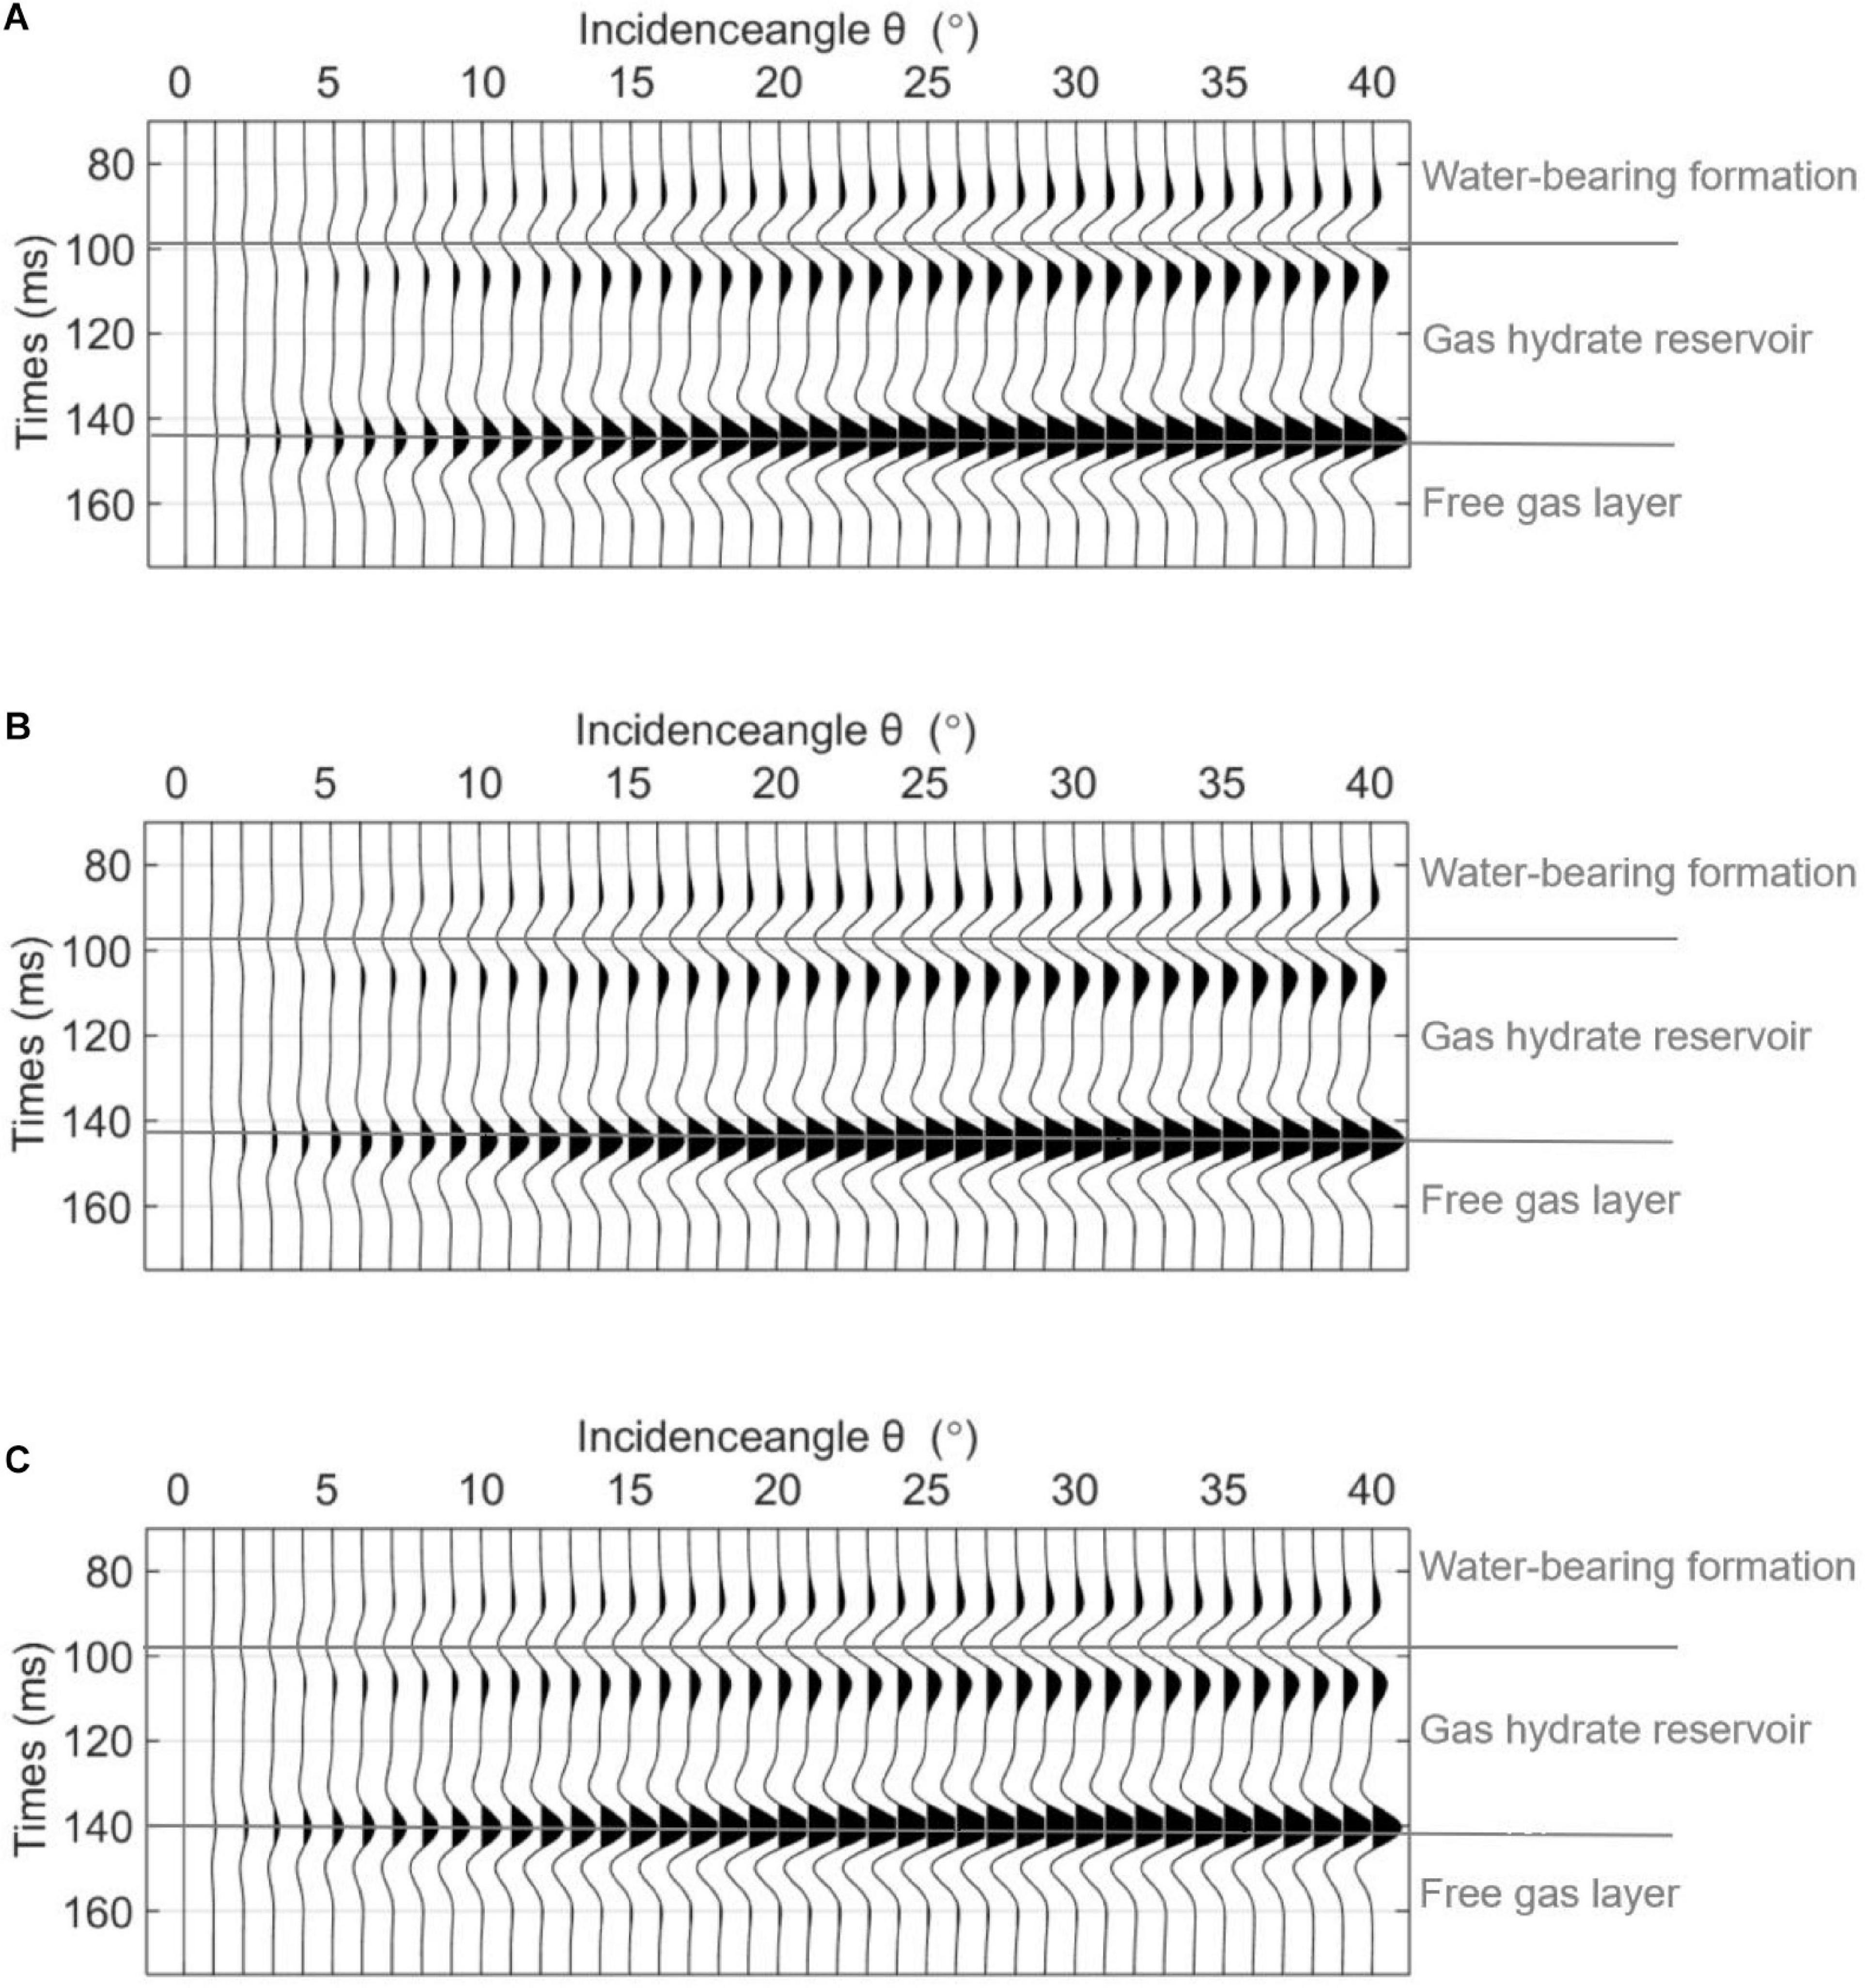
Figure 10. The mode-converted PS AVO for different hydrate saturations S. (A) S = 0.2, (B) S = 0.35, and (C) S = 0.5.
Figure 11A shows the post-stacked PP reflections obtained from AVO responses in Figure 9. Figure 11B shows the post-stacked mode-converted PS reflection obtained from Figure 10. For both the PP and PS reflections in Figure 11, the difference is very small for the two cases where gas hydrate saturations are 0.2 and 0.35, respectively. However, by comparing gas hydrate saturations of 0.35 and 0.5, the differences between the stacked reflection amplitudes are quite large. This can be interpreted by the analysis on Figure 4 where the Vp shows little variation with hydrate saturation for the case that the saturation is lower than the critical value 0.35, and represents significant variations for the hydrate saturation higher than the critical value 0.35.
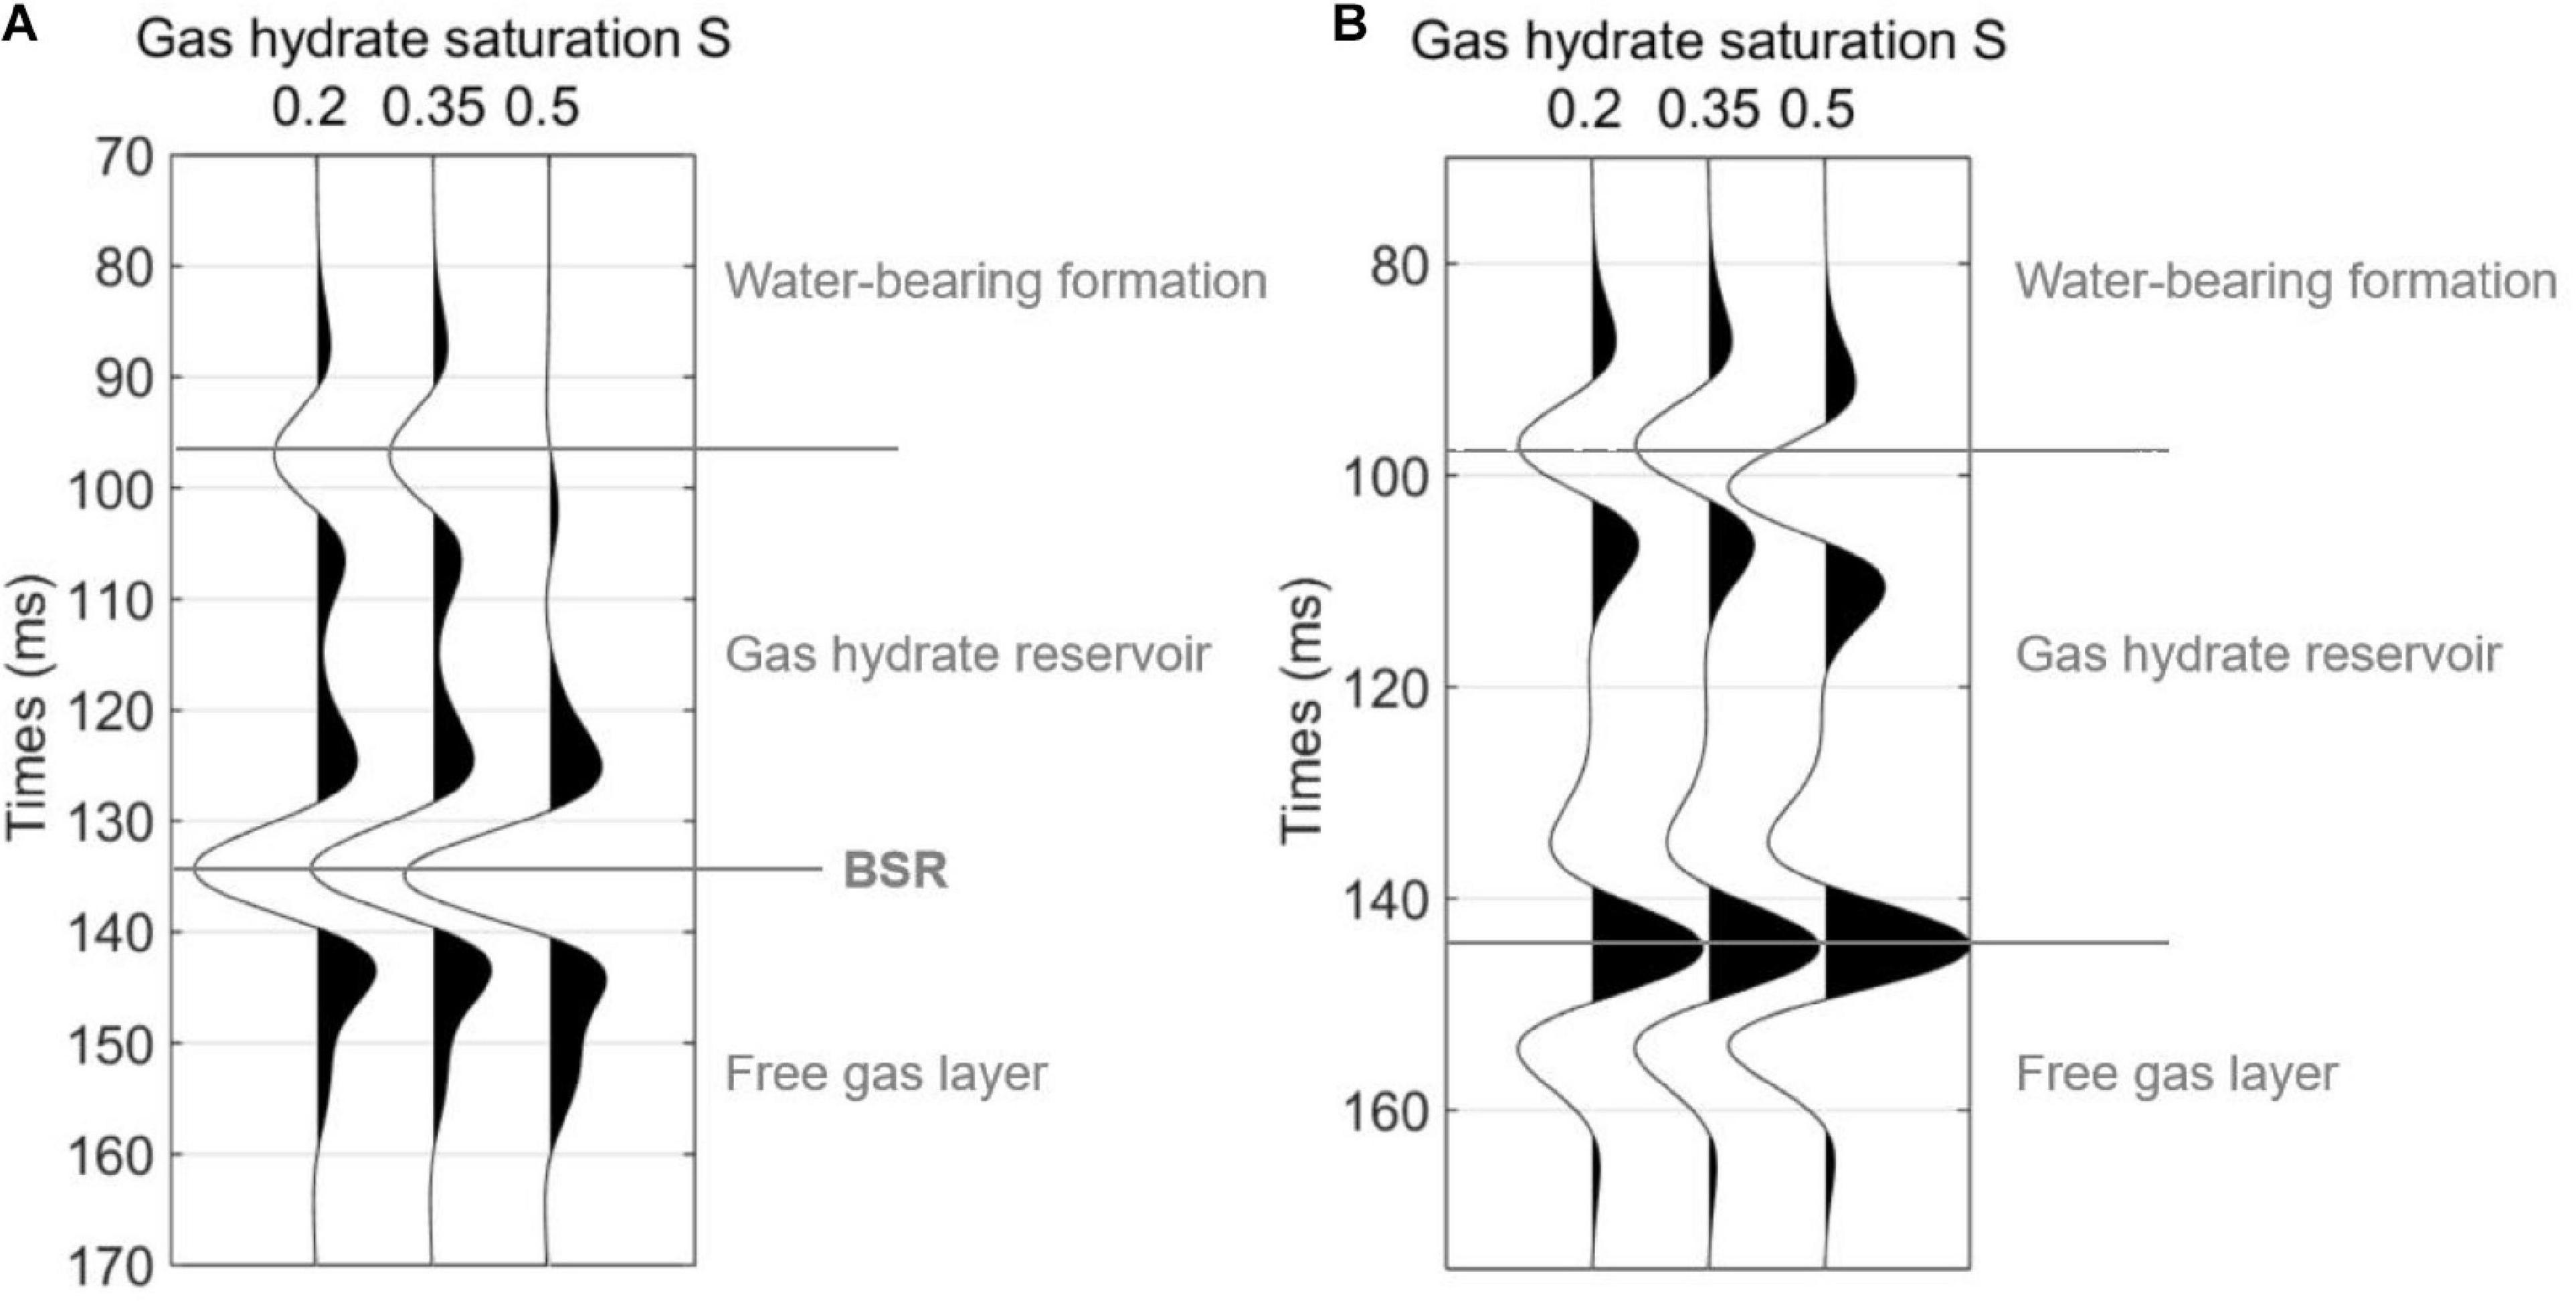
Figure 11. Post-stacked seismograms corresponding to Figures 9, 10. (A) PP reflections (B) mode-converted PS reflections.
Seismic Responses for a Model With Heterogeneous Gas Hydrate Saturation
Berge et al. (1999) and Dvorkin et al. (1999) showed that when free gas migrates upward to gas hydrate-bearing sediments, it may lead to heterogeneous hydrate saturation in the sediments. Thus, we design a model as shown in Figure 12A, where the hydrate saturation gradually decreases from about 0.55 at the bottom interface to the value just above zero at the top of the gas hydrate-bearing layer, which has a layer thickness about 28 m. According to the rock physics model built in this study, the P-wave velocity Vp dispersion and attenuation factor 1/Qp for varied hydrate saturation and frequency are calculated and shown in Figures 12B,C.
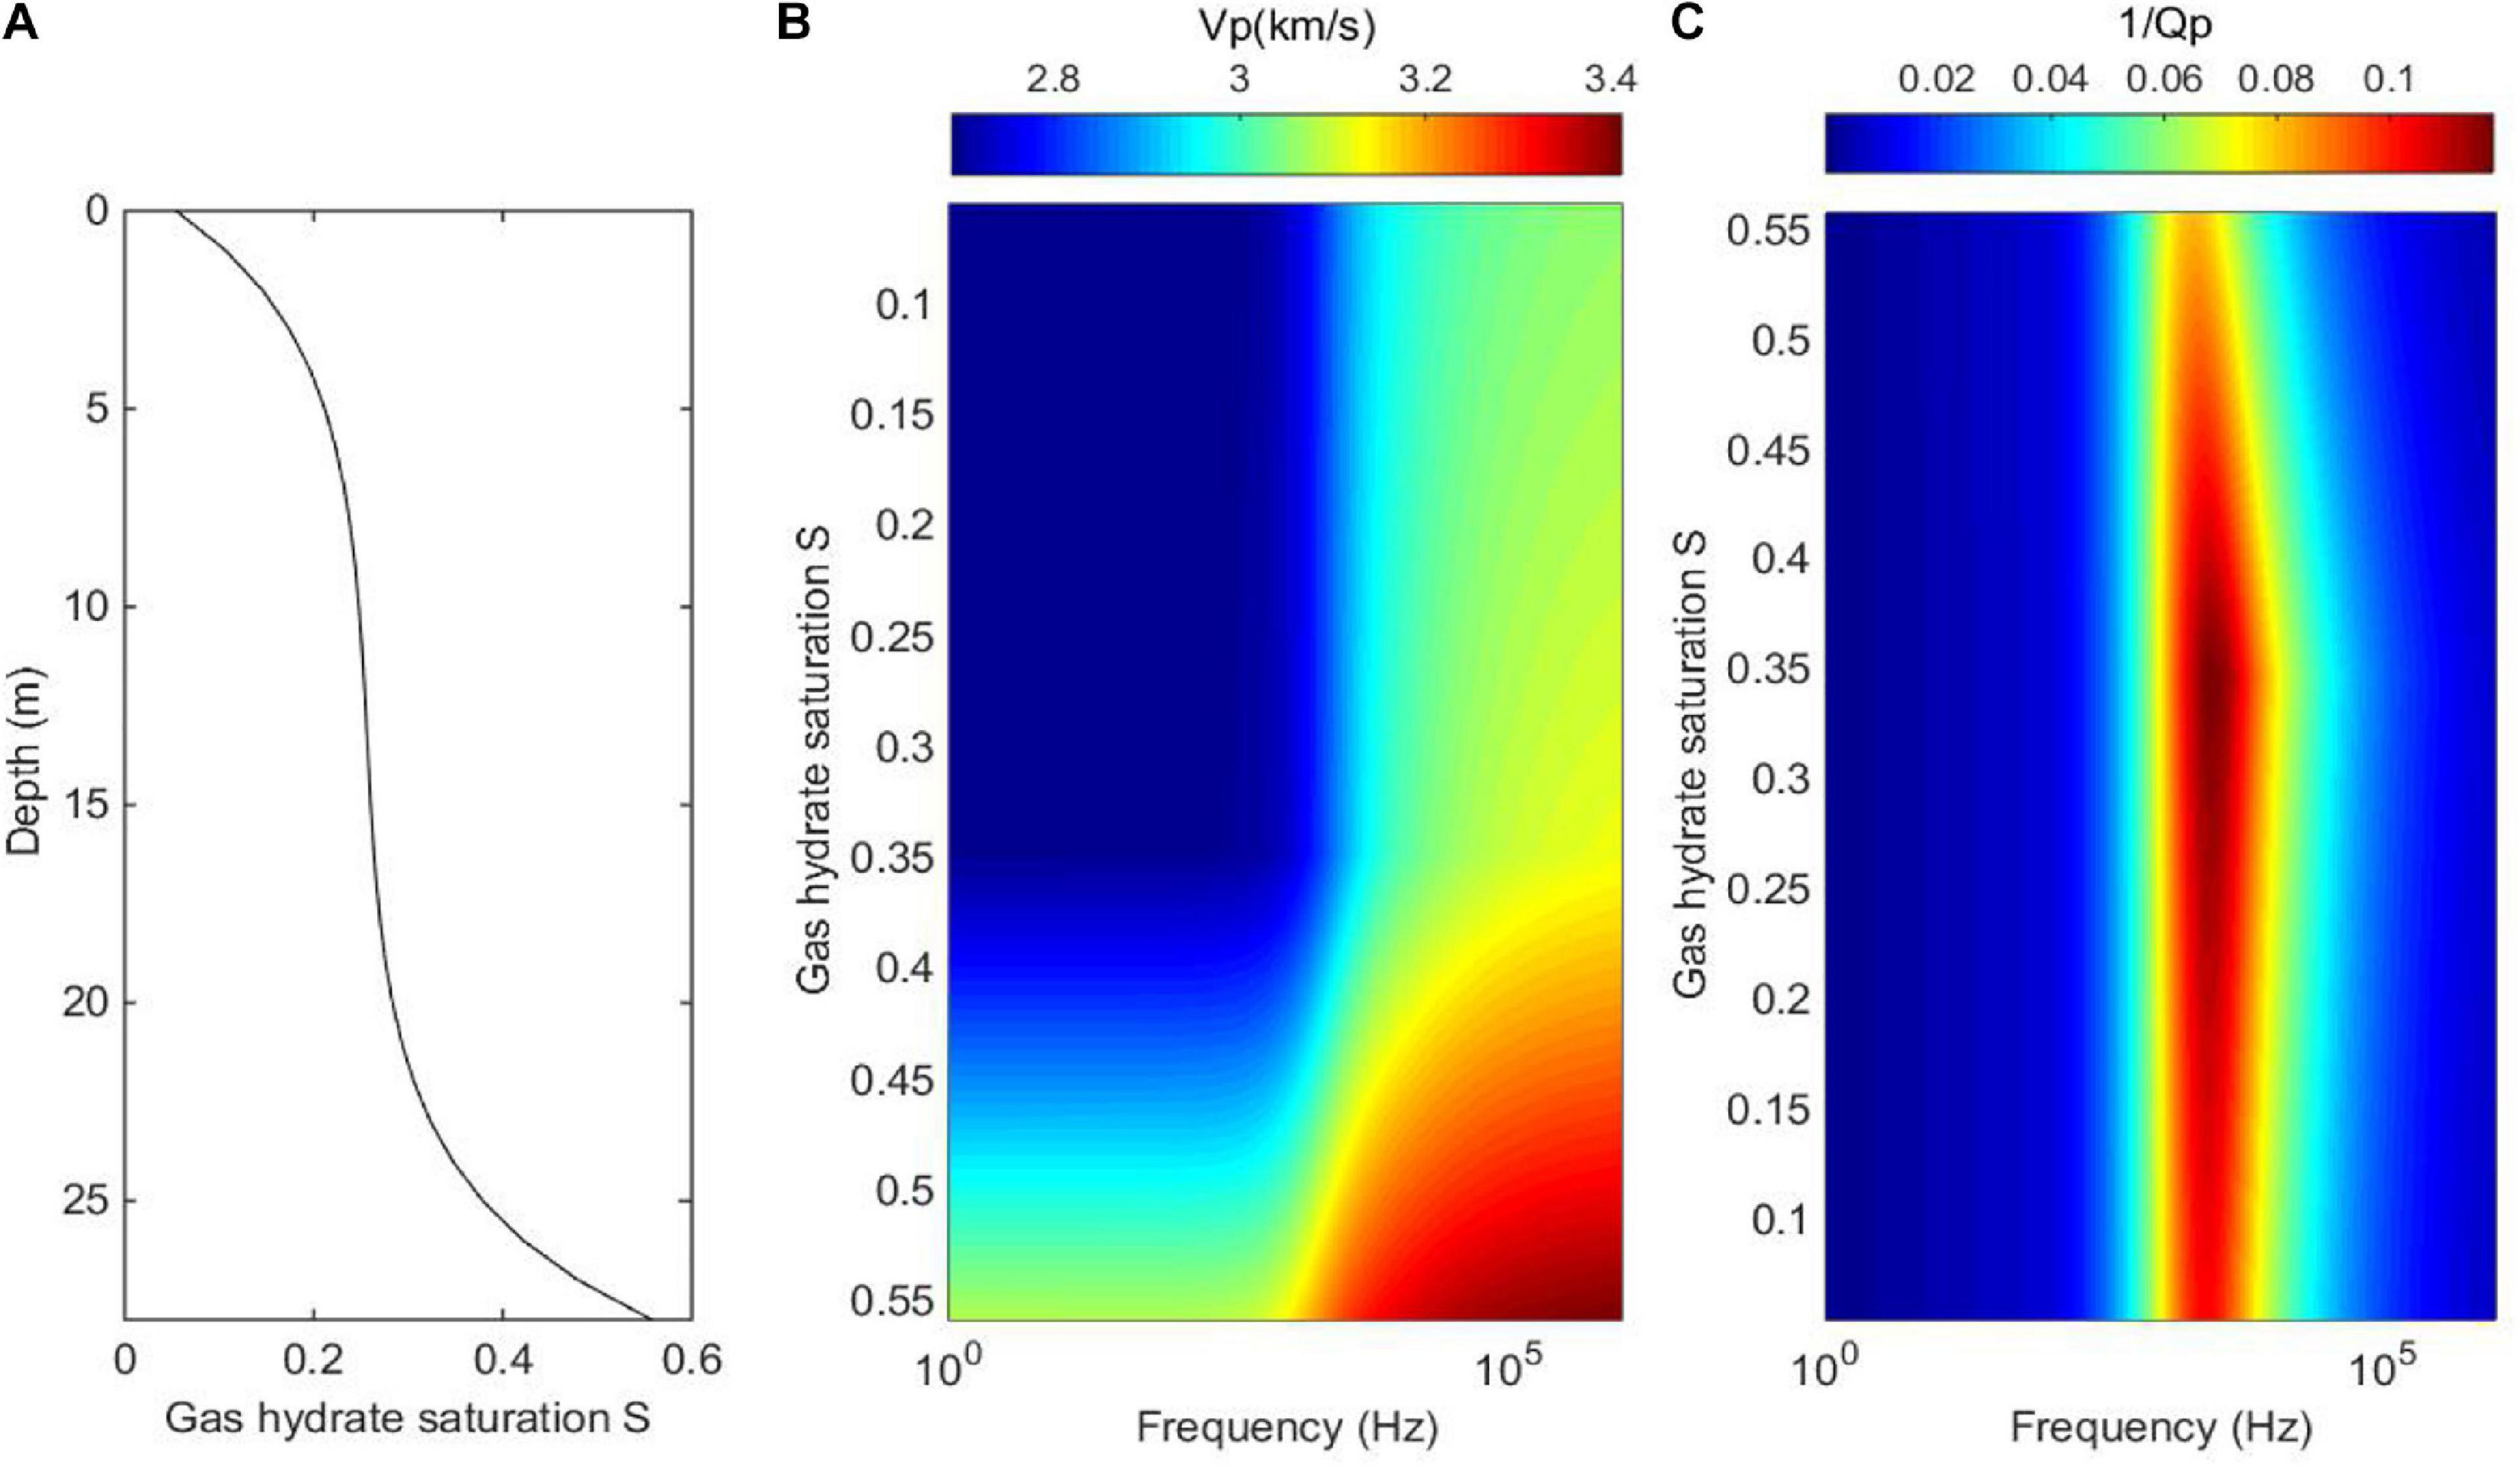
Figure 12. (A) The model of heterogeneous hydrate saturation varying with depth; (B) the P-wave velocity Vp dispersion; and (C) corresponding P-wave attenuation factor 1/Qp.
Based on the model of heterogeneous hydrate saturation in Figure 12A, we design a 2D model where the gas hydrate saturation varies vertically and layer thickness of the reservoir varies laterally, as shown in Figure 13. The thickness of the gas hydrate-bearing reservoir gradually decreases from 28 to 2.8 m from the center to both sides in the model. We calculate the AVO responses for each model in Figure 13, and then obtain the stacked waveforms as shown in Figure 14. In the calculation, the dominate frequency of the Ricker wavelet is 40 Hz, and the incidence angle ranges from 0 to 40 degrees. As can be seen in Figure 14, larger thickness of the gas hydrate-bearing reservoir corresponds to stronger reflection amplitudes from the BSR, Amplitude and phase of reflections vary with the thickness due to interference.
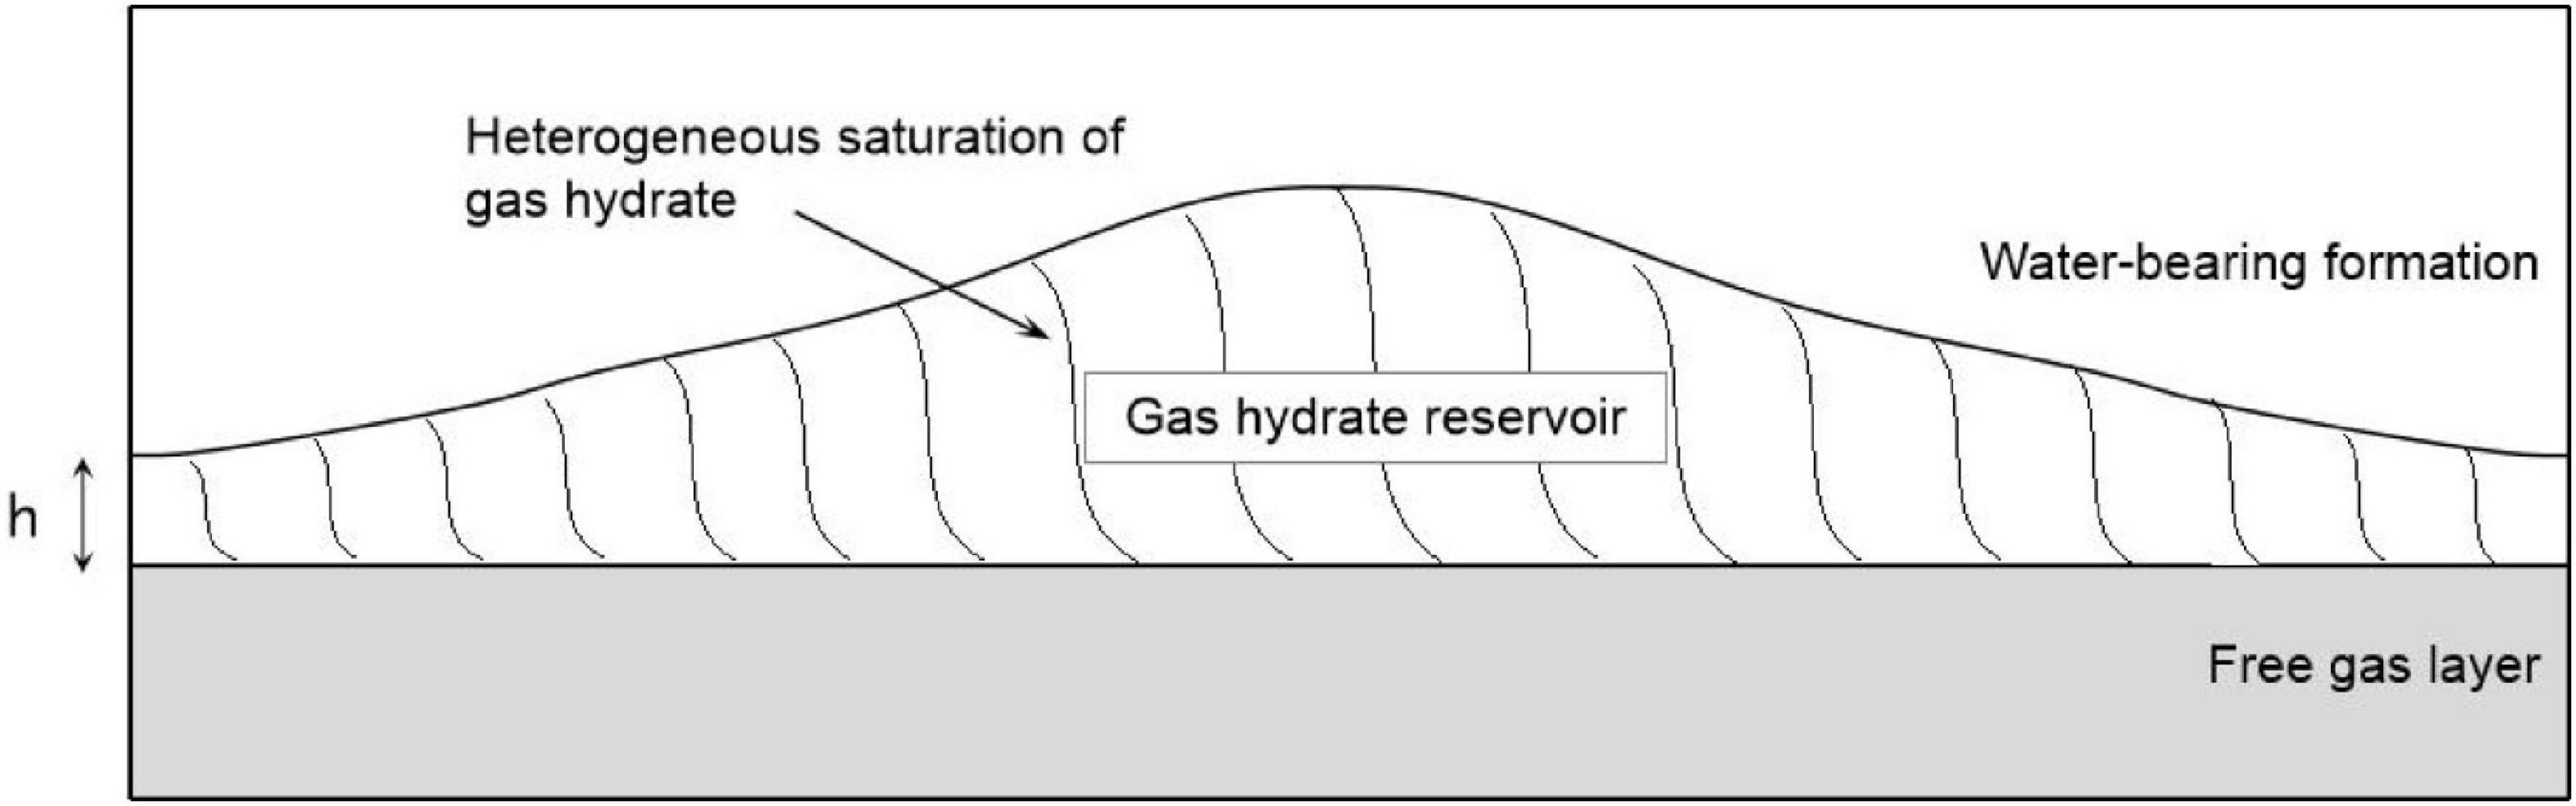
Figure 13. A model of gas hydrate-bearing sediment that the gas hydrate saturation varies vertically and layer thickness varies laterally.
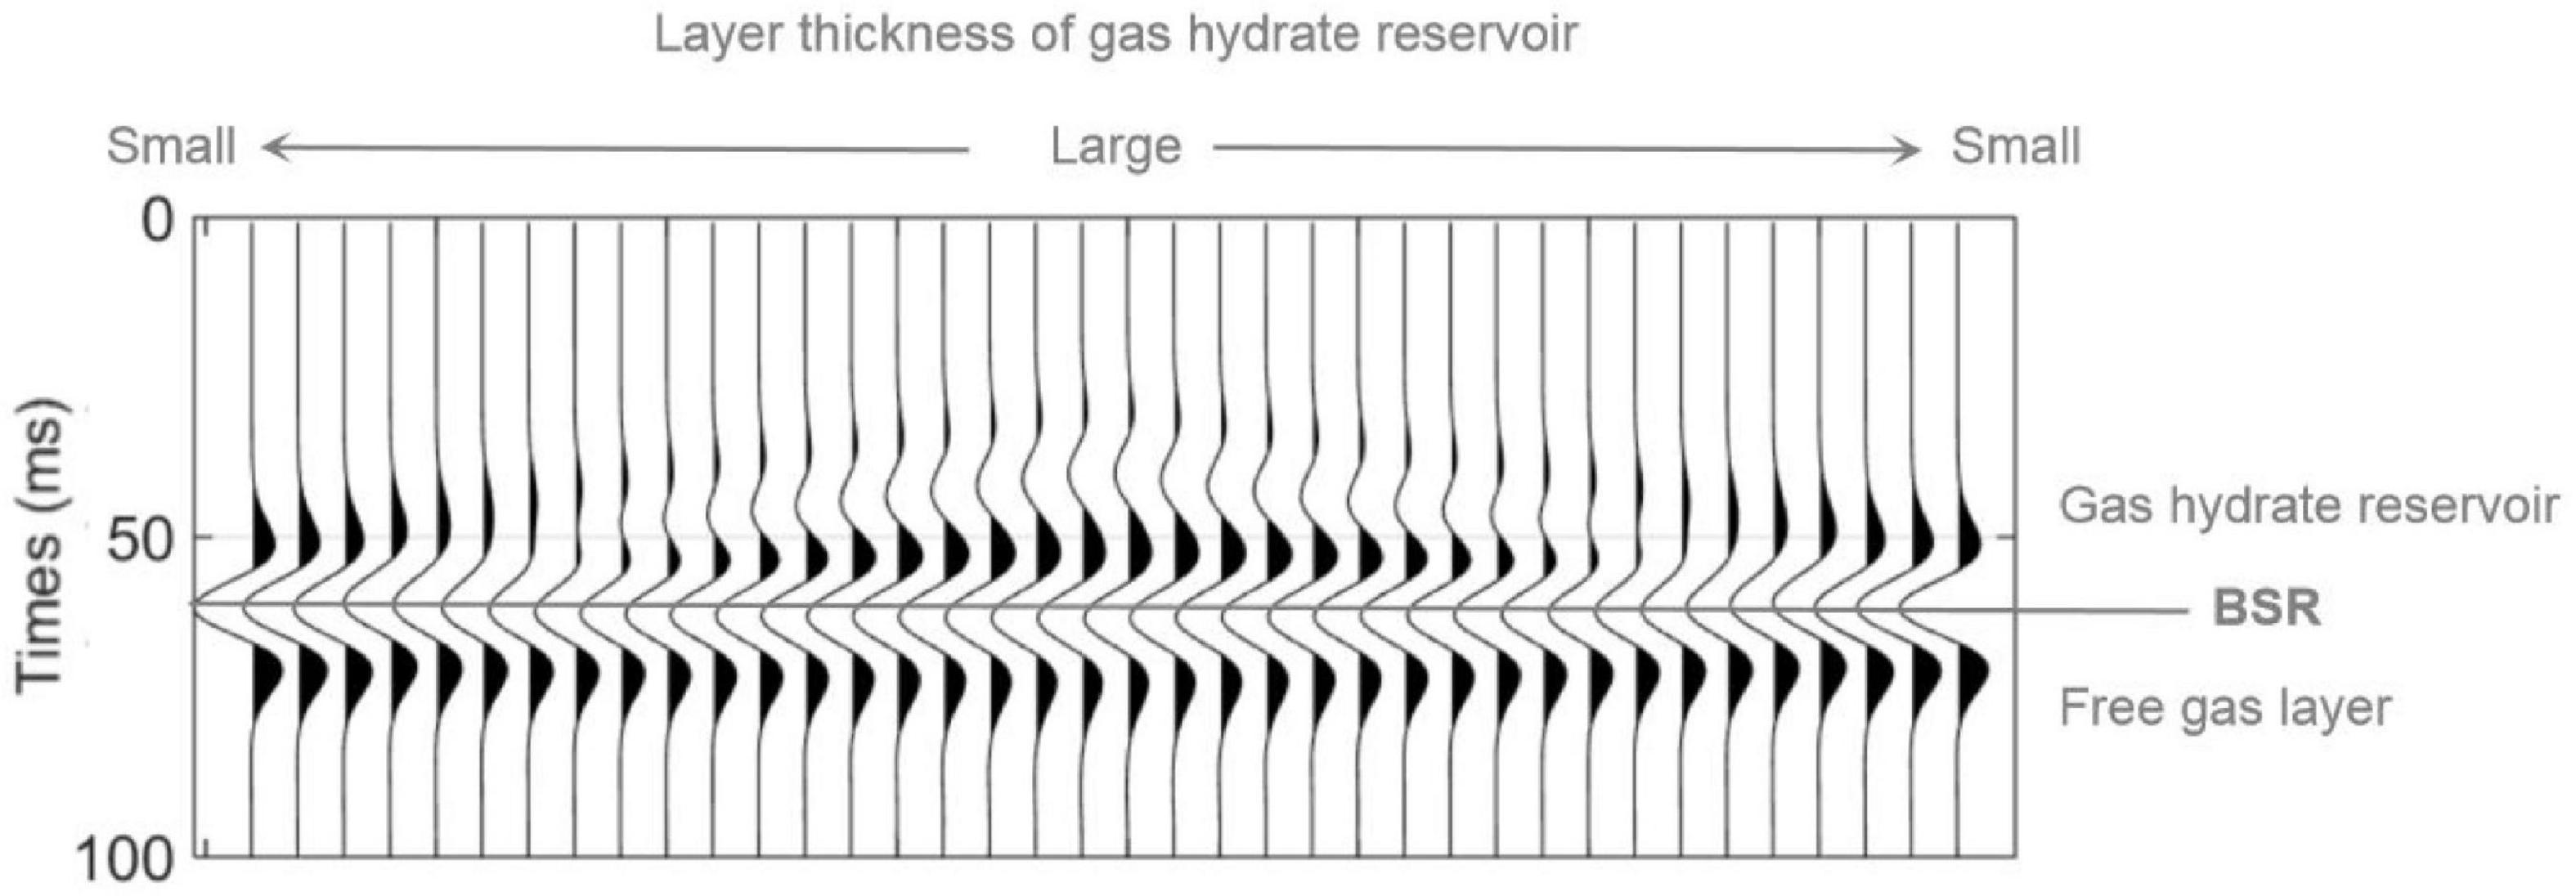
Figure 14. The post-stacked seismic responses of the model in Figure 13.
Discussion and Conclusion
The critical hydrate saturation parameter Sc was introduced into the rock physics model to describe two typical modes of gas hydrate concentration, including the pore filling and the co-existence of pore filling and particle cementation. The rock physics model simulates the dynamic changes in the mode of gas hydrate concentration as the hydrate saturation increases, and considers corresponding variations in porosity and permeability. P-wave velocity dispersion and attenuation caused by the squirt flow of fluid in the gas hydrate-bearing reservoir are calculated. By integrating the rock physics model and the propagator matrix method, seismic AVO responses are calculated to investigate the effects of hydrate saturation on seismic signatures. The conclusions are as the followings:
We observe two trends that the P-wave velocity Vp varies with increasing gas hydrate saturation S. For the pore filling mode (S < Sc), the Vp increases slightly with increasing S, while for the co-existence mode of pore filling and particle cementation (S ≥ Sc), the Vp increases significantly with increasing S for all frequencies. Meanwhile, seismic modeling results show that for both the PP and mode-converted PS responses, reflection waveforms are insensitive to the gas hydrate saturation lower than the critical value, while the reflection waveforms tend to change obviously for the gas hydrate saturation higher than the critical value. These can be interpreted that the hydrate begins to be a part of solid matrix when hydrate saturation is higher than the critical value, and thus shows more impact on elastic modulus of the gas hydrate-bearing sediments.
Synthetic seismograms are calculated for a 2D heterogeneous model where the gas hydrate saturation varies vertically and layer thickness of the hydrate reservoir varies laterally. Modeling results shows that larger thickness of the gas hydrate-bearing reservoir corresponds to stronger reflection amplitudes from the BSR, while reflection amplitude and phase may vary with the thickness due to interference.
Data Availability Statement
The original contributions presented in the study are included in the article/supplementary material, further inquiries can be directed to the corresponding author/s.
Author Contributions
ZG and JJ contributed as the major authors of the manuscript. XW did a part of writing and coding works. HC provided some interesting ideas. All authors contributed to the article and approved the submitted version.
Funding
The research was supported by the National Natural Science Foundation of China (No. 42074153) and the CNPC Science Research and Technology Development project (No. 2019A-3308).
Conflict of Interest
HC was employed by the company BGP Inc.
The remaining authors declare that the research was conducted in the absence of any commercial or financial relationships that could be construed as a potential conflict of interest.
References
Berge, L. I., Jacobsen, K. A., and Solstad, A. (1999). Measured acoustic wave velocities of R11 (CCl3F) hydrate samples with and without sand as a function of hydrate concentration. J. Geophys. Res. Solid Earth 104, 15415–15424. doi: 10.1029/1999jb900098
Carcione, J. M. (2001). AVO effects of a hydrocarbon source-rock layer. Geophysics 66, 419–427. doi: 10.1190/1.1444933
Dvorkin, J., and Nur, A. (1993). Dynamic poroelasticity: a unified model with the squirt and the Biot mechanisms. Geophysics 58, 524–533. doi: 10.1190/1.1443435
Dvorkin, J., Nolen-Hoeksema, R., and Nur, A. (1994). The squirt-flow mechanism: macroscopic description. Geophysics 59, 428–438. doi: 10.1190/1.1443605
Dvorkin, J., Prasa, M., Sakai, A., and Lavoie, D. (1999). Elasticity of marine sediments: rock physics modeling. Geophys. Res. Lett. 26, 1781–1784. doi: 10.1029/1999gl900332
Ecker, C. (2001). Seismic Characterization of Methane Hydrate Structures. Stanford, US: Stanford University.
Ecker, C., Dvorkin, J., and Nur, A. (1998). Sediments with gas hydrates: internal structure from seismic AVO. Geophysics 63, 1659–1669. doi: 10.1190/1.1444462
Ecker, C., Dvorkin, J., and Nur, A. (2000). Estimating the amount of gas hydrate and free gas from marine seismic data. Geophysics 65, 565–573. doi: 10.1190/1.1444752
Gei, D., and Carcione, J. M. (2003). Acoustic properties of sediments saturated with gas hydrate, free gas and water. Geophys. Prospect. 51, 141–157. doi: 10.1046/j.1365-2478.2003.00359.x
Helgerud, M. B., Dvorkin, J., Nur, A., Sakai, A., and Collett, T. (1999). Elastic wave velocity in marine sediments with gas hydrates: effective medium modeling. Geophys. Res. Lett. 26, 2021–2024. doi: 10.1029/1999gl900421
Hill, R. (1952). The elastic behavior of crystalline aggregate. Proc. Phys. Soc. A 65, 349–354. doi: 10.1088/0370-1298/65/5/307
Krief, M., Garat, J., Stellingwerff, J., and Ventre, J. (1990). A petrophysical interpretation using the velocities of P and S waves (full waveform sonic). Log Analyst. 31, 355–369.
Lee, M. W. (2002a). Biot–Gassmann theory for velocities of gas hydrate-bearing sediments. Geophysics 67, 1711–1719. doi: 10.1190/1.1527072
Lee, M. W. (2002b). Modified Biot-Gassmann theory for calculating elastic velocities for unconsolidated and consolidated sediments. Mar. Geophys. Res. 23, 403–412. doi: 10.1023/b:mari.0000018195.75858.12
Lee, M. W., Hutchinson, D. R., Collett, T. S., and Dillon, W. P. (1996). Seismic velocities for hydrate-bearing sediments using weighted equation. J. Geophys. Res. 101, 20347–20358. doi: 10.1029/96jb01886
Marc-André, P. C., Michael R., Roy, D. H., and Stan, E. D. (2007). AVO inversion of BSRs in marine gas hydrate studies. Geophysics 72, C31–C43. doi: 10.1190/1.2435604
Muller, T. M., Gurevich, B., and Lebedev, M. (2010). Seismic wave attenuation and dispersion resulting from wave-induced flow in porous rocks - a review. Geophysics 75, A147–A164.
Petersen, C. J., Papenberg, C., and Klaeschen, D. (2007). Local seismic quantification of gas hydrates and BSR characterization from multi-frequency OBS data at northern Hydrate Ridge. Earth Planetary Sci. Lett. 255, 414–431. doi: 10.1016/j.epsl.2007.01.002
Priest, J. A., Best, A. I., and Clayton, R. I. (2006). Attenuation of seismic waves in methane gas hydrate-bearing sand. Geophys. J. Int. 164, 149–159. doi: 10.1111/j.1365-246X.2005.02831.x
Qadrouh, A., Carcione, J. M., Salim, A. M., and Harith, Z. Z. T. (2015). Attenuation effects on the seismic response of a bottom-simulating reflector. J. Nat. Gas Sci. Eng. 24, 510–517. doi: 10.1016/j.jngse.2015.04.011
Santos, J. E., Corbero, J. M., Ravazzoli, C., and Hensley, J. (1992). Reflection and transmission coefficients in fluid-saturated porous media. J. Acoustical Soci. Am. 91, 1911–1923. doi: 10.1121/1.403702
Song, H. B. (2002). Petrophysical property model of natural gas hydrate sediments and AVA characteristics of seafloor like reflective layers. J. Geophys. 45, 546–556.
Sun, W. T., Ba, J., Muller, T. M., Carcione, J. M., and Cao, H. (2014). Compaison of P-wave attenuation models of wave-induced flow. Geophys. Prospect. 63, 378–390. doi: 10.1111/1365-2478.12196
Toms, J., Muller, T. M., Ciz, R., and Gurevich, B. (2006). Comparative review of theoretical models for elastic wave attenuation and dispersion in partially saturated rocks. Soil Dyn. Earthq. Eng. 26, 548–565. doi: 10.1016/j.soildyn.2006.01.008
White, J. E. (1975). Computed seismic speeds and attenuation in rocks with partial gas saturation. Geophysics 40, 224–232. doi: 10.1190/1.1440520
Yun, T. S., Francisca, F. M., Santamarina, J. C., and Rupple, C. (2005). Compressional and shear wave velocities in uncemented sediment containing gas hydrate. Geophys. Res. Lett. 32:L10609.
Zhang, R. W., Li, H. Q., Wen, P. F., and Zhang, B. J. (2016). Analysis of velocity dispersion and attenuation characteristics of marine hydrate deposits. J. Geophys. 59, 3417–3427.
Zhang, R. W., Li, H. Q., Zhang, B. J., Huang, H.-D., and Wen, P.-F. (2015). Detection of gas hydrate sediments using prestack seimic AVA inversion. Appl. Geophys. 12, 453–464. doi: 10.1007/s11770-015-0503-3
Appendix A
In Eq. 13, the propagator matrices A1 and A2 of the upper and lower media are shown as follows:
where i is the imaginary unit; ω is the incidence wave frequency; and is the total thickness of the layer. The variables SZ, β, γ, W, and Z have two groups of subscripts. The subscripts P and S correspond to the quasi-compressional wave and the quasi-shear wave, respectively.
Keywords: rock physics, critical gas hydrate saturation, dispersion and attenuation, seismic response, gas hydrate
Citation: Guo Z, Wang X, Jiao J and Chen H (2021) Rock Physics Model and Seismic Dispersion and Attenuation in Gas Hydrate-Bearing Sediments. Front. Earth Sci. 9:641606. doi: 10.3389/feart.2021.641606
Received: 14 December 2020; Accepted: 01 March 2021;
Published: 18 March 2021.
Edited by:
Jing Ba, Hohai University, ChinaReviewed by:
Weitao Sun, Tsinghua University, ChinaJiajia Zhangjia, China University of Petroleum (Huadong), China
Copyright © 2021 Guo, Wang, Jiao and Chen. This is an open-access article distributed under the terms of the Creative Commons Attribution License (CC BY). The use, distribution or reproduction in other forums is permitted, provided the original author(s) and the copyright owner(s) are credited and that the original publication in this journal is cited, in accordance with accepted academic practice. No use, distribution or reproduction is permitted which does not comply with these terms.
*Correspondence: Jian Jiao, 43798102@qq.com