Assessment of Storm Surge History as Recorded by Driftwood in the Mackenzie Delta and Tuktoyaktuk Coastlands, Arctic Canada
 Roger F. MacLeod
 Scott R. Dallimore
- Geological Survey of Canada–Pacific, Natural Resources Canada, Sidney, BC, Canada
The southern Beaufort coastline in Canada experiences significant storm surge events that are thought to play an important role in coastal erosion and influence permafrost dynamics. Unfortunately, many of these events have not been documented with tide gauge records. In this paper, we evaluate coastal driftwood accumulations as a proxy for estimating maximum storm surge heights and the history of these events. We use historical air photos and data derived from Unoccupied Aerial Vehicle (UAV) imagery to resurvey four coastal stranded driftwood study sites that were first appraised in 1985–86 and assess two new regional sites in the Mackenzie Delta. Maximum storm surge heights were found to be similar to observations carried out in the 1980s, however, we refine the elevations with more accuracy and reference these to a vertical datum appropriate for incorporating into sea level hazard assessments. Detailed mapping, historical air photo comparisons and the UAV acquired imagery at a site close to Tuktoyaktuk demonstrate that the highest storm surge at this site (1.98 m CGVD2013) occurred in association with a severe storm in 1970. This event shifted driftwood and floated material slightly upslope from an older event thought to occur in 1944 that reached 1.85 m (CGVD2013) elevation. The quality and accuracy of the high-resolution Digital Surface Model (DSM) and orthophoto derived from Structure from Motion (SfM) processing of the UAV photographs allowed mapping of four distinct stratigraphic units within the driftwood piles. Based on variations in anthropogenic debris composition, weathering characteristics and history of movement on aerial photographs, we conclude that no storm surge events at Tuktoyaktuk have exceeded ∼1.3 m (CGVD2013) since 1970. While there has been some speculation that ongoing climate change may lead to more frequent large magnitude storm surges along the Beaufort coast, our study and available tide gauge measurements, suggest that while moderate elevation storm surges may be more frequent in the past several decades, they have not approached the magnitude of the 1970 event.
Introduction
As recognized in many papers in this special issue on dynamic coastal permafrost systems, the effects of storm surges and associated thermomechanical degradation of ice bonded permafrost are critical processes affecting coastal erosion in the Arctic (i.e., Lim et al., 2020; Thomas et al., 2020). Storm surges can generate elevated water levels that can reach the base of eroding coastal bluffs and they are often associated with storms which can create enhanced wave action. As a result, deep erosional niches can form in cliff sections, creating mechanical instability that can induce subsequent cliff failure and accelerate permafrost degradation (Henry and Heaps, 1976; Dallimore et al., 1996; Kobayashi et al., 1999). Wave action associated with storm surges can also cause nearshore erosion, and flooding caused by storm surges can be a geohazard as well as an environmental concern.
In the past 30 years, the Beaufort coast has experienced warming air and water temperatures (Screen and Simmonds, 2010; Cohen et al., 2014; Graham et al., 2017), and longer and more extensive ice-free conditions (Serreze et al., 2007; Comiso et al., 2008; Overeem et al., 2011; Meredith et al., 2019). These conditions result in more extensive and longer open water conditions that can enable an increased frequency and severity of storm surges (Manson and Solomon, 2007; Vermaire et al., 2013; Greenan et al., 2018). However, time series assessments of storm surges in the Arctic based on instrument records are limited. For instance, there is only one long-standing tide station along the Canadian Beaufort coast and it has significant gaps in its recording period (Shaw et al., 1998; Manson and Solomon, 2007).
The objective of this paper is to examine historical storm surge heights based on indirect estimates of stranded driftwood elevations at sites along the southern Beaufort coast in Canada. To determine elevations of the driftwood, we use modern surveying techniques based on imagery taken from an Unoccupied Aerial Vehicle (UAV) that are processed using Structure from Motion (SfM) photogrammetry techniques, complimented with high precision Real Time Kinematic Global Navigation Satellite System (RTK-GNSS) surveys. Storm surge heights are determined by mapping the uppermost elevation of wood within debris lines and driftwood piles and referencing these heights to a geodetic vertical datum. To validate that driftwood positions are a reliable indicator of water levels during storm surge events, the heights of mobilized wood are compared with tide gauge measurements before and after recent storm surge events. Given concerns that storm surges may be higher in the present climate regime than in the past, historical air photos are also appraised to investigate if the highest debris was emplaced by surge events from the past or in association with more recent events. We further investigate if these heights exceed determinations based on similar field studies done in 1985 and 1986 (Harper et al., 1988). Finally, we assess the utility of radiocarbon dating as a basis to document the age of a highly weathered driftwood line that was found partially embedded in the tundra canopy.
Background
The coast of the Canadian Beaufort, in the vicinity of the Tuktoyaktuk Coastlands (Tuktoyaktuk Peninsula, Richards Island and the Mackenzie Delta) typically has a very shallow offshore gradient with complex coastlines with eroding headland areas, lagoons and embayments (Figure 1). This ice-rich lowland area has experienced rising sea-levels since glacial times (Hill et al., 1985) with current estimates of relative sea-level rise based on tide gauge measurements at Tuktoyaktuk varying from 2.5 mm per year (Greenan et al., 2018) to 2.75 mm per year [National Oceanic and Atmospheric Administration (NOAA), 2021]. Glacial isostatic adjustment makes up a portion of this change with estimates of approximately 1 mm per year of subsidence (James et al., 2014). Unfortunately, the short and intermittent instrument record does not provide for high certainty in either value. In general, the southern Beaufort coast is prone to storm surges that are typically generated from storms with wind directions from the north and northwest (Henry and Heaps, 1976; Hill et al., 1991; Manson and Solomon, 2007; Kokelj et al., 2012). Some researchers highlight that climate change is leading to an increase in sea-level, decreased seasonal sea ice extent, and allude to a possible increase in the frequency and severity of storms producing storm surges (Manson and Solomon, 2007; Vermaire et al., 2013; Greenan et al., 2018).
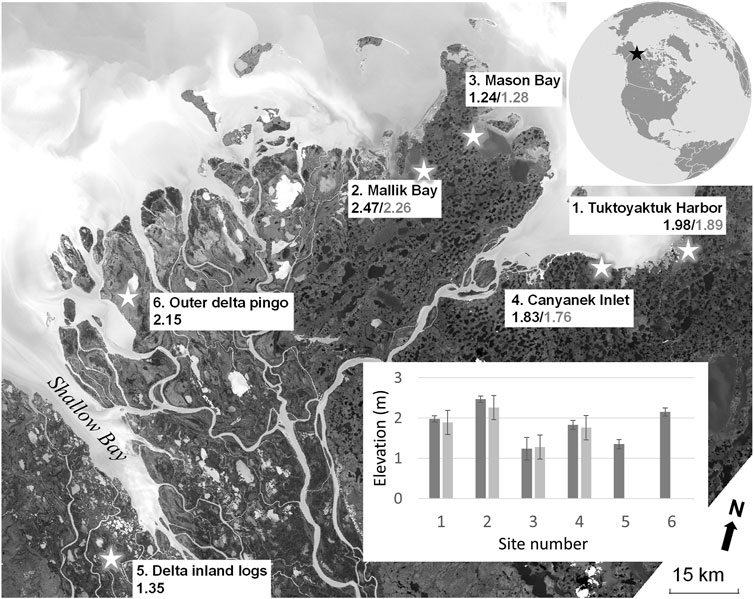
FIGURE 1. Map showing the location of study sites. Elevations of the upper driftwood found at each site by Harper et al. (1988) are written in gray and those by this study in black. All elevations are reported in meters and in reference to the CGVD2013 vertical datum. The inset graph indicates the elevations and total accumulated error bars in measurements from this study at each site (dark boxes) alongside Harper et al. (1988) estimated total error of 0.38 m in surge elevations (lighter grey boxes).
Coastal areas in this region are dominated by unconsolidated ice-rich permafrost that can be susceptible to periods of rapid erosion during storm surges (Dallimore et al., 1996; Kobayashi et al., 1999). Event driven erosion processes involve removal of the mantle of thawed sediment that typically forms in the early summer, exposing ice bonded permafrost in the cliff section. Wave action during storm surges can then form erosional niches that can be significantly elevated above mean sea level and reach up to 10 m back in the cliff section (Dallimore et al., 1996; Kobayashi et al., 1999). Mechanical failure of the overlying permafrost often occurs shortly after the niche formation causing rapid permafrost degradation and sediment transport to the beach area. Episodic erosional events contribute to shoreline recession, at times exceeding 10 m in a single year, or more than four orders of magnitude greater than the long-term annual average (Dallimore et al., 1996). The eroded material can result in high flux rates of organic carbon and nutrients that may result in increased greenhouse gas release to the sea and atmosphere (Fritz et al., 2017; Couture et al., 2018; Lapham et al., 2020).
Storm surges are also important as they influence a number of environmental processes. Due to the low-lying nature of the terrain along the Beaufort coast, storm surges can flood saline waters in low elevation coastal lakes and on flat lying terrestrial areas. The emplacement of saline water can result in die off of the tundra vegetation and change the aquatic and soil geochemistry (Hill et al., 2001; Emmerton et al., 2008; Pisaric et al., 2011; Lapka, 2013; Lantz et al., 2015). Storm surges have impacted large areas in the past 30 years with inundation events in the Mackenzie Delta extending up to 30 km inland (Lapka, 2013). Consequently, the terrestrial ecosystem may get significantly affected (Lantz et al., 2015). Substantial decreases in moose and waterfowl numbers have been observed by the Inuvialuit who live along the coast, impacting subsistence hunting and their traditional use of the land (Kokelj et al., 2012). However, some researchers have highlighted that in some settings, storm surges can also generate beneficial ecosystem responses (for example, Murphy et al., 2021 and references within).
Storm surges additionally pose a risk to low lying coastal settlements as they can damage infrastructure and valued cultural/archaeological sites as well as pose a hazard to residents (Reimnitz and Maurer, 1978; Kokelj et al., 2012; O’Rourke, 2017; Irrgang et al., 2019). The Hamlet of Tuktoyaktuk is particularly vulnerable (Henry, 1984; Couture et al., 2002; Forbes et al., 2005; Andrachuk and Smit, 2012), however, inland communities in the Mackenzie Delta (Akalvik, Inuvik, Tsiigehtchic) have also observed changes in water levels and saline conditions during storm surge events (Marsh and Schmidt, 1993; Kokelj et al., 2012). Storm surge hazard assessments for communities and infrastructure along the coast typically involve model simulation of the flooding extent and depth, using high resolution Digital Elevation Models (DEMs) such as those rendered by LiDAR surveys (Annis et al., 2020; Forbes et al., 2005 and, 2013; Hopkinson et al., 2011; Whalen et al., 2009). It is important to note, however, that in order to achieve reliable modeling results, accurate knowledge of past storm surge heights is needed as well as the historical frequency of these events. Strategies to protect coastal communities from flooding and enhanced erosion during storm surge events can include shore protection infrastructure as well as nature-based, non-structural countermeasures (Shah, 1982; Kavik-Axys Inc., 2010; Carter and Smith, 2011; Bridges et al., 2013; Lantuit et al., 2013; Liew et al., 2020).
Previous Field Observations of Storm Surges on the Southern Beaufort Coast
The earliest written observations of the height of a notable storm surge along the southern Beaufort coast were made in 1944 by residents living along the coast (Reimnitz and Maurer, 1978; Harper et al., 1988). Captain Larsen, of the RCMP vessel St. Roch, also arrived in Tuktoyaktuk harbor at the start of the storm on September 7, 1944 after returning from the first west to east navigation of the Northwest Passage (Larsen, 1948). Captain Larsen mentions the physical effects of storm surge erosion highlighting that “huge chunks of soil had been torn from the banks of the island, revealing old blue ice”. While there was some discrepancy between observers regarding the height of the storm surge, most estimates agree with Larsen, suggesting that this event may have reached 3 m above mean sea level along the Canadian and also parts of the Alaskan Beaufort coast (Reimnitz and Maurer, 1978). Of note, the 3.0 m storm surge elevation value is used in hazard assessments for this coastal area (GNWT Department of Municipal and Community Affairs, 2014). Anecdotal accounts also confirm that another major storm surge event reaching a similar estimated height, occurred between September 13 and 16, 1970. Despite the fact that the Canadian Hydrographic Service (CHS) had established a tide station in Tuktoyaktuk in 1961, the station was not operational during this storm. As a consequence, no definitive measurement could be made of its elevation. Indeed, the intermittent operation of the tide gauge at Tuktoyaktuk is problematic in terms of assessing storm surge events in along the southern Beaufort coast. The station has not been occupied during several notable storms. For instance, no record is available of a significant storm surge that occurred between September 24–26, 1999 with widespread flooding of the outer Mackenzie Delta (Pisaric et al., 2011; Kokelj et al., 2012; Lapka, 2013; Lantz et al., 2015). Table 1 shows the highest recorded storm surges at the Tuktoyaktuk tide gauge (Station 6485); the highest of which was measured at 2.23 m (Chart Datum (CD)) on October 4th, 1963. During 2018 and 2019, four separate events had observed elevations between 1.9 and 1.97 m (CD).
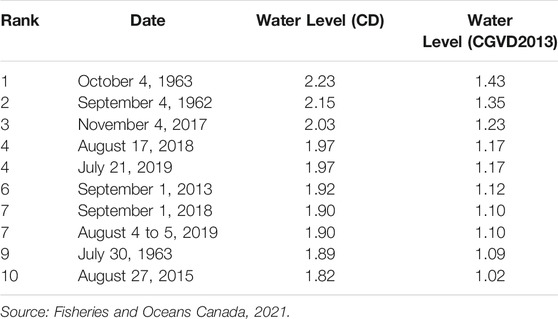
TABLE 1. Highest water levels recorded at the Tuktoyaktuk tide gauge (Station 6485) between November 1, 1961 to December 31, 2020.
Recognizing the inadequacies of the instrument record, past research efforts (Forbes and Frobel, 1985; Harper et al., 1988; Reimnitz and Maurer, 1978; 1979) have assessed maximum storm events by examining indirect indicators of the surge elevation. This has included measuring the height of the driftwood debris which is common in the area. Despite an absence of trees along the coast, driftwood from the Mackenzie River drainage accumulates in coastal embayments and forms large driftwood debris piles, and at other locations continuous lines of floated debris. These driftwood piles form in different coastal settings with accumulations up to 9 ha in size (Figure 2). During storm surges, floating debris typically repositions itself within the piles and lines. In some instances, the lower portions of the debris are mobilized back into the water and subsequently moved to new locations.
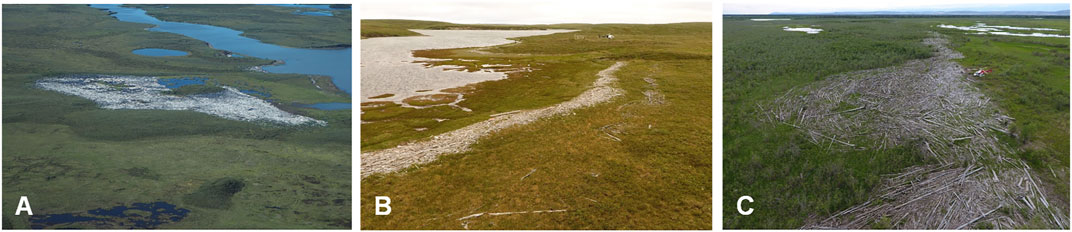
FIGURE 2. Examples of large driftwood accumulations along the southern Beaufort coast: large pile (9 ha) at Canyanek Inlet (A), Two distinct driftwood lines with the highest elevation consisting of older woody debris partially buried within the soil and vegetation at Mason Bay (B) and an inland site in the Mackenzie Delta with wood transported over 9 km from the coast (C).
Reimnitz and Maurer (1978 and 1979) completed the first published surveys of driftwood accumulations as an indicator of storm surge heights along the Beaufort coast in Alaska. They conducted airborne surveys of numerous driftwood lines and measured their elevations using traditional rod and level surveying techniques. As inferred for the Canadian coast, the highest debris were thought to have been deposited during the 1970 storm surge event. However, older rotting logs underneath the fresh logs at similar elevations appeared to have been emplaced by earlier events. Driftwood elevations were recorded to be 1.4–3.4 m above mean sea level (MSL) with a high variability depending on the coastal position. The maximum driftwood elevation of 3.4 m was only noted at one site.
In 1984, Forbes and Frobel (1985) examined driftwood accumulation sites along the Yukon and Northwest Territories coast with maximum wood debris height surveys conducted using rod and level surveying. The highest elevation from these surveys was recorded at Komakuk Beach (3.7 m MSL). However, it was noted that this measurement could have been influenced by possible wave run up or ice push. Near Tuktoyaktuk in a sheltered bay, a height was recorded at 2.4 m MSL (Forbes and Frobel, 1985).
More extensive work on mapping driftwood line locations and their heights was conducted in 1985 and 1986 (Harper et al., 1988). This research measured driftwood elevations at 24 locations in the Mackenzie Delta, Richards Island and the Tuktoyaktuk Peninsula. This work also used rod and level surveying to obtain measurements of heights relative to the tide height. The corresponding recorded tide heights measured at the Tuktoyaktuk tide gauge were used to adjust measured heights to MSL. The authors noted that the possible errors in their measurements could be 0.38 m, but they indicate were likely less than 0.1 m given that multiple sources of errors may be offsetting. As also observed by Forbes and Frobel (1985), a maximum storm surge elevation of 2.37 m above MSL was documented for the Tuktoyaktuk sites. This study did not ascertain if the 1970 storm was responsible for the highest driftwood elevation. The authors did note, however, that the upper floated driftwood was likely older than the 1944 event as these deposits contained no anthropogenic debris (i.e., processed lumber and plastics) and thus may have predated settlement in the area.
Methods
Field Sites
In light of the effects of ongoing climate change along the coast, a major goal of the present study was to re-assess storm surge elevations examined by Harper et al. (1988) and Forbes and Frobel (1985) to determine if any significant changes had occurred since their surveys were conducted in the 1980s. We also sought to assess UAV surveying techniques and determine maximum storm surge elevations relative to an orthometric datum. Rather than revisiting all of the sites previously surveyed, we chose four representative sites (see Figure 1): Tuktoyaktuk Harbour, Mallik Bay, Mason Bay, and Canyanek Inlet. Wave run up and ice push can increase the uncertainty in using driftwood as a proxy for maximum water levels, thus we focused mainly on protected embayment sites where the effects of these processes would be mitigated. Sites chosen had mixed debris of various sizes (tree stems and twigs) and care was taken to avoid areas where material seemed unevenly displaced. All sites contained driftwood that was clearly viewable from air. The tundra vegetation cover at the sites was sufficiently sparse to ensure that elevation determinations were of the ground surface next to woody debris. Two additional sites were selected in the outer Mackenzie Delta in an effort to assess spatial variability. The locations of the study sites, one site inland and another in the outer Mackenzie Delta, are shown on Figure 1, with descriptions of each site provided in Table 2.
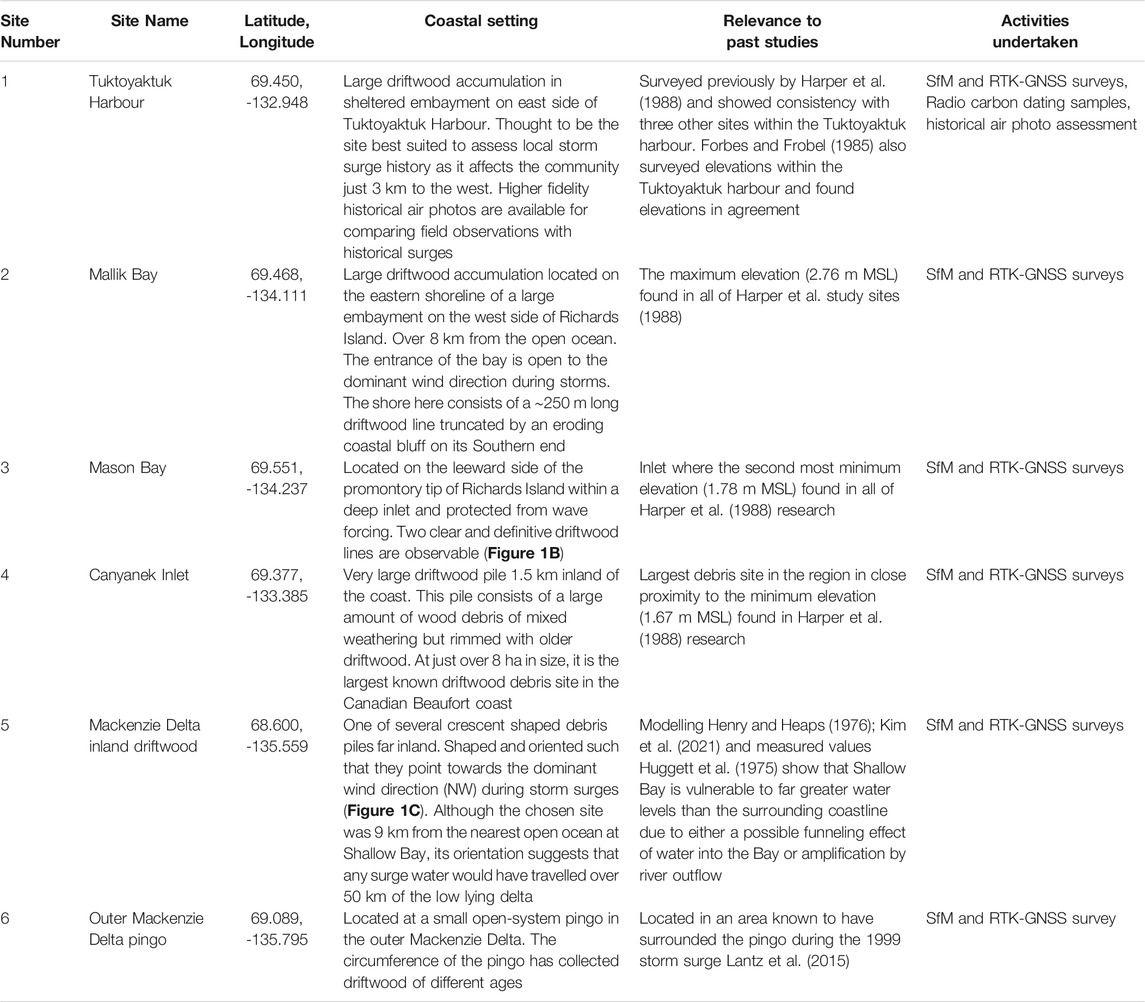
TABLE 2. Summary of driftwood research sites reported on in this paper.
Unoccupied Aerial Vehicle and Structure from Motion Surveying
Recent developments in UAVs, miniaturization of sensors, photogrammetric techniques and robotic automation have allowed the collection of systematic, high resolution aerial photographs to be rendered into a single mosaiced aerial image and a Digital Surface Model (DSM). A DSM refers to data that represents the elevation of the Earth incorporating those features on it—including vegetation and/or buildings. These outputs contain finite details that make them appropriate for detailed flood mapping and assessments (Hashemi-Beni et al., 2018; Annis et al., 2020). In mostly sparsely vegetated environments, the accuracy of the DSM is similar to result obtained by LiDAR surveys, but often with greater spatial resolution (Hashemi-Beni et al., 2018; Annis et al., 2020). The Mackenzie Delta, in particular, has seen several studies that have demonstrated the application of SfM processing from UAV photographs including the monitoring of coastal erosion (Lim et al., 2020), thermokarst activity (Van der Sluijs et al., 2018) and vegetation change (Fraser et al., 2016).
UAV surveys were conducted between July 8th and 14th, 2019 with the exception of the site at the Tuktoyaktuk Harbor that was also surveyed on August 14, 2018 and July 30, 2019. At each surveyed site, a DJI Phantom 4 UAV was autonomously flown in a gridded or “lawnmower” pattern at a constant altitude. Flight planning and control was achieved using the app, Pix4D Capture. All survey sites had flights that were programed to be at 50 m altitude and with 75% overlap in photos in both the along and side track directions. Images were processed using Pix4D Mapper Pro 3.2.23 software. Additional GNSS information was incorporated into the processing to improve the absolute accuracy of the model using high contrast targets placed on the ground during the surveys. The positions of these ground control points (GCPs), were identified in the images and the recorded coordinates digitally assigned to these positions. The final SfM products were saved in GeoTIFF format in Universal Transverse Mercator (UTM) Zone 8N projection and with 3 cm spatial resolution.
Driftwood debris heights were derived by comparing the orthophotos and DSM to identify the highest floated woody debris, multiple pixels identified as the ground and not tundra vegetation were then queried to determine the ground elevation values next to the wood. At each site, the positions of five of the highest pieces of driftwood were used to derive an averaged value.
Global Navigation Satellite System Surveying
Although SfM processing produces high-resolution outputs, these surveys alone are not accurately referenced to an established datum. To tie heights to a vertical datum requires separate GNSS measurements from the UAV’s GNSS system. To achieve this, the locations of the GCPs were measured using RTK-GNSS surveying. During surveys, a Spectra Precision SP80 GNSS kit was used. Base station locations were recorded for a minimum of 1 hours and more than 15 days later, post processed using the Natural Resources Canada online Canadian Spatial Reference System-Precise Point Positioning (PPP) application (Natural Resources Canada, 2020) to derive a final solution. The vertical elevations were outputted using a Canadian Geodetic Vertical Datum of 2013 (CGVD2013) vertical datum, a NAD83 CSRS reference frame and a 2010 Epoch. RTK rover measurements were all taken for a minimum of 2 minutes at a sampling rate of once every second. The recorded positions were only retained if the 2 min measurements showed a standard deviation of 3 cm or better in vertical values.
The GCPs measurements, in addition to being used to position the SfM model, were used to assess the quality of the accuracy of the models. Five to eleven GCPs were used in each survey as this number is considered robust enough to derive acceptable accuracy (Coveney and Roberts, 2017). Placement of the GCPs was focused on ensuring that at least one was placed at the minimum elevation (next to the water) and the maximum elevation of the survey area. The remaining GCPs were distributed evenly in the outer extents of the survey area but in locations that were certain to provide full varying view geometries in the photos. All UAV surveys, when in close proximity to the ocean, had a GNSS measurement at the current water level to compare with the measurement of the tide gauge in Tuktoyaktuk.
Global Navigation Satellite System and Tide Gauge Offset
Harper et al. (1988) and Forbes and Frobel (1985) measured the height of logs within driftwood accumulations relative to chart datum and they then corrected these values to MSL by applying an offset. The use of MSL is in reference to a tide gauge station’s observed mean water level over several years at that location. Unfortunately, the measurements determined by the Tuktoyaktuk tide gauge are vulnerable to the possibility that the reference datum may have changed during its operation. In 1991, the station was decommissioned and remained mostly nonoperational until 2003. The holding benchmark, that helps to ensure consistency of the reference elevations, was also changed in 1996 and 2003. As a result, it is difficult to ascertain if the same datum has been used during the history of operation of the station (Permanent Service for Mean Sea Level (PSMSL), 2021). Another concern in regard to reference elevations is the realization that the sea surface elevation is affected by global variations in gravity and thereby varies spatially. This concern can be overcome by considering elevations using orthometric datum heights. Orthometric heights, are based on a geoid model, and were established to help deal with the fact that MSL is not a level surface. The orthometric and local reference of MSL, although close in height, are different depending on location. As a result, the MSL determinations by Harper et al. (1988) and Frobes and Forbel (1985) require a mathematical offset and ideally an empirical check to allow conversion to an orthometric height.
Particular attention in this study was made to determine the offset of the Tuktoyaktuk tide gauge measurement recorded in chart datum to the orthometric elevation determination—referenced as the CGVD2013 datum. This determination allows for previous research elevations to be converted to an orthometric datum and thereby avoid confusion regarding MSL. With the heights measured in reference to the CGVD2013 datum, the elevations can be used with remote sensed elevation data commonly recorded in orthometric heights to help plan and engineer coastal management activities to protect communities and infrastructure from flooding and erosion. These measurements also help to calibrate storm surge return period predictions (Kim et al., 2021).
Figure 3 displays how an offset of 0.497 m between the recorded MSL values determined in Harper et al. (1988) and Forbes and Forbel (1985) research and CGVD2013 were derived. The value for the chart datum to MSL difference (Zo) is noted in a Harper unpublished report that states “…elevations are with respect to mean sea level (MSL), which is 0.3 m above chart datum for the Tuktoyaktuk tide gauge” (Harper, 1985) rather than the currently recognized offset of 0.35 m (Permanent Service for Mean Sea Level (PSMSL) 2021). This difference is possibly accounted for by a rising sea-level (Greenan et al., 2018; National Oceanic and Atmospheric Administration, 2020). The following equation was used to establish the offset of measured MSL values and CGVD2013:
where HmsltoCGVD2013 is the height of the Mean Sea Level (MSL) found in literature in reference to CGVD2013, HCD is the height of chart datum relative to the M039008 benchmark, Zo is the height of MSL relative to chart datum, and HCGVD2013 is the height of the benchmark relative to the CGVD2013 datum.
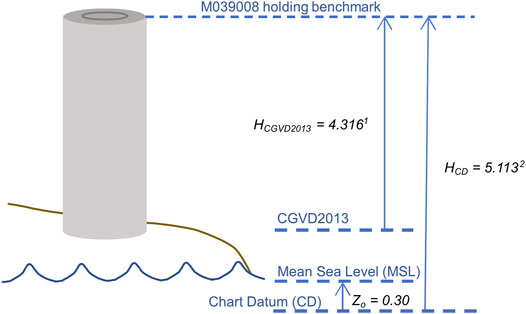
FIGURE 3. The derivation of Mean Sea Level (MSL) found in Harper et al. (1988) referenced to CGVD2013 requires consideration of the height of the holding benchmark relative to the tide gauge chart datum and the CGVD2013 datum. Values shown are in meters and derived from the following sources: 1Natural Resources Canada 2021 (Accessed January 22, 2021), 2Permanent Service for Mean Sea Level (PSMSL) (Accessed January 22, 2021).
To assess if these calculations apply empirically, on July 9, 2019, a 17-min occupation of water level was taken directly at the CHS Tuktoyaktuk tide gauge station and within 15 m of the continuously tracking GNSS station (TUKT RACS-CHS-M039007). The GNSS receiver was setup using a tripod with its leg points supported with small sections of plywood to prevent any movement due to the gravel substrate. During the acquisition, winds were calm. The positional logging of the receiver measuring the water level was set to record at an interval of every second (1 Hz). The recordings of the water level receiver were then post-processed using the continuously tracking GNSS station as the reference station. This station ordinarily records its position in 1-hour intervals, however, during the days of the surveys, the station was arranged to record at every second (1 Hz). Results of this method showed a standard deviation of position less than 1 mm. After applying the offset equation given above, the measured CGVD2013 value yielded a GNSS measurement that was 2 cm less than the tide gauge measurement. Using these determinations at Tuktoyaktuk, rather than individual measurements at our other study sites, reduced concerns that might be caused by spatial variability in the offset between tide and GNSS datum, as well as wind, tide and geometric effects.
Verification of Structure from Motion Methodology Based on 2019 Storm Surge Event
To verify if driftwood heights are an accurate representation of water level, the Tuktoyaktuk harbor site was photographed before and after two of the four largest storm surges recorded at the Tuktoyaktuk tide station with a maximum elevation measuring 1.97 m (CD) (Table 1). Comparison of the SfM model surveyed on August 14, 2018 with a model surveyed on July 30, 2019 found that the highest driftwood debris that were mobilized after the surge events were displaced to an elevation approximately 4 cm lower than measured at the tide gauge. This is not unreasonable and expected as the smaller pieces of driftwood typically range in diameter from 5 to 12 cm and their draft when floated would ground them at an elevation lower than the water level. The difference in water and driftwood elevation was considered an acceptable verification of the methodology used in this study.
Evaluation of Historical Aerial Photos
Harper et al. (1988), found that high level driftwood accumulations at sheltered sites contained no man-made debris such as cut wood, or plastics. In fact, according to Harper’s unpublished report (Harper, 1985) on the fieldwork conducted in 1985, the highest driftwood at two of the protected sites were speculated to be older than 50 years. Fortunately, repeat aerial photography of the Tuktoyaktuk area has been regularly undertaken. To establish if the driftwood and debris at the Tuktoyaktuk site were mobilized to their current positions during the 1970 event, we evaluated air photos available from Natural Resources Canada’s National Air Photo Library (NAPL) taken before (1968: Roll A20919 Photo 0062 Scale: 1:6,000) and after the storm surge event (1972: Roll A22961 Photo 0133 Scale: 1:12,000). The images were georeferenced, to enable comparison, by finding eight identifiable features found in the UAV-SfM orthophoto mosaic. Spatial resolution of the georeferenced photos was 11 and 7 cm for 1968 and 1972, respectively.
Results
Digital Surface Model Construction and Surface Properties
The SfM modelling produced high resolution and accurate data that were representative of the study sites providing DSM quality sufficient to accurately measure the maximum elevations of the ground next to the driftwood debris (Figures 4A,B). In comparison to historical vertical aerial photographs, the SfM orthophotos were of high fidelity with excellent colour, dynamic range and radiometric resolution (Figures 5, 6). This allowed assessment of colour change within the driftwood that were attributed to weathering effects of wood mobilized during different storm events. Individual tree stems, smaller branches, and floating debris could be discreetly identified, and their corresponding elevations accurately determined.
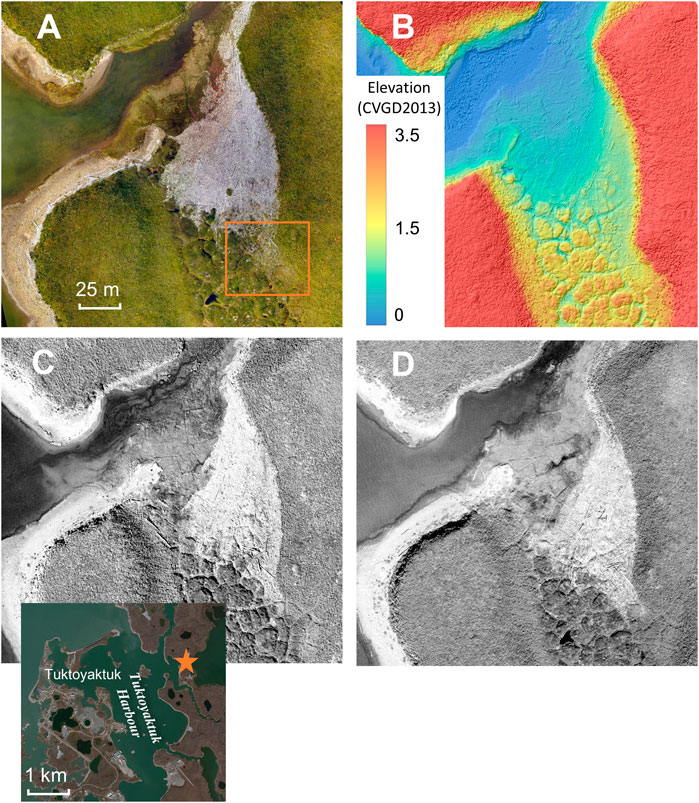
FIGURE 4. Examples of typical datasets used for analyses at driftwood study sites. Figures (A,B) were derived from 2018 drone surveys and SfM processing for the Tuktoyaktuk Harbor site. Figure A is an orthophoto and B is a Digital Surface Model (DSM). The color scale in elevation values in the DSM image range from 0 m (CGVD2013) in blue to 3.0 m in red. For comparison, panchromatic air photos from 1968 to 1972 (C,D) respectively are shown. The orange box in A displays the extent of Figure 5. The inset map in the bottom left corner shows the location of this driftwood accumulation in relationship to the Tuktoyaktuk harbor.
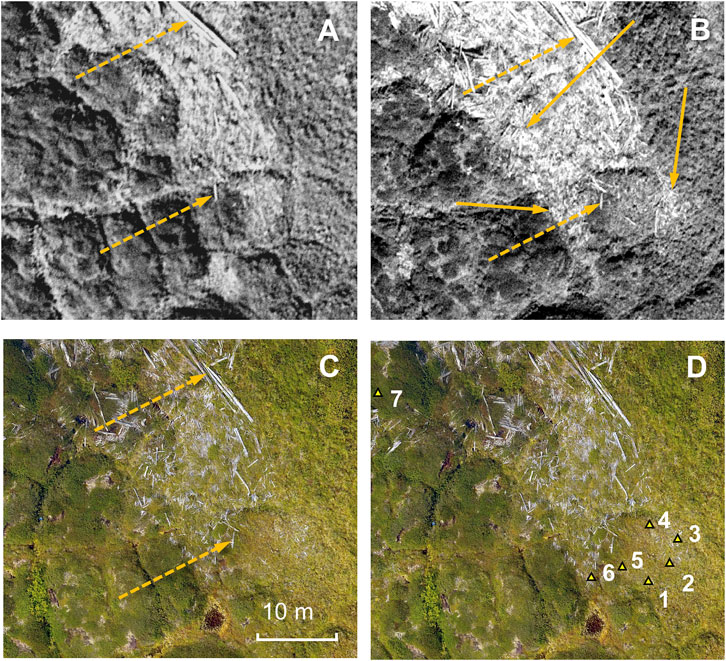
FIGURE 5. Air photos and orthophoto from (A) 1968, (B) 1972, and (C) 2018 of the upper most driftwood within the Tuktoyaktuk Harbor site show the displacement of wood before and after the 1970 storm surge. The dashed arrows, highlight how individualized pieces of wood can be tracked moving upward (down and right in image) through the driftwood accumulation and have remained in place in 2018. Areas of newly deposited driftwood are shown with the solid arrows in the 1972 image. The extent of these figures are marked as an orange box in Figure 4. Figure D displays the location of radiocarbon dating samples taken from the upper most driftwood. Marked locations correspond to samples shown in Table 4.
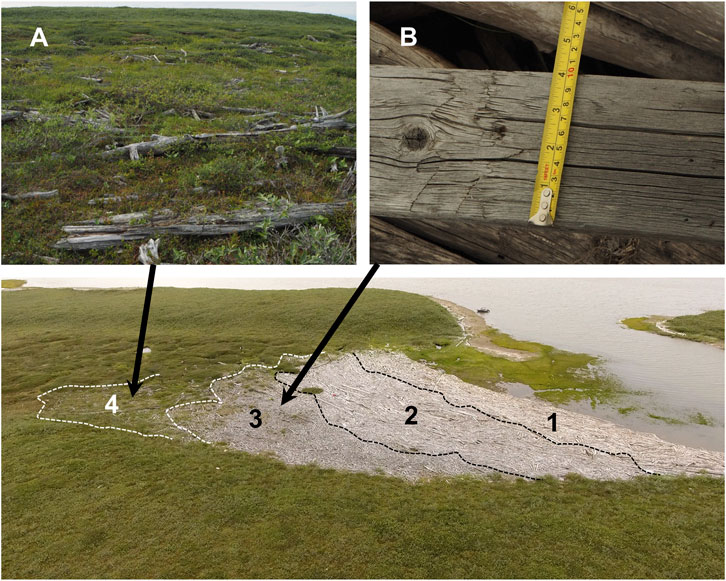
FIGURE 6. The layers of differing ages of wood and anthropogenic debris at the Tuktoyaktuk Harbor site are visible from the air. The youngest material fronts the pile (1), whereas the second portion consists of large amounts of lumber and plywood with limited amounts of plastic items (2). Above this is the third layer with homogenously similar weathered wood and contains the rare true dimensional lumber pieces (3 and upper right photo (B)). The upper most location consists of only sparsely distributed heavily weathered driftwood that is embedded into the tundra surface (4 and upper left photo (A)).
The accuracy of SfM modelled data is predominately controlled by the density of 3D points found through the process of matching identifiable features in the UAV images. Table 3 displays point density values for the different surveyed areas. Point density for most sites was high (>500/m2). Areas within the survey site containing ponded water and tall (∼2 m) or dense vegetation produced lower densities. These are features known to be difficult for the SfM processing to resolve. However, the driftwood itself, which was the target of our study, yielded high point densities. Survey sites that contained higher point densities in turn resulted in higher reported positional accuracy.
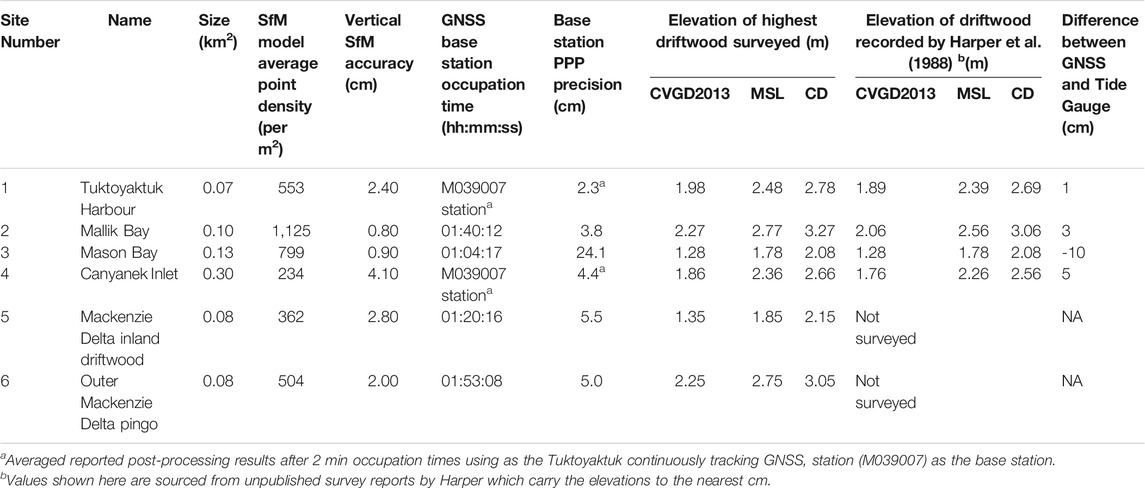
TABLE 3. Reported results for each surveyed site.
The best modelled accuracy was found in the Mason and Mallik Bay survey sites, with greater than 1 cm vertical accuracy. Here the imagery was dominated by driftwood with short vegetation and bare ground. The Canyanek Inlet site, which had the lowest point density (234 points/m2), contained somewhat denser and relatively taller tundra vegetation than the other sites and therefore yielded a vertical SfM model accuracy of only 4 cm.
The largest source of potential error is caused by the occupation of a GNSS base station. Because of the remoteness of sites and the reliance on using a helicopter to get to sites, the amount of available time on the ground for occupying and recording the GNSS station was limited. Consequently, the standard deviation of the vertical measurements detailed in the PPP solution reports for each of the base stations varied from 4 to 6 cm. The exception is the measurement at Mason Bay where the shortest occupation time of just over an hour and poor satellite geometries resulted in a reported precision of 24 cm within 95% of the measured values.
To further confirm the accuracy of each of the SfM models, pixels in the orthophotos that were identified as the water’s edge were queried for the associated elevation from the DSM. The average of ten heights was noted. These values were then compared to the elevation recorded at the Tuktoyaktuk tide gauge during the time of the survey (corrected for the datum offset). This procedure allowed assessment of the model based on a reference to the tide gauge. The differences in these values are reported in Table 3. Differences do occur of up to 10 cm at Mason Bay but 3–5 cm elsewhere. These differences can be explained by the contributing errors associated with RTK-GNSS rover measurements and the base station PPP post processed recordings.
Driftwood Elevations
With the GNSS and tide gauge offset determined, the maximum driftwood elevation extracted from the SfM models at each site can be reported in orthometric CGVD2013 and compared with the MSL datum used in previous studies. These values can be seen in Figure 1 and Table 3. The driftwood elevations ranged between 1.24 and 2.34 m (CGVD2013) and differed from Harper’s elevations only between 4 and 10 cm. The inset graph in Figure 1 displays the total error from the various survey components in this study as compared to Harper’s estimated error of 0.38 for each site. Of importance to the Hamlet of Tuktoyaktuk, the elevation of the driftwood in the nearby sheltered harbor site was found to be 1.98 m (CGVD2013), 9 cm higher than Harper’s measurements after conversion from chart datum to CGVD2013. This difference and those of the other three surveyed locations likely reflects the natural variability of driftwood elevations and the difference in survey techniques between studies. The previously published values were derived by walking through the sites, identifying the upper limit floated debris, measuring up to seven positions, and averaging their heights. Given the low-lying nature of the area, identifying the highest driftwood is challenging, as the difference in heights is difficult to discern from the ground. The UAV derived models, on the other hand, afford desktop analysis of the entire site and the identification of woody debris that might have otherwise been missed or assumed to be lower in the field.
Comparison of the observed water level in the SfM data with the observed tide gauge value ranged from 1 to 10 cm. The largest difference occurred at Mason Bay likely due to our shorter (just over an hour) occupation and associated low reported precision of the GNSS base station. Combined accuracy from the SfM modelling and the RTK GNSS suggests that measurements derived from our data ranged (excluding Mason Bay) between 2 and 9 cm depending on site location.
Radiocarbon Dating
As observed by earlier researchers, we also found that the highest-level wood debris visibly appeared to be quite old as it was fragile from weathering processes and in some cases partly embedded into the tundra soil and vegetation. This debris, despite its condition, was intact and easily recognized to consist of tree stems and branches. No cut lumber or manufactured debris was found. To assist in the interpretation of the age of this debris, seven samples of wood material were collected from the accumulation pile at the Tuktoyaktuk Harbor survey site in 2019 and submitted for radiocarbon dating. All samples were collected from the visibly oldest driftwood selected from areas within 0.15 m vertically of the highest elevation debris line found in a DSM produced from the 2018 UAV-SfM survey. The location of each sample was recorded using the RTK-GNSS system. Samples consisted of cut sections producing tree stem/branch “cookies” of 5–10 cm diameter. Dating of the outermost portion of the driftwood was performed at the A.E. Lalonde AMS Laboratory (University of Ottawa) with calibration accomplished using the program OxCal v4.3 (Ramsey, 2009) and the IntCal13 calibration curve (Reimer et al., 2013).
The results of the radiocarbon dating of the samples taken at the locations shown in Figure 5D are in Table 4. As is typically found in organic samples dated since the Industrial Revolution, large error bars were assigned to the calibrated age determinations (ie. +/- 210–257 years). However, the minimum age determinations for the driftwood ranged from 1915 to 1938 (cal AD). It should be noted that these age determinations are for when the trees that these wood pieces were derived from died, rather than the date of a particular storm surge. It is well known that floated wood accumulating in coastal driftwood accumulations has long transit times from its source to where it is emplaced along the Beaufort coast (Eggertsson, 1994; Sander et al., 2021).
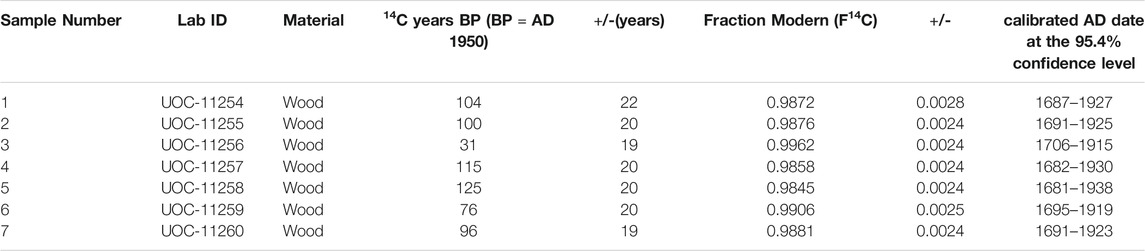
TABLE 4. Radiocarbon sample dating results of the tree stem/branch “cookies” taken at the Tuktoyaktuk Harbor site. The locations of the numbered samples can be found in Figure 5D. Reported dates in the table are from the A.E. Lalonde AMS laboratory analysis report.
Discussion
Regional Variability
Maximum driftwood elevations for the four study sites that were co-located with the Harper et al. (1988) study were all within 10 cm of their determined elevations (see Table 2) attesting to the rigor of their field surveying. The highest driftwood elevations were found at Mallik Bay (2.47 m CGVD2013) and Tuktoyaktuk (1.98 m CGVD2013). However, since the Mallik Bay site has a westerly fetch of ∼4.5 km, it may have experienced storm wave action that somewhat elevated the wood debris positions. Conversely, the Tuktoyaktuk site is sheltered behind Tuktoyaktuk island and within an isolated bay (see inset map in Figure 4). Each of the resurveyed sites contained visual layering of different aged driftwood that changed in character with elevation. As shown on the oblique photo in Figure 6, the stratified appearance of the driftwood was evident both from the air and on the ground. The layering was mapped in detail at the Tuktoyaktuk site where the youngest layer close to the water (0–0.5 m CGVD2013) consisted mainly of tree stems, twigs, and branches, with embedded plastics, lumber and other manufactured debris throughout. The wood debris was very fresh looking and had not experienced significant weathering. The next layer (∼0.5–1.1 m CGVD2013) contained weathered driftwood with significant amounts of lumber and plywood, but much less plastic debris. Wood in this layer was stacked on top of one another deeper than that of the entire accumulation. The third recognizable layer (∼1.1–1.3 m CGVD2013) consisted of smaller wood debris that was notably more weathered (grey color with some decomposition on the surface of wood debris). Manufactured debris in this layer was notably sparser and consisted solely of sawn logs and cut lumber of true dimensions (see Figure 6) which we assume pre-date ∼1969 when lumber mills in western Canada reduced their cutting dimensions. The driftwood in the uppermost layer (∼1.3–1.98 m CGVD2013) was extensively weathered and contained no manufactured debris. Driftwood here was found partially buried in the tundra soil and often beginning to become overgrown with the low tundra vegetation (see Figure 6).
Further insights into the stratigraphy of driftwood developed by storm surges were revealed by comparing the August 2018 with the July 2019 orthophotos. Between these dates, three significant storm surges were recorded at the Tuktoyaktuk tide gauge varying from 1.10 to 1.17 m (CGVD2013) (see Table 1). Mobilized wood within the accumulations changed position consistent with the layered stratigraphy. The two lowermost layers from 0 to 0.1 m were extensively modified. The lowest elevation driftwood (<∼0.8 m) was completely removed and the remaining upper portion of this layer extensively reoriented. The next stratigraphic later from 1.1 to 1.3 m (CGVD2013) elevation was only partly modified with the mainly small shifts in positions laterally and upward in elevation. No change was detected in the wood debris above 1.3 m (CGVD2013) elevation nor in the positions of wood in the uppermost layer from the 1972 aerial photos to present. The larger diameter driftwood above the 1.3 m (CGVD2013) mark may be stabilized by their partial emplacement in the sediment and/or surrounding low tundra vegetation consisting largely of grasses (see Figure 6), however, no observations were made of either emplaced pieces of wood debris to have moved or new wood deposited above this elevation. This stratigraphic approach to evaluating the driftwood accumulations seems to be consistent with the summary of historical storm surge elevations measured on the tide gauge at Tuktoyaktuk. While the recording interval of the Tuktoyaktuk tide gauge is intermittent, the largest recorded storm events since 1970 have not exceeded 1.3 m (CGVD2013). The general conclusion from both the stratigraphic studies and the historical record is therefore that modest magnitude storm surges reaching this elevation are arguably more frequent in the present climate and sea ice regime along the southern Canadian Beaufort coast, but higher magnitude events have not occurred since 1970. This does not preclude that more frequent and severe storm surges may be more likely in the future as suggested by some authors (Manson and Solomon, 2007; Kokelj et al., 2012; Vermaire et al., 2013; Greenan et al., 2018). However, it does highlight the importance of continuing and even expanding tide gauge and weather observations as a basis to improve the instrument record. Future projections of storm frequency and intensities are based on historical observational data for which the Arctic is limited both temporarily and spatially. This lack of available data reduces the confidence in extreme high-water event occurrence predictions (Greenan et al., 2018).
The two Mackenzie Delta driftwood accumulations that had not been previously studied, had a different character than the sites described above. While recent storm surge hindcast modeling by Kim et al. (2021) suggested that a storm surge would produce water levels 1 m higher in this region as compared to surge heights in Tuktoyaktuk, we found that the driftwood elevations were lower for the inland site (1.35 m CGVD2013) and higher for the outer Delta site (2.25 m CGVD2013). While nearby Shallow Bay may experience more intense storm surges because of the orientation of the embayment relative to the storm winds from the northwest, the height of the driftwood levels inland away from the open ocean is much diminished. Given the proximity of these sites to channels of the Mackenzie River, there is potential that driftwood accumulations could have been influenced by high water levels during the freshet which can cause extensive flooding in the outer delta area (Yang et al., 2015). As the woody debris on the flanks of the inland pingo site had a discernable stratigraphy and was at a higher elevation on the northwest side versus the southeast side, this seems consistent with storm surge inundation from the northwest rather than the effects from the freshet. However, the inland driftwood site (site 5 on Figure 1) contained abundant manufactured debris of various ages and no discernible stratigraphy within the driftwood. While the orientation of the driftwood accumulations also suggested emplacement by storm surge influence from the northwest, the mixed debris and lack of stratigraphy may indicate some mobilization and reworking of the debris pile by flooding during the freshet. Of note however, if the accumulation resulted from a storm surge, overland flooding may have extended approximately 50 km overland.
The discussion above highlights some of the challenges of estimating storm surge elevations based upon displaced wood debris heights and concerns that secondary movement subsequent to the storm surge emplacement may have occurred. We concur with others who have noted that it is important to carefully consider the unique coastal setting of each site including the potential for wave run-up and ice push, human activity, seasonal river flooding, the abundance and character of driftwood (buoyance and draft), as well as the distance the debris has travelled (Reimnitz and Maurer, 1979; Harper et al., 1988). However, it is reassuring that Kim et al. (2021) note that there is general agreement in the driftwood elevation measurements taken by Harper et al. (1988) and their hindcast modelling of a storm surge event that occurred on August 23, 1986 in the Mackenzie Delta and Beaufort coast.
Interpretation of Extreme Storm Surge Events at Tuktoyaktuk
One important practical goal of this study was to provide accurate information on the elevation and the return period of large magnitude storm surges pertinent to assessing storm geohazards in the Hamlet of Tuktoyaktuk. This small, low-lying community has experienced prolonged coastal erosion and periodic flooding during storm surges throughout its history. As mentioned previously, many researchers have highlighted that recent climate change is likely to cause increased magnitude and frequency of these storm surges (Manson and Solomon, 2007; Kokelj et al., 2012; Vermaire et al., 2013; Greenan et al., 2018). Current estimates of sea-level rise at Tuktoyaktuk vary between 2.5 and 2.75 mm per year (Greenan et al., 2018; National Oceanic and Atmospheric Administration, 2020) which would suggest an increased risk of higher elevation storm surges over time.
We found that the highest driftwood at the Tuktoyaktuk Harbor site, and each of the sites co-located with the Harper et al. (1988) sites, was very old with weathered but intact wood, and partially embedded in the tundra. This wood, although weathered, was still identifiable as natural and having not been milled or altered with an axe or saw. Harper et al. (1988) was not able to constrain the age of the event that emplaced these pieces of wood, suggesting that the highest-level wood debris could be due to the 1970 or possibly the 1944 storm surge. We assessed aerial photographs from 1968 to 1972 to consider the timing. As shown in Figures 4, 5, comparison of the geo-referenced photos and the 2018 DSM confirmed that the wood at the highest elevation 1.85 m (CGVD2013) was present in 1968 (see Figure 4C). At least one storm surge prior to this date had reached this elevation. However, it is apparent in the 1972 aerial photograph (Figures 4D; Figure 5C) that some of this driftwood was re-oriented and moved 8 m further upslope with an associated vertical movement up to 13 cm in elevation. We can also confirm that the age of the upper debris is not necessarily indicative of the age of the surge. The 1970 event simply floated and raised the highest-level wood that was long in place before it was mobilized to their post surge positions. We therefore attribute the reported storm surge in 1970, which reached 1.98 m (CGVD2013), as the highest elevation storm surge recorded in the driftwood debris in this area.
As no suitable aerial photographs prior to 1968 were available to document the older storm surge, we sampled seven representative driftwood pieces to attempt to constrain the ages of the high elevation driftwood using radiocarbon dating (as summarized in Table 4). Interpretation of the dating results is problematic because the young age of the organic carbon yields large error bars in the AMS dating method. However, it is clear that the wood is indeed old with upper bounds of the calibrated ages all being older than 1938. Using this date as the minimum age of the wood and given that the resident time of the floating driftwood before they were deposited in the driftwood accumulation could be significant (see references and discussion within Murphy et al., 2021), we conclude that it is likely, that the emplaced driftwood at 1.85 m (CGVD2013) was moved to their positions in the 1968 air photo by the 1944 storm surge reported by residents and Captain Larsen. However, the elevation was substantially less than the reported ∼3 m elevation estimates made at the time. The 1970 storm surge then moved these already deposited driftwood pieces into their present locations. In summary, over the past 75 years there have been only two historical storm surges that reached ∼2 m (CGVD2013) elevation and both of these occurred before 1971.
Another consideration that motivated this study was the possibility that the highest driftwood found within the accumulations along the Beaufort coast may have been emplaced by other extreme high-water events. Considering that the area is within an active seismic setting, Leonard et al. (2012) speculated that there is potential for large tsunamigenic earthquakes along the southern Beaufort coast. Empirical modelling by Leonard et al. (2014), found that a large thrust earthquake (Mw 8.4), could result in a tsunami run-up of ≥3 m along the coast of the Tuktoyaktuk Peninsula. In addition, recent marine geology and multibeam studies have also shown that the upper slope of the Beaufort Sea, ∼120 km north of Tuktoyaktuk, is a site where numerous large submarine mass failures have occurred in the past (Mosher, 2009; Cameron and King, 2019; Paull et al., 2021; Riedel et al., 2021). Some of these events appear to be within the last 1,000 years (Cameron and King, 2019; Paull et al., 2021) and potentially of sufficient size to trigger a tsunami.
As discussed above, the air photos before and after the 1970 storm surge allow definitive determination that the highest driftwood occurrences at the Tuktoyaktuk harbor site were deposited by a 1970 storm surge and that the older driftwood at a similar elevation most likely was emplaced from a storm surge in 1944. Both the 1970 and 1944 events were coincident with storms, with no observed ground shaking from an earthquake. However, given the observed wood decomposition and incorporation within the tundra cover (see difference between Figures 5B,C), it is plausible that earlier events could be recorded with woody debris that are now buried. An observation along the Beaufort coast in Alaska (Reimnitz and Maurer, 1979) of woody debris estimated to be 70–200 years old found at an elevation 1–2 m above the 1970 storm surge driftwood debris support this possibility.
Conclusion
In this study, we use UAV and SfM methods to revisit four coastal driftwood accumulation study sites that were first appraised in 1985–86 by Harper et al. (1988) and add two new sites in the Mackenzie Delta to consider if extreme storm surge magnitudes along the southern Beaufort coast are more substantive in today’s climate setting than in the past. This assessment provides a basis for the determination of the height and return period for maximum storm surge events and also assessment of the stratigraphic record preserved from more recent moderate elevation storm surges. We establish the elevations in a vertical datum (CGVD2013) that is relevant for modern hazard assessment in the Tuktoyaktuk and Mackenzie Delta area.
Maximum driftwood elevations showed spatial variability across surveyed sites. The site nearest the community of Tuktoyaktuk measured a maximum elevation of 1.98 m (CGVD2013). At this same site, UAV/SfM observations before and after recent storm events (between August 2018 to July 2019) discern four distinct stratigraphic units of different debris composition and weathering characteristics within the driftwood (0–0.5 m; 0.5–1.1 m; 1.1–1.3 m; 1.3–1.98 m CGVD2013). Air photos, taken shortly before and after the storm surge in 1970, confirm that the existing upper driftwood was mobilized and set in its current positions by this event. However, this event mobilized driftwood that was already in place at 1.85 m. Based on a 1938 minimum radiocarbon age determined on wood sampled from this elevation, we conclude that this previous event may have been associated with a 1944 storm surge, which was previously reported on from anecdotal observations.
No storm surges of a magnitude approaching that of the 1944 and 1970 events have occurred to 2021. Tide gauge records and our stratigraphic studies of driftwood debris indicate that more frequent, moderate elevation storm surges that reach elevations of ∼1.3 m (CGVD2013) have prevailed in the last decade as compared to those recorded in past decades.
This research demonstrates the utility of the SfM/UAV method for high resolution and accurate determinations of ground surface elevations associated with debris grounded by historical storm surges. While our study was in the local Mackenzie Delta area, the widespread occurrence of ground debris along the Yukon and Alaskan coast offers the opportunity to extend this technique to the surrounding region or to document the regional variability in storm surge elevations after a future event. While the SfM/UAV technique is gaining widespread use in the geosciences, our experience suggests that this technique may be appropriate for wide range of periglacial process studies. We presently are assessing the utility of the SfM/UAV method for permafrost subsidence, uplift, and creep studies. In terms of coastal risk assessment, our work demonstrates the importance of continuous long-term tide gauge and GNSS monitoring as a basis for understanding the frequency and magnitude of future storm surge events. Given the importance of these events and their regional variability, a distributed monitoring network along the Canadian and Alaskan Beaufort coast would be highly valued.
Data Availability Statement
The raw data supporting the conclusions of this article will be made available by the authors upon request, without undue reservation.
Author Contributions
RM and SD designed the study, organized the field operations, and conducted the collection and interpretation of the data. Aside from the radiocarbon dating, RM performed all data analysis. RM wrote the initial manuscript with contributions to the writing and revision from SD. Both authors gave their approval to the final version of the manuscript.
Funding
The research described in this paper was supported by the Geological Survey of Canada through its Public Safety Geoscience Program and the Program for Energy Research and Development. The Polar Continental Shelf Program also provided logistical support.
Conflict of Interest
The authors declare that the research was conducted in the absence of any commercial or financial relationships that could be construed as a potential conflict of interest.
The handling editor is currently organizing a Research Topic with one of the authors SD.
Publisher’s Note
All claims expressed in this article are solely those of the authors and do not necessarily represent those of their affiliated organizations, or those of the publisher, the editors, and the reviewers. Any product that may be evaluated in this article, or claim that may be made by its manufacturer, is not guaranteed or endorsed by the publisher.
Acknowledgments
We thank Dustin Whalen from the GSC for his efforts to advance coastal research at Tuktoyaktuk and the residents of the Hamlet of Tuktoyaktuk who have encouraged our work. Michelle Côté assisted with permitting and community consultation. Mathew Dare of the Aurora Research Institute collected a series of aerial photographs that were used to interpret the 2019 driftwood positions at Tuktoyaktuk. Andrew Schaeffer provided field assistance, valued critical comments on the manuscript and acted as an internal reviewer of the paper. Finally, this study has benefited from the comments and suggestions made by three critical reviewers and the guidance provided by the coordinating editor. NRCan contribution number / Numéro de contribution de RNCan: 20210424.
References
Andrachuk, M., and Smit, B. (2012). Community-Based Vulnerability Assessment of Tuktoyaktuk, NWT, Canada to Environmental and Socio-Economic Changes. Reg. Environ. Change 12 (4), 867–885. doi:10.1007/s10113-012-0299-0
Annis, A., Nardi, F., Petroselli, A., Apollonio, C., Arcangeletti, E., Tauro, F., et al. (2020). UAV-DEMs for Small-Scale Flood Hazard Mapping. Water 12 (6), 1717. doi:10.3390/w12061717
Bridges, T., Henn, R., Komlos, S., Scerno, D., Wamsley, T., and White, K. (2013). Coastal Risk Reduction and Resilience: Using the Full Array of Measures. Available at: https://usace.contentdm.oclc.org/digital/collection/p266001coll1/id/5275/(accessed October, 2021).
Cameron, G. D. M., and King, E. L. (2019). Mass-Failure Complexes on the Central Beaufort Slope, Offshore Northwest Territories. Geol. Surv. Can. Open File. 8356, 40. doi:10.4095/314644
Carter, R. A., and Smith, H. N. (2011). “Challenges of Coastal Engineering in Alaska,” in Proc. 2011 Solutions to Coastal Disasters Conf, Anchorage, Alaska, 286–297. doi:10.1061/41185(417)26
Cohen, J., Screen, J. A., Furtado, J. C., Barlow, M., Whittleston, D., Coumou, D., et al. (2014). Recent Arctic Amplification and Extreme Mid-Latitude Weather. Nat. Geosci 7 (9), 627–637. doi:10.1038/ngeo2234
Comiso, J. C., Parkinson, C. L., Gersten, R., and Stock, L. (2008). Accelerated Decline in the Arctic Sea Ice Cover. Geophys. Res. Lett. 35 (1), 1–6. doi:10.1029/2007GL031972
Couture, N. J., Irrgang, A., Pollard, W., Lantuit, H., and Fritz, M. (2018). Coastal Erosion of Permafrost Soils Along the Yukon Coastal Plain and Fluxes of Organic Carbon to the Canadian Beaufort Sea. J. Geophys. Res. Biogeosci. 123 (2), 406–422. doi:10.1002/2017JG004166
Couture, R., Robinson, S., Burgess, M., and Solomon, S. (2002). Climate Change, Permafrost, and Community Infrastructure: A Compilation of Background Material from a Pilot Study of Tuktoyaktuk, Northwest Territories. Geol. Surv. Can. Open File. 3867, 83. doi:10.4095/213753
Coveney, S., and Roberts, K. (2017). Lightweight UAV Digital Elevation Models and Orthoimagery for Environmental Applications: Data Accuracy Evaluation and Potential for River Flood Risk Modelling. Int. J. Remote Sensing 38 (8-10), 3159–3180. doi:10.1080/01431161.2017.1292074
Dallimore, S. R., Wolfe, S. A., and Solomon, S. M. (1996). Influence of Ground Ice and Permafrost on Coastal Evolution, Richards Island, Beaufort Sea Coast, N.W.T. Can. J. Earth Sci. 33, 664–675. doi:10.1139/e96-050
Eggertsson, O. (1994). Mackenzie River Driftwood—A Dendrochronological Study. Arctic 47, 128–136. Available at: http://www.jstor.org/stable/40511551 (accessed January, 2021).
Emmerton, C. A., Lesack, L. F. W., and Vincent, W. F. (2008). Mackenzie River Nutrient Delivery to the Arctic Ocean and Effects of the Mackenzie Delta during Open Water Conditions. Glob. Biogeochem. Cycles 22 (1), a–n. doi:10.1029/2006GB002856
Fisheries and Oceans Canada (2021). Data from: Station Inventory Data. Station 6485. Available at: https://www.isdm-gdsi.gc.ca/isdm-gdsi/twl-mne/inventory-inventaire/interval-intervalle-eng.asp?user=isdm-gdsi®ion=CA&tst=1&no=6485&ref=maps-cartes (Accessed April 10, 2021).
Forbes, D. L., and Frobel, D. (1985). Coastal Erosion and Sedimentation in the Canadian Beaufort Sea. Geol. Surv. Can. 85-1B, 69–80. doi:10.4095/120230
Forbes, D. L., Whalen, D. J. R., Jacobson, B., Fraser, P., Manson, G. K., Couture, N. J., et al. (2013). “Co-design of Coastal Risk Assessment for Subsistence Infrastructure in the Inuvialuit Settlement Region, Western Arctic Canada [Conference Poster],” in ArcticNet Annual Science Meeting 2013, Halifax, NS, Canada. Available at: https://arcticnetmeetings.ca//asm2013/docs/full_program.pdf (Accessed December 8, 2020).
Forbes, D. L., Whalen, D., Solomon, S. M., and Manson, G. K. (2005). “First Applications of Airborne Lidar for Arctic Coastal Mapping: Potential Contributions to Building Community Resilience under Climate Change [Conference Poster],” in ArcticNet Annual Science Meeting 2005, Banff, AB, Canada. Available at: http://www.arcticnet.ulaval.ca/pdf/posters_2005/forbes_et_al.pdf (Accessed January 30, 2020).
Fraser, R. H., Olthof, I., Lantz, T. C., and Schmitt, C. (2016). UAV Photogrammetry for Mapping Vegetation in the Low-Arctic. Arctic Sci. 2 (3), 79–102. doi:10.1139/as-2016-0008
Fritz, M., Vonk, J. E., and Lantuit, H. (2017). Collapsing Arctic Coastlines. Nat. Clim Change 7 (1), 6–7. doi:10.1038/nclimate3188
GNWT Department of Municipal and Community Affairs (2014). Northwest Territories Hazard Identification Risk Assessment. Available at: http://www.maca.gov.nt.ca/wp-content/uploads/2014/04/Northwest-Territories-Hazard-Identification-Risk-Assessment.pdf (accessed September, 2020).
Graham, R. M., Cohen, L., Petty, A. A., Boisvert, L. N., Rinke, A., Hudson, S. R., et al. (2017). Increasing Frequency and Duration of Arctic Winter Warming Events. Geophys. Res. Lett. 44 (13), 6974–6983. doi:10.1002/2017GL073395
Greenan, B. J. W., James, T. S., Loder, J. W., Pepin, P., Azetsu-Scott, K., Ianson, D., et al. (2018). “Changes in Oceans Surrounding Canada: Chapter 7,” in Canada’s Changing Climate Report. Editors E. Bush, and D. S. Lemmen (Ottawa, ON: Government of Canada), 343–423. Available at: https://www.nrcan.gc.ca/sites/www.nrcan.gc.ca/files/energy/Climate-change/pdf/CCCR-Chapter7-ChangesInOceansSurroundingCanada.pdf (accessed January, 2021).
Harper, J. R. (1985). Final Report Field Surveys of Log Debris Lines in the Tuktoyaktuk Vicinity Implications to Storm Surge Evaluation. Unpublished report. Sidney, Britsh Columbia: Dobrocky Seatech Ltd.
Harper, J. R., Henry, R. F., and Stewart, G. G. (1988). Maximum Storm Surge Elevations in the Tuktoyaktuk Region of the Canadian Beaufort Sea. Arctic 41, 48–52. doi:10.14430/arctic1691
Hashemi-Beni, L., Jones, J., Thompson, G., Johnson, C., and Gebrehiwot, A. (2018). Challenges and Opportunities for UAV-Based Digital Elevation Model Generation for Flood-Risk Management: A Case of Princeville, North Carolina. Sensors 18 (11), 3843. doi:10.3390/s18113843
Henry, R. F. (1984). Flood Hazard Delineation at Tuktoyaktuk. Institute of Ocean Sciences, Department of Fisheries and Oceans. Available at: http://publications.gc.ca/collections/collection_2012/mpo-dfo/Fs97-17-19-eng.pdf (accessed January, 2021).
Henry, R. F., and Heaps, N. S. (1976). Storm Surges in the Southern Beaufort Sea. J. Fish. Res. Bd. Can. 33 (10), 2362–2376. doi:10.1139/f76-283
Hill, P. R., Hequette, A., Ruz, M. H., and Jenner, K. A. (1991). Geological Investigations of the Canadian Beaufort Sea Coast. Geol. Surv. Can. Open File 2387, 348. doi:10.4095/132386
Hill, P. R., Lewis, C. P., Desmarais, S., Kauppaymuthoo, V., and Rais, H. (2001). The Mackenzie Delta: Sedimentary Processes and Facies of a High-Latitude, Fine-Grained Delta. Sedimentology 48 (5), 1047–1078. doi:10.1046/j.1365-3091.2001.00408.x
Hill, P. R., Mudie, P. J., Moran, K., and Blasco, S. M. (1985). A Sea-Level Curve for the Canadian Beaufort Shelf. Can. J. Earth Sci. 22 (10), 1383–1393. doi:10.1139/e85-146
Hopkinson, C., Crasto, N., Marsh, P., Forbes, D., and Lesack, L. (2011). Investigating the Spatial Distribution of Water Levels in the Mackenzie Delta Using Airborne LiDAR. Hydrol. Process. 25 (19), 2995–3011. doi:10.1002/hyp.8167
Huggett, W. S., Woodward, M. J., Stephenson, F., Hermiston, F. V., and Douglas, A. (1975). Near Bottom Currents and Offshore Tides. Beaufort Sea Project, Department of the Environment. Available at: www.publications.gc.ca/pub?id=9.877636&sl=0 (accessed June, 2021).
Irrgang, A. M., Lantuit, H., Gordon, R. R., Piskor, A., and Manson, G. K. (2019). Impacts of Past and Future Coastal Changes on the Yukon Coast - Threats for Cultural Sites, Infrastructure, and Travel Routes. Arctic Sci. 5 (2), 107–126. doi:10.1139/as-2017-0041
James, T. S., Henton, J. A., Leonard, L. J., Darlington, A., Forbes, D. L., and Craymer, M. (2014). Relative Sea-Level Projections in Canada and the Adjacent mainland United States. Geol. Surv. Can. Open File. 7737, 72. doi:10.4095/295574
Kavik-Axys Inc (2010). Review of Tuktoyaktuk Habour as a Base for Offshore Oil & Gas Exploration and Development. Environmental Studies Research Funds Report No. 179. Alberta & Northwest Territories. Available at: https://publications.gc.ca/site/eng/9.811369/publication.html (accessed July, 2021).
Kim, J., Murphy, E., Nistor, I., Ferguson, S., and Provan, M. (2021). Numerical Analysis of Storm Surges on Canada's Western Arctic Coastline. J. Mar. Sci. Eng. 9 (3), 326. doi:10.3390/jmse9030326
Kobayashi, N., Vidrine, J. C., Nairn, R. B., and Soloman, S. M. (1999). Erosion of Frozen Cliffs Due to Storm Surge on Beaufort Sea Coast. J. Coast. Res. 15, 332–344. Available at: www.jstor.org/stable/4298946 (accessed July, 2021).
Kokelj, S. V., Lantz, T. C., Solomon, S., Pisaric, M. F. J., Keith, D., Morse, P., et al. (2012). Using Multiple Sources of Knowledge to Investigate Northern Environmental Change: Regional Ecological Impacts of a Storm Surge in the Outer Mackenzie Delta, N.W.T. Arctic 65, 257–272. doi:10.14430/arctic4214
Lantuit, H., Overduin, P. P., and Wetterich, S. (2013). Recent Progress Regarding Permafrost Coasts. Permafrost Periglac. Process. 24 (2), 120–130. doi:10.1002/ppp.1777
Lantz, T. C., Kokelj, S. V., and Fraser, R. H. (2015). Ecological Recovery in an Arctic delta Following Widespread saline Incursion. Ecol. Appl. 25 (1), 172–185. doi:10.1890/14-0239.1
Lapham, L. L., Dallimore, S. R., Magen, C., Henderson, L. C., Powers, L. C., Gonsior, M., et al. (2020). Microbial Greenhouse Gas Dynamics Associated with Warming Coastal Permafrost, Western Canadian Arctic. Front. Earth Sci. 8, 576. doi:10.3389/feart.2020.582103
Lapka, S. (2013). Oceanic Storm Surges in the Outer Mackenzie Delta, NWT Canada: Remote Sensing of Tundra Disturbance and Restoration from saline Intrusion. [master’s thesis]. Calgary (AB): University of Calgary.
Larsen, H. A. (1948). The North-West Passage 1940-1942 and 1944- the Famous Voyages of the Royal Canadian Mounted Police Schooner “St. Roch’. City Archives, Vancouver Canada: Open Library of the University of British Columbia. Available at: https://open.library.ubc.ca/collections/bcbooks/items/1.0391835#p1z-4r1440f:Tuktoyaktuk%20 (accessed July, 2021).
Leonard, L. J., Rogers, G. C., and Mazzotti, S. (2012). A Preliminary Tsunami hazard Assessment of the Canadian Coastline. Geol. Surv. Can. Open File. 7201, 119. doi:10.4095/292067
Leonard, L. J., Rogers, G. C., and Mazzotti, S. (2014). Tsunami Hazard Assessment of Canada. Nat. Hazards 70 (1), 237–274. doi:10.1007/s11069-013-0809-5
Liew, M., Xiao, M., Jones, B. M., Farquharson, L. M., and Romanovsky, V. E. (2020). Prevention and Control Measures for Coastal Erosion in Northern High-Latitude Communities: A Systematic Review Based on Alaskan Case Studies. Environ. Res. Lett. 15 (9), 093002. doi:10.1088/1748-9326/ab9387
Lim, M., Whalen, D., Martin, J., Mann, P. J., Hayes, S., Fraser, P., et al. (2020). Massive Ice Control on Permafrost Coast Erosion and Sensitivity. Geophys. Res. Lett. 47 (17), e2020GL087917. doi:10.1029/2020gl087917
Manson, G. K., and Solomon, S. M. (2007). Past and Future Forcing of Beaufort Sea Coastal Change. Atmosphere-Ocean 45 (2), 107–122. doi:10.3137/ao.450204
Marsh, P., and Schmidt, T. (1993). Influence of a Beaufort Sea Storm Surge on Channel Levels in the Mackenzie Delta. Arctic 46, 35–41. doi:10.14430/arctic1319
M. Meredith, M. Sommerkorn, S. Cassotta, C. Derksen, A. Ekaykin, and A. Hollowed (Editors) (2019). IPCC Special Report on the Oceans and Cryosphere in a Changing Climate (Geneva: Intergovernmental Panel on Climate Change). Available at: https://repository.library.noaa.gov/view/noaa/27411/noaa_27411_DS1.pdf (accessed March, 2021).
Mosher, D. (2009). International Year of Planet Earth 7. Oceans: Submarine Landslides and Consequent Tsunamis in Canada. Geosci. Can. 36 (4), 179–190. Available at: https://www.erudit.org/en/journals/geocan/2014-v41-n2-geocan36_4/geocan36_4ser04/(accessed January, 2021).
Murphy, E., Nistor, I., Cornett, A., Wilson, J., and Pilechi, A. (2021). Fate and Transport of Coastal Driftwood: A Critical Review. Mar. Pollut. Bull. 170, 112649. doi:10.1016/j.marpolbul.2021.112649
National Oceanic and Atmospheric Administration (NOAA) (2020). Sea Level Trends. Relative Sea Level Trend 970-211 Tuktoyaktuk, Canada. Available at: https://tidesandcurrents.noaa.gov/sltrends/sltrends_station.shtml?id=970-211 (Accessed March 14, 2020).
Natural Resources Canada (2020). Canadian Spatial Reference System-Precise Point Positioning. Available at: https://webapp.geod.nrcan.gc.ca/geod/tools-outils/ppp.php (Accessed October 15, 2020).
Natural Resources Canada (2021). Station Report. Available at: https://webapp.geod.nrcan.gc.ca/geod/data-donnees/station/report-rapport.php?id=M039008 (Accessed January 22, 2021).
O’Rourke, M. J. E. (2017). Archaeological Site Vulnerability Modelling: The Influence of High Impact Storm Events on Models of Shoreline Erosion in the Western Canadian Arctic. Open Archaeol 3 (1), 1–16. doi:10.1515/opar-2017-0001
Overeem, I., Anderson, R. S., Wobus, C. W., Clow, G. D., Urban, F. E., and Matell, N. (2011). Sea Ice Loss Enhances Wave Action at the Arctic Coast. Geophys. Res. Lett. 38 (17), a–n. doi:10.1029/2011GL048681
Paull, C. K., Dallimore, S. R., Caress, D. W., Gwiazda, R., Lundsten, E., Anderson, K., et al. (2021). A 100-km Wide Slump along the Upper Slope of the Canadian Arctic Was Likely Preconditioned for Failure by Brackish Pore Water flushing. Mar. Geology. 435, 106453. doi:10.1016/j.margeo.2021.106453
Permanent Service for Mean Sea Level (PSMSL) (2021). Tuktoyaktuk. Available online at: https://www.psmsl.org/data/obtaining/stations/1000.php (Accessed January 22, 2021).
Pisaric, M. F. J., Thienpont, J. R., Kokelj, S. V., Nesbitt, H., Lantz, T. C., Solomon, S., et al. (2011). Impacts of a Recent Storm Surge on an Arctic Delta Ecosystem Examined in the Context of the Last Millennium. Proc. Natl. Acad. Sci. 108 (22), 8960–8965. doi:10.1073/pnas.1018527108
Ramsey, C. B. (2009). Dealing with Outliers and Offsets in Radiocarbon Dating. Radiocarbon 51 (3), 1023–1045. doi:10.1017/S0033822200034093
Reimer, P. J., Bard, E., Bayliss, A., Beck, J. W., Blackwell, P. G., Ramsey, C. B., et al. (2013). IntCal13 and Marine13 Radiocarbon Age Calibration Curves 0-50,000 Years Cal BP. Radiocarbon 55 (4), 1869–1887. doi:10.2458/azu_js_rc.55.16947
Reimnitz, E., and Maurer, D. K. (1979). Effects of Storm Surges on the Beaufort Sea Coast, Northern Alaska. Arctic 32 (4), 329–344. Available at: https://www.jstor.org/stable/40509007 (accessed November, 2020). doi:10.14430/arctic2631
Reimnitz, E., and Maurer, D. K. (1978). Storm Surges in the Alaskan Beaufort Sea. US Geol. Survey Open File, 78–593. Available at: http://dggs.alaska.gov/webpubs/usgs/of/text/of78-0593.pdf (accessed June 11, 2019).
Riedel, M., King, E. L., Cameron, G. D. M., Blasco, S., Conway, K. W., Dallimore, S. R., et al. (2021). A Chronology of Post-Glacial Mass-Transport Deposits on the Canadian Beaufort Slope. Mar. Geology. 433, 106407. doi:10.1016/j.margeo.2020.106407
Sander, L., Kirdyanov, A., Crivellaro, A., and Büntgen, U. (2021). Short Communication: Driftwood Provides Reliable Chronological Markers in Arctic Coastal Deposits. Geochronology 3 (1), 171–180. doi:10.5194/gchron-3-171-2021
Screen, J. A., and Simmonds, I. (2010). The Central Role of Diminishing Sea Ice in Recent Arctic Temperature Amplification. Nature 464, 1334–1337. doi:10.1038/nature09051
Serreze, M. C., Holland, M. M., and Stroeve, J. (2007). Perspectives on the Arctic's Shrinking Sea-Ice Cover. Science 315 (5818), 1533–1536. doi:10.1126/science.1139426
Shah, V. K. (1982). Performance of Sand-Filled Tube Shore Protection Tuktoyaktuk, North West Territories, Canada. Coastal Eng. 1982, 1901–1913. doi:10.1061/9780872623736.114
Shaw, J., Taylor, R. B., Solomon, S., Christian, H. A., and Forbes, D. L. (1998). Potential Impacts of Global Sea-Level Rise on Canadian Coasts. Can. Geographer 42 (4), 365–379. doi:10.1111/j.1541-0064.1998.tb01352.x
Thomas, M. A., Mota, A., Jones, B. M., Choens, R. C., Frederick, J. M., and Bull, D. L. (2020). Geometric and Material Variability Influences Stress States Relevant to Coastal Permafrost bluff Failure. Front. Earth Sci. 8, 143. doi:10.3389/feart.2020.00143
Van der Sluijs, J., Kokelj, S., Fraser, R., Tunnicliffe, J., and Lacelle, D. (2018). Permafrost Terrain Dynamics and Infrastructure Impacts Revealed by UAV Photogrammetry and thermal Imaging. Remote Sensing 10 (11), 1734. doi:10.3390/rs10111734
Vermaire, J. C., Pisaric, M. F. J., Thienpont, J. R., Courtney Mustaphi, C. J., Kokelj, S. V., and Smol, J. P. (2013). Arctic Climate Warming and Sea Ice Declines Lead to Increased Storm Surge Activity. Geophys. Res. Lett. 40 (7), 1386–1390. doi:10.1002/grl.50191
Whalen, D., Forbes, D. L., Hopkinson, C., Lavergne, J. C., Manson, G. K., Marsh, P., et al. (2009). “Topographic LiDAR-Providing a New Perspective in the Mackenzie Delta,” in Proc. 30th Canadian Symposium on Remote Sensing, Lethbridge, Alberta. Available at: http://scholar.ulethbridge.ca/sites/default/files/hopkinson/files/whalen_etal_csrs_lethbridge2009.pdf?m=1458144712 (accessed June, 2020).
Keywords: storm surge, coastal erosion, structure from motion, coastal hazards, arctic storms, unoccupied aerial vehicle, arctic driftwood
Citation: MacLeod RF and Dallimore SR (2021) Assessment of Storm Surge History as Recorded by Driftwood in the Mackenzie Delta and Tuktoyaktuk Coastlands, Arctic Canada. Front. Earth Sci. 9:698660. doi: 10.3389/feart.2021.698660
Received: 21 April 2021; Accepted: 12 November 2021;
Published: 07 December 2021.
Edited by:
Anna M. Irrgang, Alfred Wegener Institute Helmholtz Centre for Polar and Marine Research (AWI), GermanyReviewed by:
Lukas U Arenson, BGC Engineering, CanadaEnda Murphy, National Research Council Canada (NRC-CNRC), Canada
Copyright © 2021 MacLeod and Dallimore. This is an open-access article distributed under the terms of the Creative Commons Attribution License (CC BY). The use, distribution or reproduction in other forums is permitted, provided the original author(s) and the copyright owner(s) are credited and that the original publication in this journal is cited, in accordance with accepted academic practice. No use, distribution or reproduction is permitted which does not comply with these terms.
*Correspondence: Roger F. MacLeod, roger.macleod@nrcan-rncan.gc.ca