Performance Evaluation of an Earthquake Early Warning System in the 2019–2020 M6.0 Changning, Sichuan, China, Seismic Sequence
 Chaoyong Peng
 Peng Jiang3
  Qiang Ma
- 1Institute of Geophysics, China Earthquake Administration, Beijing, China
- 2Key Laboratory of Earthquake Source Physics, China Earthquake Administration, Beijing, China
- 3Sichuan Earthquake Administration, Chengdu, China
- 4Institute of Engineering Mechanics, China Earthquake Administration, Harbin, China
China is currently building a nationwide earthquake early warning system (EEWS) which will be completed in June 2023. Several regions have been selected as pilot areas for instrumentation, software system and dissemination verification. For these regions, their construction tasks will be completed in advance with trial runs being carried out in June 2021. Before the trial operation, we need to understand the actual processing capabilities of different EEWSs. In this work, we focus on the system deployed in Sichuan province and evaluate its real-time performance during the 2019–2020 M6.0 Changning seismic sequence. This period was divided into two stages. The first stage was the time from the occurrence of the M6.0 (Mw5.7) mainshock (June 17, 2019) to the end of October 2019 with no MEMS-based stations around the Changning seismic sequence deployed and most of the broadband and short period seismic stations not upgraded to low latency streaming, and the second one was from the beginning of November 2019 to March 2021 with deployments of more than 700 MEMS-based stations and low latency upgrades of ∼30 seismic stations. Median errors for the epicentral locations, depths and magnitude estimations were almost the same for both stages, 1.5 ± 6.0 km, 0.0 ± 3.6 km and −0.1 ± 0.46 for the first stage and 2.3 ± 3.0 km, −3.0 ± 3.6 km and −0.2 ± 0.32 for the second one. However, an obvious underestimation of the magnitude for earthquakes with M 5.0 + occurring in the first stage was observed, which would be caused by the clipped waveforms, sensors deployed in short period seismic stations and MEMS-based stations, the adopted magnitude estimation method, and the method used to computer the network magnitude. The median reporting time was significantly improved from 10.5 ± 3.0 s after origin time for the first stage to 6.3 ± 3.5 s for the second stage because of introduction of newly deployed MEMS-based stations. The results obtained from the second stage indicate that the system has entered a stable operating stage and we can officially launch the trial operation in the pilot areas for public early warning services.
Introduction
As an effective way to mitigate seismic hazards, earthquake early warning (EEW) systems (EEWSs) have shown their great potential by providing alarms immediately after a destructive earthquake occurs and before damaging seismic waves reach the target areas. They can enable people and automated systems to take action for preventing the potential damage, such as “drop, cover and hold on,” slowing high-speed trains, shutting down gas pipelines, and stopping elevators at the nearest floor (Allen and Melgar, 2019; Cremen and Galasso, 2020). Nowadays, EEWSs are under testing or operational in many earthquake-prone countries and regions, like Japan (Hoshiba et al., 2008), Mexico (Cuéllar et al., 2017), the West Coast of the United States (Chung et al., 2020), China (Peng et al., 2011; Zhang et al., 2016; Peng et al., 2019; Peng et al., 2020), Turkey (Alick et al., 2009), Taiwan (Wu, 2014; Wu et al., 2016; Hsu et al., 2018), South Korea (Sheen et al., 2017), Italy (Zollo et al., 2009; Satriano et al., 2011), and India (Mittal et al., 2019).
In June 2018, China started to build a nationwide EEWS. This project, namely the National System for Fast Seismic Intensity Report and Earthquake Early Warning project (hereafter called the National System project), was led by the China Earthquake Administration (CEA) and its implementation cycle is five years. Detailed information can be found in Peng et al. (2020). To make the project effective as soon as possible, several regions have been selected as pilot areas for instrumentation, software system and dissemination verification, including Sichuan province, Yunnan province, and the Beijing-Tianjin-Hebei region. For these pilot areas, all construction tasks will be completed in June 2021, and the trial run will then be carried out in advance for providing the second-level EEW information service to the public.
Before the trial operation, we need to understand the actual processing capabilities of different EEWSs. We have evaluated the real-time performance of the demonstration EEWS deployed in the Sichuan-Yunnan border region during the test period (2017–2018). Although the results showed excellent magnitude estimation and epicentral location, the average report time for the first alert was relatively long, approximately 13.4 ± 5.1 s and 26.3 ± 13.5 s after the origin time respectively for the earthquakes occurring inside and outside the seismic network (Peng et al., 2020). This means that the average radius of blind zone was more than 45 km considering an S-wave velocity of 3.5 km/s and a shallow seismicity depth of 10 km, and it was unable to meet the key time goal of the National System project (4–6 s after the first trigger in the four key seismic zones). Here using the time after the first trigger as one of the system goal is that it would not be influenced by the varied focal depth (from several kilometers to more than 30 km) and whether an earthquake occurs inside or outside the seismic network.
Within the past 2 years (2019–2020), the EEWS has been upgraded by introducing more newly constructed stations and optimizing EEW algorithms. And for improving the 3G/4G network environment, all the micro-electro-mechanical system (MEMS) accelerometer based stations belong to the National System project were directly built in the houses of the cellular towers maintained by the China Tower company (https://ir.china-tower.com/en/business/macro.php), and about 50 MEMS-based stations deployed in the Sichuan-Yunnan border region (Peng et al., 2020) were moved to the same environment. In addition, an M6.0 (Mw5.7) Changning earthquake with many aftershocks of M3.0 + occurred in this period, which was the largest event occurring in the four key seismic zones since the build-out of the first prototype EEWS in 2009 (Peng et al., 2011). This seismic sequence provides us an outstanding opportunity to reevaluate the EEWS performance in the current situation.
In this study, we focus on the system deployed in Sichuan province and evaluate its real-time processing capabilities during the 2019–2020 M6.0 Changning, Sichuan, China, seismic sequence. We start by briefly summarizing the Changning seismic sequence. In the Sichuan Seismic Network, we introduce the Sichuan seismic network and present the network latency for different types of seismic stations. Then, we discuss the EEWS performances for the M6.0 Changning mainshock and all the selected aftershocks. The performance analysis is based on comparing the location, origin time, and magnitude estimated by the EEWS with the reference catalogs. In addition, we also analyze the report time of the first alert for the selected aftershocks.
Changning Seismic Sequence
The Changning area is located on the southern margin of Sichuan Basin and the western margin of the Yangtze Plate (Figure 1). It is one of the main salt (well and rock) and shale-gas production regions, with fluid injection wells drilled to ∼3 km depths, and was considered as one of the sites of induced seismic events (Lei et al., 2019; Meng et al., 2019; Hu et al., 2021). The enhanced seismicity has been observed in the last ∼10 years and the occurrence of earthquakes has recently increased significantly. According to the China Earthquake Networks Center (CENC), there were no earthquakes of M 5 or higher in this area before December 2018. However, since the occurrence of December 16, 2018 Xingwen M5.7 earthquake, a devastating and long-lasting earthquake sequence with many M 5 + events started to shake this region, resulting in 13 people dead, more than 200 injured and thousands of buildings damaged (Yi et al., 2019; Li et al., 2020). Here, the generic symbol M denotes either local magnitude ML or the surface-wave magnitude transferred from an empirical estimating equation MS = 1.13ML—1.08, for earthquakes below or above ML5, respectively (Chen et al., 2014).
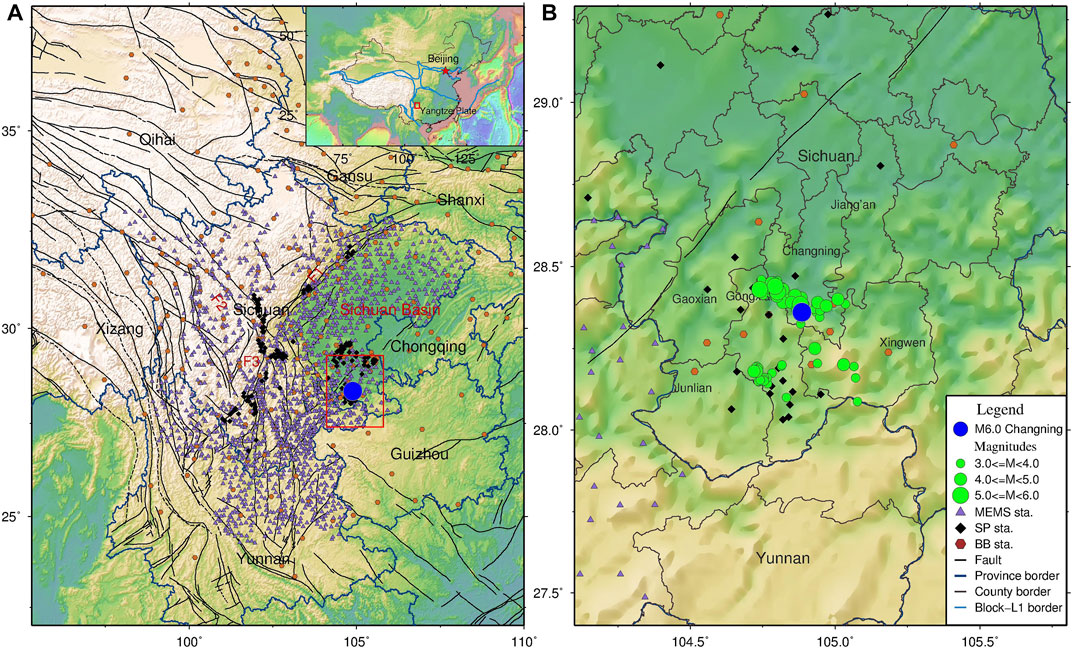
FIGURE 1. (A) Station distribution of the currently used Sichuan Seismic Network (March 31, 2021). F1, F2, and F3 are the Longmenshan, Xishuihe, and Xiaojiang fault zones, respectively. (B) Station distribution in the area around the Changning seismic sequence for the first stage. Purple triangles, black diamonds and brown hexagons represent MEMS-based stations, short period seismic stations and broadband seismic stations, respectively. The blue circle shows the epicenter of the June 17, 2019 M 6.0 Changning earthquake. A large map with the marked studied area is shown in the inset. Green circles indicate the earthquakes with M 3.0 or more in the Changning seismic sequence, and their sizes are proportional to their magnitudes. Black lines are faults presented by Deng et al. (2003).
Until now, the seismic sequence generated more than 100 events with M larger than 3.0 (Figure 1). The largest magnitude event (M6.0 Changning earthquake) occurred on June 17, 2019, at 22:55 Beijing Time (14:55 UTC), locating in the southwestern margin of Sichuan Basin with a very shallow focal depth of ∼5 km (Table 1). It was a doublet with two faulting styles (Liu and Zahradník, 2020). The initial thrust faulting could be associated with previously known reverse faults, which were favorably oriented to the regional stress field, while the following strike-slip faulting was probably facilitated by increased pore pressure because of previous injections. The event caused Modified Mercalli Intensity VIII near the epicenter, with the affected area larger than VI being about 2,538 km2. The shock was widely felt in many places of Sichuan, Yunnan, Chongqing, and Guizhou provinces, including Chengdu city approximately 260 km from the epicenter.
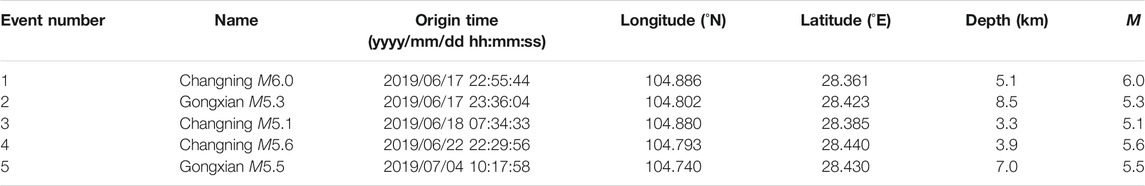
TABLE 1. Earthquake catalogs for five M5.0 + events occurring during the 2019–2020 Changning seismic sequence.
Sichuan Seismic Network
The Sichuan seismic network is operated by the Sichuan Earthquake Administration. It was constructed by several projects, including the National System project, the Sichuan-Yunnan Demonstration project (Peng et al., 2019; Peng et al., 2020), the Western Sichuan Earthquake Monitoring Capability Improvement project, the Jiuzhaigou Earthquake Recovery and Reconstruction project, and the Kangding Earthquake Recovery and Reconstruction project. The stations are classified into three types: seismic stations, strong-motion stations, and low-cost MEMS-based stations. A seismic station is equipped with a three-component broadband seismometer and a force-balanced accelerometer, and a strong-motion station is only equipped with a force-balanced accelerometer. Detailed information is shown in Table 2. In addition, some stations built by other agencies are also included into the seismic network, such as reservoir stations (equipped with short period seismometers) and other provincial stations in the border regions. For a newly constructed station, to ensure its stable operation, we need it to go through a trial run of 3 months before being included into the EEWS. Until now, although construction of ∼80% of the seismic stations and strong-motion stations belong to the National System project and the Jiuzhaigou Earthquake Recovery and Reconstruction project was completed, these stations are at the stage of data quality verification and have not been included into the EEWS. The total number of stations currently used in the EEWS is approximately 2000, containing 363 seismic stations and 1631 MEMS-based stations (Figure 1A).
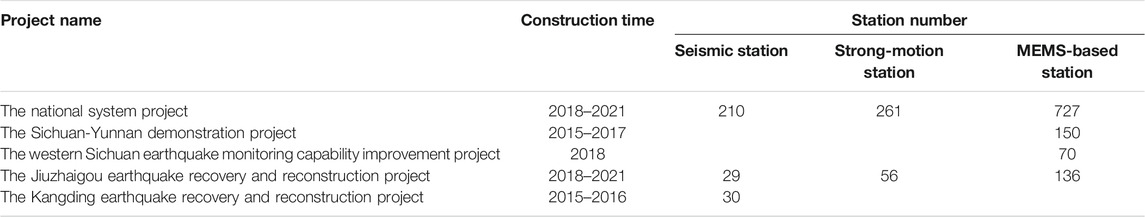
TABLE 2. Number of stations under construction in different projects.
All stations are operated at a sampling rate of 100 Hz and the real-time continuous data are transferred to the Sichuan Earthquake Data Processing and Alert Issuing Center and processed by the Java-based EEWS (JEEWS; Peng et al., 2020). Most MEMS-based stations were installed in the houses of the cellular towers and used their field supervision unit (FSU) for data transmission, which could significantly improve the network environment and lower maintenance costs. Except for some not upgraded broadband and short period seismic stations, most of the data loggers at the stations integrate a low-latency data packetizing function which is designed specifically to support the EEWS (Peng et al., 2015; 2017a). Theoretically, the data packetizing length can be reduced to 0.1 s. Here, for reducing network load, we chose either an interval of 0.5 or 1.0 s to packetize the real-time data depending on the telemetry type. For those not upgraded seismic stations, they still used the high-latency data transmission protocol with 512 bytes packet.
In JEEWS, the Pd scaling from Kuyuk and Allen (2013) is adopted for EEW magnitude estimation. When the system detects S-wave for stations close to an earthquake epicenter (<10 km), the local ML scaling is directly used to calculate the magnitude for avoiding S-wave contamination (Colombelli et al., 2012). The reason is that the peak ground motion will reach these stations soon after the S-wave arrival, generally in 1 or 2 s (Peng et al., 2020). If we still use S-wave data to estimate the Pd magnitude, a larger deviation will be introduced. Immediately after the magnitude estimated, a point-source algorithm based on the traditional ground motion prediction equation (GMPE) is used to compute seismic intensities at different target sites.
Using the method similar to Stubailo et al., 2021, we measured data latencies for all stations in March 2021 (Figure 2). Here data latency is defined as the time difference between the time when the last sample of the data packet was recorded and the time when the same packet is received by the data processing center. Because data processing by the station and waveform-receiving server at the center are very rapid, the measured latency can be interpreted as the delay of data transmission in the telemetry system. Therefore, we ignored the delay awaited between subsequent packets, approximately the packet length. The median values for broadband seismic stations, short period seismic stations, MEMS-based stations and all stations were 2.9 ± 1.61 s, 0.87 ± 1.54 s, 0.5 ± 0.42 s and 0.59 ± 1.1 s, respectively. The relative large standard deviations for broadband and short period seismic stations were due to the high data latencies introduced by those not upgraded stations.
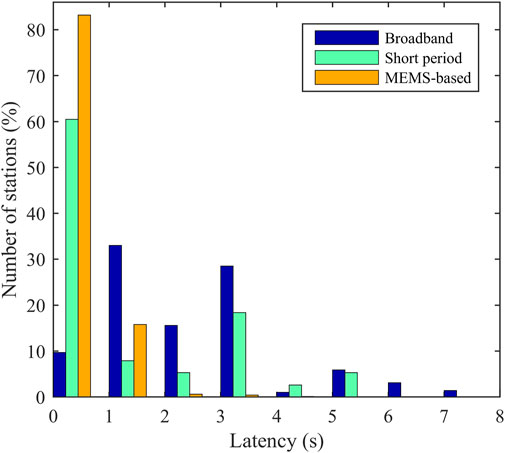
FIGURE 2. Normalized data latency distribution (%) for the Sichuan Seismic Network. Here distribution in each class of instrument is normalized to its total number of sample. All MEMS-based stations sent 0.5 or 1.0 s data packets; for the upgraded broadband and short period seismic stations, they used the same low-latency data packetizing function as the MEMS-based stations and acquired data with data packetizing of 0.5 or 1.0 s; for the broadband and short period seismic stations not upgraded, they sent data after the data packet is full and compressed.
Performance of JEEWS
System Performance for the Changning Seismic Sequence
To evaluate the system performance for the Changning seismic sequence, we investigated the real-time results of 101 earthquakes of M 3.0 or more from the occurrence of the M6.0 mainshock to March 2021, including 17 light aftershocks (4.0 ≤ M ≤ 4.9) and four moderate aftershocks (5.0 ≤ M ≤ 5.9). This period could be divided into two stages. The first stage was the time between the occurrence of the M6.0 mainshock (June 17, 2019) to the end of October 2019, and the second one was from the beginning of November 2019 to March 2021. In the first stage, the MEMS-based stations around the Changning seismic sequence were not deployed, and most of the broadband and short period seismic stations were not upgraded (Figure 1B). The nearest MEMS-based station belong to the Sichuan-Yunnan Demonstration project (Peng et al., 2019; Peng et al., 2020) was 50 km away from the sequence. Additionally, most of the short period seismic stations were temporary stations and transferred real-time data with the old high-latency protocol. Therefore the report time for earthquakes occurring in this stage would be significantly influenced and we needed to evaluate the performance of the two stages separately.
For the 101 earthquakes, 62 occurred in the first stage and 39 happened during the second one. All earthquakes with M 5.0 + occurred in the first stage. Here the first alert was selected to derive all statistics because of its importance for EEW. Although other EEW projects have moved towards more ground motion based metrics and warning time calculations (Cochran et al., 2018; Chung et al., 2020; Meier et al., 2020), at this stage of the National System project, we are mainly concerned about the correctness of results of the first alert. The result of each earthquake identified by the EEWS was compared with those in the China Earthquake Network Center (CENC) catalogs. In addition, three alert levels were defined according to the catalog magnitude of an earthquake. They are successful alert (SA), false alert and missed alert. Based on these definitions, as for the M 3.0 + earthquakes, JEEWS issued 55 SA events and missed seven events for the first stage and 38 SA events and missed one event for the second stage. No false alert was issued during the both periods. Detailed results for the SA events are shown in Figure 3.
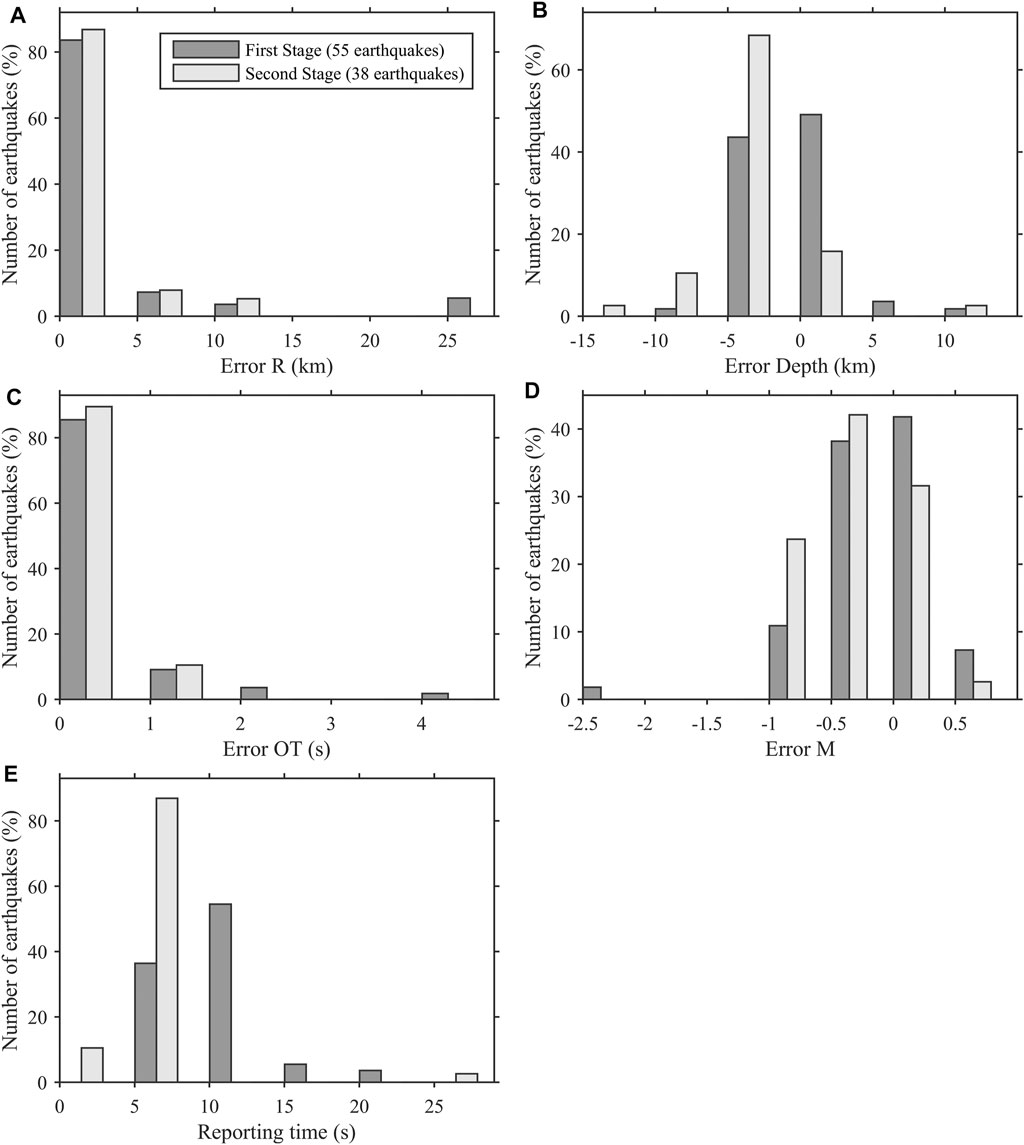
FIGURE 3. Normalized number of earthquakes (%) vs. deviations between the first alert estimates for the 93 successful alerts output by JEEWS and the China Earthquake Network Center (CENC) catalogs for (A) epicenter, (B) depth, (C) origin time, and (D) magnitude. (E) Normalized number of earthquakes (%) vs. reporting time. This is a comparison of CENC and JEEWS earthquake parameter estimates for all Changning events studied, 55 from the first stage and 38 from the second stage.
Figure 3A represents the epicentral error of SA events. The median deviations in epicenter location for the first and second stages were 1.5 ± 6.0 and 2.3 ± 3.0 km respectively. About 84% of the SA events had an error of less than 5 km. Among the earthquakes with epicentral errors of more than 10 km, there were 5 (9.1%) in the first stage and 2 (5.3%) in the second stage.
For an EEWS, depth is usually difficult to be determined correctly, especially for earthquakes occurred outside the seismic network (Carranza et al., 2017). Many studies have ignored this parameter and not analyzed it (Zhang et al., 2016; Sheen et al., 2017; Peng et al., 2020). From Figure 3B, one can observe that depth errors for most earthquakes lie between −5 and 5 km, with median errors of 0.0 ± 3.6 and −3.0 ± 3.6 km for the first and second stages, respectively. This means that the depth value of the first alert is excellent, although the depth error for the second stage is relatively large, which was caused by the MEMS-based stations and the events themselves being of a relatively smaller magnitude. In the second stage, most of the triggered stations contributing to the events were the newly constructed MEMS-based stations. Because of their high noise levels relative to the seismic stations, it is difficult to accurately identify P-wave arrivals from their recorded data for small earthquakes with magnitude less than 4.0, leading to a relatively large depth error.
Generally events with a large deviation in epicenter estimate also had a large deviation in the OT (Figures 3A,C). For the first and second stages, the median differences in OT were 0.4 ± 0.7 s and 0.3 ± 0.4 s, respectively. And ∼69 and ∼89% of the events in both stages had errors of less than 0.5 and 1.0 s. There were eight events (14.5%) with an OT error larger than 1.0 s for the first stage and 4 events (10.5%) for the second stage.
Figure 3D shows the deviation in M. About 83% of the events had an error of no more than 0.5 and 61% of the events had a deviation of less than 0.4. The median magnitude differences for the first and second stages were −0.1 ± 0.46 and −0.2 ± 0.32 respectively. For the larger events with M ≥ 4.0 and M ≥ 5.0, the deviations were −0.5 ± 0.55 and −0.9 ± 0.71 respectively, indicating that JEEWS significantly underestimated the magnitude.
We further compared the magnitudes obtained from events in both stages according to JEEWS with those in the CENC catalogs (Figure 4). The magnitudes estimated at broadband seismic stations, short period seismic stations, and MEMS-based stations are indicated by empty circles, crosses, and triangles, respectively, while the network magnitudes, the average value of all station magnitudes, are presented as blue circles. Here, both Pd magnitude and ML based station contributions are shown in the graph. The same trend of magnitude underestimation for larger events could also be found in Figure 4. It is alarming that an extrapolation of Figures 4A,C,E suggests that a M7.0 earthquake would get a MEEW 5.5. However, the broadband seismic station magnitudes are better correlated with the CENC magnitudes relative to the short period station and MEMS-based station magnitudes, especially for the larger earthquakes. In addition, we also considered each type of station’s performance in magnitude bins [3, 4), [4, 5) and [5, 6], shown in Table 3. From Figure 4 and Table 3, one can observe that:
• Measurements for the broadband seismic stations in general slightly overestimate M3-4 events and slightly underestimate earthquakes with higher magnitude. Scatter is generally lower for this station type.
• Measurements for the short period seismic stations in general more strongly overestimate M3-4 events, are good for M4-5 and slightly underestimate earthquakes with higher magnitude. However, scatter is very large (up to two magnitude units) for this station type. This may be a result of the deployment sites for this sensor type. Most of the short period seismic stations were temporary stations directly deployed on the hard soil layer. This would lead to amplification effects on the recorded ground motion.
• For the MEMS-based stations, measurements in general slightly overestimate M3-4 events, are good for M4-5 and more strongly underestimate earthquakes with higher magnitude. Scatter is similar to the broadband seismic stations, except for the magnitude bin [5, 6].
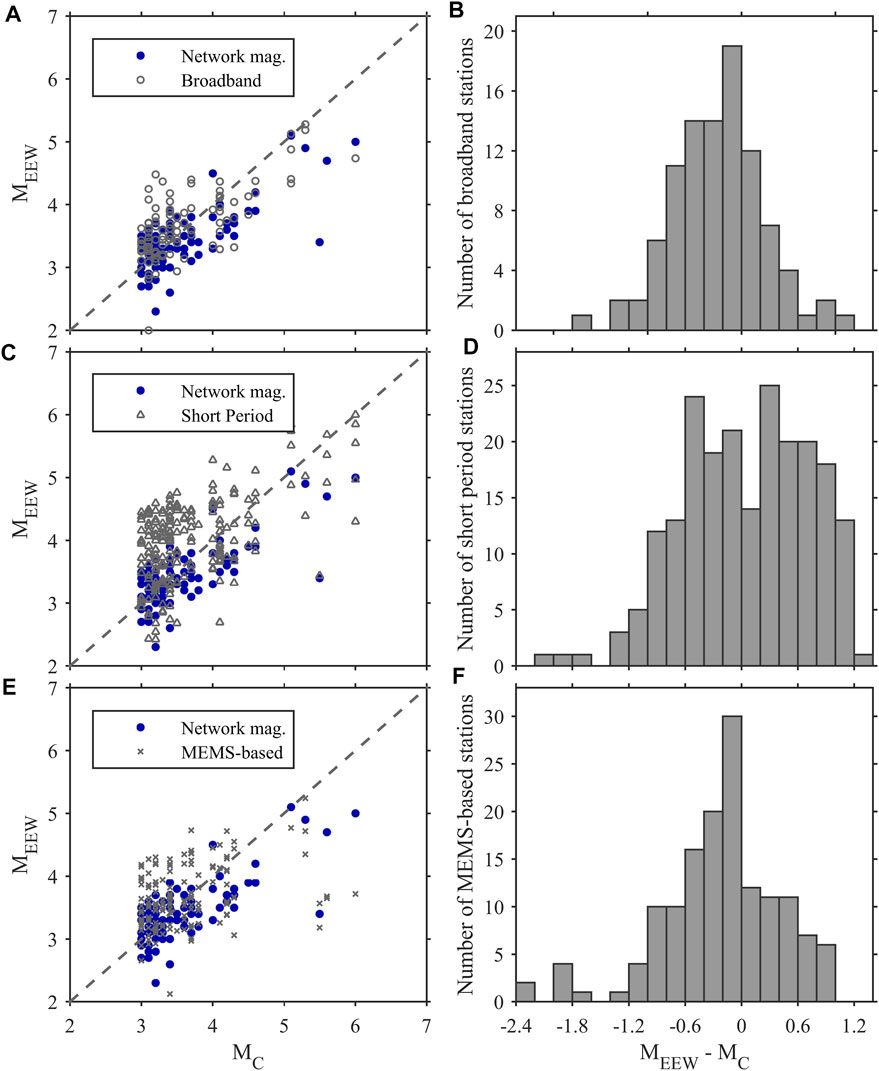
FIGURE 4. Comparison of the JEEWS magnitudes of the Changning seismic sequence for both stages. (A, C, E) JEEWS vs. the China Earthquake Network Center (CENC) catalogs for different station types. Empty circles, broadband seismic station magnitude; crosses, short period seismic station magnitude; triangles, MEMS-based station magnitude; blue circle, network magnitude. (B, D, F) Histograms of the magnitude differences for different station types.
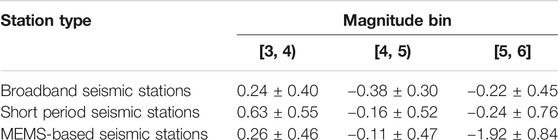
TABLE 3. Median and standard deviation of the uncertainty on magnitude estimation for each type of station, computed in different magnitude bins.
Reporting time, as another important feature, directly influences the effectiveness of an EEWS. From Figure 3E we can find that there was a huge difference in the reporting time for earthquakes occurring between the first and second stages. The median reporting times for the first and second stages were 10.5 ± 3.0 s and 6.3 ± 3.5 s, respectively.
Real-Time Results for the M 5 + Earthquakes
From the occurrence of the M6.0 mainshock, five earthquakes with magnitudes larger than 5.0 struck the Changning area. The list of events is presented in Table 1. All these earthquakes occurred in the first stage with no MEMS-based stations introduced and no broadband and short period seismic stations upgraded (Figure 1B). Therefore the first reporting time for these earthquakes was long (Figure 5), with an average of 11.6 ± 1.2 s after origin time. For the two Gongxian events, they are faster due to closer to the non-MEMS sub-networks. Additionally, although the location and depth errors were small with slight variations, the magnitudes for these earthquakes were significantly underestimated with large fluctuations and did not seem to converge toward the catalog values, except the Changning M5.1 event. Considering an S-wave velocity of 3.5 km/s, these earthquakes had a blind zone with radius of more than 30 km.
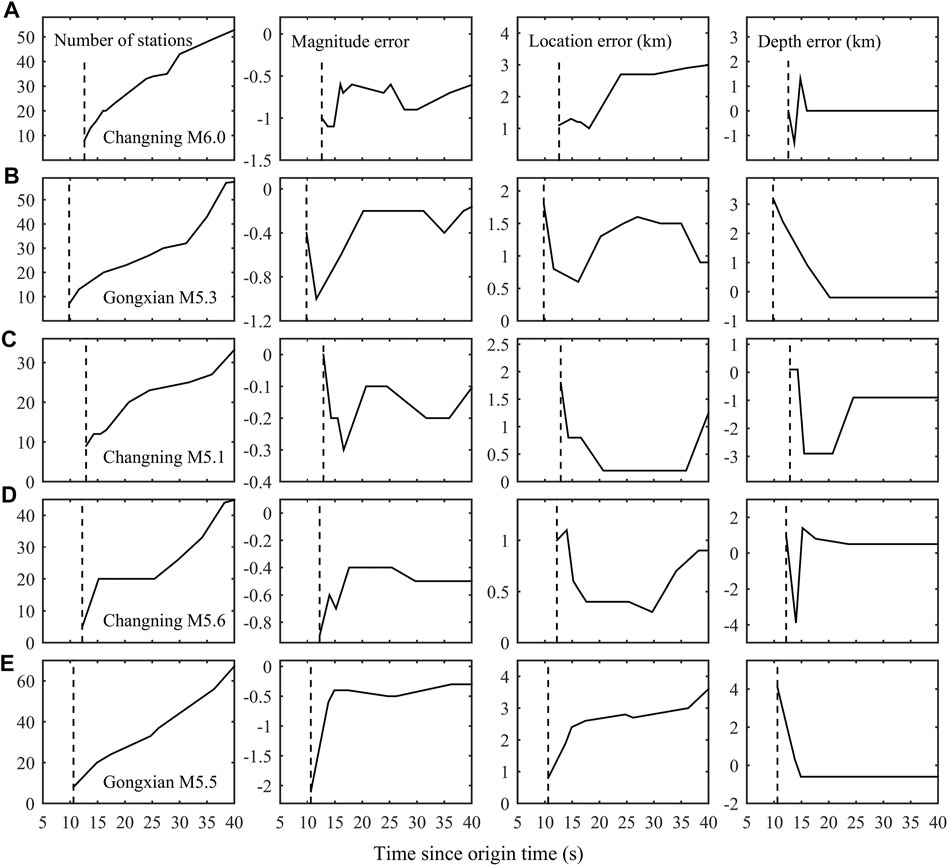
FIGURE 5. Real-time processing results of JEEWS for five M5.0 + earthquakes occurring in the Changning seismic sequence. (A) Changning M6.0 (2019/06/17 22:55:44); (B) Gongxian M5.3 (2019/06/17 23:36:04); (C) Changning M5.1 (2019/06/18 07:34:33); (D) Changning M5.6 (2019/06/22 22:29:56); (E) Gongxian M5.5 (2019/07/04 10:17:58). From left to right, each panel is the number of triggered stations, the magnitude error, the location error, and the depth error as a function of time, respectively. Vertical lines indicate the first alert time.
Discussion and Conclusion
After several years of construction, the number of stations of the Sichuan seismic network had reached ∼2000, and the average distance between stations was about 12 km, which is comparable to the Italian Strong Motion Network used for PRESTo (Festa et al., 2018) and the California Integrated Seismic Network used for ShakeAlert (Chung et al., 2020). In some regions, such as the Xianshuihe, Longmenshan and Xiaojiang fault zones (Figure 1A), the average interstation distance was less than 10 km. In addition, most stations integrated a low-latency data packetizing function for real-time continuous data transmission (Peng et al., 2015; 2017a). These factors have greatly improved the EEW capabilities, which could be observed from the EEW results of all earthquakes with M3.0 or more in the Changning seismic sequence.
However, during the first stage, the MEMS-based stations around the Changning seismic sequence were still under construction and most data loggers installed in the broadband and short period seismic stations were not changed to those specially designed for EEW purposes, such as EDAS-24GN (http://www.geolight.com.cn/p.aspx?id=49&&type=2) and HG-D (http://www.szadpr.cn/a/yewufangxiang/xianjindizhenyiqishebei/20200716/442.html), leading to reporting time more than 10 s for the first alerts of most earthquakes. In the second stage, with the introduction of more than 1,000 MEMS-based stations, the reporting time has been significantly improved to 6.3 s, meaning that radii of the blind zones for most events have been reduced to ∼20 km under an S-wave velocity of 3.5 km/s and a shallow seismicity depth of 7 km. This is an impressive result and is comparable to those obtained by other excellent EEWSs, such as ShakeAlert (Chung et al., 2020), NEEWS (Hsu et al., 2018), on-site P-Alert system (Wu et al., 2019), and PRESTo in Italy (Festa et al., 2018). In addition, this result can meet the key time goal requirement of the National System project.
As to the seismic stations not upgraded, they adopted a fixed-size packet of 512 bytes for data transmission. Generally, during an earthquake, fixed-size data packet will be filled out quicker with large amplitudes, leading to shorter duration. However, the delay for transmitting and receiving the packet might become problematic during a large earthquake as stations sending high data rates will be a significantly additional stress for the telemetry infrastructure (Stubailo et al., 2021). One example is shown in Figure 6. For those not upgraded seismic stations transferring data with cellular modems (Figure 6A), huge latency could be observed after shaking onset. However, for the seismic stations delivering data over fiber lines (Figure 6B), a clear downward trend was presented because the packet was filled out quicker during the earthquake. Only a slight fluctuation was observed for the MEMS-based stations because of their low resolution (14–15 bits). The sensitivity of all MEMS-based accelerometers has been corrected to 500 counts/cm/s2. This means that 1 count is equal to 0.002 cm/s2. Usually, in the quiet time, the recorded data for an MEMS-based station vary between ±0.1 gals (±50 counts). During a large event, if the PGA value recorded can reach ±100 cm/s2, the counts will fluctuate between ±50,000, significantly lower than the seismic stations with waveforms clipped and approximately ±8,000,000 counts (23 bits resolution). Therefore, to lower the large latency introduced by the seismic stations, we can upgrade the data loggers by integrating a low-latency data packetizing function and increase the telemetry bandwidth by substituting the cellular modem links with fiber lines.
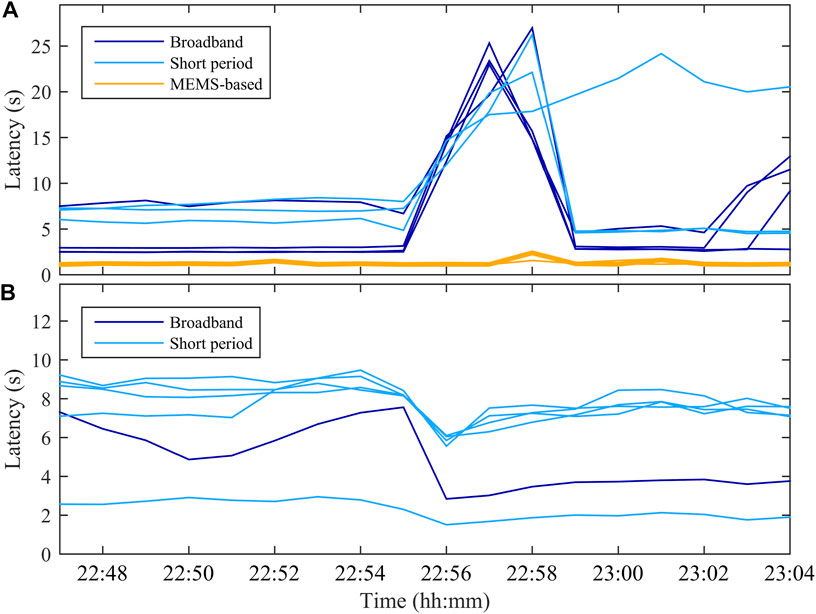
FIGURE 6. Data latency responses of different stations types with real-time data being transmitted by (A) cellular modem links and (B) fiber lines to the June 17, 2019 M 6.0 Changning earthquake.
In terms of earthquake location and magnitude estimation, most of the deviations were within 5 km and 0.5 magnitude units, a significant improvement compared to the results reported in Peng et al. (2020). In addition, most of the depth errors lied in ±5 km. The reason is mainly related to the increase in station density and the improvement of the network environment. However, eight earthquakes with M3.0 or more were missed by JEEWS, all of which occurred within a short time after earthquakes at the same location. Currently, a time threshold of 49 s, an empirical value, is used for an event detection to avoid declaring a secondary trigger at the same station as a new earthquake. This is an inherent limitation of JEEWS, especially in case of a foreshock and the mainshock occurring in a short time, which cannot be avoided because reducing the time threshold for new event detection would be controversial and could lead to many false alerts (Carranza et al., 2017; Peng et al., 2020). To reduce the impacts of this limitation on JEEWS, some effective methods like the integrated particle filter (IPF; Tamaribuchi et al., 2014), propagation of local undamped motion (PLUM; Kodera et al., 2016) algorithms or using an intensity threshold can be introduced to process multiple simultaneous events within a short time and distance.
In JEEWS, one of the alert filters was the event being triggered by at least two stations. It can be seen from the results in Table 4 that this alert filter would lead to larger location and magnitude errors. For earthquakes occurring in the second stage, with seismic network density increased and seismic stations upgraded, most of the first alerts were triggered by three or more stations and the reporting time was not significantly influenced. Therefore, when in the trial operation, the alerting strategy should be adjusted for the pilot areas, requiring at least three stations to take part in the EEW processing for declaring an earthquake. However, for other regions with different station densities, the number of stations would probably varies from place to place.
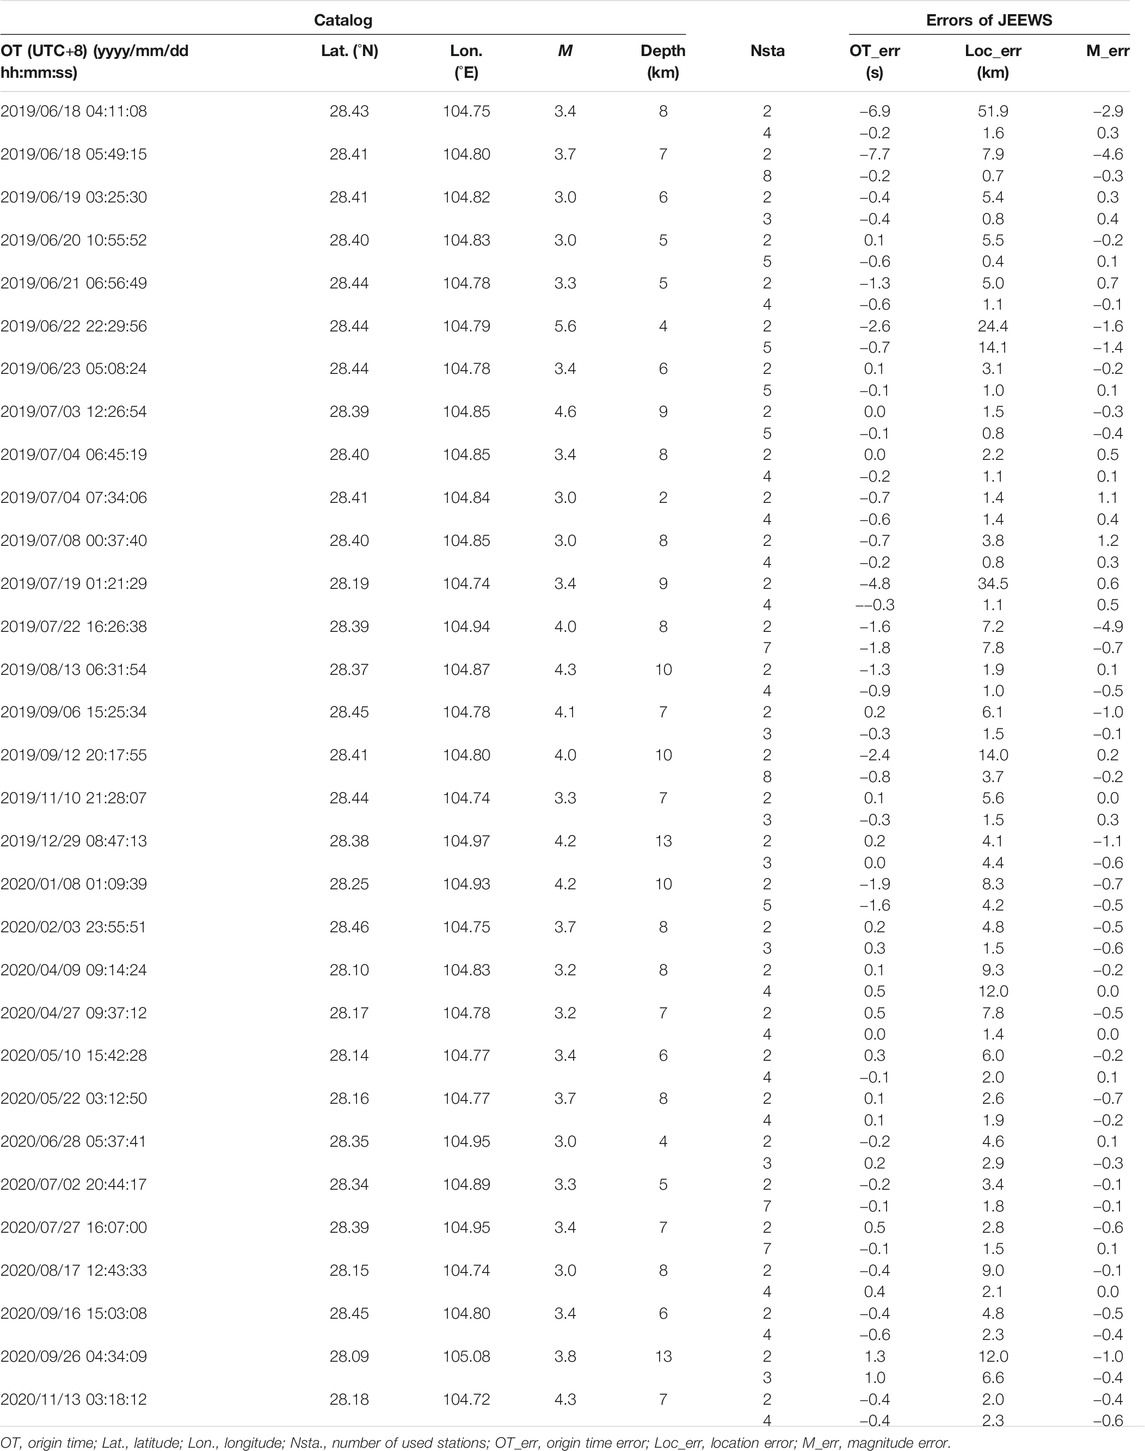
TABLE 4. Result comparison of the same earthquakes with the first alert triggered by two stations and the second alert triggered by more stations.
From the results of earthquakes with magnitude larger than 5.0, there was an obvious underestimation of the magnitude, which persisted even as time increased with more triggered stations. This may be caused by the following four reasons:
One is the seismic stations with clipped waveforms. Due to these larger earthquakes occurring in the first stage, except for some MEMS-based stations 50 km away from the epicenter, most stations used to estimate magnitude were seismic stations. Waveforms from the seismic stations close to the epicenter clipped, and some even clipped in the first second immediately after the P-wave arrival. These clipped data were not excluded and still used for EEW processing. To avoid this problem, we need to introduce a strategy to eliminate the clipped seismic stations, such as with a threshold on the number of counts.
The second reason comes from the sensors deployed in short period seismic stations and MEMS-based stations. It is well-known that the short period sensors have saturation problems when using to estimate the magnitude of a large earthquake (Xu et al., 2008), because they will miss the long period vibration of large events. However, the magnitude contributions are surprisingly good for these stations (Figure 4C). The reason may be related to the energy release of the large earthquakes themselves, which is out of the scope of this paper. As to the MEMS-based stations, except for the GL-P2B device (Peng et al., 2017a, 2019, 2020), most of the deployed sensors, including Palert (Wu, 2014; Wu et al., 2019; Peng et al., 2020), with a low signal resolution (14–15 bits) and dynamic range (less than 90 dB), had a relative high noise level, making them difficult to clearly record p wave arrivals of small earthquakes and more suitable for earthquakes with M4.0+ (Figure 4E).
The third one is the adopted magnitude estimation method itself (Kuyuk and Allen, 2013). The data selected to deriving the Pd magnitude relationship were records from broadband seismic stations and strong motion stations. In JEEWS, we also used short period seismic stations and MEMS-based stations. For the sensors deployed in these stations, they had different frequency bands and noise levels. From Figures 4C–F, we could find that this magnitude estimation method was not working well for these two types of stations. Therefore we need to calibrate new relationships with data directly recorded by the stations.
The final one lies in the method used to compute the network magnitude. In the current system, the network magnitude outputted is directly obtained by averaging the magnitude of each triggered station. This would lead to magnitude underestimation because of the magnitudes calculated from the newly triggered stations (Melgar and Hayes, 2019; Trugman et al., 2019; Chung et al., 2020) using a short P-wave time window (less than 2 s), especially for the MEMS-based stations ∼50 km away from the epicenter (Table 3). Usually, for a large earthquake with rupture duration longer than 4 s, the magnitude calculated from such a short window will be significantly underestimated (Meier et al., 2016, 2021; Trugman et al., 2019). To avoid this risk, we can use the time window length of each triggered station as a weight for computing the network magnitude. The effectiveness has been proved in Colombelli et al. (2012) and Peng et al. (2017b).
For the M 3.0 + earthquakes that occurred in the second stage, JEEWS obtained excellent results, indicating that the system has entered a stable operating state. However there is a high risk that is lack of M 7.0 + earthquake verification. So far, the largest intra-network event handled by JEEWS was the 2019 Changning M6.0 earthquake. In JEEWS we adopted a simple point-source algorithm to calculate seismic intensities at different target areas. This would lead to significant ground-motion underprediction for devastating (M 7.0+) earthquakes because fault finiteness was not considered (Chung et al., 2020). This limitation can be efficiently solved by introducing FinDer (Böse et al., 2012, 2018) or other algorithms (Yamada et al., 2007; Crowell et al., 2016) into JEEWS.
Recently we are developing a decision module which is used for combining results from different EEW algorithms. In this module, some rules are currently adopted, such as 1) the first alert is the fastest received result; 2) if multiple results are received in a time window of less than 1 s, the origin time, epicenter and depth from the one with the largest number of triggered stations are selected as the source parameters, and the magnitude is set as the largest one. Based on the results after decision, peak ground motion estimates at different target sites are calculated by using GMPEs. As the system runs, more suitable rules will be integrated into this module for further improving accuracy of the system.
Besides, in the near future we need to consider providing customized services from the perspectives of an end user, such as triggering interpretable alerts according to probabilistic risk-based estimation optimized for the preferences of a given stakeholder (Cremen and Galasso, 2020), or providing an open public (event or ground motion-based) service to users for building their own customized applications. This will further improve the efficiency of an EEWS and transform it into a more useful tool.
Data Availability Statement
The datasets for this study, including seismic waveforms recorded by broadband and short period seismic stations, the micro-electromechanical system (MEMS) based recordings, processing results of the earthquake early warning system (EEWS) and data latency for each station, can be obtained from the Sichuan Earthquake Administration (http://www.scdzj.gov.cn). Please contact jiang_0057@163.com for information about how to access the data for research purposes. The earthquake catalogs used for compared with results of the EEWS are acquired from the China Earthquake Network Center (CENC; http://news.ceic.ac.cn). All websites were last accessed in March 2021.
Author Contributions
CP analyzed the data and drafted the manuscript; PJ and PW carried out the experiment and test; QM, JS, and JY contributed to the design and helped to write the paper; YZ provided suggestions on the results and figure production. All authors contributed to the article and approved the submission.
Funding
This research was financially co-funded by the National Key Research and Development Program of China (2018YFC1504001), the Special Fund of the Institute of Geophysics, China Earthquake Administration (DQJB20R14, DQJB20B17), and the Beijing Natural Science Foundation (8202051).
Conflict of Interest
The authors declare that the research was conducted in the absence of any commercial or financial relationships that could be construed as a potential conflict of interest.
Acknowledgments
The authors are grateful to Editor MB, and two reviewers for their constructive advices that have significantly improved the manuscript. The authors also thank Sichuan Earthquake Administration for providing the seismic and ground motion recording data, the processing results of the earthquake early warning system and logging files for all stations’ data latency. The Generic Mapping Tools (GMT) software from Wessel and Smith (1998) and the MATLAB software with version R2015a were used in plotting part of the figures and are gratefully acknowledged.
References
Alick, H., Ozel, O., Apaydin, N., and Erdik, M. (2009). A Study on Warning Algorithms for Istanbul Earthquake Early Warning System. Geophys. Res. Lett. 36, L00B05. doi:10.1029/2008GL036659
Allen, R. M., and Melgar, D. (2019). Earthquake Early Warning: Advances, Scientific Challenges, and Societal Needs. Annu. Rev. Earth Planet. Sci. 47, 361–388. doi:10.1146/annurev-earth-053018-060457
Böse, M., Heaton, T. H., and Hauksson, E. (2012). Real-time Finite Fault Rupture Detector (FinDer) for Large Earthquakes. Geophys. J. Int. 191, 803–812. doi:10.1111/j.1365-246x.2012.05657.x
Böse, M., Smith, D. E., Felizardo, C., Meier, M. A., Heaton, T. H., and Clinton, J. F. (2018). FinDer v.2: Improved Real-Time Ground-Motion Predictions for M2-M9 with Seismic Finite-Source Characterization. Geophys. J. Int. 212, 725–742. doi:10.1093/gji/ggx430
Carranza, M., Buforn, E., and Zollo, A. (2017). Performance of a Network‐Based Earthquake Early Warning System in the Ibero‐Maghrebian Region. Seismological Res. Lett. 88 (6), 1499–1507. doi:10.1785/0220170081
Chen, Z., Chen, H., Zhao, C., Wang, Q., Hua, W., and Zhou, L. (2014). Measurement of Earthquake Size. Earthquake Res. China 28 (3), 285–298.
Chung, A. I., Meier, M. A., Andrews, J., Böse, M., Crowell, B. W., McGuire, J. J., et al. (2020). ShakeAlert Earthquake Early Warning System Performance during the 2019 Ridgecrest Earthquake Sequence. Bull. Seismol. Soc. Am. 110 (4), 1904–1923. doi:10.1785/0120200032
Cochran, E., Aagaard, B., Allen, R., Andrews, J., Baltay, A., Barbour, A., et al. (2018). Research to Improve ShakeAlert Earthquake Early Warning Products and Their Utitlity. U.S. Geol. Surv. Open-file Rept. 2018-1131, 1–24. doi:10.3133/ofr20181131Reston, Virginia
Colombelli, S., Zollo, A., Festa, G., and Kanamori, H. (2012). Early Magnitude and Potential Damage Zone Estimates for the Great Mw 9 Tohoku-Oki Earthquake. Geophys. Res. Lett. 39, a–n. doi:10.1029/2012gl053923
Cremen, G., and Galasso, C. (2020). Earthquake Early Warning: Recent Advances and Perspectives. Earth-Science Rev. 205, 103184. doi:10.1016/j.earscirev.2020.103184
Crowell, B. W., Schmidt, D. A., Bodin, P., Vidale, J. E., Gomberg, J., Renate Hartog, J., et al. (2016). Demonstration of the Cascadia G‐FAST Geodetic Earthquake Early Warning System for the Nisqually, Washington, Earthquake. Seismological Res. Lett. 87 (4), 930–943. doi:10.1785/0220150255
Cuéllar, A., Suárez, G., and Espinosa‐Aranda, J. M. (2017). Performance Evaluation of the Earthquake Detection and Classification Algorithm 2(tS-tP) of the Seismic Alert System of Mexico (SASMEX). Bull. Seismological Soc. America. 107 (3), 1451–1463. doi:10.1785/0120150330
Deng, Q., Zhang, P., Ran, Y., Yang, X., Min, W., and Chu, Q. (2003). Basic Characteristics of Active Tectonics of China. Sci. China Earth Sci. 46 (4), 356–372. doi:10.1360/03ys9030
Festa, G., Picozzi, M., Caruso, A., Colombelli, S., Cattaneo, M., Chiaraluce, L., et al. (2018). Performance of Earthquake Early Warning Systems during the 2016-2017 Mw 5-6.5 Central Italy Sequence. Seismol. Res. Lett. 89 (1), 1–12. doi:10.1785/0220170150
Hoshiba, M., Kamigaichi, O., Saito, M., Tsukada, S. y., and Hamada, N. (2008). Earthquake Early Warning Starts Nationwide in Japan. Eos Trans. AGU. 89 (8), 73–80. doi:10.1029/2008eo080001
Hsu, T., Lin, P., Wang, H., Chiang, H., Chang, Y., Kuo, C., et al. (2018). Comparing the Performance of the NEEWS Earthquake Early Warning System against the CWB System during the 6 February 2018 MW 6.2 Hualien Earthquake. Geophys. Res. Lett. 45, 6001–6007. doi:10.1029/2018GL078079
Hu, X., Cui, X., Zhang, G., Wang, G., Zang, A., Shi, B., et al. (2021). Analysis on the Mechanical Causes of the Complex Seismicity in Changning Area, China. Chin. J. Geophys. 64 (1), 1–17. doi:10.6038/cjg2021O0232 (in Chinese)
Kodera, Y., Saitou, J., Hayashimoto, N., Adachi, S., Morimoto, M., Nishimae, Y., et al. (2016). Earthquake Early Warning for the 2016 Kumamoto Earthquake: Performance Evaluation of the Current System and the Next-Generation Methods of the Japan Meteorological Agency. Earth Planets Space. 68 (202). doi:10.1186/s40623-016-0567-1
Kuyuk, H. S., and Allen, R. M. (2013). A Global Approach to Provide Magnitude Estimates for Earthquake Early Warning Alerts. Geophys. Res. Lett. 40, 6329–6333. doi:10.1002/2013gl058580
Lei, X., Wang, Z., and Su, J. (2019). The December 2018 ML 5.7 and January 2019 ML 5.3 Earthquakes in South Sichuan Basin Induced by Shale Gas Hydraulic Fracturing. Seismol. Res. Lett. 86 (3), 750–763. doi:10.1785/0220190029
Li, J., Zhou, B., Rong, M., Chen, S., and Zhou, Y. (2020). Estimation of Source Spectra, Attenuation, and Site Responses from strong-motion Data Recorded in the 2019 Changning Earthquake Sequence. Bull. Seismol Soc. Am. 110, 410–426. doi:10.1785/0120190207
Liu, J., and Zahradník, J. (2020). The 2019 MW 5.7 Changning Earthquake, Sichuan Basin, China: A Shallow Doublet with Different Faulting Styles. Geophys. Res. Lett. 47, e2019GL085408. doi:10.1029/2019gl085408
Meier, M.-A., Ampuero, J.-P., Cochran, E., and Page, M. (2021). Apparent Earthquake Rupture Predictability. Geophys. J. Int. 225, 657–663. doi:10.1093/gji/ggaa610
Meier, M.-A., Heaton, T., and Clinton, J. (2016). Evidence for Universal Earthquake Rupture Initiation Behavior. Geophys. Res. Lett. 43, 7991–7996. doi:10.1002/2016gl070081
Meier, M., Kodera, Y., Böse, M., Chung, A., Hoshiba, M., Cochran, E., et al. (2020). How Often Can Earthquake Early Warning Systems Alert Sites with High Intensity Ground Motion?. J. Geophys. Res. 125 (2), e2019JB017718. doi:10.1029/2019jb017718
Melgar, D., and Hayes, G. (2019). Characterizing Large Earthquakes before Rupture Is Complete. Sci. Adv. 5, eaav2032. doi:10.1126/sciadv.aav2032
Meng, L., Mcgarr, A., Zhou, L., and Zang, Y. (2019). An Investigation of Seismicity Induced by Hydraulic Fracturing in the Sichuan Basin of China Based on Data from a Temporary Seismic Network. Bull. Seismol Soc. Am. 109, 348–357. doi:10.1785/0120180310
Mittal, H., Wu, Y.-M., Sharma, M. L., Yang, B. M., and Gupta, S. (2019). Testing the Performance of Earthquake Early Warning System in Northern India. Acta Geophys. 67, 59–75. doi:10.1007/s11600-018-0210-6
Peng, C., Chen, Y., Chen, Q., Yang, J., Wang, H., Zhu, X., et al. (2017a). A New Type of Tri-axial Accelerometers with High Dynamic Range MEMS for Earthquake Early Warning. Comput. Geosciences. 100, 179–187. doi:10.1016/j.cageo.2017.01.001
Peng, C., Yang, J., Zheng, Y., Zhu, X., Xu, Z., and Chen, Y. (2017b). New τc Regression Relationship Derived from All P Wave Time Windows for Rapid Magnitude Estimation. Geophys. Res. Lett. 44, 1724–1731. doi:10.1002/2016GL071672
Peng, C., Jiang, P., Chen, Q., Ma, Q., and Yang, J. (2019). Performance Evaluation of a Dense MEMS-Based Seismic Sensor Array Deployed in the Sichuan-Yunnan Border Region for Earthquake Early Warning. Micromachines. 10, 735. doi:10.3390/mi10110735
Peng, C., Ma, Q., Jiang, P., Huang, W., Yang, D., Peng, H., et al. (2020). Performance of a Hybrid Demonstration Earthquake Early Warning System in the Sichuan-Yunnan Border Region. Seismol. Res. Lett. 91, 835–846. doi:10.1785/0220190101
Peng, C., Xue, B., Yang, J., Chen, Y., Li, J., Liu, M., et al. (2015). “A Low-Latency Seismic Recorder for Earthquake Early Warning,” in 5th International Conference on Information Engineering for Mechanics and Materials (ICIMM 2015) (Atlantis: Press). doi:10.2991/icimm-15.2015.167
Peng, H., Wu, Z., Wu, Y.-M., Yu, S., Zhang, D., and Huang, W. (2011). Developing a Prototype Earthquake Early Warning System in the Beijing Capital Region. Seismological Res. Lett. 82 (3), 394–403. doi:10.1785/gssrl.82.3.394
Satriano, C., Elia, L., Martino, C., Lancieri, M., Zollo, A., and Iannaccone, G. (2011). PRESTo, the Earthquake Early Warning System for Southern Italy: Concepts, Capabilities and Future Perspectives. Soil Dyn. Earthquake Eng. 31, 137–153. doi:10.1016/j.soildyn.2010.06.008
Sheen, D. H., Park, J. H., Chi, H. C., Hwang, E. H., Lim, I. S., Seong, Y. J., et al. (2017). The First Stage of an Earthquake Early Warning System in South Korea. Seismological Res. Lett. 88 (6), 1491–1498. doi:10.1785/0220170062
Stubailo, I., Alvarez, M., Biasi, G., Bhadha, R., and Hauksson, E. (2021). Latency of Waveform Data Delivery from the Southern California Seismic Network during the 2019 Ridgecrest Earthquake Sequence and its Effect on ShakeAlert. Seismol. Res. Lett. 92 (1), 170–186. doi:10.1785/0220200211
Tamaribuchi, K., Yamada, M., and Wu, S. (2014). A New Approach to Identify Multiple Concurrent Events for Improvement of Earthquake Early Warning (In Japanese). Zisin. 2 (67), 41–55. doi:10.4294/zisin.67.41
Trugman, D. T., Page, M. T., Minson, S. E., and Cochran, E. S. (2019). Peak Ground Displacement Saturates Exactly when Expected: Implications for Earthquake Early Warning. J. Geophys. Res. Solid Earth. 124 (5), 4642–4653. doi:10.1029/2018jb017093
Wessel, P., and Smith, W. H. F. (1998). New, Improved Version of Generic Mapping Tools Released. Eos Trans. AGU 79 (47), 579. doi:10.1029/98EO00426
Wu, Y.-M. (2014). Progress on Development of an Earthquake Early Warning System Using Low-Cost Sensors. Pure Appl. Geophys. 172 (9), 2343–2351. doi:10.1007/s00024-014-0933-5
Wu, Y. M., Liang, W. T., Mittal, H., Chao, W. A., Lin, C. H., Huang, B. S., et al. (2016). Performance of a Low‐Cost Earthquake Early Warning System (P‐Alert) during the 2016ML 6.4 Meinong (Taiwan) Earthquake. Seismological Res. Lett. 87 (5), 1050–1059. doi:10.1785/0220160058
Wu, Y. M., Mittal, H., Huang, T. C., Yang, B. M., Jan, J. C., and Chen, S. K. (2019). Performance of a Low‐Cost Earthquake Early Warning System (P‐Alert) and Shake Map Production during the 2018 Mw 6.4 Hualien, Taiwan, Earthquake. Seismol. Res. Lett. 90 (1), 19–29. doi:10.1785/0220180170
Xu, Y., Wu, Z., Jiang, C., Yu, Y., and Yang, J. (2008). Estimating the Size of an Earthquake Using Short-Period Seismograms of the First Three Seconds: A Simulated experiment Using the 1999 Jiji (Chi-Chi) Earthquake Sequence. Acta Seismologica Sinica. 30 (2), 135–143
Yamada, M., Heaton, T., and Beck, J. (2007). Real-time Estimation of Fault Rupture Extent Using Near-Source versus Far-Source Classification. Bull. Seismological Soc. America. 97 (6), 1890–1910. doi:10.1785/0120060243
Yi, G., Long, F., Liang, M., Zhao, M., Wang, S., Gong, Y., et al. (2019). Focal Mechanism Solutions and Seismogenic Structure of the 17 June 2019 MS 6.0 Sichuan Changning Earthquake Sequence. Chin. J. Geophys. 62 (9), 3432–3447. (in Chinese). doi:10.6038/cjg2019N0297
Zhang, H., Jin, X., Wei, Y., Li, J., Kang, L., Wang, S., et al. (2016). An Earthquake Early Warning System in Fujian, China. Bull. Seismological Soc. America. 106 (2), 755–765. doi:10.1785/0120150143
Keywords: earthquake early warning, hybrid seismic network, magnitude estimation, location accuracy, reporting time, data latency, changning earthquake
Citation: Peng C, Jiang P, Ma Q, Wu P, Su J, Zheng Y and Yang J (2021) Performance Evaluation of an Earthquake Early Warning System in the 2019–2020 M6.0 Changning, Sichuan, China, Seismic Sequence. Front. Earth Sci. 9:699941. doi: 10.3389/feart.2021.699941
Received: 24 April 2021; Accepted: 22 June 2021;
Published: 06 July 2021.
Edited by:
Maren Böse, ETH Zurich, SwitzerlandReviewed by:
Frédérick Massin, ETH Zürich, SwitzerlandJennifer Andrews, California Institute of Technology, United States
Copyright © 2021 Peng, Jiang, Ma, Wu, Su, Zheng and Yang. This is an open-access article distributed under the terms of the Creative Commons Attribution License (CC BY). The use, distribution or reproduction in other forums is permitted, provided the original author(s) and the copyright owner(s) are credited and that the original publication in this journal is cited, in accordance with accepted academic practice. No use, distribution or reproduction is permitted which does not comply with these terms.
*Correspondence: Chaoyong Peng, pengchaoyong@cea-igp.ac.cn