Evaluation of Forecast Performance for Four Meteorological Models in Summer Over Northwestern China
 Yuanpu Liu
 Tiejun Zhang1
  Cailing Zhao
- 1Key Laboratory of Arid Climatic Changing and Reducing Disaster of Gansu Province/Key Laboratory of Arid Change and Disaster Reduction of CMA/Northwestern Regional Center of Numerical Weather Prediction and Institute of Arid Meteorology, China Meteorological Administration, Lanzhou, China
- 2Center of Lanzhou Meteorological Observatory, Lanzhou, China
At present, numerical models, which have been used for forecasting services in northwestern China, have not been extensively evaluated. We used national automatic ground station data from summer 2016 to test and assess the forecast performance of the high-resolution global European Centre for Medium-Range Weather Forecast (ECMWF) model, the mesoscale Northwestern Mesoscale Numerical Prediction System (NW-MNPS), the global China Meteorological Administration T639 model, and the mesoscale Global/Regional Assimilation and Prediction System (GRAPES) model over northwestern China. The root mean square error (RMSE) of the 2-m temperature forecast by ECMWF was the lowest, while that by T639 was the highest. The distribution of RMSE for each model forecast was similar to that of the difference between the modeled and observed terrain. The RMSE of the 10-m wind speed forecast was lower for the global ECMWF and T639 models and higher for the regional NW-MNPS and GRAPES models. The 24-h precipitation forecast was generally higher than observed for each model, with NW-MNPS having the highest score for light rain and heavy storm rain, ECMWF for medium and heavy rain, and T639 for storm rain. None of the models could forecast small-scale and high-intensity precipitation, but they could forecast large-scale precipitation. Overall, ECMWF had the best stability and smallest prediction errors, followed by NW-MNPS, T639, and GRAPES.
Introduction
Numerical forecast products have become a mainstay of daily forecast services in modern meteorology (Chen and Xue, 2004; Yan et al., 2010), although objective assessments remain an important part of ongoing performance improvements (Pan et al., 2014; Xue and Pan, 2016). The presently used multiple numerical models have discrepancies in their predictive ability, resulting in different forecasting results by region (Wang, 2004; Gong et al., 2015; Jing et al., 2017; Zhang et al., 2017). Model selection, assessment, and correction are important aspects of accuracy evaluations aimed at providing objective forecasting criteria for users (Chen and Sun, 2005; Pan et al., 2013, 2014). In particular, testing and evaluating models by region improves the understanding of local forecast performance and enables model choice and results.
The main aspect of numerical model development is improved resolution. Although this can enhance forecast capacity for small- and medium-scale weather phenomena, it does not necessarily improve the accuracy of the forecast (Mass et al., 2002; Chakraborty, 2008). Small phase errors in a high-resolution model may lead to low hit rates and high false alarm rates, whereas some meso- and micro-scale physical processes may not be properly represented. This makes it necessary to test the accuracy of high-resolution numerical models using statistical and synoptic model dynamics, thermal diagnostic tools, and other forms of error correction. Objective and definitive test methods are commonly applied in most operational forecasts, including tests of precipitation forecasts, threat score (TS), equitable threat score (ETS), and false or missed alarm ratios. However, such tests can be too stringent and cannot indicate ways to improve performance (Wang and Yan, 2007; Zhang et al., 2011). Therefore, researchers have developed other spatial testing methods, such as the Method for Object-Based Diagnostic Evaluation (MODE) (Davis et al., 2006a) and the intensity-scale decomposition method (Casati et al., 2004; Csima and Ghelli, 2008; Casati, 2010), which allow forecasters to better understand the effects of model precipitation forecasts.
Northwestern China's complex surface terrain results in poorer model performance than in eastern China (Gong et al., 2015) because the forecast error increases in such terrains due to limited assimilated data input into the model and the difficulty involved in precisely simulating the true terrain (Pu et al., 2013). Such terrain generally makes the forecasting of surface meteorological elements more difficult (Zhang et al., 2013; He J et al., 2014), as it has a strong influence on meteorological elements, particularly precipitation (Huang et al., 2013). Summer precipitation is mostly affected by strong convective weather, and prominent uncertainties in model forecasts make it difficult to predict this type of weather (Pan et al., 2014). Most assessments for model-based precipitation forecasts (such as the commonly used synoptic weather and score tests) are currently focused on southern China and other rainy regions, whereas relatively few consider northwestern China. However, as northwestern China experiences vigorous weather system development in summer, with frequent meteorological disasters, accurate weather forecasting during this period is essential for reducing the impacts of such events (Shen et al., 2017), requiring improved model forecasting evaluations.
Many studies have tested numerical forecasting products. For example, Prakash et al. (2016) examined the effect of the National Center for Environmental Prediction—Global Forecast System (NCEP-GFS) model on the prediction of mesoscale monsoon precipitation in South Asia. Sales and Xue (2011) used the intensity-scale method to test the performance of the Regional Circulation Model model in the dynamic downscaling of precipitation in South America. Michael et al. (2008) compared the effects of five reanalysis datasets on precipitation forecasts. Furthermore, Gong et al. (2015) conducted a comparative study of the applicability of surface meteorological elements predicted by various numerical models in China. Numerical model forecast results can reflect the spatiotemporal distribution of meteorological elements to a certain extent and have a certain degree of applicability in China, but differences remain between these forecasts and observational data. For example, the global-scale European Centre for Medium-Range Weather Forecast (ECMWF) ensemble forecast is stable in forecasting light rain in central China but is incapable of distinguishing between degrees of heavy rain (Pan et al., 2017). The NCEP-GFS model can predict seasonal changes in temperature and relative humidity at the Atmospheric Radiation Measurement Southern Great Plains (SGP) site (Zhang et al., 2012). The high-resolution JAPAN model demonstrated higher forecasting skills in southeastern China than northwestern China and was better at forecasting precipitation on the eastern coast than on the west (Pan et al., 2014). The T639 model has a good performance in predicting the western Pacific subtropical high but shows large errors in its temperature forecast for Southern China (Guan, 2016). The trend in the activity of terrestrial meteorological elements predicted by the Beijing-Rapid Update Cycle numerical forecasting system is consistent with actual situations, and it can be used for short-term weather forecasting because of its high spatiotemporal resolution (Min, 2014). Some test methods, such as the intensity-scale decomposition method, have been applied to test the climatic surface temperature field (Li et al., 2016); Beijing-Rapid Update Cycle uses MODE as an objective test for precipitation forecasts (You et al., 2011).
The selection and application of the cumulus convection parameterization scheme in the numerical model have been demonstrated to be very important parameters in a precipitation simulation and forecast (Zhang et al., 2006). Different cumulus parameterization schemes under different precipitation systems have different forecast effects on precipitation intensity and falling areas in different regions and seasons. Different microphysical schemes have a greater impact on forecasting performance, such as the precipitation intensity and precipitation area (Cui et al., 2014). Jankov et al. (2005) found that no single physics combination performed best for all events. Bukovsky and Karoly, 2009 found that the Kain–Fritsch and the Betts–Miller–Janjic cumulus schemes performed similarly in mean precipitation over the United States, except over Florida where the Kain–Fritsch scheme performed better than the Betts–Miller–Janjic scheme. The cumulus schemes had the largest impact on the rainfall variability (Flaounas et al., 2011). Janson et al. (2012) evaluated the performance of a physics ensemble over southeast Australia and found that no single ensemble member was found to perform best for all events, variables, and metrics.
However, currently, relatively few analytical studies assess the predictive performance of multiple numerical models in northwestern China. In this study, we analyzed the ECMWF, the Northwestern Mesoscale Numerical Prediction System (NW-MNPS), the China Meteorological Administration T639, and the Global/Regional Assimilation and Prediction System (GRAPES) numerical models commonly used in northwestern China and evaluated the accuracy and diversity of their predictions in this region to provide an improved basis for numerical model selection in future.
Methodology and Models
Methodology
The model grid results in the horizontal direction were interpolated to the observational data by a bilinear interpolation algorithm using the closest four grid squares. The forecast values were initially interpolated linearly in one dimension and later in the other dimension to the observation location. We used the following tests to evaluate the results from each model against actual data from meteorological stations.
1) Continuous variable test
We used the root mean square error (RMSE) to represent the forecast effect of continuous variable elements:
where n is the number of observation stations, i is a station, fi is the forecast value, and oi is the observed value.
2) Precipitation scores test
We used mean error (ME), TS, ETS, and frequency bias (FBIAS) to test the effect of the model forecast of 24-h precipitation:
where tt is the number of precipitation days, t represents days, ft is the forecast precipitation value, ot is the observed precipitation value, nij is the counts in each forecast-observation category, i represents the forecast, j represents the observation, and “.” symbols represent sums across categories. Verification formulas are given in Table 1.
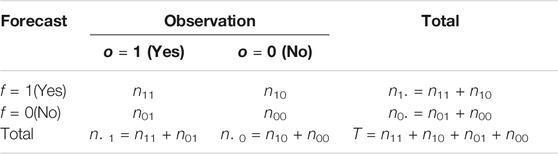
TABLE 1. Precipitation verification formulas.
3) Precipitation Object Test
The MODE method is mainly used to test precipitation spatial structures (Davis et al., 2006b). We used convolution thresholding to resolve objects in a raw data field, first by convolving with a simple filter function:
where f is the raw data field,
where R and H are not independent but rather are related by the requirement that the integral of
The radius of influence R is the only tunable parameter in the convolution process. Once R was chosen, H was determined by the equation discussed. Once the convolved field C was derived, it was thresholded to create a mask field M:
where the objects were the connected regions in which M = 1. The raw data were then restored to object interiors to obtain the object field F:
where the radius of influence R and threshold T control the entire process of resolving objects in the raw data field. Finally, the forecast and observational objects were compared.
4) Precipitation Intensity-Scale Test
We used the intensity-scale decomposition method (Casati, 2010) to evaluate the simulated field at different intensity thresholds and spatial scales. This required the test area to be a square second-order area (i.e., a grid area 2k × 2k, where k is a positive integer). The forecast and observation fields were first converted into a binary field that was then decomposed into components of different scales via the Haar filter method. Next, the mean square errors (MSEs) of each intensity, each scale, and a random field were calculated along, followed by the skill score for each intensity and scale. The MSE for each threshold (t) and each scale component (j) of the binary forecast and observation was calculated as follows:
The MSE for the random binary forecast and observation fields was calculated as follows:
where
The MSE for the random binary forecast was equipartitioned on the k + 1 scale to evaluate the skill score (SS):
The intensity-scale skill score was used to evaluate the forecast skill as a function of the precipitation intensity and spatial scale of the error.
Models
The NW-MNPS is based on version 3.6 of the WRF (Powers et al., 2017), which uses NCEP-GFS data as the initial field and boundary conditions and assimilated surface and sounding data in China with a spatial resolution of 9.0 × 9.0 km. The ECMWF is a global high-resolution model developed by the European Centre for Medium-Range Weather Forecasts that has been widely used by China's weather forecasting service (Mariano, 2002); we used data with a spatial resolution of 0.125 × 0.125°. The T639 model is a global midterm numerical forecast system developed by the Numerical Weather Forecasting Center of the China Meteorological Administration and has a high spatiotemporal resolution of 0.28125 × 0.28125° (Guan et al., 2008). GRAPES is a new generation of multi-scale meteorological numerical forecasting system developed by the Numerical Weather Forecasting Center of the Chinese Academy of Meteorological Sciences in 2001 (Chen and Shen, 2006). This model also uses NCEP-GFS data as the initial field and boundary conditions and has been continuously improved to reach version 4.0, with a spatial resolution of 0.1 × 0.1°. Some configurations of those models are shown in Table 2. NW-MNPS and GRAPES were run locally for 72 h and the others for 168 h; the initial time was chosen as 00:00 (UTC), as it represents the start time of forecasting; the NW-MNPS and GRAPES models were also started at this time. Overall, data were output every 3 h, but T639 data were output every 6 h after forecasting for 60 h; therefore, these were analyzed before 60 h. Because NW-MNPS was built in 2015, and the model was stable in 2016 after a 1-year test run, we selected the data for summer 2016 (June 1–August 31).
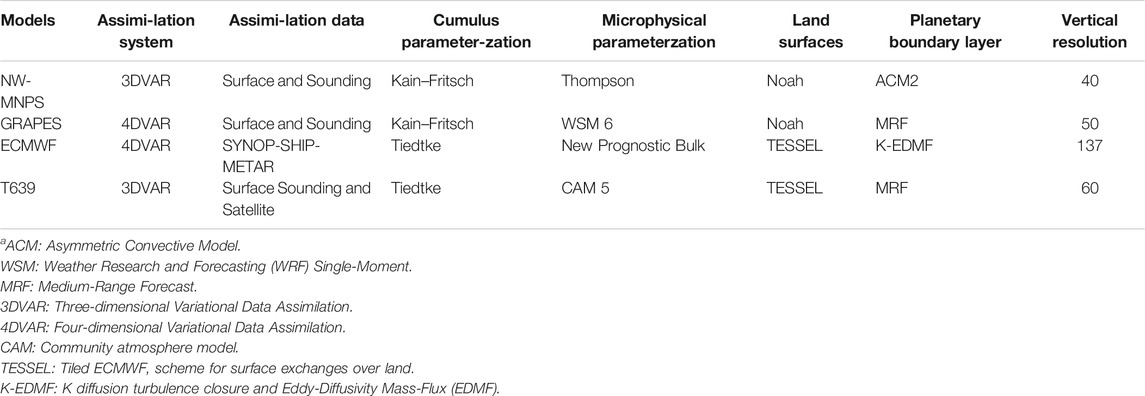
TABLE 2. Configurations of models.
Data
Hourly surface observational temperature (at 2-m height), wind (at 10-m height), and observed terrain data were sent to every regional bureau by the China Meteorological Administration, which has more than 2,400 stations. The data are subjected to quality control through climatological and regional threshold value checks and spatiotemporal consistency checks, resulting in 98.9% usability (Ren and Xiong, 2007). Data collected from all 2,400 stations were used in this study and converted into a readable American Standard Code for Information Interchange format. The observational data also included 24-h precipitation data, which were used to evaluate the forecast precipitation; these point data were assigned to the nearest model grid point for MODE analysis. The distribution of regional sites (707 points) in northwestern China is shown in Figure 1A.
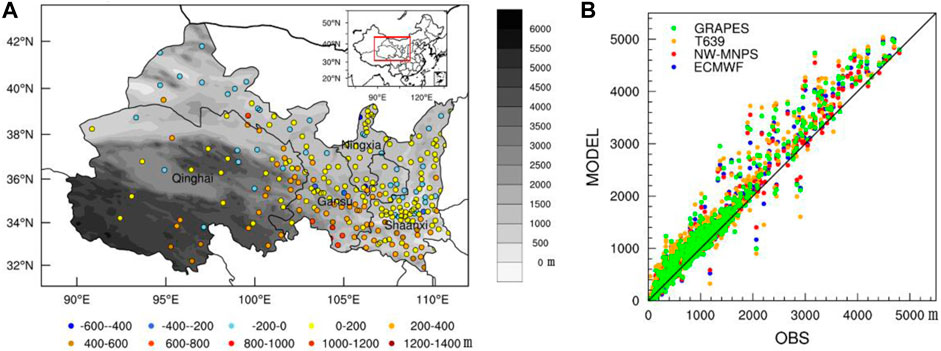
FIGURE 1. (A) Distribution of terrain height and differences between Northwestern Mesoscale Numerical Prediction System (NW-MNPS) and study area; (B) Terrain scatter plot for models and observation stations.
The distribution of terrain height differences between the NW-MNPS model and the study area by map (Figure 1A) and scatter plots (Figure 1B) showed that the model's terrain height was generally higher than that recorded for the observation stations, particularly in the plateau region. The terrain differences between the four models were not very large.
Multi-Model Forecast Effect Test
Temperature
The RMSE of the forecast temperature at 2 m increased to varying degrees for each model with increasing forecast time (Figure 2); ECMWF had the smallest increase, whereas T639 had the largest increase. Each model's forecast had similar daily patterns, with high daytime (0–12, 24–36, and 48–60 lead time) and low nighttime (12–24, 36–48, and 60–72 lead time) RMSE; ECMWF had the lowest RMSE value of 2.5°C, whereas T639 showed the highest value of 4.0°C. The RMSE of daily first forecast of 24-h temperature at 2 m (Figure 3) was lower for ECMWF and NW-MNPS (particularly the former) and higher for GRAPES and T639, suggesting that the former two had a relatively stable performance. The RMSE of the first forecast of 24 h for the temperature at 2 m (Figure 4) was generally 1.0–3.0°C for ECMWF but >5.0°C in some areas of southwestern Gansu Province, whereas that for NW-MNPS was generally 2.0–3.0°C but 4.0–5.0°C in southwestern Gansu Province and 3.0–5.0°C in central Shaanxi Province; however, it was >5.0°C in parts of Qinghai and Gansu Provinces for T639 and 2.0–5.0°C for GRAPES. T639 had the highest distribution of temperature at 2 m, whereas ECMWF showed the smallest distribution, with the RMSE of NW-MNPS being closer to the latter. The RMSEs for all models were relatively large in the plateau area, with a consistent distribution to that of differences between model and observed terrain height, indicating the effect of terrain difference on model prediction.
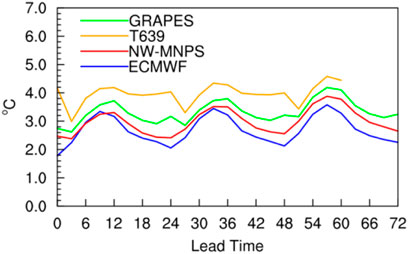
FIGURE 2. Average root mean square error (RMSE) of temperature at 2-m height by forecast time.
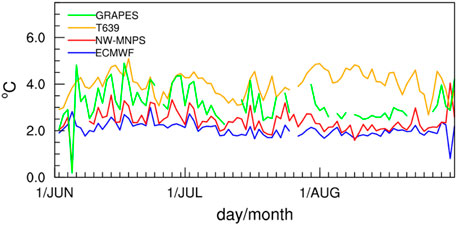
FIGURE 3. Daily variation in RMSE for temperature at 2-m height for 24-h forecast (starting at 00:00 UTC).
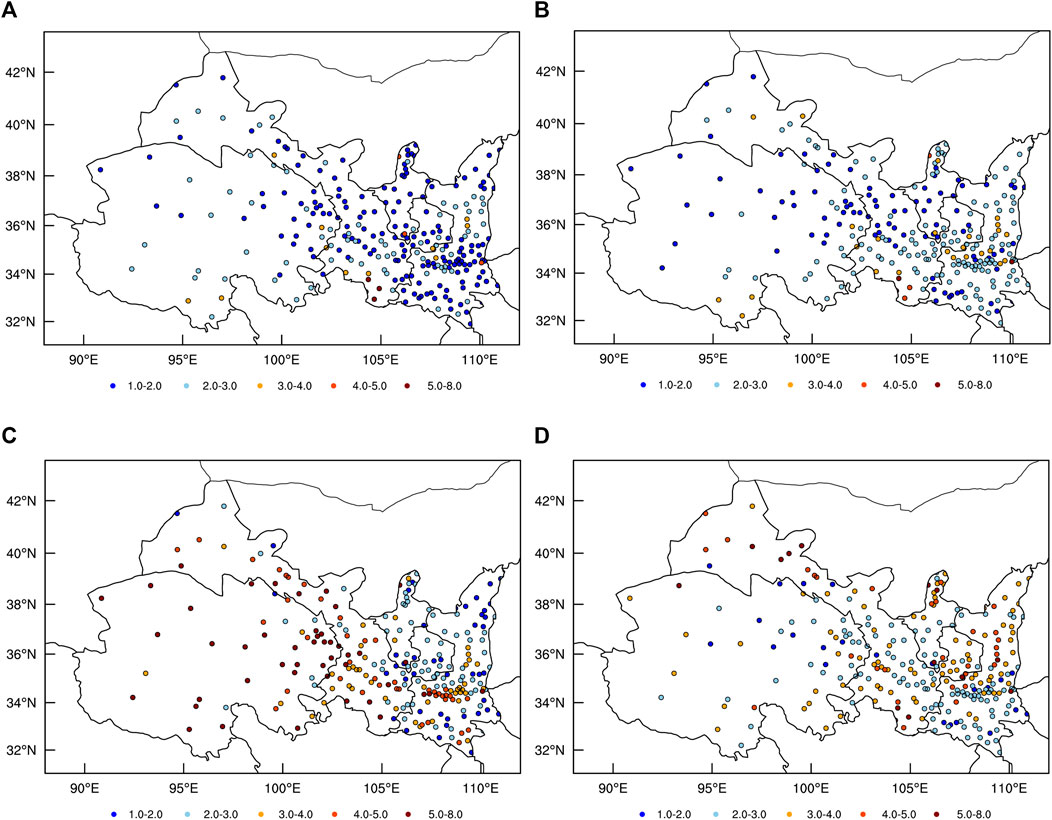
FIGURE 4. Distribution of RMSE for temperature at 2-m height. ECMWF: European Centre for Medium-Range Weather Forecast, GRAPES: Global/Regional Assimilation and Prediction System. (A) ECMWF. (B) NW-MNPS. (C) T639 (d) GRAPES.
Wind Speed
The RMSE for zonal and meridional wind speed at 10 m did not increase with forecast lead time for any model (Figure 5) but was consistently larger in daytime (0–12, 24–36, and 48–60 lead time) and smaller in nighttime (12–24, 36–48, and 60–72 lead time). These were lower for the global ECMWF and T639 and higher for the regional NW-MNPS and GRAPES, as the latter were better able to consider the impact of small-scale factors on wind speeds. The global models considered larger-scale factors and had lower resolutions (Mass et al., 2002), resulting in lower RMSEs. The RMSE of the lowest-resolution T639 was lower between the two global models, and that of NW-MNPS was lower among the regional models. These results were similar to those obtained by He X et al. (2014) using different resolution models.
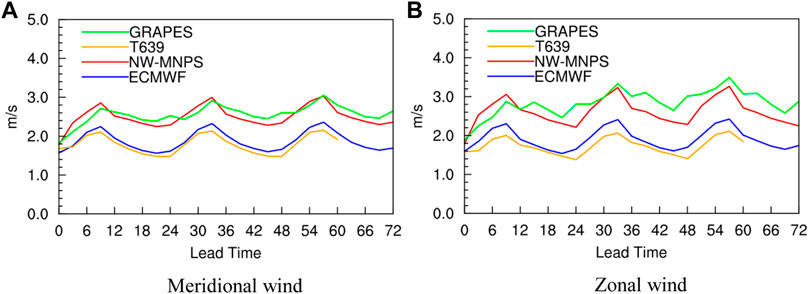
FIGURE 5. Average RMSE for meridional and zonal winds speed at 10-m height by forecast lead time. (A) Meridional wind. (B) Zonal wind.
The RMSE for daily variations in wind speed during the first forecast of 24 h at 10 m (Figure 6) had smaller fluctuations in T639 and ECMWF than in NW-MNPS and GRAPES (particularly the latter). Each model was relatively consistent, with daily fluctuations (small or large) occurring simultaneously. The RMSE for zonal winds (Figures 7A–D) showed that the ECMWF and T639 forecasts were generally lower than NW-MNPS and GRAPES. T639 showed the smallest RMSE value, and its distribution was similar to ECMWF. The distribution of NW-MNPS was consistent with GRAPES, being the lowest in southern and eastern Gansu and northern Ningxia but large in Shaanxi. The RMSE for meridional winds (Figures 7E–H) showed nearly identical distributions for all four models to zonal winds. The RMSE of T639 was the smallest, and that of GRAPES was the largest.
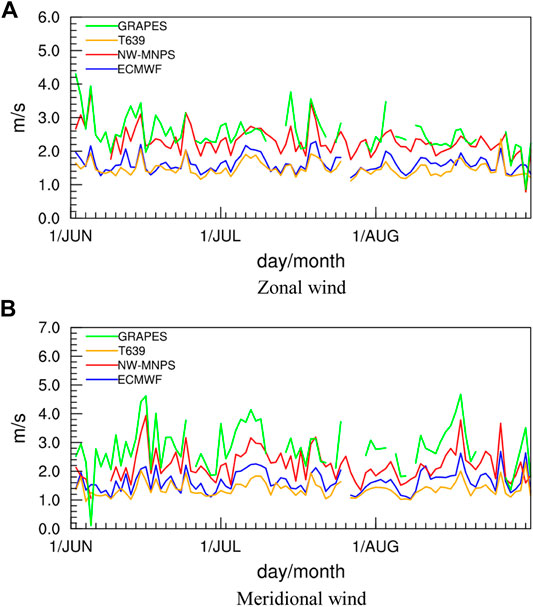
FIGURE 6. Daily variation in RMSE for meridional and zonal wind speeds at 10-m height for 24-h forecast. (A) Meridional wind. (B) Zonal wind.
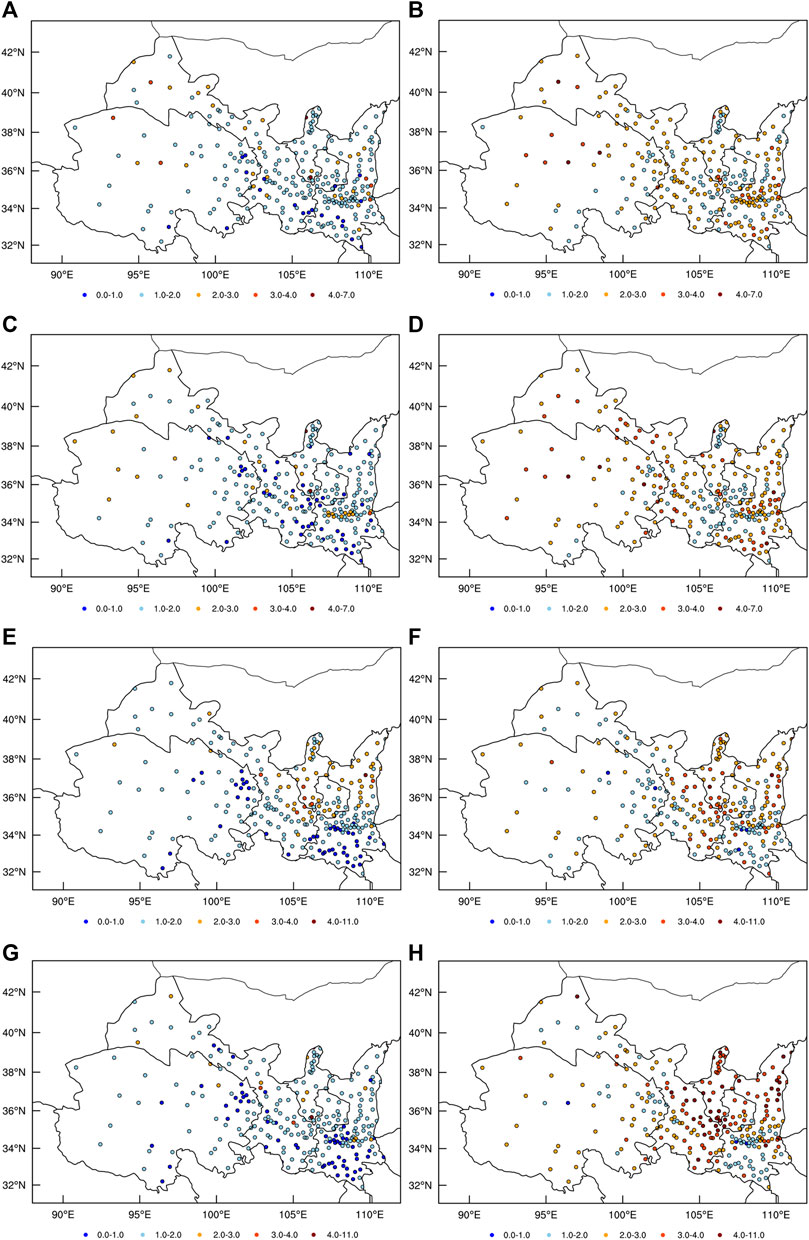
FIGURE 7. RMSE distribution of (A–D) zonal and (E–H) meridional wind speeds at 10-m height. (A) ECMWF. (B) NW-MNPS. (C) T639. (D) GRAPES. (E) ECMWF. (F) NW-MNPS. (G) T639. (H) GRAPES.
Twenty-Four-Hour Precipitation
Error Distribution
The function of triple2grid in the NCL software was used to assign each unstructured individual data point to the nearest rectilinear grid point; this function does not perform the interpolation. Moreover, we obtained the mean error distribution for the first forecast of 24 h of precipitation (Figure 8), which showed a higher amount of forecasted precipitation than that observed for all other models. Relative to observations, ECMWF forecasts more precipitation overall (although less in certain local areas), and the intensity of over forecasts or low forecasts was generally weak. NW-MNPS forecasts more precipitation over most of the area, particularly southern Qinghai, southwestern Gansu, and southern Shaanxi but forecasts less precipitation in western Gansu, northern Ningxia, and some of central Shaanxi. T639 forecasts comparatively more precipitation overall, particularly in the east of Gansu and southern Shaanxi. GRAPES generally forecasts more precipitation in Qinghai, eastern Gansu and Ningxia, and southern Shaanxi, particularly in southern Qinghai, Gansu, and southern Shaanxi. All four models, particularly the mesoscale NW-MNPS and GRAPES, forecast much higher precipitation than observed in the plateau region. The mean error distribution of 24-h precipitation at the 48 and 72 lead times was similar to the 24 lead time (the figs were omitted).
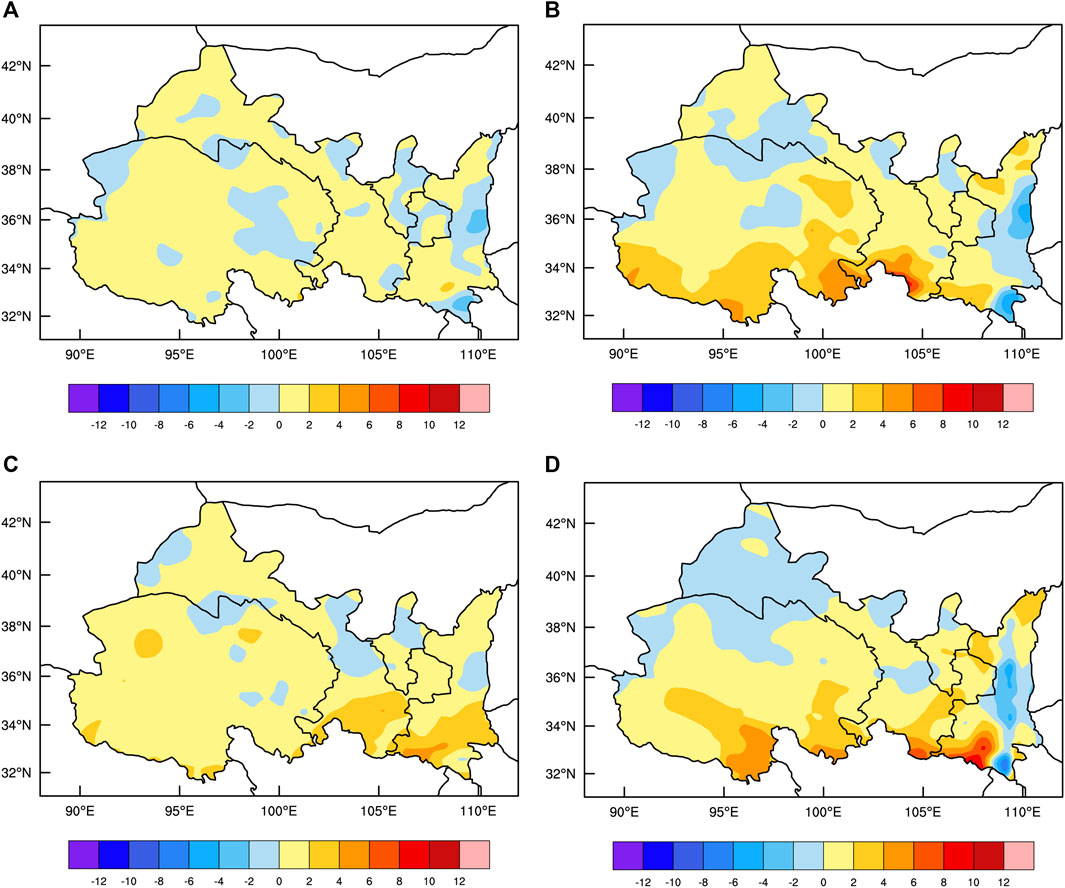
FIGURE 8. Mean error distribution for 24-h precipitation forecast. (A) ECMWF. (B) NW-MNPS. (C) T639. (D) GRAPES.
Score Tests
The accumulated precipitation test scheme was based on thresholds for 24-h precipitation of light rain (≥0.1 mm), moderate rain (≥10 mm), heavy rain (≥25 mm), storm rain (≥50 mm), and heavy storm rain (≥100 mm). The TS, ETS, and FBIAS of every model that forecasts a different magnitude of precipitation are shown in Figure 9. For TS and ETS, for light rain, NW-MNPS was the highest and ECMWF the lowest; for moderate and heavy rain, ECMWF was the highest and T639 the lowest; for storm rain, T639 was the highest and NW-MNPS the lowest; and for heavy storm rain, NW-MNPS was the highest and T639 the lowest. Overall, the regional models had higher scores for light and heavy storm rain, whereas the global models had higher scores for moderate storm rain. For FBIAS, all four models (particularly ECMWF and T639) forecast much more light rain than observed; for moderate rain, ECMWF forecast less rain, whereas the other three forecast much more; for heavy rain, the NW-MNPS forecasts matched observations, whereas GRAPES forecasts much more rain. ECMWF and T639 both forecast less rain; for storm rain and heavy storm rain, all four forecast less rain, but NW-MNPS and GRAPES had better forecasts than the other two.
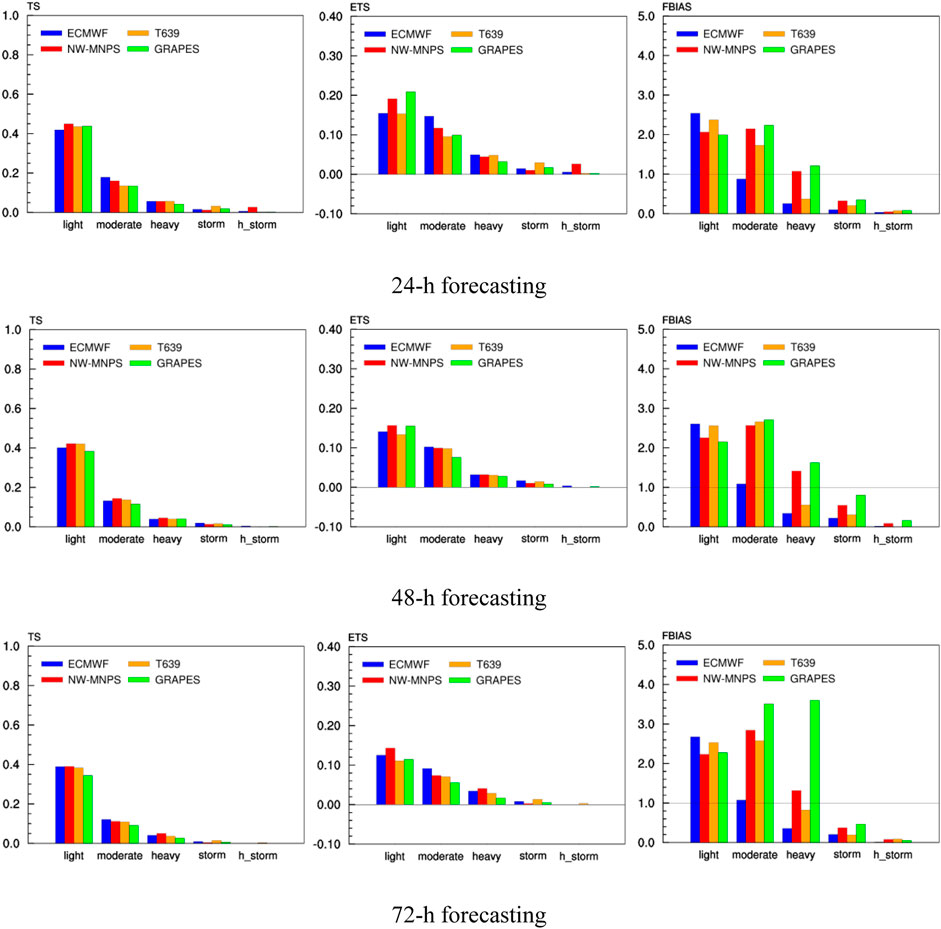
FIGURE 9. TS, ETS, and FBIAS of every model forecasting a different magnitude of 24-h precipitation. TS: threat score, ETS: equitable threat score, FBIAS: frequency bias. 24-h forecasting. 48-h forecasting. 72-h forecasting.
In the effect of different forecast lead times, TS and ETS for each model decreased as forecast lead time increased, with GRAPES having the largest reduction. The forecast bias of each model increased with increasing forecast time, particularly for GRAPES. GRAPES forecasts for moderate and heavy rain were three times more than the 72-h forecast lead time. Overall, ECMWF and NW-MNPS had relatively stable performances as forecast time increased.
Object Test
Major summer precipitation events (with heavy rainfall) occurring over most parts of northwestern China were selected. Object tests of such events were conducted to evaluate each model by its spatial forecast of first forecast 24-h accumulated precipitation (Figure 10). The test focused mainly on the angle difference, ratio of intersection area, area ratio, centroid distance, difference in 90% peak precipitation intensity, and total interest value to characterize forecast precipitation objects in the direction of centroid displacement, precipitation area, precipitation intensity, and overall performance. ECMWF predicted the smallest angle difference of precipitation, followed by NW-MNPS, whereas GRAPES and T639 had relatively large angle differences and showed instability (Figure 10A). The ratio of the intersection area was the highest in ECMWF, followed by NW-MNPS, and it was the lowest in GRAPES (Figure 10B). The precipitation areas forecast by all models were larger than observed, particularly for NW-MNPS and T639, whereas the area ratio of ECMWF was the smallest (Figure 10C). ECMWF and T639 had the smallest centroid differences, and NW-MNPS and GRAPES had the largest (Figure 10D), whereas the direction of centroid displacement deflected southwestward for all models. The 90% peak precipitation intensity difference showed that ECMWF predicted too little precipitation for intense precipitation, whereas NW-MNPS predicted too much (Figure 10E). The total interest value, which characterizes the overall performance of the model for the precipitation object, was generally similar for all models (Figure 10F).
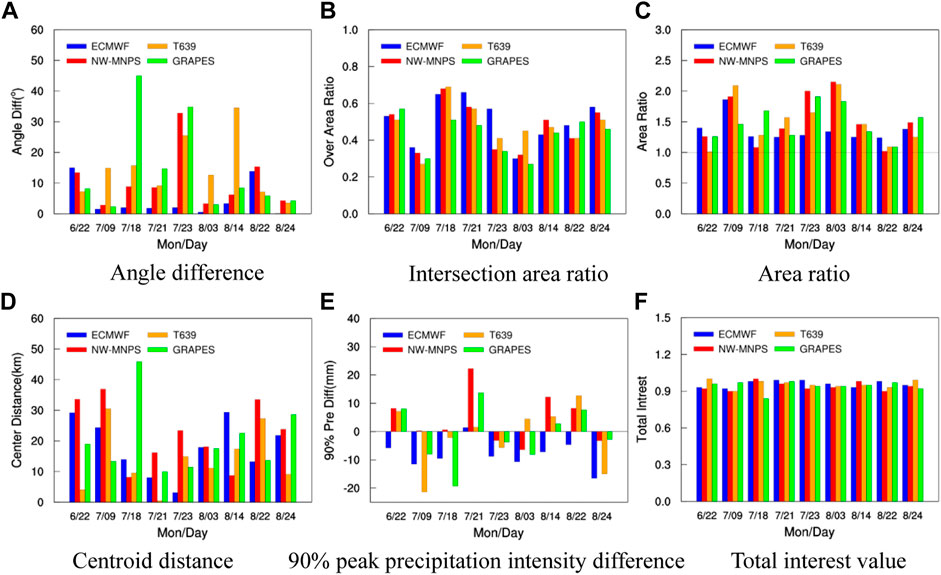
FIGURE 10. Object test of 24-h precipitation. (A) Angle difference. (B) Intersection area ratio. (C) Area ratio. (D) Centroid distance. (E) 90% peak precipitation intensity difference. (F) total interest value.
Each model had advantages and disadvantages in predicting precipitation. All indicators for ECMWF showed good predictive performance except for the underprediction of intense precipitation. NW-MNPS model showed good predictive performance in axis angle difference and intersection area ratio, but the area affected was greater, and the centroid distance was farther. GRAPES had a large angle difference and a small intersection area ratio. T639 had a large axis angle difference but a small centroid distance. Overall, the model performances were generally similar in the 24-h precipitation forecast.
Intensity-Scale Test
Each model had a large MSE for the forecast intensity of 10.0-mm precipitation, particularly NW-MNPS and GRAPES (Figure 11). The MSE of each model at the 72.0-km scale was relatively large, particularly for T639. All models had relatively small MSE for forecasts of both small-scale low-intensity precipitation and large-scale high-intensity precipitation. Each model had a negative skill score for the first forecast 24-h small-scale high-intensity precipitation, with NW-MNPS having the highest score; furthermore, all models had higher prediction and forecast skill scores for large-scale precipitation (Figure 12).
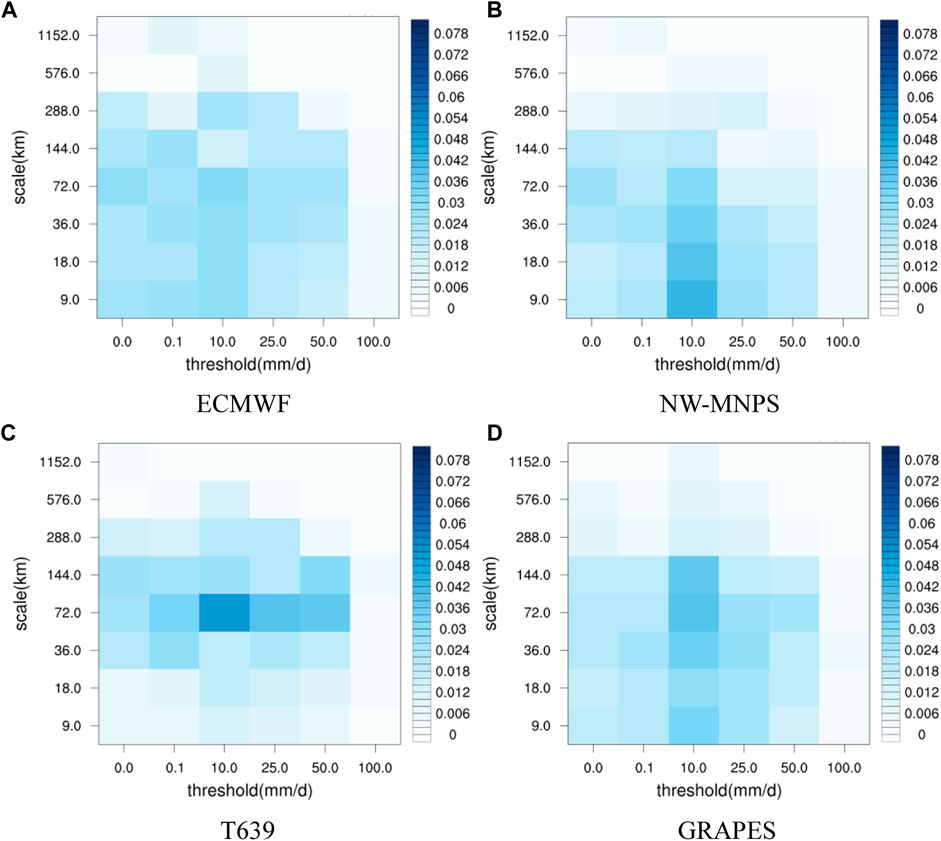
FIGURE 11. Distribution of MSE by model intensity and scale. (A) ECMWF. (B) NW-MNPS. (C) T639. (D) GRAPES.
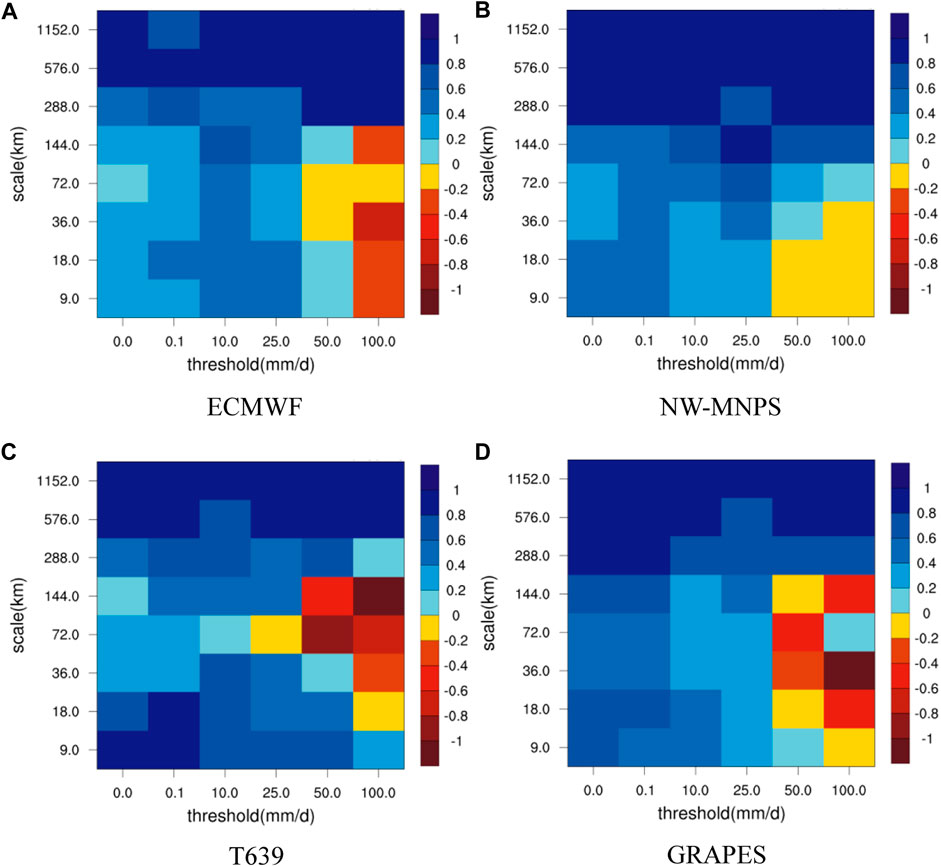
FIGURE 12. Distribution of intensity and scale skill scores for each model. (A) ECMWF. (B) NW-MNPS. (C) T639. (D) GRAPES.
Overall, different cumulus and microphysics parameterizations schemes were selected for each model, and each physical parameterization had different impacts on the precipitation forecast, such as precipitation intensity and falling areas. Each physical parameterization also resulted in a different simulated outcome in the precipitation system. Therefore, the models performed differently in every precipitation event in the analysis discussed; thus, the precipitation system should be classified first in future studies before the performance of the precipitation forecast of every model is tested.
Discussion and Conclusion
To assess the forecasting performance of the ECMWF, NW-MNPS, T639, and GRAPES models in Northwestern China, the main elements of temperature at 2 m, wind speed at 10 m, and 24-h precipitation were analyzed and assessed as forecasted by every model in the summer of 2016. The conclusions are presented as follows:
1) The RMSE of the forecast temperature at 2 m for each model was consistent with daily variations (daytime high and nighttime low); ECMWF had the smallest RMSE value, whereas T639 had the largest RMSE value. The daily mean RMSE of ECMWF and NW-MNPS varied marginally, particularly for the former. ECMWF had the lowest regional distribution, with NW-MNPS being similar. Each model had a larger RMSE in the plateau region, and the overall distribution reflected differences in height between models and observation stations.
2) The RMSE of the forecast zonal and meridional wind speeds at 10 m for each model was high during daytime and low at night; this was lower for the global ECMWF and T639 models and higher for the regional NW-MNPS and GRAPES models. The regional RMSE distribution was the smallest for T639, similar to ECMWF, whereas NW-MNPS and GRAPES were consistent with each other, being low in southern and eastern Gansu and northern Ningxia but large in Shaanxi.
3) All models generally forecast 24-h precipitation more than observed, particularly over the plateau region, and especially in the mesoscale NW-MNPS and GRAPES models. NW-MNPS had the highest scores for light rain, ECMWF for medium and heavy rain, T639 for storm rain, and NW-MNPS for heavy storm rain. ECMWF and NW-MNPS showed increasingly stable forecast performances with increasing forecast time. The total interest value of the precipitation objects forecast by each model was generally similar. No model had forecast skills for small-scale high-intensity precipitation but did have high forecast skills for large-scale precipitation.
The complex terrain and various land-surface conditions had a certain impact on the prediction performance of forecast models in northwestern China. As each model managed this problem differently, the performance of each model had unique advantages and disadvantages in the study region. Future model tests should consider these external factors for improved performance.
Data Availability Statement
The original contributions presented in the study are included in the article/Supplementary Material; further inquiries can be directed to the corresponding author.
Author Contributions
YL and TZ contributed to the conception of the study. YL and HD performed the data analyses and wrote the manuscript. YL, JW, DZ, and CZ prepared the figures. TZ and HD discussed the results and commented on the manuscript.
Funding
This research was financially supported by the National Natural Science Foundation of China (41805079). National Key Research and Development Program of China (2018YFC1506802), the China Meteorological Administration Special Public Welfare Research Fund (GYHY201506001), and the Innovation Team of Gansu Meteorological Bureau (GSQXCXTD-2020-02).
Conflict of Interest
The authors declare that the research was conducted in the absence of any commercial or financial relationships that could be construed as a potential conflict of interest.
Publisher’s Note
All claims expressed in this article are solely those of the authors and do not necessarily represent those of their affiliated organizations or those of the publisher, the editors, and the reviewers. Any product that may be evaluated in this article, or claim that may be made by its manufacturer, is not guaranteed or endorsed by the publisher.
Acknowledgments
The authors thank Professor Zhaoxia Pu and Chenghai Wang for providing constructive comments and suggestions. The Developmental Testbed Center provided the Model Evaluation Tools and technical assistance. The observed data, T639 model data, and ECMWF model data were provided by the Meteorological Information and Technical Equip Center of Gansu Province. The Center of Lanzhou Meteorological Observatory provided the GRAPES model results.
References
Bukovsky, M. S., and Karoly, D. J. (2009). Precipitation Simulations Using WRF as a Nested Regional Climate Model. J. Appl. Meteorol. Climatol 48, 2152–2159. doi:10.1175/2009jamc2186.1
Casati, B. (2010). New Developments of the Intensity-Scale Technique within the Spatial Verification Methods Intercomparison Project. Weather Forecast. 25, 113–143. doi:10.1175/2009waf2222257.1
Casati, B., Ross, G., and Stephenson, D. B. (2004). A New Intensity-Scale Approach for the Verification of Spatial Precipitation Forecasts. Meteorol. Appl. 11, 141–154. doi:10.1017/s1350482704001239
Chakraborty, A. (2008). The Skill of ECMWF Medium-Range Forecasts during the Year of Tropical Convection 2008. Mon. Weather Rev. 13, 3787–3805. doi:10.1175/2010mwr3217.1
Chen, D., and Shen, X. (2006). Recent Progress on GRAPES Research and Application. J. Appl. Meteorol. Sci. 17, 773–777. doi:10.1007/978-981-13-6382-5_1
Chen, D., and Xue, J. (2004). An Overview on Recent Progresses of the Operational Numerical Weather Prediction Models. Acta Meteorol. Sin. 62, 623–633.
Chen, H., and Sun, Z. (2005). Design of a Comprehensive Land Surface Model and its Validation Part II: Model Validation. Chinese. J. Atmos. Sci. 29, 272–282.
Csima, G., and Ghelli, A. (2008). On the Use of the Intensity-Scale Verification Technique to Assess Operational Precipitation Forecasts. Met. Apps 15, 145–154. doi:10.1002/met.49
Cui, J., Zhou, X., Yan, Q., Zhang, A., Li, D., Song, G., et al. (2014). Impact of Different Microphysical Processes of WRF Model on Precipitation Phase Forecasting in Northeast China. J. Meteorol. Env. 30, 01–06.
Davis, C., Brown, B., and Bullock, R. (2006a). Object-based Verification of Precipitation Forecasts. Part I: Methodology and Application to Mesoscale Rain Areas. Mon. Weather Rev. 134, 1772–1784. doi:10.1175/mwr3145.1
Davis, C., Brown, B., and Bullock, R. (2006b). Object-Based Verification of Precipitation Forecasts. Part II: Application to Convective Rain Systems. Mon. Weather Rev. 134, 1785–1795. doi:10.1175/mwr3146.1
De Sales, F., and Xue, Y. (2011). Assessing the Dynamic-Downscaling Ability over South America Using the Intensity-Scale Verification Technique. Int. J. Climatol. 31, 1205–1221. doi:10.1002/joc.2139
Flaounas, E., Bastin, S., and Janicot, S. (2011). Regional Climate Modelling of the 2006 West African Monsoon: Sensitivity to Convection and Planetary Boundary Layer Parameterisation Using WRF. Clim. Dyn. 36, 1083–1105. doi:10.1007/s00382-010-0785-3
Gong, W., Shi, C., Zhang, T., Jiang, L., Zhuang, Y., and Meng, X. (2015). Evaluation of Surface Meteorological Elements from Several Numerical Models in China. Clim. Env. Res. 20, 53–62.
Guan, C., Chen, Q., Tong, H., and Wang, H. (2008). Experiments and Evaluation of Global Medium Range Forecast System of T639L60. Meteorol. Mon. 34, 11–16.
Guan, Y. (2016). Performance Verification of Medium-Range Forecast by T639, ECMWF and Japan Models from June to August 2016. Meteorol. Mon. 42, 1140–1417.
He, J., Yu, Y., Liu, N., Zhao, S., and Chen, J. (2014). Impact of Land Surface Information on WRF’s Performance in Complex Terrain Area. Chin. J. Atm. Sci. 38, 484–498.
He, X., Zhou, R., and Sun, Y. (2014). Verification on Surface Wind Speed of Three Global Circulation Models in China. Plateau Meteorol. 33, 1315–1322.
Huang, R., Zhou, D., Chen, W., Zhou, L., Wei, Z., Zhang, Q., et al. (2013). Recent Progress in Studies of Air–Land Interaction over the Arid Area of Northwest China and its Impact on Climate. Chin. J. Atm. Sci. 37, 189–210.
Jankov, I., Gallus, W. A., Segal, M., Shaw, B., and Koch, S. E. (2005). The Impact of Different WRF Model Physical Parameterizations and Their Interactions on Warm Season MCS Rainfall. Weather Forecast. 20, 1048–1060. doi:10.1175/waf888.1
Janson, P. E., Marie, E., and Fei, J. (2012). Evaluating the Performance of a WRF Physics Ensemble over South-East Australia. Clim. Dyn. 39, 1241–1258.
Jing, L., Gao, J., Zhao, Z., Jing, L. J., Yang, X., Qin, R., et al. (2017). Test and Comparative Analysis on Precipitation Forecast Based on Several Numerical Forecast Models in Tacheng of Xinjiang. J. Arid Meteorol. 35, 134–141.
Li, J., Zeng, X., Chen, H., and Cai, Q. (2016). Application of the Intensity-Scale Technique for Verification of Climatological Surface Temperature Simulation. Chin. J. Atm. Sci. 40, 1117–1126.
Mariano, H. (2002). The Development and Testing of a New Two-Time-Level Semi-lagrangian Scheme (SETTLS) in the ECMWF Forecast Model. Q. J. Ro. Meteorol. Soc. 128, 1671–1687.
Mass, C. F., Ovens, D., Westrick, K., and Colle, B. A. (2002). Does Increasing Horizontal Resolution Produce More Skillful Forecasts. Bull. Amer. Meteorol. Soc. 83, 407–430. doi:10.1175/1520-0477(2002)083<0407:dihrpm>2.3.co;2
Michael, G. B., Junye, C., Franklin, R. R., and Rober, F. A. (2008). Evaluation of Global Precipitation in Reanalyzes. J. Appl. Meteorol. Clim. 47, 2279–2299.
Min, J. (2014). Evaluation on Surface Meteorological Element Forecast by Beijing Rapid Update Cycle System. J. Appl. Meteorol. Sci. 25, 265–273.
Pan, L., Zhang, H., Cheng, X., Qu, L., and Yuan, Y. (2017). Evaluation of Precipitation Probability Forecasts of ECMWF Ensemble Prediction System in Central China. Plateau Meteorol. 36, 138–147.
Pan, L., Zhang, H., Wang, J., and Ning, Z. (2014). An Objective Verification of Forecasting Ability of Japan High-Resolution Model Precipitation in China. Plateau Meteorol. 33, 483–494.
Pan, L., Zhang, H., Zhu, W., Wang, N., and Wang, J. (2013). Forecast Performance Verification of the ECMWF Model over the Northeast Hemisphere. Clim. Env. Res. 18, 112–123.
Powers, J. G., Klemp, J. B., Skamarock, W. C., Davis, C. A., Dudhia, J., Gill, D. O., et al. (2017). The Weather Research and Forecasting Model: Overview, System Efforts, and Future Directions. Bull Amer. Meteorol. Soc. 98, 1717–1737. doi:10.1175/bams-d-15-00308.1
Prakash, S., Momin, I. M., Mitra, A. K., Bhattacharjee, P. S., Yang, F., and Tallapragada, V. (2016). An Early Assessment of Medium Range Monsoon Precipitation Forecasts from the Latest High-Resolution NCEP-GFS (T1534) Model over South Asia. Pure Appl. Geophys. 173, 2215–2225. doi:10.1007/s00024-016-1248-5
Pu, Z., Zhang, H., and Anderson, J. (2013). Ensemble Kalman Filter Assimilation of Near-Surface Observations over Complex Terrain: Comparison with 3DVAR for Short-Range Forecasts. Tellus A: Dynamic Meteorology and Oceanography 65, 19620. doi:10.3402/tellusa.v65i0.19620
Ren, Z., and Xiong, A. (2007). Operational System Development on Three-step Quality Control of Observations from AWS. Meteorol. Mon. 33, 19–24.
Shen, H., Chen, L., Hu, P., Qiao, S., and Zhang, T. (2017). Dominant Spatial Patterns of Summer Precipitation and Circulation Characteristic in the Middle of Northwest China. Plateau Meteorol. 36, 455–467.
Wang, Y. (2004). Verification of Some Numerical Models to Precipitation in the Mid and South Parts of Qinghai Xizang Plateau in Summer of 2003. Plateau Meteorol. 23, 53–58.
Wang, Y., and Yan, Z. (2007). Effect of Different Verification Schemes on Precipitation Verification and Assessment Conclusion. Meteorol. Mon. 33, 53–61.
Xue, C., and Pan, L. (2016). Diagnostic Analysis of Precipitation Forecasting from Japan Thin-Grid Model Based on MODE. Plateau Meteorol. 35, 406–418.
Yan, Z., Wang, Y., and Zhu, G. (2010). The Review and Outlook on the Development of Operational NWP in NMC. Meteorol. Mon. 36, 26–32.
You, F., Wang, G., Guo, R., and Wei, D. (2011). The Application Analysis of MODE Method to the Rainfall Forecast Test. Meteorol. Mon. 37, 1498–1503.
Zhang, C., Ji, X., Ma, J., Yang, Y., and Chen, D. (2017). Verification of Numerical Forecast and its Application Products in Weather Forecast in Ningxia. J. Arid Meteorol. 35, 148–156.
Zhang, G., Zhang, J., Zhang, N., Hao, X., Li, Z., and Zheng, Y. (2011). The NWP Models Evaluation Based on Different Weather Type in Hebei. Meteorol. Mon. 37, 968–976.
Zhang, H., Pu, Z., and Zhang, X. (2013). Examination of Errors in Near-Surface Temperature and Wind from WRF Numerical Simulations in Regions of Complex Terrain. Weather Forecast. 28, 893–914. doi:10.1175/waf-d-12-00109.1
Zhang, M., Wang, A., Ji, Z., and Zhang, W. (2006). Influence of Different Precipitation Parameterization Schemes on a Simulated "03. 7" Heavy Rainfall Case. Chin. J. Atmos. Sci. 30, 441–452.
Keywords: meteorological model, test and assess, forecast performance, northwestern China, object test
Citation: Liu Y, Zhang T, Duan H, Wu J, Zeng D and Zhao C (2021) Evaluation of Forecast Performance for Four Meteorological Models in Summer Over Northwestern China. Front. Earth Sci. 9:771207. doi: 10.3389/feart.2021.771207
Received: 06 September 2021; Accepted: 16 November 2021;
Published: 17 December 2021.
Edited by:
Jing-Jia Luo, Nanjing University of Information Science and Technology, ChinaReviewed by:
Stefano Federico, National Research Council (CNR), ItalyEric Hendricks, National Center for Atmospheric Research (UCAR), United States
Copyright © 2021 Liu, Zhang, Duan, Wu, Zeng and Zhao. This is an open-access article distributed under the terms of the Creative Commons Attribution License (CC BY). The use, distribution or reproduction in other forums is permitted, provided the original author(s) and the copyright owner(s) are credited and that the original publication in this journal is cited, in accordance with accepted academic practice. No use, distribution or reproduction is permitted which does not comply with these terms.
*Correspondence: Yuanpu Liu, lyp@lza.ac.cn