Study on the dielectric properties and dielectric constant model of laterite
 Xingqian Xu
 Haijun Wang1
  Xin Qu
 Cheng Li
- 1College of Water Conservancy, Yunnan Agricultural University, Kunming, China
- 2School of Civil and Construction Engineering, Anyang Institute of Technology, Anyang, China
- 3School of Architectural Engineering, Kaili University, Kaili, Guizhou, China
The soil dielectric constant model reflects the relationship between the volumetric water content and the dielectric constant. The ground penetrating radar (GPR) could quickly, precisely and non-destructively obtain the water state of the soil layers. A reasonable and reliable dielectric constant model is of great significance for predicting, monitoring and exploring water migration in soils. Taking Yunnan laterite as an example, this study comprehensively considered the key physical factors (dry density, water content, temperature) of the in situ laterite dielectric properties. The dielectric properties and the influencing factors of laterite has been discussed with the laboratory tests by reshaping laterite, and the dielectric constant model was finally proposed to evaluate the natural water state of the laterite. The results show that the relative dielectric constant of laterite increases gradually with the increasing volumetric water content, dry density and temperature respectively. The water content is the most important influencing factor, secondly followed by temperature and dry density. The dielectric constant model of laterite was built based on the influence of dry density and temperature on the relationship between the relative dielectric constant and volumetric water content. The proposed multivariate model has a good prediction effect on the water content of laterite, and the prediction effects compared with other existing models are as follows: Multivariate model, Zhao model, Malicki model, Zhou model, Topp model, Liao mode and Herkelrath model. This model could be applied to evaluate the plastic limit index and the liquid limit index using the relative dielectric constant, and then finally estimate the soft and hard state grades of laterite. This study could provide a reference for the construction of laterite dielectric constant models in different regions, and a convenient way for the estimation of the laterite water content state and engineering categories.
1 Introduction
Laterite is widely distributed in the Yunnan-Guizhou plateau, eastern Sichuan, Hunan and Guangxi and other regions in China as a kind of special clay soil. It is a maroon highly plastic soil formed by intense weathering and lateritizaton of carbonate rocks. Laterite has special physical and mechanical properties such as high water content, high void ratio, high strength and low compressibility, etc. (Sun et al., 2014). The dry and wet climate in laterite region is obvious, the changes of surface water and groundwater are relatively complicated, and the soil dielectric constant mainly depends on the moisture content (Chen et al., 2012; Hu et al., 2021; Wang et al., 2022). Ground penetrating radar (GPR), time domain reflectometry (TDR) and frequency domain reflectometry (FDR) techniques based on soil dielectric properties were widely applied to estimate surface soil water content (Luo et al., 2019; Liu et al., 2022). In practical engineering applications, the soil dielectric constant could be quickly and accurately measured by the above nondestructive techniques to indirectly predict the spatial and temporal distribution of surface soil moisture (Wu et al., 2019; Qiu et al., 2022). Therefore, the laterite dielectric constant model has very important applications in the irrigation automatic control of regional agricultural, protection of soil ecological environment, geological disasters monitoring, evaluation of soil and water conservation, etc.
The dielectric constant of soil is a physical quantity used to characterize the soil dielectric properties or polarizability. It is always expressed as a relative dielectric constant, this is, the ratio of the real part of the dielectric constant to the vacuum dielectric constant. There are many factors affecting the dielectric properties of soil, especially water content is known as the decisive factor. In recent years, domestic and foreign scholars have deeply studied on the dielectric properties of soil with fruitful results. They found that the dielectric properties were not only affected by water content, but also affected by soil type, composition, texture, bulk density, temperature, dry density, porosity, saturation, humidity and test frequency (Chen et al., 2012; Liao et al., 2016; Christian et al., 2017; Lv et al., 2018; Dong et al., 2020; Xiao et al., 2020; Pan et al., 2021). However, the existing studies have built different dielectric constant models for the different soil types. The dielectric constant models of the same soil type was different due to different influencing factors. Thus, how to determine the key influencing factors of soil dielectric constant and to build a reliable soil dielectric constant model deserves further discussion.
At present, the soil dielectric constant models according to different influencing factors and applicable conditions are mainly divided into three categories: empirical models, volume mixing models, and diffusion models. As far as empirical models concerned, the empirical relationships of “dielectric constant-volume moisture content” for sandy soil, fluvo-aquic soil, aeolian sandy soil, paddy soil, loess, silty clay, cohesive soil and reconstructed soil were studied widely (Topp et al., 1980; Herkelrath et al., 1991; Malicki et al., 1996; Zhu et al., 2011; Zhao et al., 2016; Liao et al., 2019; Zhou et al., 2022; Mu et al., 2022). With respect to the mixing models, they were proposed after weighted average of volume fraction and dielectric constant of soil solid, liquid and gas phases. These models were widely applied in concrete, frozen soil and other engineering fields. The representative models included linear models, root mean square models and Rayleigh models (Roth and Schulin, 1990; Taoufik et al., 2012; Gou et al., 2018; Meng and Meng, 2018; Jin and Mohammod, 2019; Savin and Muzalevskiy, 2020; Fomin and Muzalevskiy, 2021; Xu et al., 2022). In terms of diffusion models, the soil was regarded as a homogeneous four-phase mixture according to the effective medium theory, and the relationships between the volume fraction of each single phase and dielectric constant were proposed. These models could describe the microscopic effects of continuous and dispersed phases using depolarization factors (Deloor, 1968; Dobson et al., 1985; Blonquist et al., 2006; Lv et al., 2016; Xu et al., 2019).
The existing soil dielectric constant models mainly established the relationships between the water content and the dielectric constant. The soil dielectric constant could be tested by non-destructive electromagnetic techniques to inverse the soil moisture content. In particular, the soil dielectric constant models were applied to evaluate the soil water content, compactness, hardness, structures, and related quality indicators (Liao et al., 2016; Liu et al., 2016; Kabir et al., 2020; Zhou et al., 2022). However, the sensitivity analysis of the influencing factors of dielectric properties and the laterite dielectric constant models for laterite were rarely reported. It limited the model applications in the fields of environmental geotechnology, agricultural soil ecological monitoring and soil remediation.
In this study, the basic physical and mechanical indexes of laterite were determined by in-situ sampling. The laboratory tests of the laterite dielectric properties has been done with water content, temperature and dry density as variables. The sensitivity of influencing factors were analyzed by regression statistics, and then the laterite multivariate model has been proposed finally. The existing empirical models was comprehensively simulated and compared for the water state of laterite, and the prediction accuracy of each model was evaluated respectively. In contrast, the multivariate model has higher accuracy for laterite water content prediction, and it could provide a reliable reference way for the division of soft and hard grades.
2 Materials and methods
2.1 Experiment materials
The laterite was taken from Yunnan Province in China, and the samples were maroon and hard plastic state after removing the disturbed soil. The samples were naturally air-dried, crushed and passed through a 2 mm mesh sieve, and then put into an oven at 105°C for 24 h, and the dried soil samples were stored into plastic boxes finally. According to “Standard for Soil Test Method” (GB/T50123-2019), routine soil tests had been done to give the specific gravity, moisture content, density and consistency limit of laterite. The basic physical parameters were in Table 1.
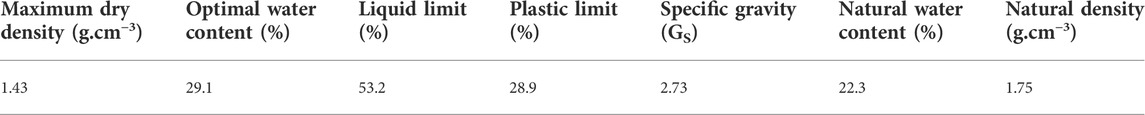
TABLE 1. The basic physical properties of laterite.
2.2 Experiment scheme
The soil column samples with a diameter of 61.8 mm and a height of 20 mm were prepared by the same volume mass method. The dielectric constant of samples with different water content and dry density were tested on the condition of different temperatures. A total of 108 groups of soil samples were prepared in the test, and three groups of parallel tests were used. The test results were averaged, and a total of 216 data were obtained. The specific experiment scheme as follows: ① The dry density was 1.15, 1.20, 1.25, 1.30, 1.35, and 1.40 g/cm3;② The mass water content around the optimal water content was 19%, 22%, 25%, 28%, 31%, and 34%; ③ The temperature was controlled at 5°C, 10°C, 15°C, 20°C, 25°C, and 30°C; ④ The soil column samples were made according to the above water content and dry density, and the relative dielectric constants were measured under different temperature conditions.
2.3 Experiment procedure
The specific experiment procedure as follows:① The dry soil mass corresponding to different dry densities was separately weighed using the same volume mass method; ② The soil column samples with different mass water content were prepared separately, and left for 12 h to make the moisture evenly distributed; ③ The soil column samples with diameter of 61.8 mm and height of 20 mm were made by compaction tests; ④ The prepared test samples were sealed with plastic wrap and placed in an incubator for 8 h, and then the dielectric constants were measured under different temperatures using the VC4090A LCR digital bridge; ⑤ The soil column samples after the test were dried to measure the actual water content compared with the predesigned, and the average of mass water content was converted to volumetric water content.
2.4 Experiment principle
The improved parallel plate electrode device was used to measure the relative dielectric constant of soil samples. The capacitance of soil samples was measured with parallel plate capacitance method to give the relative dielectric constant. The test principle and device were separately shown in Figure 1 and Figure 2. The VC4090A LCR digital bridge was connected with the parallel plate electrode wires. The copper electrodes with a diameter of 62 mm were closely contacted with the top and bottom of the samples, and the same pressure was applied. The capacitance of the samples has been tested with the same frequency and voltage. The relative dielectric constants were calculated by Eq. 1 as follows:
Here,
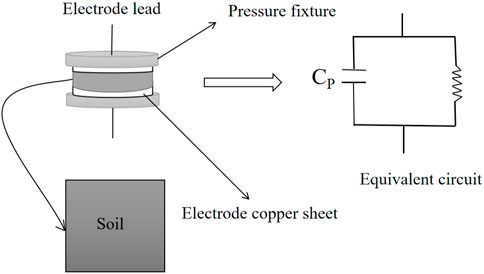
FIGURE 1. Principle of parallel plate capacitance test.
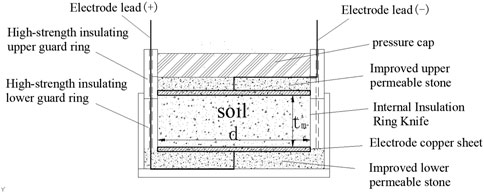
FIGURE 2. Improved parallel plate electrode device.
3 Results and discussion
3.1 Influencing factors of laterite dielectric properties
3.1.1 Water content
In the three phases of soil, the proportion of water not only affects the physical properties, but also plays a decisive role in the soil dielectric properties. To investigate the effect of water content on the dielectric properties of laterite, the dry density of 1.20 g cm−3 and the temperature of 20°C were controlled respectively. The relationships between relative dielectric constant and water content at different temperatures were shown in Figure 3A. The relationships between the relative dielectric constant and water content under different dry densities were shown in Figure 3B. It could be seen that the variations of relative dielectric constant with water content were more significant on the condition of different dry densities and temperatures.
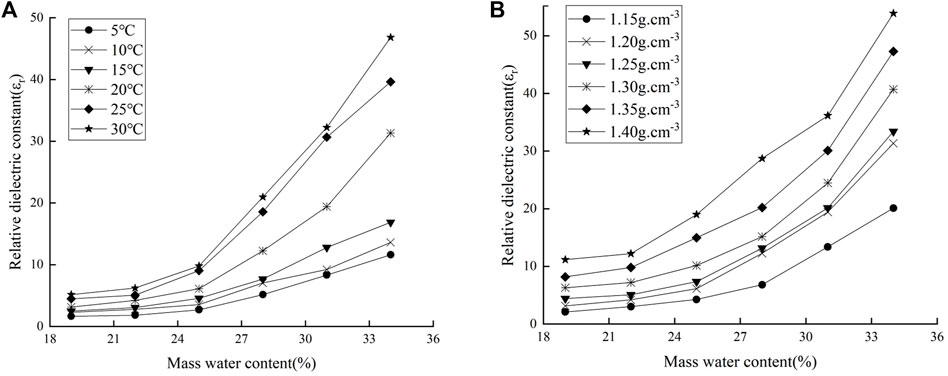
FIGURE 3. Relationship between water content and relative dielectric constant of laterite [(A)
As shown in Figure 3, the relative dielectric constant gradually increases with the increasing water content. When the water content was low, the soil particles constituted the basic skeleton of the soil, and the relative dielectric constant was relatively less affected by the soil itself. With the gradual increase of water content, the polarization of free water increases in the soil, and the relative dielectric constant increases significantly. At the same time, the free water on the soil surface increases with the increasing temperature and dry density, and the Brownian motion and the polarization ability of free water intensifies, so the relative dielectric constant changes more obviously.
3.1.2 Dry density
The compaction of soil particles has the important effect on the dielectric properties. The spacing among soil particles variate with the increasing dry density to affect the polarization of the electric field on the particles surface. When the temperature was 15°C, the relationships between relative dielectric constant and dry density under different water content was shown in Figure 4A. When the water content was 28%, the relationships between the relative dielectric constant with dry density under different temperatures was shown in Figure 4B. The variations of dielectric constant with dry density was more obvious under the same water content conditions.As shown in Figure 4, the relative dielectric constant increases with the increasing dry density, and it is basically proportional to the dry density. Because the laterite itself has strong water absorption, so it has large pores and low relative dielectric constant when dry density is low. The contact area among soil particles increases with the increasing dry density, but the water volume remains constants, so that the thickness of the water film and the relative dielectric constant increases uniformly. The relative dielectric constant gradually increases under the same dry density when the pore water affected by the increasing water content. Meanwhile, the relative dielectric constant also gradually increases with the increasing activity of water molecules from the increasing temperature.
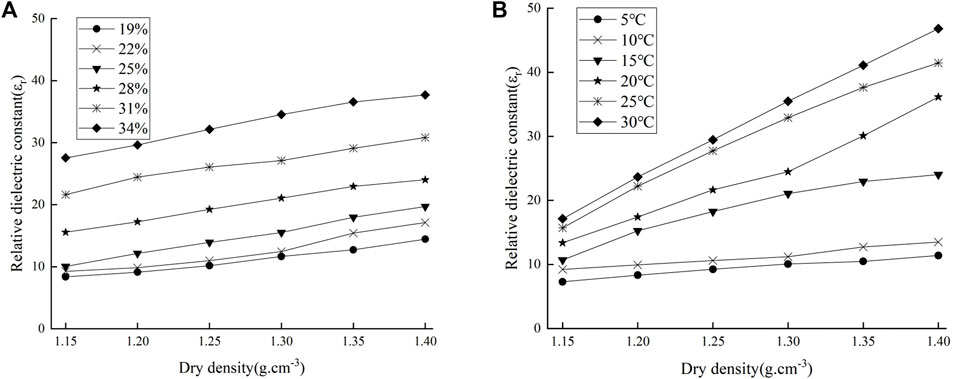
FIGURE 4. The relationship between dry density and relative dielectric constant of laterite [(A) T = 15°C; (B)
3.1.3 Temperature
Temperature is an important factor affecting the dielectric properties of soil. The thermal movement of water molecules intensifies to affect the density, viscosity and polarizability of water in the soil with the increasing temperatures. To investigate the influence of temperature on the relative dielectric constant, the dry density of 1.15 g cm−3 and the water content of 28% were controlled respectively. The relationships between the relative dielectric constant and temperature under different water content were shown in Figure 5A. The relationships between the relative dielectric constant and temperatures under different dry densities were shown in Figure 5B.
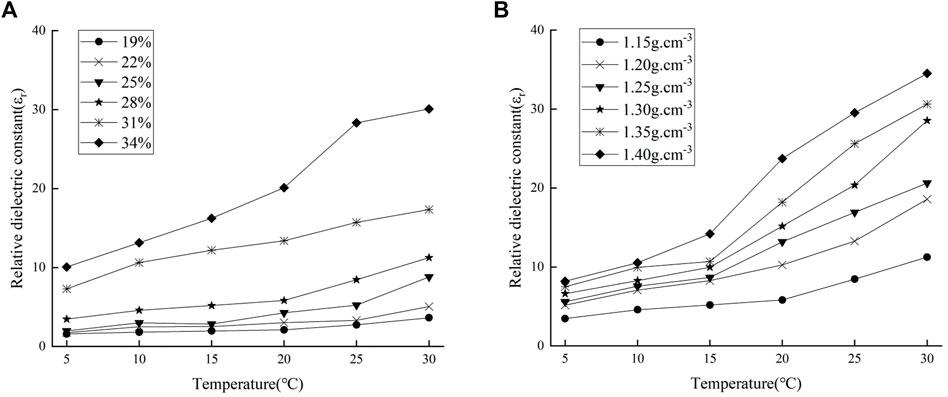
FIGURE 5. The relationship between temperature and relative dielectric constant of laterite [(A)
As shown in Figure 5, the relative dielectric constant shows a gradually increasing trend with the temperatures, and the polarization ability of pore water in the soil were accelerated. The relative dielectric constant in Figure 5A continued to increase on the condition of dry density 1.15 g cm−3, especially when the water content was greater than 28%. It could be seen that the relative dielectric constant in Figure 5B gradually increased with the increasing temperature, especially when the temperature was greater than 15°C. The reason was that the thickness and the active of water film on soil surface was simultaneously enhanced in the soil.
3.1.4 Sensitivity analysis
The significant correlation analysis between the relative dielectric constant and the influencing factors was the basis of the dielectric constant model construction. Based on the least squares method, the partial variance was minimized, and the relative dielectric constant was taken as the target factor (dependent variable). The water content, dry density and temperature were used as various factors (independent variables). The results of multiple regression statistical analysis were shown in Table 2.

TABLE 2. Results of multiple regression statistical analysis.
As seen from Table 2, the relative dielectric constant was significantly correlated with water content, dry density and temperature (p < 0.01), the tolerances were between 0.999 and 1.000, and the VIF values were between 1.000 and 1.001. It showed that the collinearity between the independent variables was very weak, and the key regression factors of the dielectric properties were water content, dry density and temperature. The greater the absolute value of the standardized partial regression coefficient (Beta), the greater the influence of independent variable on the target factor. It concluded that the influence of water content on the relative dielectric constant was the largest, followed by temperature, and dry density was the smallest.
3.2 Construction of laterite dielectric constant model
3.2.1 Model building method
Currently, the most representative empirical relationship between soil dielectric constant and volumetric water content is the Topp model (Topp et al., 1980), and the general expression is:
Here,
In Eq. 3,
It effectively improves the prediction accuracy of soil water content, but Eq. 4 is complex with relatively poor engineering applicability. Subsequently, Siddiqui and Drnevich (1995) established a more simplified empirical formula:
where w is the mass water content, and
In Eq. 6, A, B, and C are undetermined parameters, which are related to the dry density. Based on the simulation analysis on the field (Zhao et al., 2016), the following relationship was obtained:
Liao et al. (2016) established an empirical model of soil dielectric constant for loess with different sand contents:
Zhou et al. (2022) obtained a linear relationship between
In summary, it was beneficial for improving the accuracy of dielectric constant model considering the influence of dry density on dielectric properties. Based on the sensitivity analysis of influencing factors, the water content is the main factor, followed by temperature, and the dry density has the least impact. Therefore, the influence of temperature and dry density as the key factors should be considered when the relationship of “relative dielectric constant-volume water content” was built for laterite.
3.2.2 Model building analysis
The influence of dry density and temperature is the basis of laterite dielectric constant model. To investigate the influence of both factors on the relationship between relative dielectric constant and volumetric water content, the experimental data were analyzed. The relative dielectric constants increased with the increasing volumetric water content under the different dry densities shown in Figure 6 when the temperature was 20°C. Meanwhile, the relative dielectric constants increased with the increasing volumetric water content under the different temperatures shown in Figure 7 when the dry density was 1.25 g cm−3. The relationship between the relative dielectric constant and volumetric water content shown in Figure 8 has been obtained on the conditions of the temperature range of 5°C–30°C, the dry density range of 1.15–1.40 g cm−3 and the water content range of 19%–34%.
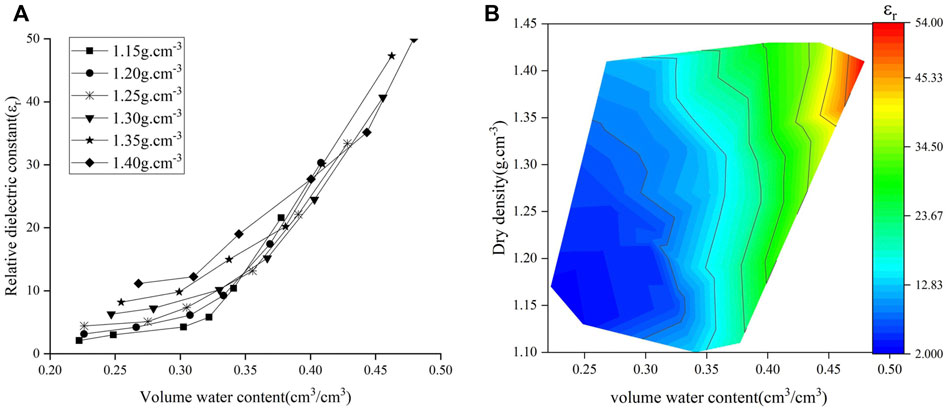
FIGURE 6. Relationship between water content, dry density and relative dielectric constant of laterite (T = 20°C). (A) The relationship between volume water content and relative dielectric constant of laterite (T = 20°C); (B) The relationship between volume water content, dry density and relative dielectric constant of laterite (T = 20°C).
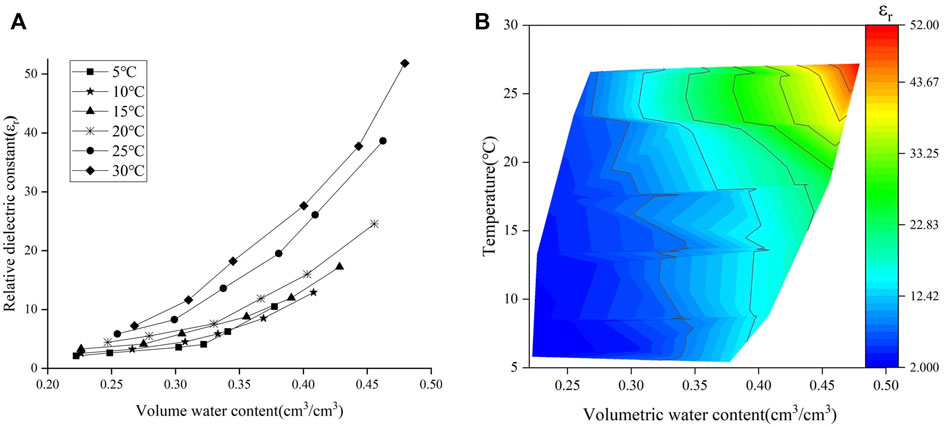
FIGURE 7. Relationship between water content, temperature and relative dielectric constant of laterite (
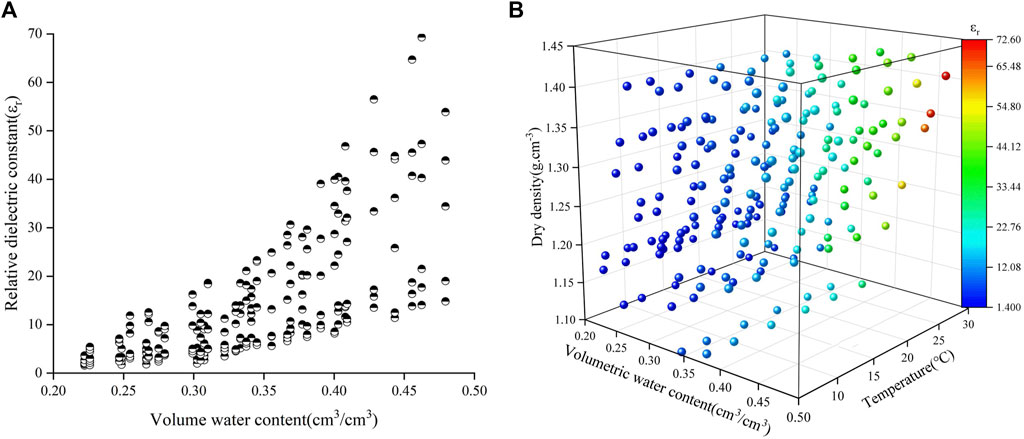
FIGURE 8. Relationship between dry density, water content, temperature and relative dielectric constant of laterite. (A) The relationship between volume water content and relative dielectric constant of laterite; (B) The relationship between volume water content, temperature, dry density and relative dielectric constant of laterite.
As shown in Figure 6, the experimental and numerical results are highly consistent, and the relative dielectric constant increases with the increasing dry density and volumetric water content. The reason was that the dry density gradually increased with the decreasing pores and the increasing particles contact area in the soil, so that the free water was squeezed into the soil surface result in the increase of dielectric constant. As shown in Figure 7, the experimental results agree well with the numerical results, and the relative dielectric constant increases with both the temperature and volumetric water content. The reason was that the increasing temperature accelerated the Brownian motion of free water in soil for the electric field variations. As shown in Figure 8, it shows that the relative dielectric constant has significant correlation with volumetric water content, dry density and temperature. Therefore, the influence of dry density and temperature could not be ignored when the dielectric constant model of laterite was built.
Based on the above analysis, this study proposed the influence of dry density and temperature on the parameters of Herkelrath model for laterite. The relative dielectric constant and volumetric water content of laterite were brought into the Herkelrath model to get the parameters
Here,
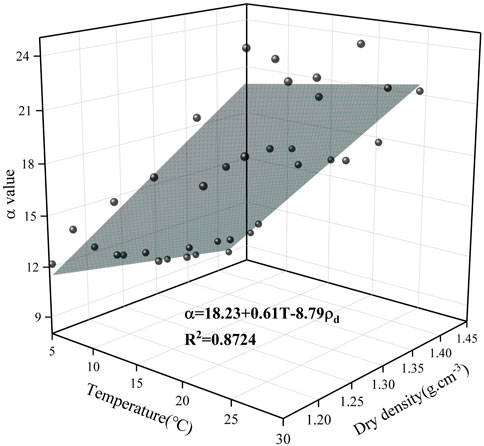
FIGURE 9. The relationship between
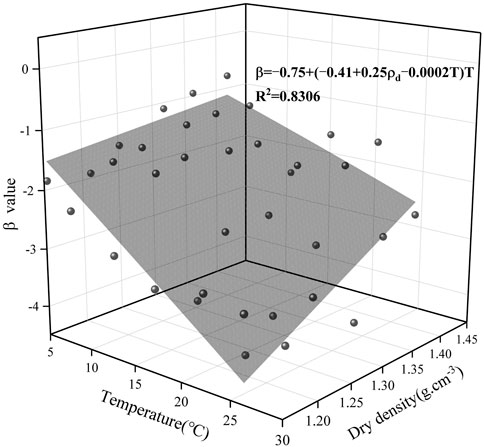
FIGURE 10. The relationship between
As seen from the fitting results in Figure 9 and Figure 10,
3.3 Simulation verification of laterite dielectric constant model
3.3.1 Simulation comparison verification
The comparison analysis of the existing empirical models and the multivariate model were applied together on the prediction of laterite water content, and this is an effective way to verify the reliability of the multivariate model. A total of 216 groups testing data of volumetric water content and relative dielectric constant were brought into Eqs 2, 3, 4, 7, 8, 9, 12 on the condition of the temperature 5°C–30°C and the dry density 1.15–1.40 g cm−3. The fitting results of each model and the correlation R were in Table 3.
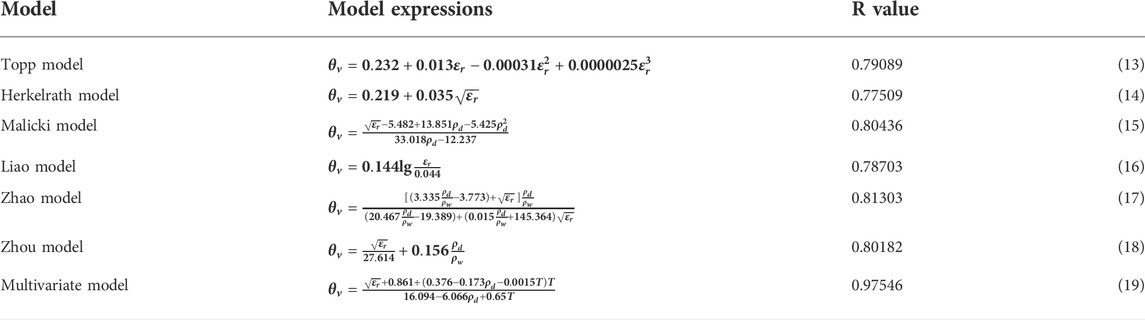
TABLE 3. Expressions of seven empirical models for laterite.
The simulating results of single variable models in Figure 11 and the bivariate variable models in Figure 12 were compared with the test data respectively, and the multivariate variable models was shown in Figure 13. The specific expressions of all the models including the Topp model, Herkelrath model, Malicki model, Liao model, Zhao model, and Zhou model for laterite were shown in Table 3. The multivariate model compared with the other models has the best accuracy for the relationship between the volume water content and the relative dielectric constant for laterite.
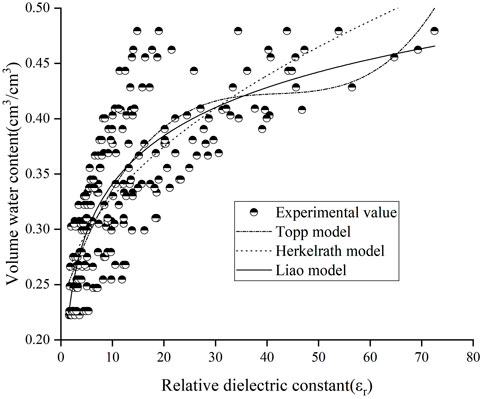
FIGURE 11. Comparative analysis of single variable simulation for latertite.

FIGURE 12. Comparative analysis of bivariate simulation for latertite.
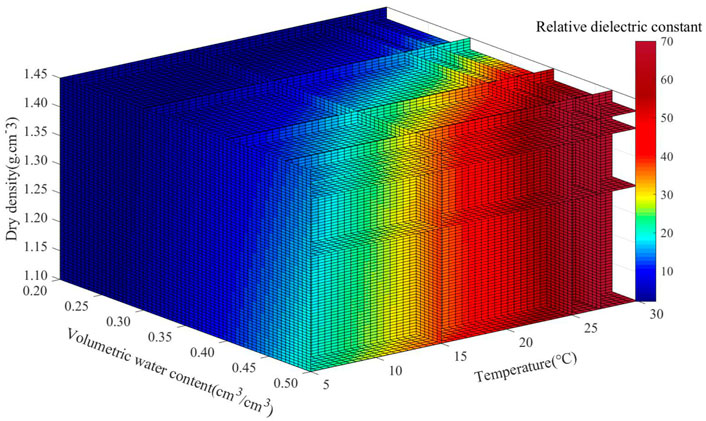
FIGURE 13. Multivariate simulation analysis for laterite.
3.3.2 Evaluation of simulation comparison verification
The root mean square error (RMSE) was used to accurately evaluate the predicting effect of each model on the water content as follows:
Where

TABLE 4. Root mean square error of seven models.
The root mean square error of the multivariate model was the smallest in Table 4. The prediction effects of seven models on the laterite water content were as follows: Multivariate model, Zhao model, Malicki model, Zhou model, Topp model, Liao model, and Herkelrath model. This study has built the multivariate model for laterite considering the influence of temperature and dry density on the dielectric properties in situ field. The multivariate model effectively improved the prediction accuracy of the laterite water content.
3.3.3 Evaluation of the natural water content of laterite
The cohesive soil has different physical states and engineering properties with the changes of soil water content. The water content state of cohesive soil could be quickly detected using ground penetrating radar if the dielectric constant model were precise and reliable enough. The surface average temperature of Yunnan laterite was 14.4°C, the average dry density was 1.23 g cm−3, and the density of water was 1.00 g cm−3 (Wu et al., 2017; Gao and Zhang, 2021). The liquid limit of laterite was 53.2%, and the plastic limit was 30.1%. To explore a more convenient way for the evaluation of natural water content of laterite, and the relative dielectric constant should be tried to apply in the prediction of the plastic limit index as follows:
The volumetric water content could be converted to the plastic limit index and liquid limit index using Eqs 21–23:
Finally, the laterite dielectric constant model Eq. 19 was brought into Eqs 24, 25, the relationship between the plastic limit index, liquid limit index and dielectric constant could be expressed as:
Where w is the natural water content,
As the average temperature of Yunnan laterite is 14.4°C and the average dry density is 1.23 g cm−3, and the laterites
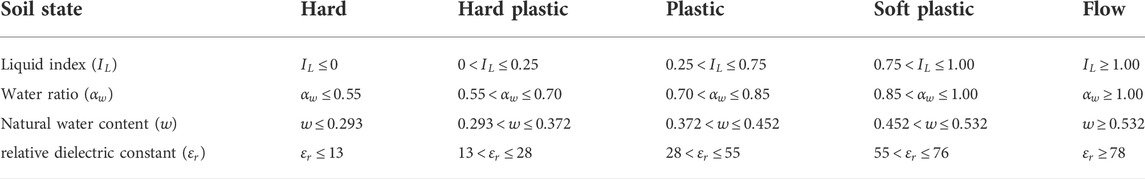
TABLE 5. Classification of natural water content state of laterite with the relative dielectric constant.
4 Conclusion
(1) The relative dielectric constant of laterite gradually increases with the increasing water content, dry density and temperature respectively, and the main influencing factors of the laterite dielectric properties was water content, followed by temperature, and finally dry density from the multiple linear regression analysis.
(2) The influence of dry density and temperature could not be ignored for the construction of dielectric constant model of laterite according to the analysis of existing models and the testing results. The laterite dielectric constant model considering the joint effects of dry density and temperature has been proposed on the basis of Herkelrath model.
(3) The comparison and verification of the test data with the existing models shows that the multivariate model has the best fitting accuracy on the relationship “relative dielectric constant-volume water content” of laterite. The root mean square error was used to evaluate the prediction accuracy of each model for the laterite water content as follows: Multivariate model, Zhao model, Malicki model, Zhou model, Topp model, Liao model, and Herkelrath model.
(4) The relationships between the relative dielectric constant, plastic limit index and liquid limit index of laterite were derived based on the multivariate model, and this model could be used to classify the natural water content state of laterite. The multivariate model could provide a convenient way for the rapid, nondestructive and accurate quantitative prediction of the surface water content state, and further evaluate the soft and hard grades and engineering categories of laterite (Hu et al., 2021).
Data availability statement
The original contributions presented in the study are included in the article/supplementary material, further inquiries can be directed to the corresponding authors.
Author contributions
XX: Conceptualization, investigation, writing—original draft, writing—review and editing. HW: Data acquisition and analysis, investigation and editing. XQ: Methodology, funding acquisition. CL: Formal analysis, supervision. BC: Testing samples preparations. GP: Data acquisition, investigation. All authors have read and agreed to the published version of the manuscript.
Funding
This study has been financially supported by National Natural Science Foundation of China (Grant No. 41867040), Qiandongnan Science and Technology plan project [(2022) No. 51], National Natural Science Foundation of China (Grant No. 42107195), Fundamental Research Program of Yunnan Province (202101AT070271); Yunnan Province High level Talents Training Support Program “Young Topnotch Talent” Special Project (XX).
Acknowledgments
We are grateful for the comments of the reviewers, which greatly improved the quality of this study.
Conflict of interest
The authors declare that the research was conducted in the absence of any commercial or financial relationships that could be construed as a potential conflict of interest.
Publisher’s note
All claims expressed in this article are solely those of the authors and do not necessarily represent those of their affiliated organizations, or those of the publisher, the editors and the reviewers. Any product that may be evaluated in this article, or claim that may be made by its manufacturer, is not guaranteed or endorsed by the publisher.
References
Blonquist, J., Jones, S., Lebron, I., and Robinson, D. A. (2006). Microstructural and phase configurational effects determining water content: Dielectric relationships of aggregated porous media. Water Resour. Res. 42 (5), 387–403. doi:10.1029/2005WR004418
Chen, Q., Zeng, J., Li, Z., Zhou, J., Tian, B., and Zhou, J. (2012). Relationship model of soil moisture and dielectric constant monitored with remote sensing. Trans. Chin. Soc. Agric. Eng. 28 (12), 171–175. doi:10.3969/j.issn.1002-6819.2012.12.028
Christian, N. K., Liu, H., Takahashi, K., Shimada, M., Watanabe, M., Khuut, T., et al. (2017). In-situ measurement of soil permittivity at various depths for the calibration and validation of low-frequency SAR soil moisture models by using GPR. Remote Sens. 9 (6), 580. doi:10.3390/rs9060580
Deloor, G. P. (1968). Dielectric properties of heterogeneous mixtures containing water. J. Microw. Power 3 (2), 67–73. doi:10.1080/00222739.1968.11688670
Dobson, M. C., Ulaby, F. T., Hallikainen, M. T., and El-rayes, M. (1985). Microwave dielectric behavior of wet soil-Part II: Dielectric mixing models. IEEE Trans. Geosci. Remote Sens. 23 (1), 35–46. doi:10.1109/tgrs.1985.289498
Dong, L., Wang, W., and Wu, Y. (2020). Dielectric properties of saline soil and an improved dielectric model. Remote Sens. Technol. Appl. 35 (4), 786–796. doi:10.11873/j.issn.1004-0323.2020.4.0786
Fomin, S., and Muzalevskiy, K. (2021). A dielectric model for frozen mineral soils at a frequency of 435MHz. Remote Sens. Lett. 212 (9), 944–950. doi:10.1080/2150704x.2021.1947537
Gao, H., and Zhang, J. (2021). Statistical regularity of physical and mechanical indexes of secondary red clay in Chenggong district, kunming. Coal Geol. Explor. 49 (5), 174–181. doi:10.3969/j.issn.1001-1986.2021.05.019
Guo, Y., Xu, S., and Shan, W. (2018). Development of a frozen soil dielectric constant model and determination of dielectric constant variation during the soil freezing process. Cold Regions Sci. Technol. 151, 28–33. doi:10.1016/j.coldregions.2018.03.006
Herkelrath, W. N., Hamburg, S. P., and Murphy, F. (1991). Automatic real time monitoring of soil moisture in a remote field area with time domain reflectometry. Water Resour. Res. 27 (5), 857–864. doi:10.1029/91WR00311
Hu, J. D., Li, L., Iderawumi, A. M., Feng, Y., Li, B., and Wei, W. (2021). Research progress of soil water content measurements using dielectric properties. Henan Agric. Univ. Newsp. 55 (4), 603–611. doi:10.16445/j.cnki.1000-2340.20210618.002
Jin, X., and Mohammod, A. (2019). Simple empirical formulas to estimate the dielectric constant and conductivity of concrete. Microw. Opt. Technol. Lett. 61 (2), 386–390. doi:10.1002/mop.31577
Kabir, H., Khan, M., Brodie, G., Gupta, D., Pang, A., Jacob, M. V., et al. (2020). Measurement and modelling of soil dielectric properties as a function of soil class and moisture content. J. Microw. Power Electromagn. Energy 54 (2), 3–18. doi:10.1080/08327823.2020.1714103
Liao, H., Sun, J., Zan, Y., Zhu, Q., and Gu, F. (2016). Dielectric constant model for soil and its application in engineering. Chin. J. Geotechnical Eng. 38 (S2), 36–41. doi:10.11779/CJGE2016S2006
Liao, H., Dong, H., Ning, C., Zhang, J., and Sun, J. (2019). A new logarithmic dielectric constant model of soils. JGS. Spec. Publ. 7 (2), 281–286. doi:10.3208/jgssp.v07.044
Liu, N., Li, X., Guo, B., and Min, X. (2016). Compaction evaluation of reclamation soil in coal mining district based on modified dielectric constant model. J. Soil Water Conservation 30 (04), 318–322. doi:10.13870/j.cnki.stbcxb.2016.04.053
Liu, Z., Qiu, H., Zhu, Y., Liu, Y., Yang, D., Ma, S., et al. (2022). Efficient identification and monitoring of landslides by time-series InSAR combining single- and multi-look phases. Remote Sens. 14, 1026. doi:10.3390/rs14041026
Luo, G., Cao, Y., Bai, Z., Kuang, X., Wang, S., and Song, L. (2019). Representation and inversion of reconstructed soil volumetric water content in loess open pit mining area. J. Ecol. Rural Environ. 35 (4), 529–537. doi:10.19741/j.issn.1673-4831.2018.0506
Lv, H., Jiang, W., Zhao, Y., and Zeng, Z. (2016). Relationship between volumetric water content and effective dielectric permittivity of Nanning expansive soil. Rock Soil Mech. 37 (08), 2145–2150. doi:10.16285/j.rsm.2016.08.003
Lv, G., Yang, J., Li, N., Hu, D., Zhang, Y., and Zhao, F. (2018). Dielectric characteristics of unsaturated loess and the safety detection of the road subgrade Based on GPR. J. Sensors 2018 (01), 1–8. doi:10.1155/2018/5185460
Malicki, M., Plagge, R., and Roth, C. (1996). Improving the calibration of dielectric TDR soil moisture determination taking into account the solid soil. Eur. J. Soil Sci. 47 (3), 357–366. doi:10.1111/j.1365-2389.1996.tb01409.x
Meng, M., and Meng, X. (2018). Effect of temperature and frequency on dielectric model of cement concrete. Bull. Chin. Ceram. Soc. 37 (05), 1758–1764. doi:10.16552/j.cnki.issn1001-1625.2018.05.045
Mu, Q., zheng, J., Yu, Y., Meng, L., and Liu, F. (2022). In-situ discrimination of collapsible loess through the time-domain reflectometry (TDR). Chin. J. Geotechnical Eng. 44 (06), 1115–1123. doi:10.11779/CJGE202206016
Pan, X., Han, Y., Chun, K., Zhang, J., Ma, D., and Gao, H. (2021). On the laboratory calibration of dielectric permittivity models for agricultural soils: Effect of systematic porosity variation. Vadose zone J. 20 (1), 1–14. doi:10.1002/vzj2.20096
Qiu, H., Zhu, Y., Zhou, W., Sun, H., He, J., and Liu, Z. (2022). Influence of DEM resolution on landslide simulation performance based on the Scoops 3D model. Geomat. Nat. Hazards Risk 13 (1), 1663–1681. doi:10.1080/19475705.2022.2097451
Roth, K., Schulin, R., Fluhler, H., and Attinger, W. (1990). Calibration of time domain reflectometry for water content measurement using a composite dielectric approach. Water Resour. Res. 26 (10), 2267–2273. doi:10.1029/wr026i010p02267
Savin, I., and Muzalevskiy, K. (2020). Dielectric model for thawed organic soils at frequency of 435 MHz. IEEE Geosci. Remote Sens. Lett. 18 (2), 218–221. doi:10.1109/LGRS.2020.2975027
Siddiqui, S., and Drnevich, V. (1995). A new method of measuring density and moisture content of soil using the technique of time domain reflectometry. West Lafayette: Joint Highway Research Project, Purdue University.
Sun, D., Liu, W., and Lu, H. (2014). Soil-water characteristic curve of guilin lateritic clay. Geomechanics 35 (12), 3345–3351. doi:10.16285/j.rsm.2014.12.038
Taoufik, B., Jamal, E., Broone, F., and Ballivy, G. (2012). Modelling dielectric-constant values of concrete: An aid to shielding effectivenes prediction and ground-penetrating radar wave technique interpretation. J. Phys. 45 (40), 1–12. doi:10.1088/0022-3727/45/40/405401
Topp, G., Davis, J., and Annan, A. (1980). Electromagnetic determination of soil water content: Measurements in coaxial transmission lines. Water Resour. Res. 16 (3), 574–582. doi:10.1029/WR016i003p00574
Wang, L., Qiu, H., Zhou, W., Zhu, Y., Liu, Z., Ma, S., et al. (2022). The post-failure spatiotemporal deformation of certain translational landslides may follow the pre-failure pattern. Remote Sens. 14, 2333. doi:10.3390/rs14102333
Wu, J., Gao, X., Han, Z., and Xu, Y. (2017). Analysis of the change of comfort index over Yunnan Province based on effective temperature. Adv. Earth Sci. 32 (2), 174–186. doi:10.11867/j.issn.1001-8166.2017.02.0174
Wu, Z., Du, W., Nie, J., and Cui, F. (2019). Detection of cohesive soil water content based on early signal amplitude envelope of ground penetrating radar. Chin. J. Agric. Eng. 35 (22), 115–121. doi:10.11975/j.issn.1002-6819.2019.22.013
Xiao, J., Yang, W., Gao, X., and Li, Z. (2020). Analysis and modeling of the complex dielectric constant of bound water with application in soil microwave remote sensing. Remote Sens. 12 (21), 3544–1030. doi:10.3390/rs12213544
Xu, J., Zhao, Z., Wang, Y., Wang, L., and Shao, M. (2019). Soil dielectric measurement based on bilinear theory. J. Agric. Mach. 50 (12), 322–331. doi:10.6041/j.issn.1000-1298.2019.12.037
Xu, X., Zhang, W., and Wang, Y. (2022). Measuring and modeling the dielectric constant of soil during freezing and thawing processes: An application on silty clay. Acta Geotech. 2 (2), 1–20. doi:10.1007/s11440-022-01487-8
Zhao, Y., Ling, D., Wang, Y., Huang, B., and Wang, H. (2016). Study on a calibration equation for soil water content in field tests using time domain reflectometry. J. Zhejiang Univ. Sci. 17 (03), 240–252. doi:10.1631/jzus.A1500065
Zhou, J., Li, Y., Zang, Y., Mao, H., Wang, M., and Wang, L. (2022). A method for determination of soil gravimetric water content and dry density rapidly based on frequency domain reflectometry. J. Hohai Univ. 5 (12), 1–12. https://kns.cnki.net/kcms/detail/32.1117.tv.20220425.1147.010.html.
Keywords: laterite, relative dielectric constant, dielectric properties, volumetric water content, model
Citation: Xu X, Wang H, Qu X, Li C, Cai B and Peng G (2022) Study on the dielectric properties and dielectric constant model of laterite. Front. Earth Sci. 10:1035692. doi: 10.3389/feart.2022.1035692
Received: 03 September 2022; Accepted: 20 October 2022;
Published: 07 November 2022.
Edited by:
Haijun Qiu, Northwest University, ChinaReviewed by:
Feng Liu, Tianjin University, ChinaXinlan Liang, Sichuan Agricultural University, China
Copyright © 2022 Xu, Wang, Qu, Li, Cai and Peng. This is an open-access article distributed under the terms of the Creative Commons Attribution License (CC BY). The use, distribution or reproduction in other forums is permitted, provided the original author(s) and the copyright owner(s) are credited and that the original publication in this journal is cited, in accordance with accepted academic practice. No use, distribution or reproduction is permitted which does not comply with these terms.
*Correspondence: Xin Qu, xqu1987@163.com; Cheng Li, licheng_730@163.com