Accumulation and evolution of ice jams influenced by different ice discharge: An experimental analysis
 Pangpang Chen
 Tiejie Cheng
 - School of Civil and Hydraulic Engineering, Hefei University of Technology, Hefei, China
Ice jam, a unique hydrological phenomenon of rivers in cold regions, is a major cause of ice flooding. There are many different kinds of damage that can result from ice jams: e.g., blockage of the water flow, rising water levels that can flood farmland and dwellings, damage to hydraulic structures, and interruptions to shipping. The formation of an ice jam is influenced by various factors associated with different fields of study. The accumulation of an ice jam is thus a complex process worth investigating. However, previous studies seldom take account of ice discharge factors. This study carries out 29 tests on the accumulation of an ice jam, and discovers four kinds of phenomena: inlet ice that fails to submerge (case 1); thickening ice from upstream to downstream (case 2); thickening ice from downstream to upstream (case 3); and failure to form an ice jam (case 4). Two typical examples are used to detail cases 2 and 3. The authors suggest differentiating between the two cases using the longitudinal boundary line running through the point of the Froude number (Fr) = 0.119. Furthermore, the authors analyze the phenomena that make it difficult for an ice jam to form and suggest using the critical discriminant line to distinguish between cases 3 and 4. Combined with the longitudinal boundary line, a partition result diagram of the different accumulation features of ice jams is presented to differentiate between the four modes of accumulation of ice jams.
Introduction
River ice, a typical hydrological feature of rivers in cold regions, has considerable impact on the global hydrological system, especially in the northern hemisphere (Yang et al., 2020). When river ice is submerged in front of the ice cover, ice jams and ice dams are easily formed and can induce ice floods (Becket et al., 2021), which can in turn cause extensive damage to infrastructure, shipping, and hydropower production, and can also harm river ecology and water quality (White, 2003; Beltaos and Burrell, 2015; Frolova et al., 2015; Lindenschmidt et al., 2016).
There are many potential kinds of damage resulting from ice jams: e.g., blockage to the water flow section, rising water levels that can flood farmland and dwellings, damage to hydraulic structures, interruptions to shipping, and disruptions to hydropower generation. Ice jams can also block the water inlet of water plants, thereby interrupting the water supply. The scouring effect of an ice jam can erode riverbanks and riverbeds, threatening the living environment of fish and other wild species, and can expose the biological mechanisms buried beneath the riverbed. According to the ice jam database of the U.S. Army Corps of Engineers (with historical records since 1780), more than 22,500 ice jams have occurred in the United States alone, about 10% of which led to some degree of flooding. Taking, for example, the local reach of the Athabasca River, about 60 km from Fort McMurry in Canada, in 1997 ice flooding caused direct economic losses worth millions of dollars.
The Yellow River in China also faces serious ice disasters (Figure 1) (Sui et al., 2008). Located at 96°–119°E and 32°–42°N, the Yellow River Basin has a particular geography that favors the generation of ice in its upper, middle, and lower reaches in winter. The winding pattern of the river makes it easy for ice floods to form during the annual freeze-up and break-up periods. In March 1996, the river burst its banks in Wulan Township and Jiefangtan Township, Dalat Banner, resulting in direct economic losses of CNY 70 million. On 1 March 1999, an ice jam formed in the Hohhot and Qingshuihe sections of the river, and the ensuing rising water levels had a direct economic cost of CNY 12.623 million. On the morning of 17 December 2001, an ice flood occurred in the Wuhai section of the river in Inner Mongolia. The embankment burst for nearly 80m, and the ice water destroyed five villages, three farms, and two schools in Wuda District. In total, over 900 farmers and 4,000 villagers were affected by the ice flood.
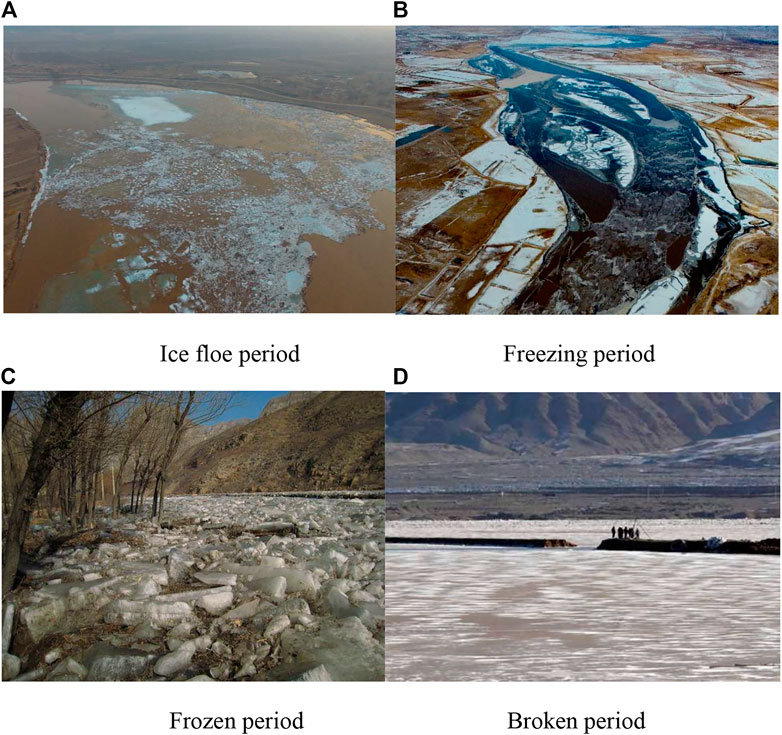
FIGURE 1. Ice jam during the stable sealing period of the Yellow River in China. (A) Ice pans (floe) floating period, (B) Freeze-up period, (C) Ice-covered/jammed period, and (D) River break-up period.
Domestic and foreign research into ice hydraulics mainly focuses on ice jams. The formation and accumulation mechanisms of ice jams have been explored extensively through prototype observation (Sui et al., 2002; Beltaos and Carter, 2009; Deng et al., 2019; Wolfe et al., 2020), experimental study (Healy and Hicks, 2006; Wang et al., 2019), theoretical analysis (Daly and Axelson, 1990; Hicks and Healy, 2003; Wang et al., 2012), and numerical simulation (Beltaos, 2008; Wang et al., 2009; Wang et al., 2011; Beltaos, 2019). The data observed show that, in winter, river ice generally goes through several stages, namely, ice pans (floe) floating period, freeze-up period, ice-covered/jammed period and river break-up period.
During the ice pans (floe) floating period, the water surface loses too much heat due to the continuous low temperature. The turbulence of the water body then causes a heat exchange between the water surface and the water body. In various places, the water cools down very quickly, and ice particles form rapidly. Ice floes with high-flow ice density then gradually form, accumulate, and move downstream. The ice floe period mainly means that after the initial freezing, ice floes continue to move in the river channel and either dive beneath or collide with other hydraulic structures (Hayakawa et al., 2001).
During the freeze-up period, the ice cover initially appears in relatively narrow river sections. The ice floe in front of the ice cover will stop or become submerged under the ice jam, at a place with a high water gradient or strong turbulence. During the formation and accumulation of the ice jam, the head of the jam advances continuously downstream or upstream, and the ice grows thicker or thinner beneath the jam. When the movement of floating ice in rivers is blocked, it will accumulate, and the effect of low temperatures will be the freezing phenomenon. The flow and ice condition tends to be stable after the end of the freezing period, which then becomes the ice-covered/jammed period.
During the ice-covered/jammed period, the river flow develops from an open flow with a free surface to an undercurrent covered over with ice. The presence of ice complicates the river hydraulic process, and sometimes determines the hydrodynamic features of the river (Wu et al., 2014; Amroune et al., 2020). From the perspective of hydraulics, the existence of the ice cover creates additional flow boundaries, thus increasing the wet perimeter (Lindenschmidt and Rokaya, 2019; Namaee and Sui, 2019). In addition, the ice cover increases the river’s resistance, and reduces the discharge downstream. The hydraulic radius of the flow section is hence significantly reduced. Studies have shown that, in the presence of the ice cover, the flow is very sensitive to the friction coefficient. Compared with the open flow condition, the hydraulic radius will reduce to 46% and the water flow will lower to 60%. The ice jam will push up the water level much higher than the complete and static ice floe or open flow. Rokaya et al. (2020) have demonstrated that, compared with the open flow, an ice jam will increase the water depth of a river two to three times, under the same or even lower flow discharge. When the flow discharge is fixed, the water level will rise abnormally, due to the existence of ice jam.
At the end of winter the temperature turns positive, and the river gradually enters the River break-up period. The ice situation at this stage is manifest in the rupture of the ice cover and the re-obstruction of large ice floes in the narrow river sections (Chang et al., 2022). This stage is the main period for ice flood disaster, although the ice jam in the opening period is also harmful to the hydrological conditions of rivers. Due to difficulties obtaining field observation data, a numerical simulation method is chiefly used to research the break-up period of ice jams.
The formation of an ice jam is affected by various factors, as reflected in different disciplines such as thermodynamics, solid mechanics, hydrology, hydraulics, and river dynamics. As the ice jam accumulates and evolves, different types of ice jams will be formed depending on the conditions. Putting thermodynamic factors aside, ice jam accumulation is already a complex process, even if only mechanical action is taken into account (Shen and Wang, 1995). Through experimental studies, this study explores the influence of the hydraulic conditions and ice discharge on the accumulation of ice jams and identifies and investigates four different kinds of ice jam accumulation. The internal mechanism of each phenomenon is studied in detail, before a discrimination method and a partition result diagram designed to differentiate between the four different features of ice jams accumulations are presented.
Experimental method
The experimental analysis was carried out in the straight test water channel of the Ice Research Lab, Institute of Water Science, Hefei University of Technology. Figure 2 shows the layout plan of the 26.68-m-long, 40-cm-wide channel. From upstream to downstream, there are 22 sections with a spacing of 1.2 m. An automatic ice feeder is set at the four sections upstream, and a one-meter-long ice cover model of light polystyrene foam board is placed in the 20th to the 21st sections downstream. The measuring points of all stacking tests are mainly the 16 sections from the 5th to the 20th.
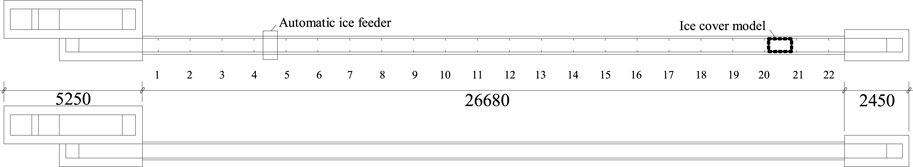
FIGURE 2. Layout plan of the straight channel.
The ice particle model is made of polyethylene particles, the most commonly used material in international river ice tests (Ambtman et al., 2011; Peters et al., 2017). Because the density is 0.917 g/cm3, which is close to natural river ice, this material can also reduce the influence of surface tension once the model ice is soaked. In terms of shape, the model is mainly composed of 3.5 mm oblate ellipsoid particles, with a porosity of about 0.4. The initial hydraulic conditions include water flow, water depth of the control section in the upstream, and ice discharges. On this basis, different hydraulic conditions are combined. In each experiment, the water discharge is kept constant and uniform. The automatic ice feeder then starts to add ice, and the ice discharge rate is maintained as constant. To monitor the complete process of ice jam accumulation, real-time data, including pressure head and ice thickness, are recorded every 30 min at each measuring point. Each experiment is terminated when the water discharge conditions and ice jam thickness reaches the state of equilibrium (i.e., no hydraulic parameters change with time). In general, each experiment lasts from 4 h to 20 h.
The flow discharge is controlled through the opening of the upstream valve and is calculated by water head from the piezometer and a triangular weir flow formula. The flow depth of the 4th section is controlled by the opening angle of the tail gate at the end of the water flume. Each section is equipped with a piezometer to measure the piezometric water head. The dynamic ice thickness is measured with a graduated scale. The measurement accuracy of all lengths is within mms. The volume method is used for estimating ice discharge.
Experimental results
The initial data and test records of the ice jam experiments are recorded in Table 1, including the stable Froude number (Fr) in the upstream, the leading edge section number of front of the ice jam, and the sequence of ice jam accumulation during 29 experiments under different experimental conditions. It can be seen from the results that the ice jam accumulation fell into four cases.
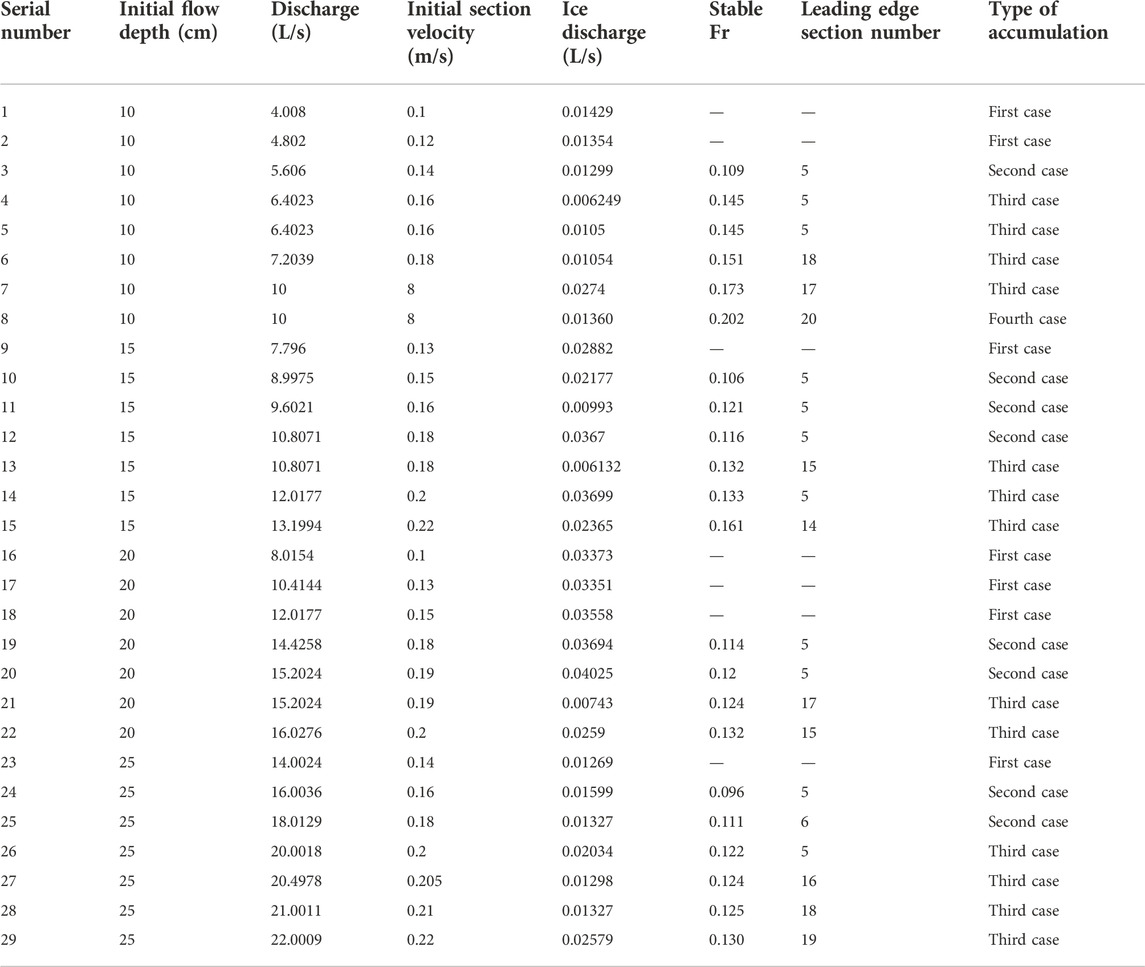
TABLE 1. Initial date, stable data, and accumulation of 29 ice jam experiments under different test conditions.
In case 1, the ice particles did not submerge during the experiment. The ice jam was juxtaposed at the flow surface and developed on to the upstream flow.
In case 2, the ice particles did not submerge initially, but all submerged when the ice jam developed at a certain section in the upstream section. Initially, the ice jam accumulated and thickened from upstream to downstream. Eventually, the ice jam of the entire channel reached the state of equilibrium.
In case 3, some part of the ice particles did not submerge in front of the initial ice cover (at section 20). The initial ice jam accumulated and thickened from downstream to upstream, until the ice jam of the entire channel reached the state of equilibrium.
In case 4, all ice particles submerged in front of the initial ice jam (at section 20). Finally, the length of the ice jam accumulation was almost invisible or the ice jam was unable to form.
Among the four cases, the experiment was terminated in the first case, and the ice jam did not reach the state of equilibrium in the channel.
In the second and third cases, the ice jam accumulation followed different sequences: the initial ice jam thickened from upstream to downstream, and from downstream to upstream, respectively. The difference stemmed from whether or not the initial ice particles would partially submerge at section 20. If no ice particles submerged, the ice jam would thicken from upstream to downstream. If some ice particles submerged, the ice jam would thicken from downstream to upstream. If all ice particles submerged, the ice jam would not form in the channel. The specific phenomena of the two cases are described in the subsequent section.
In the fourth case, the initial hydraulic conditions were equivalent to stable hydraulic conditions, indicating that all the ice particles from upstream were submerged under these conditions.
Details of case 2
Figure 3 shows the details of the phenomenon in case 2, with the third experiment as an example. The water surface elevation was calculated by measured ice thickness and the porosity of ice jam, which is same for the Figure 5. In this case, the accumulation sequence was from upstream to downstream. The initial water depth of section 4 (h0) was 10 cm, the mean velocity of the section (v0) was 0.14 m/s, the flow discharge (Q) was 5.6 L/s, and the ice discharge Qi was 0.01299L/s. The experiment lasted about 7 h.
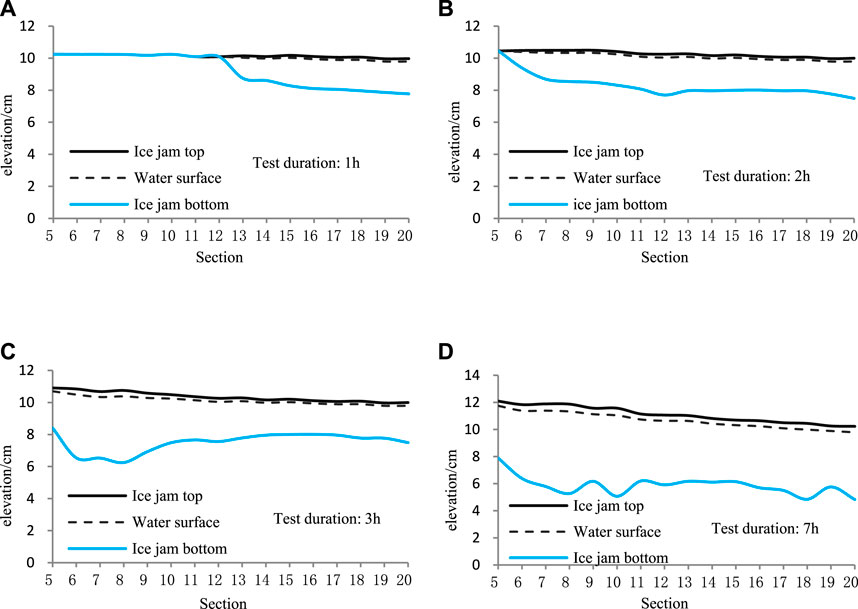
FIGURE 3. Specific phenomena of the second case (third experiment).
Figures 3A–D show the ice thickness measured along the channel at 1 h, 2 h, 3 h, and 7 h after adding model ice particles. It can be seen that when the particles were added by the automatic ice feeder to the upstream section 5, no particles were submerged at section 20. This means no ice particles flowed out of the test area. At this point, the accumulation process of the ice jam became the first stage, a sign of the juxtaposition-upward phenomenon (Figures 3A,B). It is noteworthy that the ice jam was not as thick as a single layer of model ice particles but was approximately 2.5 cm (about 7–8 times of a layer). The ice jam advanced upstream under the hydraulic action.
When the front of ice jam reached the upstream section 4, the inlet ice particles were all submerged at the bottom of the ice jam. Hence, the accumulation of the ice jam entered the second stage, i.e., the main stage for the ice jam to thicken (Figure 3C).
As described previously, the head of the ice jam of a certain thickness formed under the bottom front of the ice jam at section 5 (Figure 4). The head would move to the downstream with a hydraulic limit thickness when the flow intensity was sufficient to carry the inlet ice particles downward. The hydraulic limit thickness of the head of the ice jam is referred to as the initial ice jam thickness (Figure 3C). In this case, the initial ice jam thickness was about 4.5 cm.
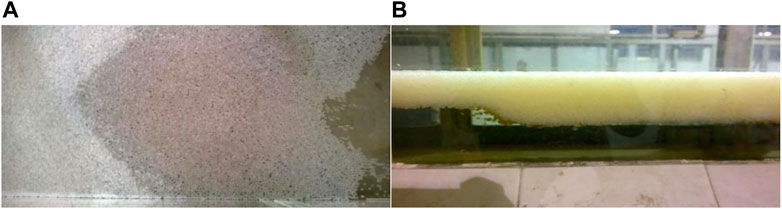
FIGURE 4. Head of the ice jam in the second case [flow direction is from (B) to (A)].
The head of the ice jam advanced continuously downstream until reaching section 20. Then the ice particles would begin to flow out of the test area. In the beginning, the inlet ice discharge was not equal to the outlet ice discharge, and the ice jam entered the third and final stage of accumulation, i.e., the thickening stage. The overall thickness of the ice jam would grow slightly until the ice discharge at the inlet equaled that of the outlet. Finally, the hydraulic parameters and ice conditions tended to become stable (Figure 3D). Similarly, the ice jam thickness after stabilization is called the ice jam thickness equilibrium. Comparing Figures 3C,D, it can be seen that the initial ice jam thickness was slightly smaller than the ice jam thickness equilibrium.
Details of case 3
Figure 5 shows the details of the phenomenon in case 3, with the fifth experiment as an example. In this case, the accumulation sequence is from downstream to upstream. The initial water depth of section 4 (h0) was 10cm, the mean velocity of the section (v0) was 0.16 m/s, the flow discharge (Q) was 6.4L/s, and the ice discharge Qi was 0.0105L/s. The experiment lasted about 4 h.
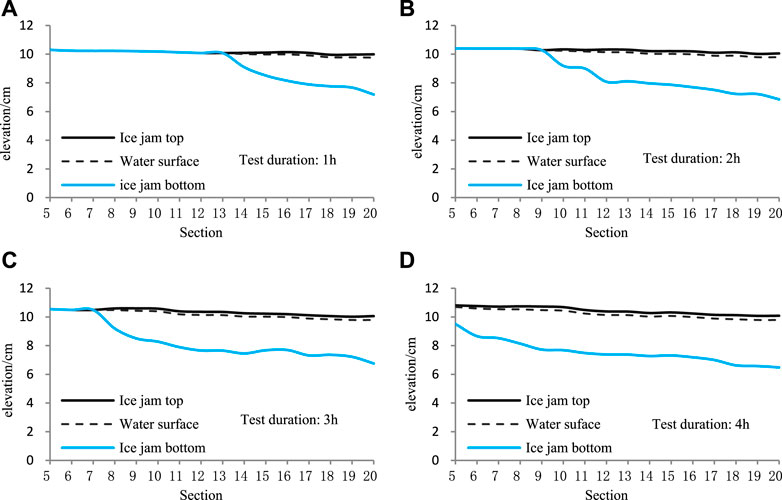
FIGURE 5. Specific phenomena of the third case (fifth experiment).
Figures 5A–D show the ice thickness measured along the channel at 1 h, 2 h, 3 h, and 4 h after adding model ice particles. The sequence of ice jam accumulation was completely difference from that in Figure 3.
After the addition of ice particles, some particles were submerged at section 20. Thus, some of the inlet ice particles flowed directly out of the test area, while the rest were detained and accumulated, resulting in the thickening of the ice jam. Compared with case 2 in Figure 3, no juxtaposition upward occurred in case 3. The head of the ice jam movement kept pace with the front of the ice jam, and the ice jam accumulated from downstream to upstream, reaching the initial ice jam thickness (Figures 5A–C). When the front of the ice jam reached the upstream section 5, it entered the final thickening stage, where the inlet and outlet ice discharges became equal. The accumulation phenomenon after stabilization is illustrated in Figure 5D, which presents the equilibrium ice jam thickness of each section.
In other words, the difference between the two cases depends on whether the upstream ice jam head (Figure 4) formed during the ice jam evolution. For case 3, no upstream ice jam head formed and there was no secondary thickening process throughout the entire experiment.
Discussion
In terms of the thickening phenomena, the accumulation of the ice jam could be divided into two categories: accumulation from upstream to downstream, and accumulation from downstream to upstream. The fundamental reason for different accumulation phenomena lies in whether the initial hydraulic conditions result in the inlet ice particles being partially submerged at the front of the initial ice cover model (section 20).
According to the experimental data in Table 1, the different ice jam accumulation processes under different hydraulic conditions (stable Fr) and the discharge ratio (ice to flow discharge ratio) are illustrated in Figure 6.
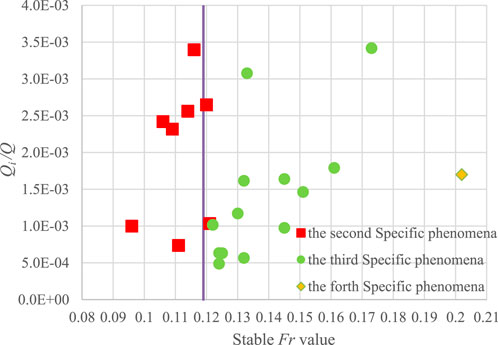
FIGURE 6. Specific phenomena of different stable Fr and ice flow discharge ratios.
The straight line parallel to the Y axis in Figure 6 indicates that the stable Fr was 0.119. Taking this line as a boundary, the left side of the line stands for the second case of ice jam accumulation, and the right side of the line represents the third and fourth cases.
During the experiments, the water level kept rising with the ice jam accumulation. Thus, the Fr in front of the ice jam continued to fall as the water level rise. As shown in Figure 6, when the stable Fr surpassed 0.119, the ice jam accumulation was accompanied by the continuous submersion and transport of inlet ice, and case 3 of ice jam accumulation occurred. When the opposite condition appeared, the ice particles in front of the ice jam did not submerge until the hydraulic condition was sufficient to carry the ice out of the test area, and then case 2 or case 1 occurred.
In other words, if the stable Fr in front of the ice jam was greater than or equal to 0.119, the accumulation would obey case 3 or case 4; by contrast, if the stable Fr dropped to less than 0.119, and if the ice particles did not submerge, the accumulation would follow case 2. If the ice discharge was large, case 1 would be more likely.
Along with the experiment data, the results suggest that the relationship between the stable Fr and 0.119 provides an important reference for judging the specific phenomena of ice jam accumulations.
In case 4, most or all of the ice particles submerged in front of the initial ice jam (section 20), and the final ice jam was very short, or no ice jam ultimately formed. In this case, the channel failed to form any ice jam. By contrast, ice jams formed in cases 1–3.
Among the 29 tests in Table 1, only test 8th fully conformed to the accumulation phenomenon in case 4. Table 2 reports the nine tests, in which inlet ice particles mostly submerged at the initial ice cover (section 20), and where the final lengths of the ice jams were very short (i.e., the test phenomena were close to case 4). These were tests No. 6, 7, 13, 15, 21, 22, 27, 28, and 29. The initial conditions of these tests and the Fr numbers in front of the head of the ice jam are summarized in Table 2.
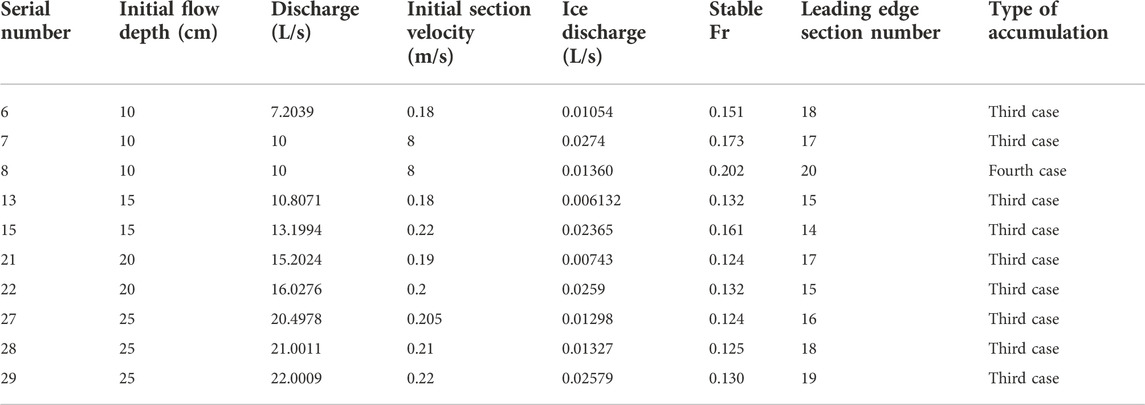
TABLE 2. Results of nine tests.
Based on the data in Table 2, the ratio of ice discharge Qi to flow discharge Q (hereinafter referred to as discharge ratio Qi/Q) was taken as the abscissa, and the stable Fr in front of the ice jams as the ordinate, to create the critical conditions for failure to form ice jams (Figure 7). It can be learned from the trend line in Figure 7 that the stable F was basically positively proportional to the discharge ratio Qi/Q.
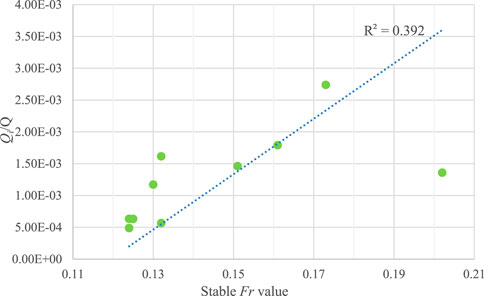
FIGURE 7. Critical conditions for failure to form ice jams.
In fact, Figure 7 reports the limiting critical conditions for the formation of ice jams. The ice jams could not form with the growing Fr value under a certain ice flow discharge ratio. Therefore, the trend line in Figure 7 (hereinafter referred to as the critical discriminant line for the formation of an ice jam) helps in judging whether the ice jams could form in the channel. If Fr and Qi/Q were on the right side of that line, the ice jam could not form in the channel. If the two values appeared on the left side of that line, the ice jam would eventually form.
Through regression analysis, the critical discriminant line in Figure 7 can be described by the following linear equation:
Suppose the discharge ratio Qi/Q is equal to 0. The following can be derived from Eq. 1:
Based on the data in Table 1, 2, the stable Fr was taken as the abscissa, Qi/Q was taken as the ordinate, and Fr=0.119 (when Qi/Q=0) was taken as the center point to draw the longitudinal boundary line of Figure 6 and the critical discriminant line of Figure 7. The two lines divide the first quadrant of the Cartesian coordinate system into three parts. Figure 8 summarizes the ice jam accumulation features in each quadrant.
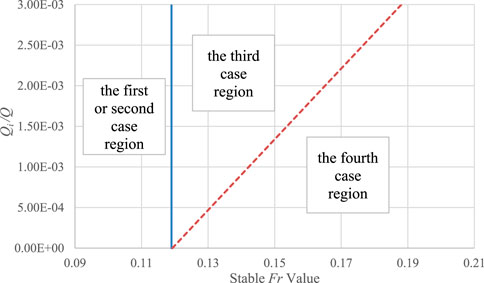
FIGURE 8. Partition result diagram of ice jam accumulation with different features.
Combining the experimental study results and the hydraulic features of ice jam accumulation, the following can be inferred: if the hydraulic parameter falls after stabilization in the regions of cases 1 and 2 (the rectangular area in Figure 8), the experimental data suggest that the inlet ice does not submerge at section 20 but is juxtaposed upward until submergence at the head of the ice jam under a certain hydraulic condition, or that it continues to be juxtaposed with the rising water level. If the parameter falls in the region of case 3 (i.e., the inverted right triangular area in Figure 8), the experimental data show that the inlet ice partially submerges at section 20. After that, partial submergence occurs as the ice cover moves upward. This process continues until all of the inlet ice particles submerge under a certain hydraulic condition. If the parameter falls in the region of case 4 (the right triangular area in Figure 8), the experimental data indicate that all inlet ice particles submerge at section 20.
Conclusion
The formation of an ice jam is affected by various factors drawn from different disciplines, e.g., thermodynamics, solid mechanics, hydrology, hydraulics, and river dynamics. Different types of ice jams can form under different conditions, even if only mechanical action is taken into account (without considering thermodynamics). Previous studies have mainly focused on the mechanical characteristics of stable ice jams, while this study focuses on changes to the hydraulic characteristics during the evolution of ice jam under different ice discharge. Experiments and analyses were carried out to study how hydraulic conditions and ice discharge affect the accumulation of ice jams. Through 29 tests, four different accumulation patterns of ice jams were detected and are discussed in detail.
Based on the third and fifth experiments, cases 2 and 3 in the experiments were analyzed in detail. It was discovered that, if Fr was greater than 0.119, the inlet ice particles may submerge at the head of the ice jam. Hence, the longitudinal boundary line through Fr = 0.119 was suggested as a way to distinguish the two cases. Further analysis was carried out to analyze those tests where it was difficult to form an ice jam. The results show that the critical discriminant line helps to distinguish between cases 3 and 4. Combined with the longitudinal boundary line, a partition result diagram was developed for ice jam accumulations with different features and used to differentiate between the four kinds of accumulations.
Due to an insufficient number of experimental studies, the conclusions may be a little simple in this paper, and more model tests or prototype observation results are needed to enrich the conclusions. In addition, the value of stable Fr is not the initial condition of the test. Thus the relationship between the initial Fr and the stable Fr value needs to be studied to obtain the ice jam mechanical equilibrium equation under different hydraulic and ice discharge conditions.
Data availability statement
The original contributions presented in the study are included in the article/Supplementary Material; further inquiries can be directed to the corresponding author.
Author contributions
PC: measured data analysis and manuscript writing; TC: experimental test development and measured data collation; JW: research guidance and revision suggestions; GC: test program development and research plan.
Funding
This research was supported by the National Natural Science Foundation of China (NSFC) under grant nos. 51879065 and 51379054.
Conflict of interest
The authors declare that the research was conducted in the absence of any commercial or financial relationships that could be construed as a potential conflict of interest.
Publisher’s note
All claims expressed in this article are solely those of the authors and do not necessarily represent those of their affiliated organizations, or those of the publisher, the editors, and the reviewers. Any product that may be evaluated in this article, or claim that may be made by its manufacturer, is not guaranteed or endorsed by the publisher.
References
Ambtman, K. E. D., Steffler, P. M., and Hicks, F. E. (2011). Analysis of the stability of floating ice blocks. J. Hydraul. Eng. 137 (4), 412–422. doi:10.1061/(ASCE)HY.1943-7900.0000316
Amroune, A., Mihoub, R., Enrico, G., and Carlos, U. (2020). Groundwater flow dynamics and distribution of hydrochemical facies using GIS in Hodna Plain, M’Sila, Southeastern Algeria. Int. J. Sustain. Dev. Plan. 15 (6), 789–800. doi:10.18280/ijsdp.150601
Becket, M. A., Dow, K. E., and Clark, S. P. (2021). Development of an ice jam database and prediction tool for the Lower Red River. Can. Water Resour. J./Revue Can. des ressources hydriques 46 (1-2), 73–86. doi:10.1080/07011784.2021.1898479
Beltaos, S., and Burrell, B. C. (2015). Hydrotechnical advances in Canadian river ice science and engineering during the past 35 years. Can. J. Civ. Eng. 42 (9), 583–591. doi:10.1139/cjce-2014-0540
Beltaos, S., and Carter, T. (2009). Field studies of ice breakup and jamming in lower Peace River, Canada. Cold Regions Sci. Technol. 56 (2-3), 102–114. doi:10.1016/j.coldregions.2008.11.002
Beltaos, S. (2019). Numerical prediction of ice-jam profiles in lower Athabasca River. Can. J. Civ. Eng. 46 (8), 722–731. doi:10.1139/cjce-2018-0542
Beltaos, S. (2008). Progress in the study and management of river ice jams. Cold regions Sci. Technol. 51 (1), 2–19. doi:10.1016/j.coldregions.2007.09.001
Cheng, T. J., Wang, J., Chen, P. P., and Sui, J. (2022). Simulation of ice accumulation around bridge piers during river breakup periods using a discrete element model. J. Hydrodyn. 34 (1), 94–105. doi:10.1007/s42241-022-0010-y
Daly, S. F., and Axelson, K. D. (1990). Stability of floating and submerged blocks. J. Hydraulic Res. 28 (6), 737–752. doi:10.1080/00221689009499023
Deng, Y., Li, Z., Wang, J., and Xu, L. (2019). The microstructure of yellow river ice in the freezing period. Crystals 9 (9), 484. doi:10.3390/cryst9090484
Frolova, N. L., Agafonova, S. A., Krylenko, I. N., and Zavadsky, A. S. (2015). An assessment of danger during spring floods and ice jams in the north of European Russia. Proc. IAHS. 369, 37–41. doi:10.5194/piahs-369-37-2015
Hayakawa, T., Yamamoto, Y., and Kawai, K. (2001). Ice floe impact interaction with pile structures on vertical breakwaters. Proceedings of the . Int. Conf. Port Ocean Eng. Under Arct. Cond. Ottawa, Canada.
Healy, D., and Hicks, F. E. 2006. Experimental study of ice jam formation dynamics. J. Cold Reg. Eng. 20 (4), 117–139. doi:10.1061/(asce)0887-381x(2006)20:4(117)
Hicks, F. E., and Healy, D. (2003). Determining winter discharge based on hydraulic modeling. Can. J. Civ. Eng. 30 (1), 101–112. doi:10.1139/l02-031
Lindenschmidt, K. E., Das, A., Rokaya, P., and Chu, T. (2016). Ice-jam flood risk assessment and mapping. Hydrol. Process. 30 (21), 3754–3769. doi:10.1002/hyp.10853
Lindenschmidt, K. E., and Rokaya, P. (2019). A stochastic hydraulic modelling approach to determining the probable maximum staging of ice-jam floods. J. Environ. Inf. 34 (1). doi:10.3808/jei.201900416
Namaee, M. R., and Sui, J. (2019). Effects of ice cover on the incipient motion of bed material and shear stress around side-by-side bridge piers. Cold Regions Sci. Technol. 165, 102811. doi:10.1016/j.coldregions.2019.102811
Peters, M., Dow, K., Clark, S. P., Malenchak, J., and Danielson, D. (2017). Experimental investigation of the flow characteristics beneath partial ice covers. Cold Regions Sci. Technol. 142, 69–78. doi:10.1016/j.coldregions.2017.07.007
Rokaya, P., Peters, D. L., Elshamy, M., Budhathoki, S., and Lindenschmidt, K. E. (2020). Impacts of future climate on the hydrology of a northern headwaters basin and its implications for a downstream deltaic ecosystem. Hydrol. Process. 34 (7), 1630–1646. doi:10.1002/hyp.13687
Shen, H. T., and Wang, D. S. (1995). Under cover transport and accumulation of frazil granules. J. Hydraul. Eng. 121 (2), 184–195. doi:10.1061/(asce)0733-9429(1995)121:2(184)
Sui, J., Karney, B. W., Sun, Z., and Wang, D. (2002). Field investigation of frazil jam evolution: A case study. J. Hydraul. Eng. 128 (8), 781–787. doi:10.1061/(asce)0733-9429(2002)128:8(781)
Sui, J., Wang, J., Balachandar, R., Sun, Z., and Wang, D. (2008). Accumulation of frazil ice along a river bend. Can. J. Civ. Eng. 35 (2), 158–169. doi:10.1139/L07-093
Wang, J., Chen, P. P., and Sui, J. Y. (2011). Progress in studies in ICE accumulation in river bends. J. Hydrodyn. 23 (6), 737–744. doi:10.1016/S1001-6058(10)60171-0
Wang, J., Hua, J., Chen, P. P., Sui, J., Wu, P., and Whitcombe, T. (2019). Initiation of ice jam in front of bridge piers—an experimental study. J. Hydrodyn. 31 (1), 117–123. doi:10.1007/s42241-019-0017-1
Wang, J., Sui, J., and Chen, P. (2009). Numerical simulations of ice accumulation under ice cover along a river bend. Int. J. Environ. Sci. Technol. (Tehran). 6 (1), 1–12. doi:10.1007/BF03326055
Wang, J., Sui, J. Y., Zhang, H. Y., Chen, P. P., and Hirshfield, F. (2012). Mechanisms of ice accumulation in a river bend–an experimental study. Int. J. Sediment Res. 27 (4), 521–537. doi:10.1016/S1001-6279(13)60010-4
White, K. D. (2003). Review of prediction methods for breakup ice jams. Can. J. Civ. Eng. 30 (1), 89–100. doi:10.1139/l02-047
Wolfe, B. B., Hall, R. I., Wiklund, J. A., and Kay, M. L. (2020). Past variation in Lower Peace River ice-jam flood frequency. Environ. Rev. 28 (3), 209–217. doi:10.1139/er-2019-0047
Wu, P., Hirshfield, F., Sui, J., Wang, J., and Chen, P. P. (2014). Impacts of ice cover on local scour around semi-circular bridge abutment. J. Hydrodyn. 26 (1), 10–18. doi:10.1016/S1001-6058(14)60002-0
Keywords: ice jam, ice cover, experimental study, specific phenomena, fr, longitudinal boundary, critical discriminant
Citation: Chen P, Cheng T, Wang J and Cao G (2023) Accumulation and evolution of ice jams influenced by different ice discharge: An experimental analysis. Front. Earth Sci. 10:1054040. doi: 10.3389/feart.2022.1054040
Received: 26 September 2022; Accepted: 31 October 2022;
Published: 12 January 2023.
Edited by:
Hongtu Zhang, Henan Polytechnic University, ChinaReviewed by:
Chenchen Wang, China University of Mining and Technology, Beijing, ChinaBai Xin, University of South China, China
Anhu Wang, University of Science and Technology Beijing, China
Copyright © 2023 Chen, Cheng, Wang and Cao. This is an open-access article distributed under the terms of the Creative Commons Attribution License (CC BY). The use, distribution or reproduction in other forums is permitted, provided the original author(s) and the copyright owner(s) are credited and that the original publication in this journal is cited, in accordance with accepted academic practice. No use, distribution or reproduction is permitted which does not comply with these terms.
*Correspondence: Guangxue Cao, cao-gx@hfut.edu.cn