Deformation and Failure Mechanism of the Lower Roadway in a Close-Range Residual Coal Pillar Area
 Xiao-He Wang
 Zhi-Qiang Zhao1
  Jun Wang
- 1School of Energy and Mining Engineering, China University of Mining and Technology, Beijing, China
- 2State Key Laboratory of Water Resources and Hydropower Engineering Science, Wuhan University, Wuhan, China
- 3Transportation College, Jilin University, Jilin, China
The Tashan coal mine is selected as a case study to determine the deformation and damage mechanisms of the lower roadway in a close-range residual coal pillar area. Roof drilling peephole technology is applied to detect the damage to the roadway roof surrounding rock. A boundary invisibility equation is derived for the plastic zone of a circular hole based on the theory of a butterfly plastic zone in a non-uniform stress field in which the principal stress occurs at an arbitrary angle to the vertical. Maple mathematical drawing software is combined with FLAC3D numerical simulations to investigate the influence of the principal stress ratio and direction on the roadway plastic zone. The results indicate that the plastic zone of the roadway surrounding rock assumes a butterfly shape when the bidirectional stress ratio is large, and the direction of the butterfly-shaped failure of the roadway is related to the principal stress direction. Field test images are combined to show that the asymmetric damage pattern of the lower roadway in a close-range residual coal pillar area is influenced by the presence of the roadway in a non-uniform stress field in which the main stress direction is deflected.
1 Introduction
Close-range coal seam mining has become increasingly common in Chinese coal mines. Differing from single-seam mining, close-range coal seam mining is affected by a variety of factors (Lu et al., 1993; Fang et al., 2009; Kang et al., 2017; Zhang et al., 2020; Lv et al., 2022) that lead to the manifestation of distinct mine-pressure characteristics. When mining the lower roadway in the coal pillar area, the stress state of the roof rock layer of the lower coal seam is altered owing to the void area of the upper coal seam and the residual coal pillar, both of which affect the roadway excavation support and working face mining (Eberhardt, 2012; Zhang et al., 2014; Xia et al., 2021).
Roadway disasters are caused by the deformation and damage of the roadway surrounding rock under stress (Lee et al., 2011; Zou et al., 2015). Numerous studies have been conducted based on theoretical analyses and practical tests, and several related theories have been proposed including the natural caving supply theory (Zhao, 1978), axial variation theory (Yu, 1981; Yu, 1982), and maximum horizontal stress theory (Chen, 2009). The damaged area and range of the roadway surrounding rocks have been studied from a variety of different angles, and the development law of the roadway surrounding rock damage shape has been explored. Under hydrostatic pressure conditions, the quantitative calculation method involving the radius of the plastic zone around the circular hole can be calculated using the previously proposed Fenner formula and the Castellan formula (Goodman, 1982; Yang et al., 2012; Gan et al., 2015) and others have performed experimental tests and numerical simulations and demonstrated the reasonable arrangement of a mining tunnel in the lower position of a short-distance residual coal pillar.
Non-uniform stress will ultimately lead to the deformation and failure of the roadway surrounding rock (Kontogianni and Stiros, 2006; Zhang et al., 2008; Stiros and Kontogianni, 2009; Kong et al., 2014). The butterfly failure theory is based on the elastic-plastic theory, analyzes the failure mechanism of the roadway in a non-uniform stress field, establishes a physical model of the roadway surrounding rock failure, and deduces the quantitative calculation formula of the plastic zone of the roadway butterfly failure (Zhao, 2014; Zhao et al., 2016a; Zhao et al., 2016b; Ma et al., 2016; Ma et al., 2017). Guo et al. (2019) accordingly proposed an evaluation criterion for the shape of the plastic zone of a circular roadway—which can be applied to predict the potential danger zone of a circular roadway—and an evaluation criterion for the critical point of a dynamic roadway disaster based on the characteristic radius. Ma et al. (2019) showed that conjugate shear fracture seisms follow an “imitation of butterfly survival” law, and determined the necessary conditions for a conjugate shear fracture seism to occur. Hao et al. (2020) analyzed the energy characteristics of coal and rock masses upon impact failure from the perspective of energy accumulation and release.
The deformation and damage of the lower roadway in a close-range residual coal pillar area is very easy to lead to roadway disasters. Field tests were performed in this study to analyze the damage pattern of a roadway roof in a close-range residual coal pillar area of the Tashan coal mine, and to verify the deformation and damage mechanisms of the lower roadway. The deformation and damage mechanisms are explained based on the butterfly damage theory. The results provide a theoretical basis for the stability control theory of the surrounding rock of a lower roadway of a residual coal pillar during the mining process of the close-range coal seam group.
2 Materials and Methods
2.1 Engineering Background
The Tashan coal mine is located on the middle eastern edge of the Datong coalfield. The main coal seam is the #3–5 coal, which is a combination of the #3 and #5 coal seams. The average thickness is 18.0 m and the reserves account for more than 65% of the entire mine. The coal mining technology in this mine has a large mining height for top coal caving. Among them, the 2# coal average thickness is 3.0 m and has been completely mining. The #3–5 coal seams are located 4.4 m from the mined #2 coal seam, as shown in Figure 1. The influence of other roadways is not considered here, thus only the air return roadway of the 30,503 working face is shown in the sectional view.
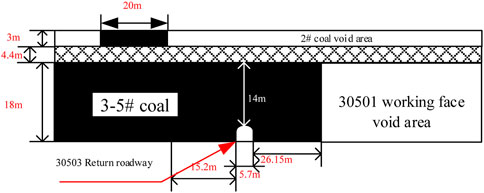
FIGURE 1. Two-dimensional view of the roadway layout between the #3–5 and #2 coal seams.
The 30,503 working face is the successful continuation of the 30,501 working face. The 30,503 working face return roadway was excavated for 860 m prior to the mining of the 30,501 working face.
Among them, the 30,503 working face return roadway is 4 m high and 5.7 m wide, the horizontal distance of the positive gang from the upper coal seam section coal pillar is 15.2 m, and the secondary gang is 25.15 m from the edge of the 30,501 working face, the section coal pillar is 20 m, as shown in Figure 1. The 30,503 working face return roadway was closed, owing to serious deformation of its return roadway, and managed while mining the 30,501 working face. After the 30,501 working face was completed, the 30,503 return roadway was opened and sealed, at which point it was found that the tunnel was basically closed. The mine has since renovated this roadway. During the renovation to 860 m, the roof, floor, and two sides of the roadway in the repaired section underwent increasing displacement, as shown in Figure 2. Large local deformations of the roadway and the two gangs have made a significant difference in the displacement. A borehole peephole was drilled into the roof of the 30,503 return roadway to visually observe the extent of damage and the damage pattern, as shown in Figure 3.
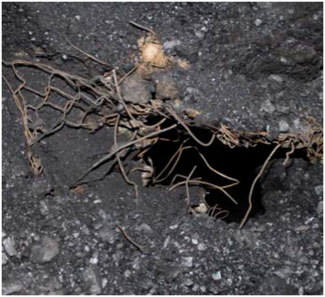
FIGURE 2. Damage to the excavation head during renovation.
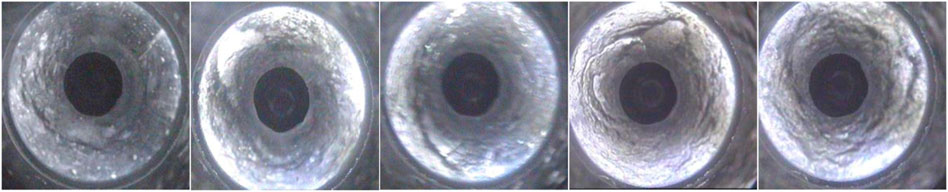
FIGURE 3. On-site borehole probe images.
2.2 Field Tests
A roof drilling peephole probe can accurately and intuitively observe the lithology of the roof and the damage pattern of the roof surrounding rock. According to the actual production conditions at the site, 5 measurement points a, b, c, d, and e were located at 10, 40, 70, 100, and 130 m from the head of the return air tunnel. Measurement points were selected 10 m from the head of the return air tunnel at the roadway section for drilling and peeping, and one measurement point was arranged every 1 m at the top plate of the roadway section, marking drill holes numbered 1–7. The arrangement and numbering of the 12 measurement points are shown as a schematic diagram in Figures 4, 5.
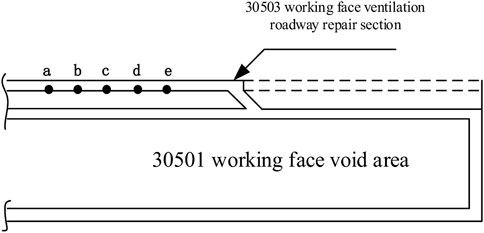
FIGURE 4. Layout of the measuring points on the roadway roof.
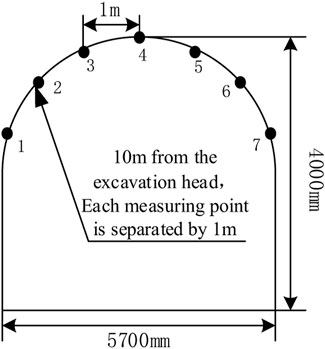
FIGURE 5. Layout of the measuring points on the roadway section.
The field drilling peephole results are used to draw a drilling column comparison chart (Figure 6) according to the top plate of the roadway. The analysis shows that the fissures are mainly distributed in the top of the shallow part of the top plate, where fragmentation is particularly severe. There is a wide range of separation with differing fissure pattern distributions and horizontal and vertical interlacings. Large delaminations are observed at 0.25, 1.06, and 1.75 m. The distribution of deep fissures in the top coal of the roof plate is less severe in the areas where the peephole wall form is more complete, and the crushing situation is gradually reduced. More fissures occur at the 5–6 m peepholes, but in the range of 6–8 m, there are less fissures and the wall integrity of the peephole is high. This demonstrates that delamination has not occurred in this section.
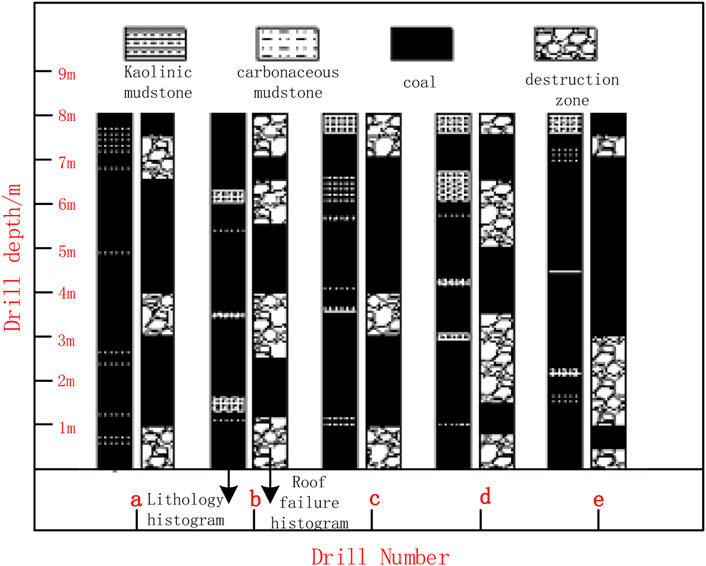
FIGURE 6. Borehole columnar comparison chart.
The peeping analysis of the roadway section at 870 m of the 30,503 work face return roadway shows that the roof strata of the 30,503 working face return roadway are relatively simple within the observation range of 8 m. Approximately 1–6 thin interlayers are mixed in the coal seam with thicknesses between ∼0.1 and ∼0.7 m. The roof is relatively severely broken in the range of 0–2 m, there are many cracks in the range of 2–5 m, and there are few cracks in the range of 6–7 m. The breakage situation and damage range of the roadway surrounding the rock section at 870 m are drawn in Figure 7. The top coal in the shallow part exhibits crack development, is severely broken, and has undergone multiple episodes of layer separation. The fractures are found to gradually decrease in the deeper regions, but there are still many cracks in the range of 0–1, 2–4, and 6.5–8 m. The analysis of the damaged area shows that the breakage depth of the top plate of the residual coal pillar near the upper coal seam in the roadway section is significantly greater than that of the top plate on the other side. The damaged area follows an initially deepening trend and then becomes shallow from left to right, and exhibits an asymmetric and irregular shape distribution.
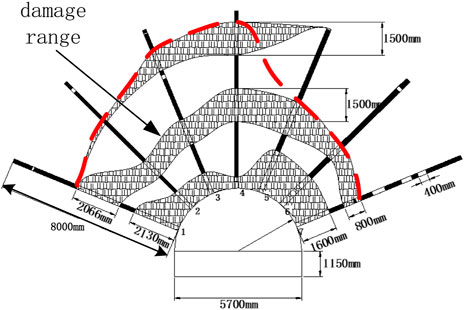
FIGURE 7. Surrounding rock fragmentation of the roadway section 870 m from working face 30,503.
The analysis of the stress field in the area where the roadway is located (in which the 30,503 return roadway is in the residual coal column of the #2 coal above the positive gang slope and the #2 coal mining void area is above the negative gang slope) shows that the overall roadway is in the non-uniform stress field and that the main stress direction is deflected. The following is based on the mechanical model of butterfly damage to the roadway surrounding rock in the non-uniform stress field, which is designed to discuss the breeding and formation mechanisms of such damages. The invisible equation of the plastic zone boundary of a circular hole in a non-uniform stress field with the main stress at any angle in the vertical direction is derived, and the influence law of the regional stress on the plastic zone of the roadway surrounding rock is analyzed and discussed by means of numerical simulations. The influence of regional stress on the plastic zone of the roadway envelope is analyzed and discussed using numerical simulation, and a theoretical demonstration is made for the asymmetric irregular damage pattern generated in the lower roadway in a close-range residual coal pillar area.
3 Mechanical Model of Butterfly Failure of Roadway Surrounding Rock
The working face roadway in the close coal seam group is affected by the working face of the adjacent coal seam and other working faces in the same coal seam. The stressed environment is complex owing to the existence of residual coal pillars in the close coal seam, and the stress environment at the roadway becomes increasingly complicated. It is therefore very important to explore the failure and deformation mechanisms of the lower roadway in the near residual coal pillar area. Previous reports determined the stress distribution around the circular hole in a non-uniform stress field using the principal stress direction in the vertical direction. However, in the actual production of mining engineering, after being affected by mining activities, in the regional stress field around the roadway, the direction of the principal stress is often not horizontal or vertical distributions.
To simplify the solution conditions, it is assumed that the length of the roadway far exceeds its radius, the cross-sectional shape of the roadway is circular, and the surrounding rock where the roadway is located is homogeneous, isotropic, and continuous medium, regardless of creep and viscosity. These conditions meet the requirements of plane strain.
We select one of the sections for a theoretical analysis and regard the external force as a uniform load. The mechanical model shown in Figure 8A can be established when the principal stress direction is deflected and the directions of P1 and P3 are not horizontal and vertical, assuming that P3 is α° in both directions. The radius of the circular roadway is a. The polar coordinates of a point outside the roadway are (r, θ), and the tiny unit body at this point is taken for analysis. The radial stress, hoop stress, and shear stress are σr, σθ, and τrθ, respectively. At this time, the xOy coordinate system in Figure 8A can be rotated clockwise around the origin by α° through the coordinate transformation, and can be transformed into a mechanical model in the x'Oy’ coordinate system, as shown in Figure 8B.
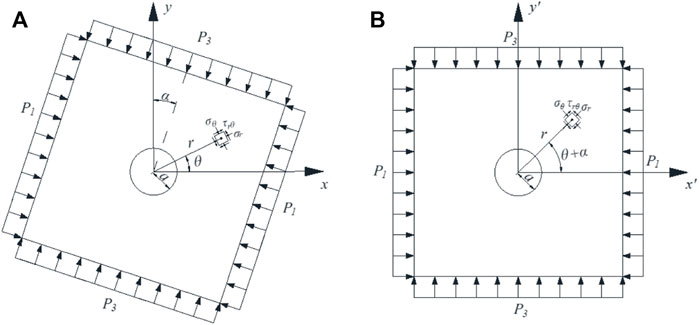
FIGURE 8. Roadway model in the non-uniform stress field.
The two-dimensional plane stress solution at any point outside the circular hole in the non-uniform stress field where the principal stress forms any angle with the vertical direction is determined according to the aforementioned mechanical model and based on the theory of elastic mechanics (Zhao et al., 2016a; Zhao et al., 2016b; Ma et al., 2017):
The Mohr–Coulomb strength theory is used as the basis for assessing the failure of rock mass around the hole. Taking the stress value at any point in Eq. 1 into the Mohr–Coulomb strength criterion and defining η as the ratio of the maximum to the minimum principal stress, the invisible equation of the plastic zone boundary of the circular hole in the non-uniform stress field where the principal stress occurs at any angle relative to the vertical direction is obtained according to the work of Zhao (2014); Ma et al. (2016); and Guo et al. (2019):
Each variable is represented as
where a is the circular hole radius, C is the surrounding rock cohesion, φ is the internal friction angle of the surrounding rock, and η is the maximum and minimum principal stress ratio.
The aforementioned formula indicates that the extent of the plastic zone of the roadway is related to parameters η, a, φ, and C. In actual mining engineering, the roadway radius is usually a given size owing to production factors. The extent of the roadway plastic zone can therefore be considered to be altered by the combined influence of the surrounding rock lithology itself and the regional stress field where the roadway is located. The plastic zone of the roadway can be regarded as the result of the combined action of the rock mass itself and the stress environment. Because of space requirements, this article does not address the influence of the surrounding rock strength on the plastic zone of the roadway surrounding rock, but rather only explores the influence of the regional stress field where the roadway is located in the surrounding rock plastic zone. Theoretical analysis and numerical simulation methods are applied in combination with a numerical simulation software (FLAC3D), mathematical drawing software (Maple), and the boundary equation of the plastic zone of a non-isobaric circular roadway. The influences of the principal stress ratio and the direction of the plastic zone of the cavern rock mass are analyzed and discussed.
4 Results and Discussion
4.1 Influence of Principal Stress Ratio
Vertical stress in the measured original rock stress field is generally believed to be equal to the weight of the overlying rock, and the vertical stress is considered to be generally smaller than the horizontal stress (Yoshio et al., 1974). The underlying mechanical parameters for the numerical simulations in this article were obtained from the data provided by the Tashan coal mine.
1) Theoretical analysis of a homogeneous circular roadway
In the theoretical analysis, the radius of the circular roadway is 2 m and the surrounding rocks of the roadway are by default homogeneous rocks. Two different initial stress conditions are selected for analysis and study. Scenario 1 uses P3 = 6.4 MPa, α = 90°, C = 3 MPa, and φ = 25°, and scenario 2 uses P3 = 14 MPa, α = 90°, C = 3 MPa, and φ = 25°. According to the non-isobaric circular roadway plastic zone boundary equation (Eq. 2), the change law of the surrounding rock plastic zone is calculated under different maximum and minimum principal stress ratios of the roadway by constantly changing the maximum and minimum principal stress ratio η.
Table 1 shows that Basic information, parameters, and graphic form of scenarios 1 and 2. Figure 9 shows that the plastic zone is an elliptical shape when P3 = 6.4 MPa, α = 90°, C = 3 MPa, and φ = 25°, when 0 < η ≤ 1.4, and the maximum plastic zone values appears on the X-axis. When 1.4 < η ≤ 2.3, the plastic zone is butterfly-shaped, and the maximum value of the plastic zone appears at the four corners of the butterfly-shaped front. When η > 2.3, the plastic zone of the roadway surrounding rock is butterfly-shaped, the primary and larger stress ratios are associated with larger butterfly leaves, and the maximum plastic zone appears at the four corners of the butterfly.
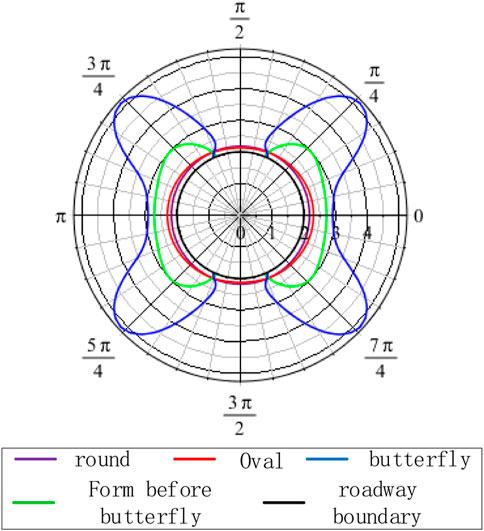
FIGURE 9. Variation of the plastic deformation ratio and main stress area of the roadway.
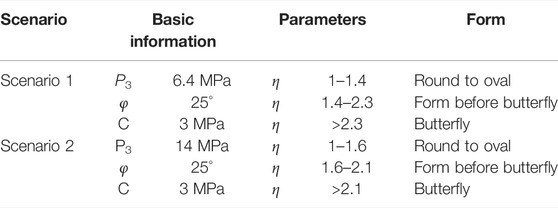
TABLE 1. Basic information, parameters, and graphic forms of scenarios 1 and 2 (Kong, 2020).
Figure 10 shows that when P3 = 14 MPa, α = 90°, C = 3 MPa, φ = 25°, and 1 < η ≤ 1.6, the plastic zone is elliptical, and the maximum value of the plastic zone appears on the X-axis. When 1.6 < η ≤ 2.1, the plastic zone is butterfly-shaped, and the maximum value of the plastic zone appears at the four corners of the butterfly-shaped front. When η > 2.1, the plastic zone of the roadway surrounding rock is butterfly-shaped. A larger principal stress ratio area is associated with a larger butterfly leaf, and the maximum plastic zone appears at the four corners of the butterfly.
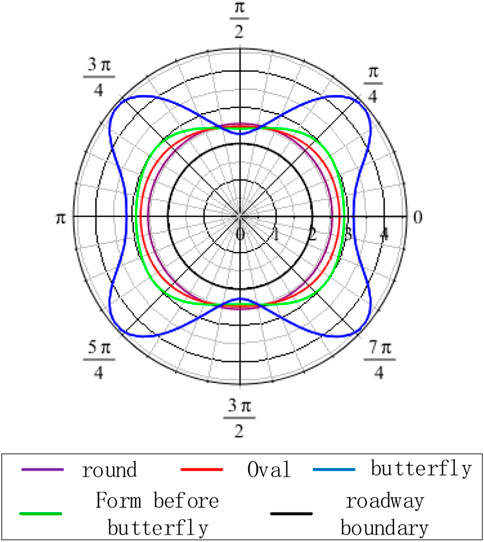
FIGURE 10. Variation law of the plastic deformation ratio and main stress area of the roadway.
The analysis of Figure 11 shows that the size of the plastic zone of the roadway surrounding rock and the principal stress ratio to which it is subjected exhibit an overall positive linear correlation. The maximum depth of the plastic zone gradually increases with the increasing principal stress ratio. At certain times, the depth of the plastic zone shows a jumping increase. A comparative analysis of the two pictures shows that under different minimum principal stress conditions, the shape of the plastic zone successively changes from an ellipse to a butterfly shape with an increasing principal stress ratio and ultimately becomes a butterfly shape. The shape of the plastic zone of the roadway surrounding rock is greatly affected by the principal stress ratio.
2) Numerical simulation analysis of a homogeneous circular roadway
FIGURE 11. The shape and size of the roadway plastic zone are affected by the principal stress ratio.
Numerical simulation tests were similarly carried out with a homogeneous circular roadway to verify the aforementioned theoretical analysis. The numerical simulation uses a homogeneous thin plate model with a circular hole radius of 2.0 m and a grid size of 0.5 m. The surrounding rock of the roadway is considered to be a homogeneous single lithology, the same vertical direction stress is used for each loading test, η is continuously changed, and the model is loaded according to the obtained stress conditions.
Figure 12 shows that when η = 1, the roadway is in a three-way isobaric state, the plastic zone is circular, and the plastic zone is small. When η is slightly less than 1, the vertical stress is greater than the horizontal stress, and the failure of the roadway gradually increases on the left and right sides. When η = 0.5, the plastic zone gradually takes on an elliptical shape. Affected by the large vertical stress, the long axis of the ellipse is in the horizontal direction; when η is further reduced, the plastic zone gradually changes from an elliptical shape to a butterfly shape. When η = 0.2, a clear butterfly shape is present and the direction of the smaller angle between the two butterfly leaves is in the vertical direction. When η gradually increases from 1, the horizontal stress plays a dominant role, in which a larger damage zone of the roadway appears in the vertical direction. When η = 2 and under the influence of the larger horizontal stress, the plastic zone involves the long axis in the vertical direction. The plastic zone then gradually develops and expands in the direction of the four sharp corners, and enters a butterfly-shaped gestation state. When η = 2.5, the plastic zone tends to develop along with the four sharp corners, and the sharp corners are destroyed. When η = 3, the plastic zone initially has a butterfly shape, and the butterfly plastic zone is then further developed and expanded.
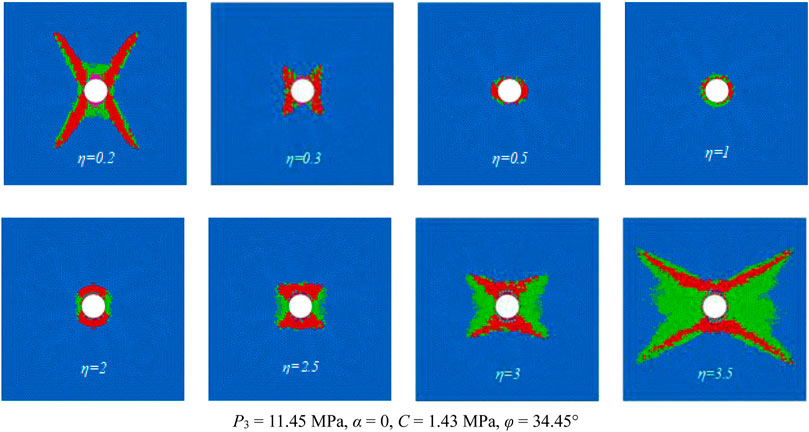
FIGURE 12. Plastic zone of the roadway under different principal stress ratios.
Figure 13 shows the numerical simulation results of the maximum failure depth of the roadway surrounding the rock plastic zone for different η values obtained by statistical calculations. When the surrounding rock properties are uniform and P3 is held consistently, the maximum failure depth of the roadway and η are approximately symmetrically distributed about η = 1. When η is very small, the roadway presents a butterfly shape. As η continues to increase and approaches 1, the extent of the butterfly-shaped plastic zone gradually decreases and eventually degenerates into an ellipse with a long axis located in the horizontal direction, and then gradually degenerates to a circular shape with the smallest plastic zone extent. The maximum damage range and shape of the plastic zone follow a relatively symmetrical law. The plastic zone gradually expands from a circle to an elliptical shape with a long axis in the vertical direction, and then gradually enters a butterfly-shaped gestation state, which eventually expands into a butterfly-shape and grows butterfly leaves.
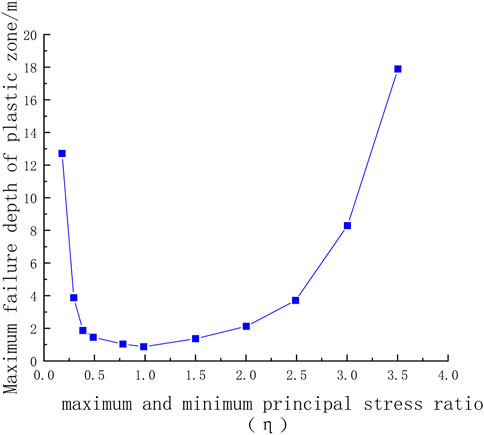
FIGURE 13. Maximum depth of the damage in the plastic zone of the roadway at different principal stress ratios.
4.2 Influence of the Principal Stress Direction
The principal stress direction will change and deviate from vertical and horizontal directions. The previous theoretical analysis showed that the principal stress direction also affects the roadway plastic zone. This section explores the shape and extent of the plastic zone when the principal stress direction is deflected.
1) Theoretical analysis of a homogeneous circular roadway
As shown in Figure 14A, when P3 = 6.4 MPa, η = 1.5, C = 3 MPa, φ = 25°, and α = 0°, the maximum principal stress is in the horizontal direction, and the shape of the plastic zone is elliptical, and the maximum depth of the plastic zone appears in the vertical direction (with the Y-axis forming an angle of 30°). When α = 30°, the maximum principal stress forms an angle of 30° in the horizontal direction, the plastic zone shape is elliptical, and the maximum depth of the plastic zone occurs at an angle of 60° to the X-axis. When α = 30°, the maximum principal stress forms an angle of 60° in the horizontal direction, the plastic zone shape is elliptical, and the maximum depth of the plastic zone occurs at an angle of 30° with the X-axis. When α = 90°, the maximum principal stress occurs in the vertical direction, the shape of the plastic zone is elliptical, and the maximum depth of the plastic zone occurs in the horizontal direction.
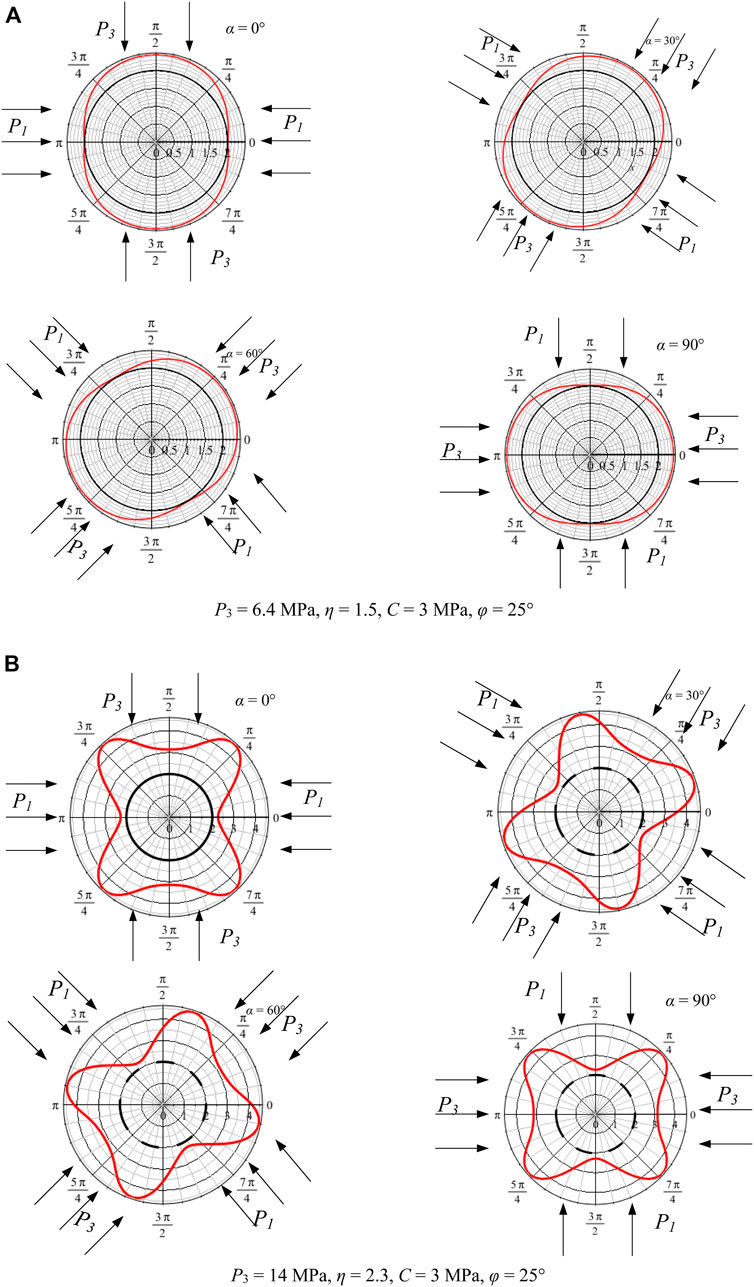
FIGURE 14. The plastic zone shape of the roadway surrounding the rocks is affected by the maximum principal stress direction.
Figure 14B shows that when P3 = 14 MPa, η = 2.3, C = 3 MPa, φ = 25°, and α = 0°, the maximum principal stress is in the horizontal direction, the plastic zone is butterfly-shaped, and the maximum depth of the plastic zone appears in the four butterfly leaves of the graph. The top occurs at an angle of approximately 45° with the vertical direction. When α = 30°, the maximum principal stress occurs at an angle of 30° with the vertical direction, the plastic zone is butterfly-shaped, and the maximum plastic zone depth appears at the top of the four butterfly leaves. When α = 60°, the maximum principal stress forms an angle of 60° with the vertical direction, the plastic zone is butterfly-shaped, and the maximum plastic zone appears at the top of the four butterfly leaves. When α = 90°, the maximum principal stress direction is horizontal and forms an angle of 90°, and the shape of the plastic zone is consistent with the previous deflection angle, showing a butterfly shape, in which the maximum plastic zone appears at the top of the butterfly leaf. In summary, regardless of how much the principal stress is deflected, the shape of the plastic zone still maintains its pre-rotation shape. In contrast, the direction of the plastic zone is greatly affected by the principal stress direction, and the two show a standard positive correlation.
2) Numerical simulation analysis of a homogeneous circular roadway
The numerical simulation results in Figure 15 show that the shape of the surrounding rock plastic zone is related to the stress environment. When the bidirectional stress ratio is small, the shape of the plastic zone is circular or elliptical. When the bidirectional stress ratio increases to a certain value, the plastic zone becomes butterfly-shaped, which is consistent with the previous analysis results, and in which the maximum failure position of the plastic zone changes with the principal stress direction of the regional stress field. With different principal stress directions, the maximum failure depth of the plastic zone appears at different positions of the roadway. A butterfly blade of the butterfly-shaped plastic zone may be the maximum failure position of the roadway roof, which leads to large-range damages to the roadway roof and is difficult to effectively and safely control. The previous results show that the surrounding rock plastic zone obtained by the numerical simulation is consistent with those obtained by the theoretical analysis with changing principal stress direction.
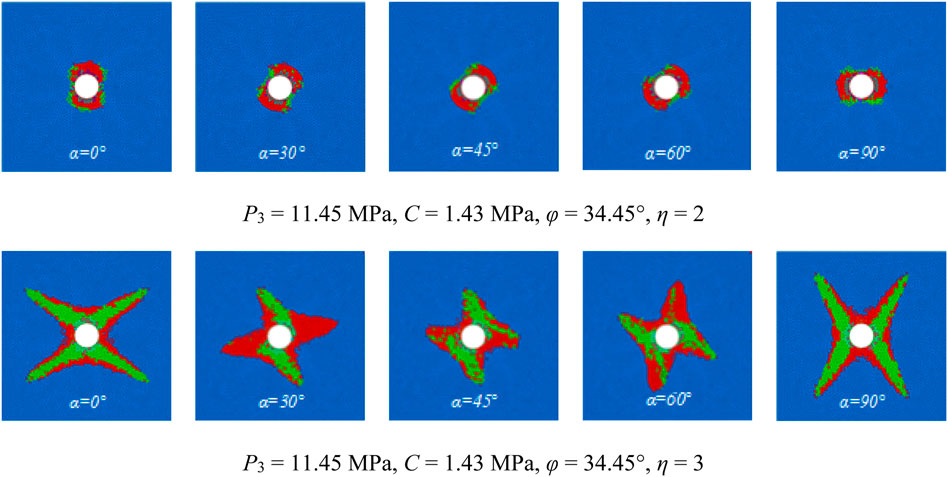
FIGURE 15. Roadway plastic zone for different main stress directions.
4.3 Analysis of the Damage Range of the Return Air Tunnel in the 30,503 Working Face
The spatial position and stress situation of the 30,503 working face return roadway were analyzed. The 30,503 return roadway is located in the residual coal column of the #2 coal above the positive gang slope and #2 coal mining void area above the negative gang slope, and the overall roadway is in the non-uniform stress field. Upon completion of mining the #2 coal, the ratio of the maximum principal stress to the minimum principal stress in the regional stress field increases to a maximum. The principal stress direction in the regional stress field is affected by the mining and other factors. The direction of the roof will change and will no longer be vertical and horizontal. According to the drawn roof damage range, the roof surrounding rock is asymmetrically damaged. The damage range is 1/4 butterfly leaf state, and the maximum damage range appears at the top of the butterfly leaf. Figure 16 shows that the minimum position of the failure area is similar to the principal stress direction. The analysis shows that the roadway exhibits a butterfly-shaped failure trend under a non-uniform stress field. The direction of the butterfly leaf changes with the principal stress direction, which is the direction of the butterfly failure zone symmetry axis.
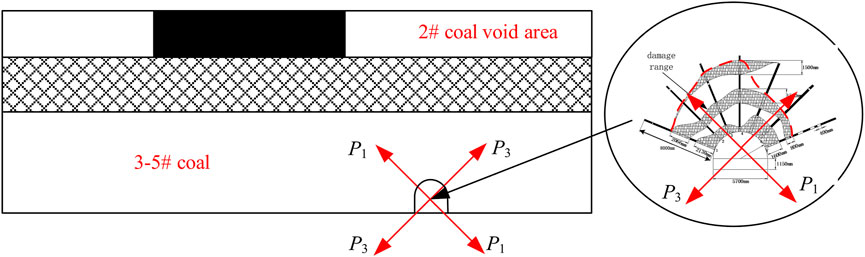
FIGURE 16. Failure range and principal stress distribution map.
5 Conclusion
In this study, the large deformation and closure of the 30,503 working face return roadway of the China National Coal Group Corporation Tashan coal mine during the repair stage were investigated. The field measurements show that the fracture form of the lower back mining tunnel surrounding rock in the coal column area exhibits an asymmetrically irregular distribution. The boundary invisibility equation was derived for the plastic zone of a circular hole in a non-uniform stress field with the principal stress at an arbitrary angle to the vertical direction based on the butterfly plastic zone theory. The evolution law of the failure form of the roadway surrounding rock is obtained with regard to the changes in the regional stress field, as well as the influence of the maximum principal stress. The effects of the maximum principal stress and minimum principal stress ratios and their associated changes in the regional stress field were elucidated, as well as the effect of directional rotation on the plastic zone of the roadway. And it revealed the non-uniform failure mechanism of the lower roadway in the coal pillar area. These conclusions are summarized as follows.
1) The return roadway of the 30,503 working face was influenced by the residual coal column of the upper coal seam. The deformation and damage forms of the surrounding rock appear to exhibit asymmetric deformation distribution characteristics. The sinking amount of the roof plate is found to be greater than that along the two walls. The damaged area of the symmetric position of the roof plate shows obvious differences: the damaged area from left to right shows an initially deepening trend and then becomes shallower. The damaged area also shows an asymmetric distribution.
2) The invisible equation for the plastic zone boundary of a circular hole in a non-uniform stress field with the main stress at an arbitrary angle to the vertical direction was derived, and obtained the influencing factors of the plastic zone distribution of the lower roadway in the close-range residual coal pillar area, analyzed the evolution law of the damage pattern of the roadway surrounding rock with the change of the regional stress field, and revealed the mechanical mechanism of the asymmetric damage of the lower roadway in the residual coal pillar area under a non-uniform stress field.
3) The stress distribution around the circular roadway in the non-uniform stress field under the changing principal stress ratio conditions and the deflection of the principal stress direction were analyzed. The plastic zone of the roadway surrounding rock shows a butterfly shape when the bidirectional stress ratio is large. The breeding and evolution mechanisms of the butterfly-shaped damage in the circular roadway are determined in a non-uniform stress field under the deflection of the main stress direction. Combined results of roof drilling peephole detection to explain that the asymmetric damage pattern of the lower roadway in the residual coal column area is produced because the roadway is in a non-uniform stress field and that the main stress direction is deflected.
Data Availability Statement
The original contributions presented in the study are included in the article/Supplementary Material; further inquiries can be directed to the corresponding author.
Author Contributions
X-HW, Z-QZ, and Z-CR conducted the experiments and collected experimental data; the full text was co-authored by X-HW and Z-QZ. H-HZ and WZ are responsible for the data analysis and graphics rendering. WJ and SY are responsible for the data analysis and graphics drawing; X-HW is responsible for the editing of the article.
Funding
This work was funded by the National Natural Science Foundation of China (Grant No. 51704294) and Guizhou Province Science and Technology Support Program Project “Research and Demonstration of Partitioned Cracking Failure Mechanism and Coordinated Anchoring Protection Technology of Surrounding Rocks in Semi-coal-rock Roadway Disturbed by Excavation,” Project Leader, Project No.: Qiankehe Support (2021) General 400, 2021 April to December 2024. This support is gratefully acknowledged. The authors are grateful to the reviewers for discerning comments on this paper.
Conflict of Interest
The authors declare that the research was conducted in the absence of any commercial or financial relationships that could be construed as a potential conflict of interest.
Publisher’s Note
All claims expressed in this article are solely those of the authors and do not necessarily represent those of their affiliated organizations, or those of the publisher, the editors, and the reviewers. Any product that may be evaluated in this article, or claim that may be made by its manufacturer, is not guaranteed or endorsed by the publisher.
Acknowledgments
The authors are grateful to the reviewers for discerning comments on this manuscript.
Abbreviations
P1, maximum principal stress; P3, minimum principal stress; a, circular hole radius; C, surrounding rock cohesion; φ, internal friction angle of the surrounding rock; η, maximum and minimum principal stress ratio.
References
Chen, G. X. (2009). Mechanism Research of the Maximum Horizontal Stress on Rockburst and its Application. Xuzhou: China University of Mining and Technology, 1–20.
Eberhardt, E. (2012). The Hoek-Brown Failure Criterion. Rock Mech. Rock Eng. 45 (6), 981–988. doi:10.1007/s00603-012-0276-4
Fang, X. Q., Guo, M. J., and Lv, Z. Q. (2009). Instability Mechanism and Prevention of Roadway under Close-Distance Seam Group Mining. Chin. J. Rock Mech. Eng. 28 (10), 2059–2067. doi:10.3321/j.issn:1000-6915.2009.10.013
Goodman, R. E. (1982). Introduction to Rock Mechanics. Eng. Geol. 19 (1), 72–74. doi:10.1016/0013-7952(82)90015-1
Guo, X., Zhao, Z., Gao, X., Wu, X., and Ma, N. (2019). Analytical Solutions for Characteristic Radii of Circular Roadway Surrounding Rock Plastic Zone and Their Application. Int. J. Min. Sci. Technol. 29 (2), 263–272. doi:10.1016/j.ijmst.2018.10.002
Hao, Z., Guo, L. F., Zhao, X. D., Chen, G. X., and Zhang, G. H. (2020). Analysis of Burst Failure Energy Characteristics of Mining Roadway Surrounding Rock. J. China Coal Soc. 45 (12), 3995–4005. doi:10.13225/j.cnki.jccs.2019.1072
Hiramatsu, Y., Oka, Y., Ito, H., and Tanaka, Y. (1974). The Correlation of the Rock Stress Measured in Situ and the Tectonic Stress Inferred from Geological and Geophysical Studies. J. Soc. Mater. Sci. Jpn. 23, 380–386. doi:10.2472/JSMS.23.380
Jin, G., Wang, L., Zhang, J., Hu, M., and Duan, N. (2015). Roadway Layout for Recycling Residual Coal Pillar in Room-And-Pillar Mining of Thick Coal Seam. Int. J. Min. Sci. Technol. 25 (05), 729–734. doi:10.1016/j.ijmst.2015.07.005
Kang, J., Shen, W., Bai, J., Yan, S., Wang, X., Li, W., et al. (2017). Influence of Abnormal Stress under a Residual Bearing Coal Pillar on the Stability of a Mine Entry. Int. J. Min. Sci. Technol. 27 (6), 945–954. doi:10.1016/j.ijmst.2017.06.012
Kong X. Z. (2020). Research and application of gob-side roadway support parameters for extra-thick coal seams in Tashan Mine [D]. Taiyuan University of Technology, 2020. doi:10.27352/d.cnki.gylgu.2020.002150
Kong, D. Z., Wang, Z. H., and Ren, Z. C. (2014). Determining the Optimum Position of Roadways of Full-Mechanized Caving Face in the Close Distance Seams. Chin. J. J. Min. Saf. Eng. 31 (2), 270–276. doi:10.13545/j.issn1673-3363.2014.02.017
Kontogianni, V. A., and Stiros, S. C. (2006). Convergence in Weak Rock Tunnels. Tunn. Tunn. Int. 38 (2), 36–39.
Lee, K. H., Kim, D. H., Park, J. J., and Lee, I. M. (2011). A Study on Critical Strain Based Damage-Controlled Test for the Evaluation of Rock Tunnel Stability. J. Med. Screen. 13 (6), 91–97. doi:10.9711/KTAJ.2011.13.6.501
Lu, S. L., Jiang, Y. D., and Sun, Y. L. (1993). The Selection of Vertical Distance Z between the Roadway and its Upper Coal Seam. Chin. J. J. China Univ. Min. Technol. 22 (1), 16–19.
Lv, J., Wan, Z., Yang, Y., Wang, J., Zhang, Y., and Liu, S. (2022). Failure Characteristics and Stability Control Technology of Dynamic Pressure Roadway Affected by the Mining Activity: A Case Study. Eng. Fail. Anal. 131, 105857. doi:10.1016/j.engfailanal.2021.105857
Ma, N. J., Guo, X. F., Zhao, Z. Q., Zhao, X-D., and Liu, H-T. (2016). Occurrence Mechanisms and Judging Criterion on Circular Tunnel Butterfly Rock Burst in Homogeneous Medium. Chin. J. J. China Coal Soc. 41 (11), 2679–2688. doi:10.13225/j.cnki.jccs.2016.0788
Ma, N. J., Ma, J., Zhao, Z. Q., Guo, X. F., Shi, H. Y., and Qiao, J. Y. (2019). Mechanical Mechanism and Evolution of X-Shaped Conjugate Shear Fractures-Seism. J. China Coal Soc. 44 (6), 1647–1653. doi:10.13225/j.cnki.jccs.2019.0125
Ma, N. J., Zhao, X. D., Zhao, Z. Q., Guo, X., Liu, H., and Jiahou, P. (2017). Conjecture about Mechanism of Butterfly-Shape Coal and Gas Outburst in Excavation Roadway. Chin. J. J. Min. Sci. Technol. 2 (02), 137–149. doi:10.19606/j.cnki.jmst.2017.02.005
Stiros, S. C., and Kontogianni, V. A. (2009). Coulomb Stress Changes: from Earthquakes to Underground Excavation Failures. Int. J. Rock Mech. Min. Sci. 46 (1), 182–187. doi:10.1016/j.ijrmms.2008.09.013
Xia, Z., Yao, Q., Meng, G., Xu, Q., Tang, C., Zhu, L., et al. (2021). Numerical Study of Stability of Mining Roadways with 6.0-m Section Coal Pillars under Influence of Repeated Mining. Int. J. Rock Mech. Min. Sci. 138, 104641. doi:10.1016/j.ijrmms.2021.104641
Yang, W., Liu, C. Y., and Yang, Y. (2012). Reasonable Malposition Setting in Close Distance Coal Seams under Influence of Interlaminar Stresses. Chin. J. Rock Mech. Eng. 31, 2965–2972.
Yu, X. F. (1982). The Theory of Axial Variation and Basic Rules of Deformation and Fracture of Rock Surrounding. Uranium Min. Metallurgy 1 (1), 8–17. doi:10.13426/j.cnki.yky.1982.01.003
Yu, X. F. (1981). Theory of Axial Variation and Three Rules of Axial Ratio for Stabilizing Country Rock. Nonferrous Met. 33 (3), 8–15.
Zhang, B. S., Yang, S. S., Kang, L. X., and Zhai, Y. (2008). Discussion on Method for Determining Reasonable Position of Roadway for Ultra-close Multi-Seam. Chin. J. Rock Mech. Eng. 27 (1), 97–101. doi:10.1016/S1872-5791(08)60057-3
Zhang, Y., Zhang, C. L., Wei, C. C., Liu, Y. D., Zhang, S. Q., and Zhao, J. J. (2014). The Study on Roadway Layout in Coordination of Mining Coal Seams Base on Failure of Floor Strata. Adv. Mater. Res. 889-890, 1362–1374. doi:10.4028/www.scientific.net/amr.889-890.1362
Zhang, Z., Deng, M., Wang, X., Yu, W., Zhang, F., and Dao, V. D. (2020). Field and Numerical Investigations on the Lower Coal Seam Entry Failure Analysis under the Remnant Pillar. Eng. Fail. Anal. 115 (5), 104638. doi:10.1016/j.engfailanal.2020.104638
Zhao, P. N. (1978). The Shape of the Natural Balance Archon the Roadway Roof Considering the Original Stress in the Horizontal Direction. Chin. J. J. China Univ. Mining&Technology. 7 (0), 51–58.
Zhao, Z. Q., Ma, N. J., Guo, X. F., Zhao, X., Xia, Y., and Ma, Z. (2016b). Mechanism Conjecture of Butterfly Rock Burst in Coal Seam Roadway. Chin. J. J. China Coal Soc. 41 (11), 2689–2697. doi:10.13225/j.cnki.jccs.2016.0786
Zhao, Z. Q., Ma, N. J., Guo, X. F., Zhao, X-D., and Long, F. (2016a). Falling Principle and Support Design of Butterfly-Failure Roof in Large Deformation Mining Roadways. Chin. J. J. China Coal Soc. 41 (12), 2932–2939. doi:10.13225/j.cnki.jccs.2016.1146
Zhao, Z. Q. (2014). Study on Mechanism and Control Method of Deformation and Failure of Surrounding Rock in Large Deformation Mining Roadway. Beijing: China University of Mining and Technology, 26–32.
Keywords: residual coal pillar, lower-layer mining roadway, deformation and destruction, inhomogeneous stress field, butterfly plastic zone theory
Citation: Wang X-H, Zhao Z-Q, Wu Z, Zhang H-H, Wang J, Sui Y and Ren Z-C (2022) Deformation and Failure Mechanism of the Lower Roadway in a Close-Range Residual Coal Pillar Area. Front. Earth Sci. 10:937276. doi: 10.3389/feart.2022.937276
Received: 06 May 2022; Accepted: 13 June 2022;
Published: 26 July 2022.
Edited by:
Yongtao Yang, Institute of Rock and Soil Mechanics (CAS), ChinaReviewed by:
Wu Wenan, Beijing University of Technology, ChinaGan Li, Ningbo University, China
Zhenghu Zhang, Dalian University of Technology, China
Haiqing Zhang, Hebei University, China
Copyright © 2022 Wang, Zhao, Wu, Zhang, Wang, Sui and Ren. This is an open-access article distributed under the terms of the Creative Commons Attribution License (CC BY). The use, distribution or reproduction in other forums is permitted, provided the original author(s) and the copyright owner(s) are credited and that the original publication in this journal is cited, in accordance with accepted academic practice. No use, distribution or reproduction is permitted which does not comply with these terms.
*Correspondence: Xiao-He Wang, wangxh_1994@163.com