Recent Decadal Weakening of the Summertime Rainfall Interannual Variability Over Yellow-Huaihe River Valley Attributable to the Western Pacific Cooling
 Wei Lu
 Yimin Zhu
 Yao Ha
 Zhong Zhong
 Yijia Hu
- 1College of Meteorology and Oceanography, National University of Defense Technology, Changsha, China
- 2Jiangsu Collaborative Innovation Center for Climate Change and School of Atmospheric Sciences, Nanjing University, Nanjing, China
This study focuses on the interdecadal transition of summer rainfall interannual variability over the Yellow-Huaihe River valley (YHRV). It is found that the interannual variability of summer rainfall over the YHRV becomes significantly weakened after the late 2000s. In the decade before the late 2000s (hereafter P1), the variance is 1.28
1 Introduction
As a coupled climate system, the East Asian summer monsoon (EASM) is the result of the combined forcing of annual variation in insolation, large-scale land-sea thermal difference, topography, and unstable circulation systems. From the classical point of view, large-scale land-sea thermal difference is the primary driving force of regional monsoon and associated rainfall. The EASM, which belongs to the Asian monsoon system, has two major characteristics, i.e., an obvious seasonal reversal in wind patterns and rapid alternation of dry and wet (rainy) seasons (Webster et al., 1998). As the EASM onsets over the South China Sea in mid-May, the rainband advances northward. The rainband appears in South China in late-May, when is the pre-flood season there. In mid-June, the rainband jumps to the north and reaches the middle and lower reaches of the Yangtze River. The rainy season during this period is called the Meiyu season. After that, the rainband further moves northward, reaching North and Northeast China, and the North China rainy season starts (Ding 1992; Matsumoto 1997). In some years, the rainband can also remain stagnant over the Yellow-Huaihe River valley (YHRV), and the rainy season is formed in this region. The YHRV is located in eastern China between North China and the middle and lower reaches of the Yangtze River, where rainfall is largely concentrated in summer. Warm moist air over this region mostly comes from the southwesterly monsoon circulation and the southeasterly flow associated with the western Pacific subtropical high (Zheng et al., 2019), providing abundant water vapor supply for monsoon rainfall. The YHRV is one of the most important industrial and agricultural bases in China. In response to continuous global warming, extreme rainfall events in the YHRV have also been increasing (Ha et al., 2016).
Under the influence of the EASM system, summer monsoon rainfall (including rainfall over the YHRV) demonstrates multi-scale variabilities including interdecadal variability, interannual variability, intraseasonal variability and synoptic variability (Wang et al., 2017), etc. Interannual and interdecadal variabilities of the EASM rainfall are particularly significant (Zhu et al., 2020; Zhao et al., 2022). There have been many studies on interannual variation of rainfall in the EASM system. It has been pointed out that the EASM rainfall often exhibits a quasi-biennial oscillation pattern (Tian and Yasunari 1992; Chang et al., 2000). Later, Huang et al. (2004) pointed out that the quasi-biennial oscillation of summer rainfall in eastern China is closely related to the quasi-biennial oscillation of water vapor transport flux of the summer monsoon over East Asia, which is caused by the quasi-biennial cycle of thermal changes in the tropical western Pacific. In addition, Ding (2007) pointed out that the quasi-biennial oscillation is also the main mode of the interannual variation of the Asian monsoon. With the increase in observational data and the improvement of global circulation models, weather and climate variability over time scales longer than interannual scale has become a major topic in global climate research (Yamaura and Kajikawa 2017; Cao et al., 2019; Wang et al., 2019). The major patterns of the EASM and summer rainfall in eastern China obviously have experienced multiple interdecadal adjustment processes (Ding et al., 2010). The study of Ding et al. (2008) revealed that two significant interdecadal changes in summer rainfall over eastern China occurred in 1978 and 1992, respectively. These two interdecadal changes are characterized by an obvious southward shift of the EASM rainband. Deng et al. (2009) also pointed out that the summer rainfall pattern in China has shown obvious interdecadal changes in the mid-to late 1970s and early 1990s. One possible reason for the interdecadal changes mentioned above is that, in the mid-to late 1970s, sea surface temperature (SST) anomalies in the mid-latitude North Pacific changed from positive to negative, and the Pacific Decadal Oscillation (PDO) changed from negative phase to positive phase. In response to the changes in SST anomalies and PDO phase changes, the EASM circulation system changed from strong to weak, and the spatial pattern of rainfall anomalies in eastern China changed from “+ − +” to “− + −” tripole distribution pattern from south to north. Since the late 1980s and early 1990s, SST in the northwestern Pacific Ocean to the south of Japan is abnormally warm, while the SST near the Philippine Islands also becomes warmer. Corresponding to such a configuration of SST anomalies, the WPSH moves southward and westward, leading to the formation of an anticyclone anomaly above the Pacific Ocean to the east of Taiwan. As a result, water vapor transport from the Northwestern Pacific enhances and rainfall in South China increases accordingly. Since North China is under the control of northerly wind anomalies, rainfall is relatively low in North China. This explains why rainfall distribution in eastern China changes to a dipole pattern of “− +” from north to south (Deng et al., 2009; Chen et al., 2012; Wang et al., 2017).
It is worth noting that most previous studies on the interdecadal variation of the EASM rainfall all are from the perspective of mean value (Wang et al., 2017; Ha et al., 2019). However, the interannual variability of summer rainfall, or variance characteristics, also presents significant interdecadal changes. The physical mechanisms that affect the interdecadal variation of rainfall mean are different from those that affect the interdecadal variation of rainfall variance. Moreover, in statistical climate prediction models, interannual increments of the forecast can be used to improve the accuracy of seasonal forecast (Hu et al., 2014). This is because the interannual increment is more sensitive than the original value. It can reflect the dynamic change law of meteorological elements, amplify abnormal signals and significantly reduce the influence of the interdecadal background, and to a certain extent overcome the inconsistency between signals of interdecadal and interannual change prediction. Therefore, studies on the interdecadal variation of summer rainfall interannual variability are of great significance for the seasonal prediction of rainfall. Observational evidence suggests that the interannual variability of summer rainfall over the YHRV has significantly weakened since late 2000s (Ren et al., 2017). Therefore, it is interesting to find out the possible reason for the interdecadal transition, which will be addressed in this paper.
The remainder of this paper is organized as follows. Data and methods are described in Section 2. In Section 3, recent interdecadal transition of summer rainfall interannual variability over the YHRV is examined. Atmospheric circulation anomalies related to summer rainfall are analyzed in Section 4. In Section 5, the possible mechanism for the observed change is discussed. Conclusions and discussion are provided in Section 6.
2 Data and Methods
The NOAA Precipitation Reconstruction Dataset with a spatial resolution of 2.5° × 2.5° (Chen et al., 2002) and the daily outgoing longwave radiation (OLR) dataset on global 2.5° × 2.5° grids (Liebmann and Smith 1996) produced based on NOAA polar-orbiting satellite remote sensing data are used in the present study. Monthly mean atmospheric reanalysis data are extracted from the NCEP/NCAR Reanalysis 1, which has a spatial resolution of 2.5° × 2.5° (Leetmaa et al., 1996). The NOAA OI SST V2 High Resolution Dataset with a resolution of 0.25° × 0.25° is also used (Reynolds et al., 2007). In order to eliminate the impact of global warming, this study removes linear trends for all environmental variables in the compositions.
The study period covers 42 years from 1979 to 2020, and the boreal summer season is defined as the 3-month period from July to September (JAS). To test whether the interannual variability of summer rainfall over the YHRV is characterized by interdecadal transition, F-test with a 10-year window is performed on the summer rainfall time series. The F test can test whether the variances of two populations are significantly different. In the case of unknown population variances, it is assumed that
It follows the F distribution with degrees of freedom
To investigate possible sources and propagation routes of wave trains, the phase-independent wave activity flux (WAF) proposed by Takaya and Nakamura (2001) is calculated. The two-dimensional horizontal WAF can be expressed as:
where
3 Recent Interdecadal Transition of Summer Rainfall Interannual Variability Over Yellow-Huaihe River Valley
To depict the interdecadal transition of summer rainfall interannual variability in the late 2000s, time series and absolute values of annual increment and 10-year running F test values of summer rainfall averaged over the YHRV (32°N–37°N, 108°E–120°E) are shown in Figure 1. The blue solid line in Figure 1A shows the time series of summer rainfall over the YHRV. The interannual variability of summer rainfall presents a significant variation. The late 2000s is the turning point, when the interannual variability of summer rainfall changes from large to small. The red lines in Figure 1B show the results of the sliding F test of summer rainfall within a 10-year window, which indicate that the interannual variability of summer rainfall experienced a significant interdecadal transition around 2007/08. This result suggests that around the late 2000s, the interannual variance of summer rainfall over the YHRV significantly weakened. Therefore, taking 2008 as the turning point, the period (1997–2007) with the largest interannual variability is defined as P1 and the period (2008–2019) with the smallest interannual variability of summer rainfall is defined as P2. Note that the variance in the P1 period is 1.28
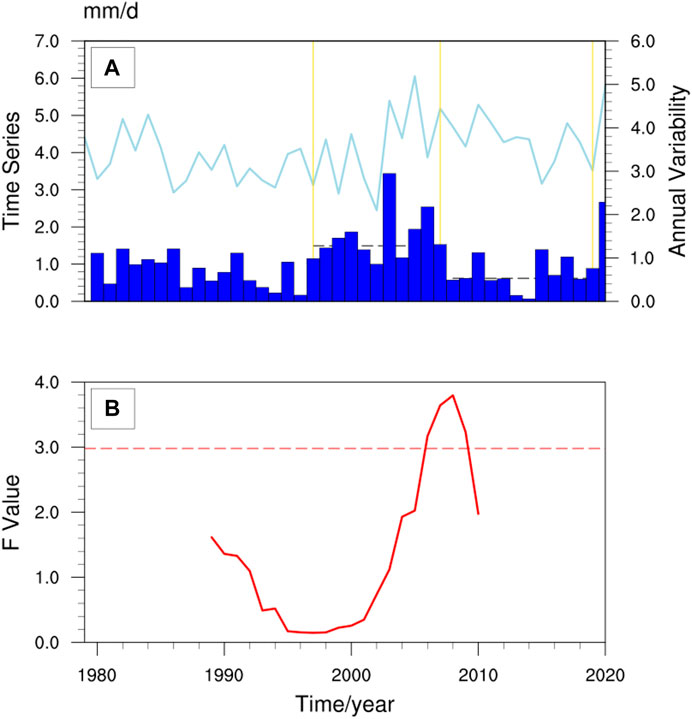
FIGURE 1. (A) Time series (blue solid line) and absolute values of annual increment (blue bars) and (B) 10-year running F test values (red solid line) of summer rainfall over the YHRV [dash lines in (A) represent mean values of annual increment in P1 and P2, respectively; dash line in (B) indicates significant values exceeding the 95% confidence level].
Under the background of interdecadal transition of summer rainfall interannual variability, it is necessary to find out spatial changes of summer rainfall over the YHRV from P1 to P2. As shown in Figure 2, spatial distributions of the differences between the composites of positive and negative phases (Table 1) show a morphological transformation from tripole to dipole from P1 to P2. The center of maximum positive difference is located in the Huaihe River basin and presents a band-like zonal distribution pattern in P1 (Figure 2B), whereas it is located in the lower Yellow River reaches in P2 (Figure 2D). By comparison, it is found that the intensity of the maximum center in P2 is more significant. Moreover, the maximum variance of summer rainfall also displays a band-like zonal distribution pattern along the Huaihe River basin in P1 (Figure 2A). The results indicate that the variance well corresponds to the interannual variability of summer rainfall.
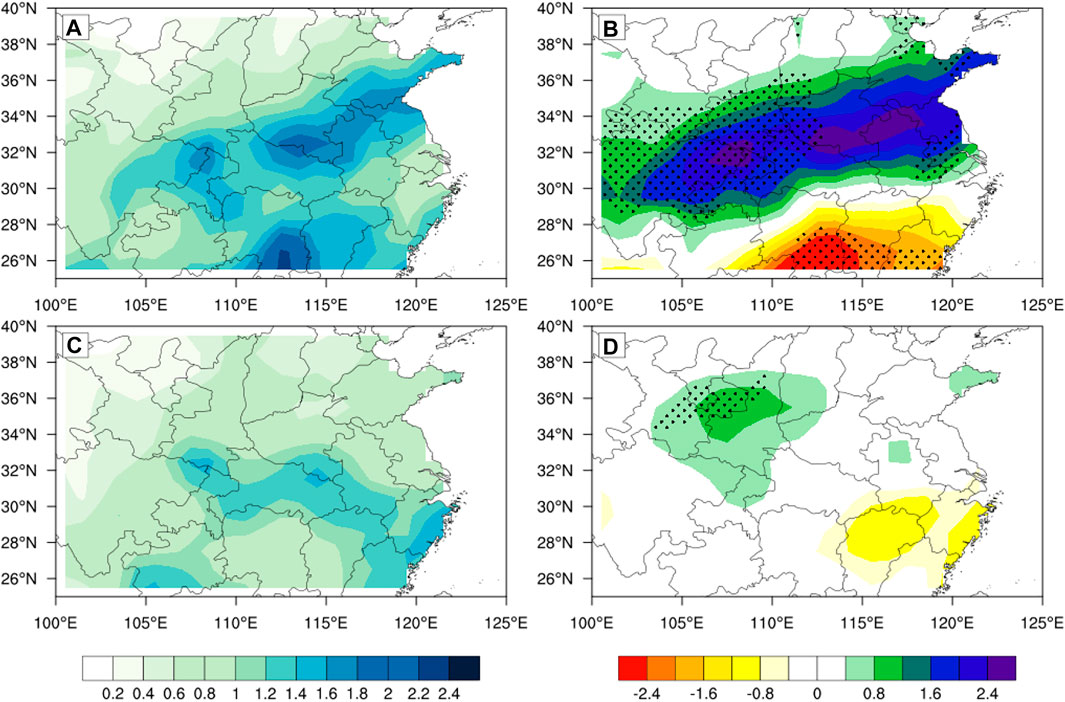
FIGURE 2. Spatial patterns of summer rainfall differences between the composites of positive and negative years (unit:
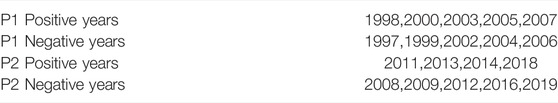
TABLE 1. Positive and negative years in P1 and P2 identified by the threshold of zero of the summer rainfall time series after removing the linear trend.
4 Atmospheric Circulation Anomalies Related to Summer Rainfall
In order to explore the reasons for the large differences in the interdecadal variance of summer rainfall interannual variability, in this section we mainly analyze characteristics of atmospheric circulation anomalies on the interdecadal scale. Figure 3 shows differences in geopotential height at 500 hPa and 200 hPa as well as 200 hPa zonal wind between composites of positive and negative years in P1 and P2. The westerly jet stream axis at 200 hPa is located near 37°N (Figures 3A,B) in P1 and moves north to near 43°N (Figures 3D,E) in P2. The northward shift of the westerly jet leads to the weakening of the jet on the southern side and the strengthening of the jet on the northern side as well as the weakening of the easterly near 20°N. These changes result in a weakening of the East Asian summer monsoon (Zhao et al., 2015), and clearly indicate that the northward shift of the jet stream axis suppresses the development of summer rainfall over the YHRV. The differences in geopotential height at 500 hPa (Figures 3C,F) have consistent spatial distribution patterns with that at 200 hPa (Figures 3A,D). Moreover, Figures 3C,F also show the western Pacific subtropical high (WPSH; 0 gpm contour) in the eddy geopotential height field
FIGURE 3. Left column: differences in geopotential height at 200 hPa between the composites of positive and negative years (unit: gpm). Middle column: differences in zonal wind at 200 hPa between the composites of positive and negative years (unit:
In order to explore the impact of local atmospheric circulation anomalies on the interdecadal transition of summer rainfall interannual variability, Figure 4 shows the differences in water vapor flux in lower levels and its divergence, OLR, omega in lower levels, 850 hPa wind and relative vorticity between their composites of positive and negative years. From the perspective of local circulation anomalies in lower levels, positive vorticity anomalies over the YHRV in P1 are significant. The YHRV is located on the side of the cyclonic circulation, and the equatorial easterly anomalies are stronger (Figure 4D), which indicates that the convergence at the lower levels is stronger in P1 than in P2 (Figure 4F). Strong convergence makes it easier to trigger ascending motions. From the perspective of convection, local convective activities over the YHRV in P1 (Figure 4B) are more significant than that in P2 (Figure 4E). OLR and omega in lower levels in P1 present a dipole distribution from the YHRV to South China. From the perspective of water vapor transport, the low-level water vapor in both P1 and P2 mainly comes from the Northwestern Pacific-South China Sea (NWP-SCS), but the equatorial easterly is stronger in P1 (Figure 4C) than on P2 and the YHRV is located on the north side of the anti-cyclone. As a result, the intensity of convergence over the YHRV is more significant in P1 than that in P2 (Figure 4F). The above results of the circulation differences between the composites of positive and negative years indicate that the circulations in P1 are more conducive to the strengthening of interannual oscillation of summer rainfall over the YHRV. That is to say, the strong anti-phase anomalies of local atmospheric circulation between the positive and negative years in P1 lead to large summer rainfall interannual variability.
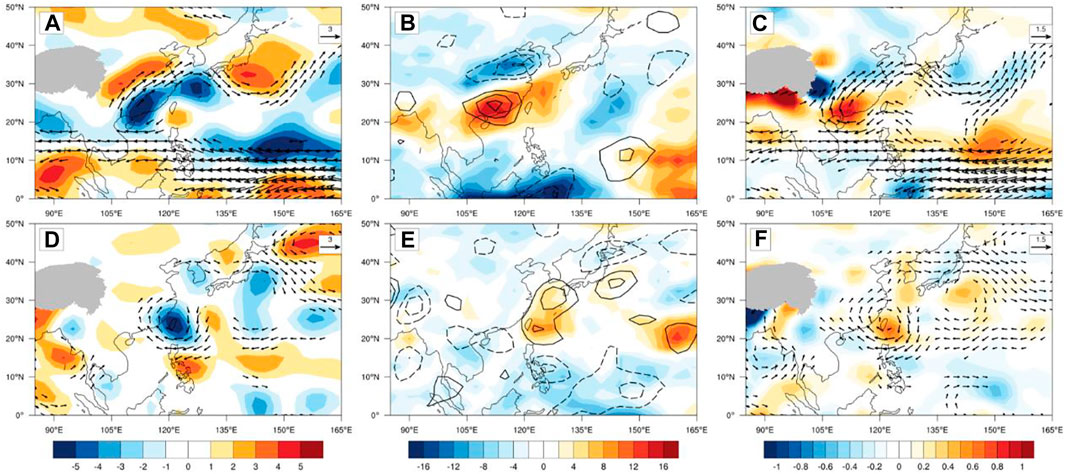
FIGURE 4. Left column: differences in 850 hPa wind (vectors, unit:
5 Possible Mechanism
As shown in Figure 3, the change in the position of the PJ wave trains may determine interdecadal transition of summer rainfall interannual variability over the YHRV. Another issue is what controls the interdecadal transition of PJ wave trains. Previous studies show that the eastward shift of the PJ wave trains may be forced by the shift of the associated SSTA (Chen and Zhou 2014; Yim et al., 2014). In P1 (Figures 5A–C), the PJ wave trains are related to the decaying phase of the eastern Pacific (EP) El Niño, the warming in the western Pacific (WP) warm pool and the cooling in the Indian Ocean, while the movement of the PJ wave trains to the northeast is related to the eastern Pacific La Niña in its developing phase and insignificant SST changes in the WP and Indian Ocean in P2 (Figures 5D–F). These results are consistent with the study of Xu et al. (2019).
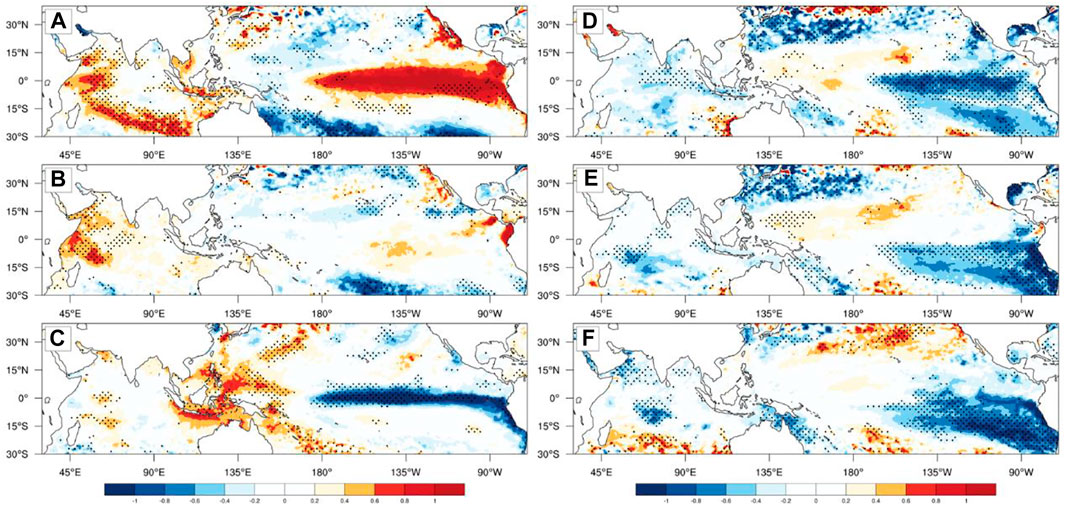
FIGURE 5. Differences in SSTA (unit: K) between the composites of positive and negative years [(A,D) for pre-winter (DJF), (B,E) for spring (MAM) and (C,F) for summer (JAS); (A–C) for P1 and (D–F) for P2; dotted areas indicate the values are significant at/above the 95% confidence level by Student’s t test].
5.1 Role of the Western Pacific Warming Pool
As shown in Figures 5A–C, in addition to the EP El Niño in its decaying phase in P1, the evolution of differences in SSTA from the previous winter to the subsequent summer shows an increasing trend in the Western Pacific (WP) warm SST, which can be called the WP warm pool. L’ Heureux et al. (2013) pointed that the cooling in the tropical EP and warming in the tropical WP can contribute to the enhancement of the Walker circulation and convective activities in the WP (Zhang et al., 2016). To further explore the enhancement effect of the WP warm pool on the Walker circulation and Hadley circulation, Figure 6 shows differences in Walker circulation (Figure 6A) and Hadley circulation (Figure 6B) between the composites of positive and negative years. Under the background of continuous warming in the WP warm pool, the updraft of the Walker circulation in the equatorial WP and the downdraft in the equatorial central and eastern Pacific have significantly enhanced. In P1, driven by the WP warm pool, the Walker circulation is significantly stronger in the positive years than that in the negative years. At the same time, the ascending branch of the Walker circulation in the equatorial WP forms a meridional Hadley circulation on its northside, and a descending branch appears near 20°N, which effectively strengthens the downdraft in the WP and is favorable for the strengthening of the WPSH. There are updrafts around 30°N–40°N, and the center of the updrafts is located exactly at the center of the area with the largest summer rainfall interannual variability (32°N). These results indicate that the enhancement of the WP warm pool in the positive years of P1 phase induces the Hadley circulation by enhancing the Walker circulation, resulting in a dynamic descending branch on the north side of the warm pool that effectively enhances the WPSH. And the ascending branch on the north side of the WPSH provides a favorable condition for the enhancement of summer rainfall. The opposite process is true in negative years. These different processes are responsible for the enhancement of the summer rainfall interannual variability in P1.
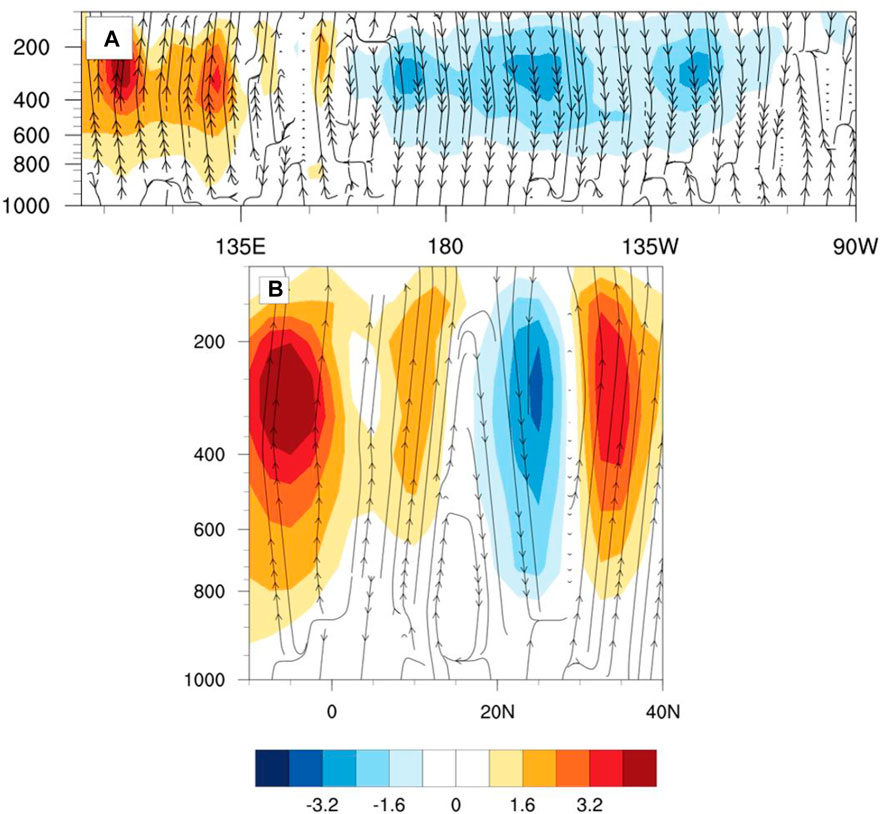
FIGURE 6. Differences in (A) Walker circulation (10°S-10°N averaged) and (B) Hadley circulation (100°E–120°E averaged) between the composites of positive and negative years in P1 [shaded areas indicate differences in vertical velocity (unit:
5.2 Role of Pacific-Japan Wave Trains Pattern
As mentioned in Section 4, the PJ wave train pattern is also a key factor affecting the summer rainfall interannual variability. Figure 7 shows 200 a) and 850 hPa b) relative vorticity related to the PJ pattern in P1. It is characterized by zonally elongated centers with alternating signs, which quite resembles the PJ pattern (Kitamura et al., 2016; Xu et al., 2019). In lower levels, the negative maximum center is located in the Philippine Islands while the positive maximum center is located in the YHRV and southern Japan (Figure 7B). Takaya and Nakamura (2001) pointed out that the wave activity flux (WAF) vector is parallel to the group velocity of Rossby waves under the Wentzel-Kramers-Brillouin (WKB) approximation, whose convergence and divergence represent the sink and source of wave activity. In the lower levels, the WAF related to the PJ pattern emanates from the Philippine Islands and the ocean area to the east, then propagates north to the maximum positive vorticity center over the YHRV and southern Japan, and finally converges there. In higher levels, the PJ pattern exhibits a spatial distribution opposite to that in the lower levels (Figure 7A). WAF mainly propagates zonally along westerly jet stream in the mid-to high latitudes, and the position of the strongest meridional movement is over the mid-latitude WP from 135°E–180°E. The above results show that the energy of the PJ pattern in the positive years of P1 mainly comes from the tropics. Combined with the Hadley circulation triggered by the WP warm pool described in 5.1, the alternation of its ascending and descending branches is consistent with the alternating distribution of positive and negative active centers of the PJ pattern in lower levels. Previous studies proposed that the Rossby wave responses to SSTA pattern such as that shown in Figure 5C can suppress convective activities over the off-equatorial northern WP, which subsequently may trigger the meridional teleconnection pattern (Li and Wang 2005; Wu et al., 2009).
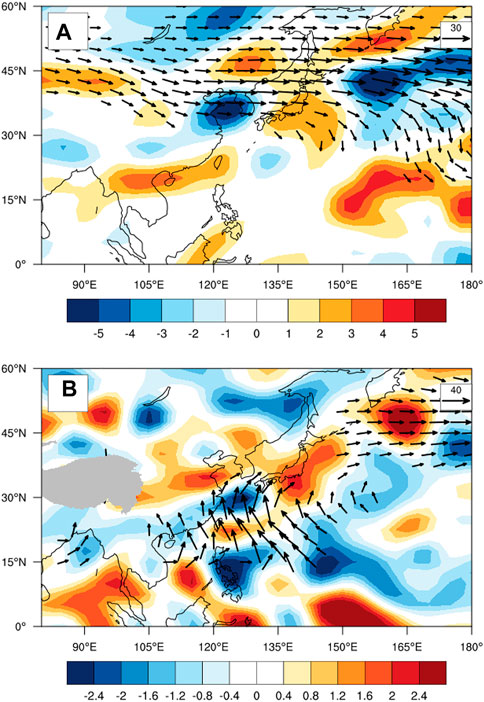
FIGURE 7. Summer mean relative vorticity (shadings,
Overall, the WP warm pool and El Niño in decaying phase strengthen the Walker circulation in the tropical Pacific and induce Hadley circulation, whose ascending branch over the YHRV provides a favorable condition for the development of rainfall. Second, the northward propagation of Rossby wave energy in response to this kind of SSTA suppresses convective activities in the NWP and indirectly enhances the intensity of the WPSH, which triggers the PJ pattern and provides a large-scale circulation condition favorable for the growth of rainfall (Figure 8).
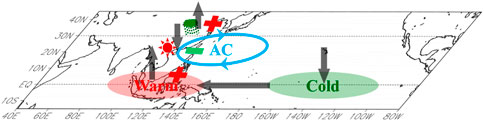
FIGURE 8. Schematic diagram illustrating the influences of SSTA and atmosphere circulation anomalies on summer rainfall over the YHRV in P1 positive years. Red and green shaded areas indicate warm and cold SSTA respectively. Blue arrow indicates the WPSH. Vertical grey arrows indicate updrafts and downdrafts. Horizontal grey arrow indicates the equator easterly wind. “Red plus-green minus-red plus” indicates the PJ pattern, where plus and minus represent positive and negative vorticity centers, respectively.
6 Conclusion and Discussion
Previous studies have shown that the mean value of EASM rainfall has significant interdecadal variation characteristics (Ding et al., 2008; Deng et al., 2009). The present study reveals that the interannual variability of summer rainfall over the YHRV has significantly weakened since the late 2000s. By comparing the atmospheric circulation anomalies composited in positive and negative phases of summer rainfall over the YHRV in the decades 1997–2007 (P1) and 2008–2019 (P2), the reasons for the interdecadal transition of summer rainfall interannual variability are explored.
The spatial distributions of the differences between the composites of positive and variances in P1 and P2 are compared. The maximum center of positive difference and variance both are located in the Huaihe River basin and present a band-like zonal distribution in P1. Regardless of P1 or P2, the differences between the composites of positive and negative phases and variances have consistent spatial distribution characteristics, which indicates that the variance has a good correspondence with interannual variability. Moreover, the standard deviations of water vapor transport and convection (represented by vertical velocity) related to summer rainfall over the YHRV are also calculated. In P1, there are maximum centers of water vapor flux and vertical velocity (omega) over the YHRV in lower levels, while maximum OLR centers can also be found at the same places. Note that the maximum centers of standard deviations of water vapor flux and vertical velocity (omega) in lower levels as well as OLR over the YHRV have weakened significantly in P2. The consistency between water vapor transport and convective activities over the YHRV in both P1 and P2 indicates that the weakening of the interannual oscillation of local diabatic heating is a factor that directly leads to the interdecadal transition of summer rainfall interannual variability from P1 to P2.
In order to explore the reasons for the large differences in the interdecadal variance of summer rainfall interannual variability, characteristics of atmospheric circulation anomalies on the interdecadal scale are analyzed. The result indicates that the northward shift of the jet stream axis suppresses the growth of summer rainfall over the YHRV. Meanwhile, the interannual variability of the WPSH in P1 is more significant than that in P2, which well corresponds to the interdecadal transition of the summer rainfall interannual variability. In addition, the atmospheric circulation anomalies, which are zonally elongated and meridionally extend from the tropics to the north of Japan, resemble the PJ pattern. And the PJ pattern moves to the northeast from P1 to P2. To investigate the impact of local atmospheric circulation anomalies on the interdecadal transition of summer rainfall interannual variability, differences in water vapor flux and its divergence as well as omega in lower levels, differences in OLR, and differences in 850 hPa wind and relative vorticity between the composites of positive and negative years are displayed. The results show that, compared to the situation in P2, the differences between the composites of positive and negative years in P1 are more conducive to the strengthening of the interannual oscillation of summer rainfall over YHRV.
Previous studies have revealed that the eastward shift of the PJ wave trains may be triggered by the shift of associated SSTA. In P1, the PJ wave trains are related to the eastern Pacific (EP) El Niño in its decaying phase and warming in the western Pacific (WP) warm pool as well as cooling in the Indian Ocean. In P2, however, the northeast movement of the PJ wave trains is more related to the eastern Pacific La Niña in its developing phase and insignificant SST changes in the WP and the Indian Ocean. Composite analysis of the Walker circulation, the Hadley circulation and the PJ pattern in P1 positive years indicates that the WP warm pool and El Niño in decaying phase strengthen the Walker circulation in the tropical Pacific and induce the Hadley circulation, whose ascending branch over the YHRV provides a favorable condition for the development of rainfall. Second, the northward propagation of Rossby wave energy in response to this configuration of SSTA suppresses convective activities over the NWP and indirectly enhances the intensity of the WPSH. As a result, the PJ pattern is triggered and a large-scale circulation condition is induced that is favorable for the growth of rainfall.
This study focuses on the interdecadal transition of summer rainfall interannual variability over the YHRV and its possible mechanisms. The impacts of the WP warm pool and the PJ pattern are explored. It is worth noting that the results shown in this study are mainly based on statistical and dynamic analyses of observational data. Numerical experiments are needed to examine the credibility of these results in the future. The PJ pattern, an important teleconnection pattern associated with the EASM rainfall (Kosaka and Nakamura. 2011; Huang et al., 2012), is closely related to El Niño-Southern Oscillation (ENSO) and affects the EASM rainfall in El Niño decaying summer (Zhang et al., 1996; Xie et al., 2009; Zhang et al., 2017). Results of the present study show that the northeast movement of the PJ pattern is significant after 2007, and further research is needed to reveal the reasons for this movement. What’s more, Ren et al. (2017) pointed that there is also observational evidence of the connection between the Pacific Decadal Oscillation (PDO) and summer rainfall in eastern China on the interdecadal timescale. The shift of the PDO phase in late 2000s may lead to the shift of PJ pattern,resulting in summer rainfall variation in the east China, which need a further study.
Data Availability Statement
The original contributions presented in the study are included in the article/supplementary material, further inquiries can be directed to the corresponding authors.
Author Contributions
YH and YZ contributed to conception and design of the study. WL wrote the first draft of the article. ZZ and YH reviewed and edited the article.
Funding
This work is sponsored jointly by the National Natural Science Foundation of China (41975090), the Natural Science Foundation of Hunan Province, China (2022JJ20043), the Scientific Research Program of National University of Defense Technology (18/19-QNCXJ), the National Key Basic Research Program (2018YFC1505905) and the Jiangsu Collaborative Innovation Center for Climate Change in Nanjing University.
Conflict of Interest
The authors declare that the research was conducted in the absence of any commercial or financial relationships that could be construed as a potential conflict of interest.
Publisher’s Note
All claims expressed in this article are solely those of the authors and do not necessarily represent those of their affiliated organizations, or those of the publisher, the editors and the reviewers. Any product that may be evaluated in this article, or claim that may be made by its manufacturer, is not guaranteed or endorsed by the publisher.
References
Cao, X., Liu, Y., Wu, R., Bi, M., Dai, Y., and Cai, Z. (2019). Northwestwards Shift of Tropical Cyclone Genesis Position during Autumn over the Western North Pacific after the Late 1990s. Int. J. Climatol. 40 (3), 1885–1899. doi:10.1002/joc.6310
Chang, C.-P., Zhang, Y., and Li, T. (2000). Interannual and Interdecadal Variations of the East Asian Summer Monsoon and Tropical Pacific SSTs. Part I: Roles of the Subtropical Ridge. J. Clim. 13 (24), 4310–4325. doi:10.1175/1520-0442(2000)013<4310:iaivot>2.0.co;2
Chen, J., Wu, R., and Wen, Z. (2012). Contribution of South China Sea Tropical Cyclones to an Increase in Southern China Summer Rainfall Around 1993. Adv. Atmos. Sci. 29 (3), 585–598. doi:10.1007/s00376-011-1181-6
Chen, M., Xie, P., Janowiak, J. E., and Arkin, P. A. (2002). Global Land Precipitation: A 50-yr Monthly Analysis Based on Gauge Observations. J. Hydrometeor 3 (3), 249–266. doi:10.1175/1525-7541(2002)003<0249:glpaym>2.0.co;2
Chen, X., and Zhou, T. (2014). Relative Role of Tropical SST Forcing in the 1990s Periodicity Change of the Pacific-Japan Pattern Interannual Variability. J. Geophys. Res. Atmos. 119 (13), 043-13. doi:10.1002/2014JD022064
Deng, W., Sun, Z., Zeng, G., and Ni, D. (2009). Interdecadal Variation of Summer Precipitation Pattern over Eastern China and its Relationship with the North Pacific SST. Chin. J. Atmos. Sci. 33 (4), 835–846. doi:10.3878/j.issn.1006-9895.2009.04.16
Ding, R., Ha, K.-J., and Li, J. (2010). Interdecadal Shift in the Relationship between the East Asian Summer Monsoon and the Tropical Indian Ocean. Clim. Dyn. 34 (7-8), 1059–1071. doi:10.1007/s00382-009-0555-2
Ding, Y. (1992). Summer Monsoon Rainfalls in China. J. Meteorological Soc. Jpn. 70 (1B), 373–396. doi:10.2151/jmsj1965.70.1b_373
Ding, Y. (2007). The Variability of the Asian Summer Monsoon. J. Meteorological Soc. Jpn. 85B (0), 21–54. doi:10.2151/jmsj.85b.21
Ding, Y., Wang, Z., and Sun, Y. (2008). Inter‐decadal Variation of the Summer Precipitation in East China and its Association with Decreasing Asian Summer monsoon.Part I: Observed Evidences. Int. J. Climatol. 28, 1139–1161. doi:10.1002/joc.1615
Ha, Y., Zhong, Z., Chen, H., and Hu, Y. (2016). Out-of-phase Decadal Changes in Boreal Summer Rainfall between Yellow-Huaihe River Valley and Southern China Around 2002/2003. Clim. Dyn. 47, 137–158. doi:10.1007/s00382-015-2828-2
Ha, Y., Zhong, Z., Hu, Y., Zhu, Y., Zang, Z., Zhang, Y., et al. (2019). Differences between Decadal Decreases of Boreal Summer Rainfall in Southeastern and Southwestern China in the Early 2000s. Clim. Dyn. 52, 3533–3552. doi:10.1007/s00382-018-4408-8
He, C., Lin, A., Gu, D., Li, C., Zheng, B., Wu, B., et al. (2018). Using Eddy Geopotential Height to Measure the Western North Pacific Subtropical High in a Warming Climate. Theor. Appl. Climatol. 131, 681–691. doi:10.1007/s00704-016-2001-9
Hu, Y., Zhu, Y., Zhong, Z., and Ha, Y. (2014). New Predictors and a Statistical Forecast Model for Mei-Yu Onset Date in the Middle and Lower Reaches of the Yangtze River Valley. Weather Forecast. 29 (3), 654–665. doi:10.1175/waf-d-13-00109.1
Huang, R., Chen, J., Wang, L., and Lin, Z. (2012). Characteristics, Processes, and Causes of the Spatio-Temporal Variabilities of the East Asian Monsoon System. Adv. Atmos. Sci. 29, 910–942. doi:10.1007/s00376-012-2015-x
Huang, R., Huang, G., and Wei, Z. (2004). Climate Variations of the Summer Monsoon over China. East Asian Monsoon, 213–268. doi:10.1142/9789812701411_0006
Huang, Y., Wang, H., Fan, K., and Gao, Y. (2015). The Western Pacific Subtropical High after the 1970s: Westward or Eastward Shift? Clim. Dyn. 44, 2035–2047. doi:10.1007/s00382-014-2194-5
Kitamura, T., Nakano, T., and Sugimoto, S. (2016). Decadal Variations in Mixed Layer Salinity in the Kuroshio Extension Recirculation Gyre Region: Influence of Precipitation during the Warm Season. J. Oceanogr. 72, 167–175. doi:10.1007/s10872-015-0317-1
Kosaka, Y., and Nakamura, H. (2011). Dominant Mode of Climate Variability, Intermodel Diversity, and Projected Future Changes over the Summertime Western North Pacific Simulated in the CMIP3 Models. J. Clim. 24, 3935–3955. doi:10.1175/2011JCLI3907.1
Kosaka, Y., and Nakamura, H. (2006). Structure and Dynamics of the Summertime Pacific-Japan Teleconnection Pattern. Q.J.R. Meteorol. Soc. 132, 2009–2030. doi:10.1256/qj.05.204
Leetmaa, A., Reynolds, R., Jenne, R., and Josepht, D. (1996). The NCEP/NCAR 40-year Reanalysis Project. Bull. Am. Meteor. Soc. 77, 437–471. Available at: http://www.jstor.org/stable/26233278.
L’Heureux, M. L., Lee, S., and Lyon, B. (2013). Recent Multidecadal Strengthening of the Walker Circulation across the Tropical Pacific. Nat. Clim. Change 3, 571–576. doi:10.1038/nclimate1840
Li, T., and Wang, B. (2005). Review A Review on the Western North Pacific Monsoon: Synoptic-To-Interannual Variabilities. Terr. Atmos. Ocean. Sci. 16, 285–314. doi:10.3319/tao.2005.16.2.285(a)
Liebmann, B., and Smith, C. A. (1996). Description of a Complete (Interpolated) OLR Dataset. Bull. Amer. Meteor. Soc. 77, 1275–1277. doi:10.1175/1520-0477(1996)077<0437:TNYRP>2.0.CO;2
Matsumoto, J. (1997). Seasonal Transition of Summer Rainy Season over Indochina and Adjacent Monsoon Region. Adv. Atmos. Sci. 14 (2), 231–245. doi:10.1007/s00376-997-0022-0
Nitta, T. (1987). Convective Activities in the Tropical Western Pacific and Their Impact on the Northern Hemisphere Summer Circulation. J. Meteorological Soc. Jpn. 65, 373–390. doi:10.2151/jmsj1965.65.3_373
Ren, Y., Song, L., Wang, Z., Xiao, Y., and Zhou, B. (2017). A Possible Abrupt Change in Summer Precipitation over Eastern China Around 2009. J. Meteorol. Res. 31, 397–408. doi:10.1007/s13351-016-6021-2
Reynolds, R. W., Smith, T. M., Liu, C., Chelton, D. B., Casey, K. S., and Schlax, M. G. (2007). Daily High-Resolution-Blended Analyses for Sea Surface Temperature. J. Clim. 20 (22), 5473–5496. doi:10.1175/2007jcli1824.1
Takaya, K., and Nakamura, H. (2001). A Formulation of a Phase-independent Wave-Activity Flux for Stationary and Migratory Quasigeostrophic Eddies on a Zonally Varying Basic Flow. J. Atmos. Sci. 58, 608–627. doi:10.1175/1520-0469(2001)058<0608:afoapi>2.0.co;2
Tian, S.-F., and Yasunari, T. (1992). Time and Space Structure of Interannual Variations in Summer Rainfall over China. J. Meteorological Soc. Jpn. 70 (1B), 585–596. doi:10.2151/jmsj1965.70.1B_585
Wang, J., Gui, S., Ma, A., Yang, R., and Zhang, Q. (2019). Interdecadal Variability of Summer Precipitation Efficiency in East Asia. Adv. Meteorology 2019, 1–17. doi:10.1155/2019/3563024
Wang, J., Wen, Z., Wu, R., and Lin, A. (2017). The Impact of Tropical Intraseasonal Oscillation on the Summer Rainfall Increase over Southern China Around 1992/1993. Clim. Dyn. 49, 1847–1863. doi:10.1007/s00382-016-3425-8
Wang, S.-Y., and Chen, T.-C. (2009). The Late-Spring Maximum of Rainfall over the U.S. Central Plains and the Role of the Low-Level Jet. J. Clim. 22 (17), 4696–4709. doi:10.1175/2009jcli2719.1
Webster, P. J., Magata, V. O., Palmer, T. N., Shukla, J., Thomas, R. A., Yanai, M. U., et al. (1998). Monsoons: Progress, Predictability and the Prospects for Prediction. J. Geophys. Res. 103, 144501–144510. doi:10.1029/97jc02719
Wu, B., Zhou, T., and Li, T. (2009). Seasonally Evolving Dominant Interannual Variability Modes of East Asian Climate*. J. Clim. 22, 2992–3005. doi:10.1175/2008jcli2710.1
Xie, S.-P., Hu, K., Hafner, J., Tokinaga, H., Du, Y., Huang, G., et al. (2009). Indian Ocean Capacitor Effect on Indo-Western Pacific Climate during the Summer Following El Niño. J. Clim. 22, 730–747. doi:10.1175/2008JCLI2544.1
Xu, P., Wang, L., Chen, W., Feng, J., and Liu, Y. (2019). Structural Changes in the Pacific-Japan Pattern in the Late 1990s. J. Clim. 32, 607–621. doi:10.1175/jcli-d-18-0123.1
Yamaura, T., and Kajikawa, Y. (2017). Decadal Change in the Boreal Summer Intraseasonal Oscillation. Clim. Dyn. 48, 3003–3014. doi:10.1007/s00382-016-3247-8
Yim, S.-Y., Wang, B., and Kwon, M. (2014). Interdecadal Change of the Controlling Mechanisms for East Asian Early Summer Rainfall Variation Around the Mid-1990s. Clim. Dyn. 42, 1325–1333. doi:10.1007/s00382-013-1760-6
Zhang, J.-Y., Wang, L., Yang, S., Chen, W., and Huangfu, J. (2016). Decadal Changes of the Wintertime Tropical Tropospheric Temperature and Their Influences on the Extratropical Climate. Sci. Bull. 61, 737–744. doi:10.1007/s11434-016-1054-6
Zhang, R., Min, Q., and Su, J. (2017). Impact of El Niño on Atmospheric Circulations over East Asia and Rainfall in China: Role of the Anomalous Western North Pacific Anticyclone. Sci. China Earth Sci. 60, 1124–1132. doi:10.1007/s11430-016-9026-x
Zhang, R., Sumi, A., and Kimoto, M. (1996). Impact of El Niño on the East Asian Monsoon. J. Meteorological Soc. Jpn. 74, 49–62. doi:10.2151/jmsj1965.74.1_49
Zhao, G., Huang, G., Wu, R., Tao, W., Gong, H., Qu, X., et al. (2015). A New Upper-Level Circulation Index for the East Asian Summer Monsoon Variability. J. Clim. 28 (24), 9977–9996. doi:10.1175/jcli-d-15-0272.1
Zhao, H., Zhao, K., Klotzbach, P. J., Wu, L., and Wang, C. (2022). Interannual and Interdecadal Drivers of Meridional Migration of Western North Pacific Tropical Cyclone Lifetime Maximum Intensity Location. J. Clim. 35 (9), 2709–2722. doi:10.1175/jcli-d-21-0797.1
Zheng, L., Zhang, Z., Wang, X., and Jia, X. (2019). Relationship between East Asian Summer Monsoon Anomaly and Summer Precipitation in Huanghuai Region. Meteorological Sci. Technol. 47 (01), 62–69. (in Chinese). doi:10.19517/j.1671-6345.20180131
Keywords: summer rainfall, Yellow-Huaihe River valley, interannual variability, interdecadal transition, El Niño decaying, western pacific warm pool, pacific-Japan pattern
Citation: Lu W, Zhu Y, Ha Y, Zhong Z and Hu Y (2022) Recent Decadal Weakening of the Summertime Rainfall Interannual Variability Over Yellow-Huaihe River Valley Attributable to the Western Pacific Cooling. Front. Earth Sci. 10:946252. doi: 10.3389/feart.2022.946252
Received: 17 May 2022; Accepted: 14 June 2022;
Published: 06 July 2022.
Edited by:
Haishan Chen, Nanjing University of Information Science and Technology, ChinaReviewed by:
Boqi Liu, Chinese Academy of Meteorological Sciences, ChinaPing Huang, Institute of Atmospheric Physics (CAS), China
Copyright © 2022 Lu, Zhu, Ha, Zhong and Hu. This is an open-access article distributed under the terms of the Creative Commons Attribution License (CC BY). The use, distribution or reproduction in other forums is permitted, provided the original author(s) and the copyright owner(s) are credited and that the original publication in this journal is cited, in accordance with accepted academic practice. No use, distribution or reproduction is permitted which does not comply with these terms.
*Correspondence: Yimin Zhu, zhuyimin@21cn.com; Yao Ha, hayao86@nudt.edu.cn, hayao1986@yeah.net