Exploring the Links Between Receiving Special Education Services and Adulthood Outcomes
 Tomoe Kanaya
 Jonathan Wai
 Brenda Miranda3
- 1Department of Psychological Science, Claremont McKenna College, Claremont, CA, United States
- 2Department of Education Reform, Department of Psychology, College of Education and Health Professions, University of Arkansas, Fayetteville, AR, United States
- 3Early Childhood, Child Trends, Bethesda, MD, United States
A majority of the research on students receiving special education services in the United States have focused on school-aged outcomes. Comparatively less is known about how these students fare in adulthood. By utilizing a one-to-one propensity score matching technique, individuals who received special education services were compared with those who did not on multiple adulthood outcomes that span educational attainment, economic self-sufficiency, social engagement, and health. Results suggest that Hispanic students in our sample who participate in special education fared better compared to their non-Hispanic counterparts on some outcomes. Moreover, propensity (the likelihood of receiving services) predicted several more outcomes. These results point to the potential importance of the contextual factors that surround special education services and suggest the need to provide context-specific services at the local level. The findings also highlight the use of propensity score analyses to reduce concerns of selection bias in special educational research.
Introduction
Each year, over six million school children–approximately 13 percent of all public school students–receive special education services in the United States (U.S.), under the Individuals with Disabilities Education Act (IDEA, National Center for Educational Statistics, 2018). Since its inception in 1975, however, researchers and policy makers have debated how to measure the outcomes of students who received services. One of the many difficulties in studying this program is that IDEA is dynamic and has undergone substantial changes over the years. For example, in 1986, infants and toddlers became eligible to receive services (Public Law 99-457, 1986). In 1990, “autism” was included as a category (Public Law 101-476, 1990). In 2004, the eligibility criteria for Learning Disability no longer required a “significant discrepancy” between IQ and achievement tests (Public Law 108-446, 2004) and required special education teachers to attain a higher level of qualifications and for students to be instructed in the “least restricted environment” (Public Law 108-446, 2004). Though this is not an exhaustive list of all the changes, they demonstrate the evolving nature of IDEA that alter the number and type of individuals who qualify for services.
Another difficulty in studying students who participated in IDEA is that studies often focus on a single disability category, such as a learning disability (e.g., Burke et al., 2018). Though these studies are important for understanding specific aspects of IDEA, they do not represent all individuals who received services. More specifically, under the Code of Federal Regulations, there are thirteen disability categories under IDEA and the eligibility criteria for these categories vary between and within states (MacFarlane and Kanaya, 2009; Thorius and Maxcy, 2015). It is important to remember, however, that unlike many other educational intervention programs, IDEA was created to meet the educational needs of students from a wide array of socio-demographic characteristics, disabilities, and age ranges. Therefore, studies that isolate children from a specific subgroup or location, or who receive a specific type of service, do not provide the whole picture of IDEA. Rather, they potentially exclude millions of children who were served by a program that was purposefully created to provide flexibility and relies on the subjective nature of multiple educational professionals and child advocates, including caregivers. Therefore, it is important to include all individuals who were served in some capacity, regardless of the diagnosis and the duration and nature of the provided services.
Another challenging aspect of examining IDEA is determining which outcomes should be assessed. Studies on special education often focus on school-aged outcome variables, such as test scores and social/emotional development. However, research in the early childhood field has pointed to the importance of examining adulthood outcomes that might emerge over time and remain largely unexamined in the special education literature. For instance, when examining preschool programs that were created specifically for low-income children, initial studies found few positive effects by third grade (e.g., Barnett and Hustedt, 2005). Longitudinal follow-ups, however, revealed many lasting positive outcomes in adolescence, including lower rates of grade retention, lower rates of special education placement, fewer teenage pregnancies, and higher rates of high school graduation (e.g., Reynolds, 2000). More extensive follow-ups revealed that these benefits continued over 30 years later (e.g., higher earnings, less criminal activity) and underscore the importance of using longitudinal methodology to examine outcomes in adulthood (e.g., Schweinhart et al., 2005). Therefore, studies that examine the adulthood outcomes of all children who received services at the national level during a specific time period are needed within education research.
The Usefulness of One-to-One Matched Propensity Score Analysis
Issues surrounding selection bias are, arguably, the most difficult methodological concern to address when conducting research on IDEA. Research findings on special education can be especially difficult to interpret due to selection bias. More specifically, children who qualify for services differ from children who do not qualify on many potentially confounding characteristics, including race, sex, birth weight, maternal cognitive ability and educational attainment, socio-economic status, family involvement, neighborhood quality, home literacy practices, and preschool attendance (Sullivan et al., 2015). Therefore, it is difficult to reliably determine whether differences between the two groups are due to the services received or to the wide array of contextual factors that are associated with an increased likelihood of special education participation. Special education services, however, cannot be randomly assigned, because children are legally required to receive these services when they meet criteria outlined in the Code of Federal Regulations1.
Researchers have used propensity score analysis to reduce concerns of selection bias. Propensity score analysis can provide relatively unbiased estimates that are close approximations to those derived from randomized control studies (Luellen et al., 2005). First, a treatment (i.e., receiving services) and a control (i.e., not receiving services) condition are established. Then, a propensity score—the predicted probability of receiving the treatment given these covariates—is calculated for each participant based on covariates that could confound the likelihood of the treatment condition. Next, the treatment and control conditions are matched based on propensity and compared on the outcome variables.
Often, these comparisons are done by rank ordering individuals by their propensity scores and dividing them into groups or “strata” (Rosenbaum and Rubin, 1985) where individuals in the first strata have the highest likelihood of treatment and individuals in the last strata have the lowest likelihood of treatment (or vice versa). Outcomes between the treatment and control groups are then compared within each stratum. Though this technique is commonly used, it can introduce bias in the estimates within each stratum due to unequal sample sizes between the treatment and control conditions (Dehejia and Wahba, 2002). An alternative approach is to create a dataset where each participant in the treatment condition is individually matched with a participant in the control condition by propensity score. The “matched pairs” approach will yield an equal sample size for the treatment and control samples, but will exclude individuals who do not have a match. Therefore, individuals who are on the extreme ends of the propensity range (i.e., individuals who are extremely likely or extremely unlikely to receive special education services) would be excluded from subsequent analyses.
While propensity score studies are not a perfect substitution for random assignment (Graham and Kurlaender, 2011), they can be a useful technique when random assignment is impossible to implement. For these reasons, propensity score analyses are becoming more prevalent within education and policy research (Morgan et al., 2010) and are particularly useful for special education studies. Due to the methodological demands of utilizing this approach and creating effective matches, however, a large-scale dataset with sufficient sample size for treatment, controls, and a wide variety of covariates is required.
To date, there have been two studies that utilized propensity score analyses within the special education literature. Both studies have used Early Childhood Longitudinal Study (ECLS) datasets and revealed very few improvements among children in special education, compared to their counterparts. Specifically, Morgan et al. (2010) found that children in the ECLS-Kindergarten cohort who received services had higher rates of problem behaviors and lower scores in some achievement tests in the third grade compared to those who did not receive services. Sullivan and Field (2013) conducted a similar analysis with children from the ECLS-Birth cohort and found that children who received special education services had significantly lower mathematics and reading scores compared to those who did not receive services at school entry.
When considering these findings, it is important to remember that individuals are still in school and may not have experienced the full extent of IDEA services. Unfortunately, because the ECLS cohorts are still of school-age, examining adulthood outcomes with these databases will not be possible for many years. Furthermore, while the ECLS datasets provide comprehensive information at the child-level, there is far less information at the parent-level (e.g., prenatal health) which may significantly contribute to predicting an individual's propensity for special education (Delgado and Scott, 2006). Finally, the results from these two studies were conducted by comparing the outcomes of individuals in the treatment group to those in the control group by using the strata-matching technique. Therefore, to date, there has not been a study that utilizes propensity score analysis with the matched-pairs technique.
The NLSY and CYA Datasets
The National Longitudinal Survey of Youth (NLSY) and its corresponding Child and Young Adult (CYA) dataset provide an ideal opportunity to examine the post-secondary outcomes among students who received special education services. The NLSY is a nationally representative sample of over 12,000 individuals who were between 14 and 21 years old on December 31, 1978, and were interviewed biennially on a wide range of behaviors, including income, cognitive ability, physical health, and occupational status. These surveys and data collection are sponsored and administered by the Bureau of Labor Statistics of the U.S. Department of Labor in order to gather information on the U.S. labor market, including the relationship between educational experiences and labor outcomes.
In 1986, the Bureau of Labor Statistics created a new dataset, the CYA, to track over 11,000 children born to the females of the NLSY. CYA participants were also interviewed biennially about their emotional, social, and physical behaviors, as well as their educational and occupational patterns. Similar to the ECLS datasets, portions of the NLSY and CYA are publicly available and have been used in numerous research reports and publications since their inception. By combining the information from both datasets, we were able to create an integrated, longitudinal dataset that includes children's individual and environmental characteristics (e.g., birth weight, home quality), as well as maternal characteristics (e.g., maternal education), and is ideal for propensity score analyses.
The purpose of the current study is to explore the links between receiving special education services and adulthood outcomes in a U.S. sample using the following approach: (1) by using the NLSY and corresponding CYA datasets we developed a comprehensive dataset of students who received special education services at any time during their school years, (2) to reduce selection bias we utilized a one-to-one propensity score matching technique, and (3) due to the age of the participants in the CYA datasets, we examined adulthood outcomes beyond the first year of high school graduation. Broadly, we are asking: How do individuals who are served in some capacity by IDEA fare in adulthood across multiple domains of outcomes compared to individuals who were equally likely to receive services but did not?
Materials and Methods
Analytical Sample
Children eligible for the current study were born between 1980 and 1994 (n = 8,476). The birth year cutoffs were set to limit the sample to children who were 6 years old (i.e., school-aged) or younger when the study began in 1986 and at least 18 years old in the 2012 dataset. Additionally, only children who had at least one Peabody Individual Achievement Test (PPVT) score or one Behavior Problem Index (BPI) score and were assessed as youth (n = 6,230) were included in the propensity score calculations and matching procedures.
Participation in Special Education
The treatment variable in this study was created using a composite of 17 variables of maternal and youth current and retrospective reports of participation in a special education program or class. Reports were gathered in interviews conducted between 1994 and 2010. Based on these variables, a total of 573 children (8%) reported participating in special education in some capacity during their schooling and were coded as such.
Missing Data
Approximately 5% of data points were missing from the dataset used for propensity score matching. Missingness ranged from 0 to 23% across variables. Analyses were conducted to determine the extent to which missingness was related to three key predictors of special education: race/ethnicity, gender, and income. Results showed that both gender and race/ethnicity were significant predictors of missing data. Therefore, all subsequent multiple imputation techniques and propensity matching procedures were conducted within 6 subgroups that controlled for both gender and race/ethnicity (Black, Hispanic, White), which were designated by the NLSY and CYA. Multiple imputation analyses using all covariates were conducted in SPSS to predict missing values in all 6 subgroups, using a Markov Chain Monte Carlo (MCMC) algorithm known as chained equation imputations that imputes scores one at a time and uses imputed scores as predictors in subsequent steps (Acock, 2005). Each subgroup analysis yielded 5 datasets, resulting in 30 imputed datasets. A random number generator was used to select the second imputation, which was used in all subsequent analyses.
One-to-One Propensity Score Matching Procedures
Following the procedures outlined by Rosenbaum and Rubin (1985), the propensity for receiving special education services was calculated for each participant (n = 6,230) using SAS software. The selection of these covariates was informed by a comprehensive review of previous research examining the factors related to special education placement. This literature review yielded a list of 99 variables that were consistently related to special education. This list was then condensed to 36 variables based on the availability of these variables within the NLSY79 and NLSY-CYA datasets, including maternal characteristics, prenatal and perinatal factors, the child's home and school factors, the child's health, and the child's cognitive and behavioral assessments (see Tables 1–3).
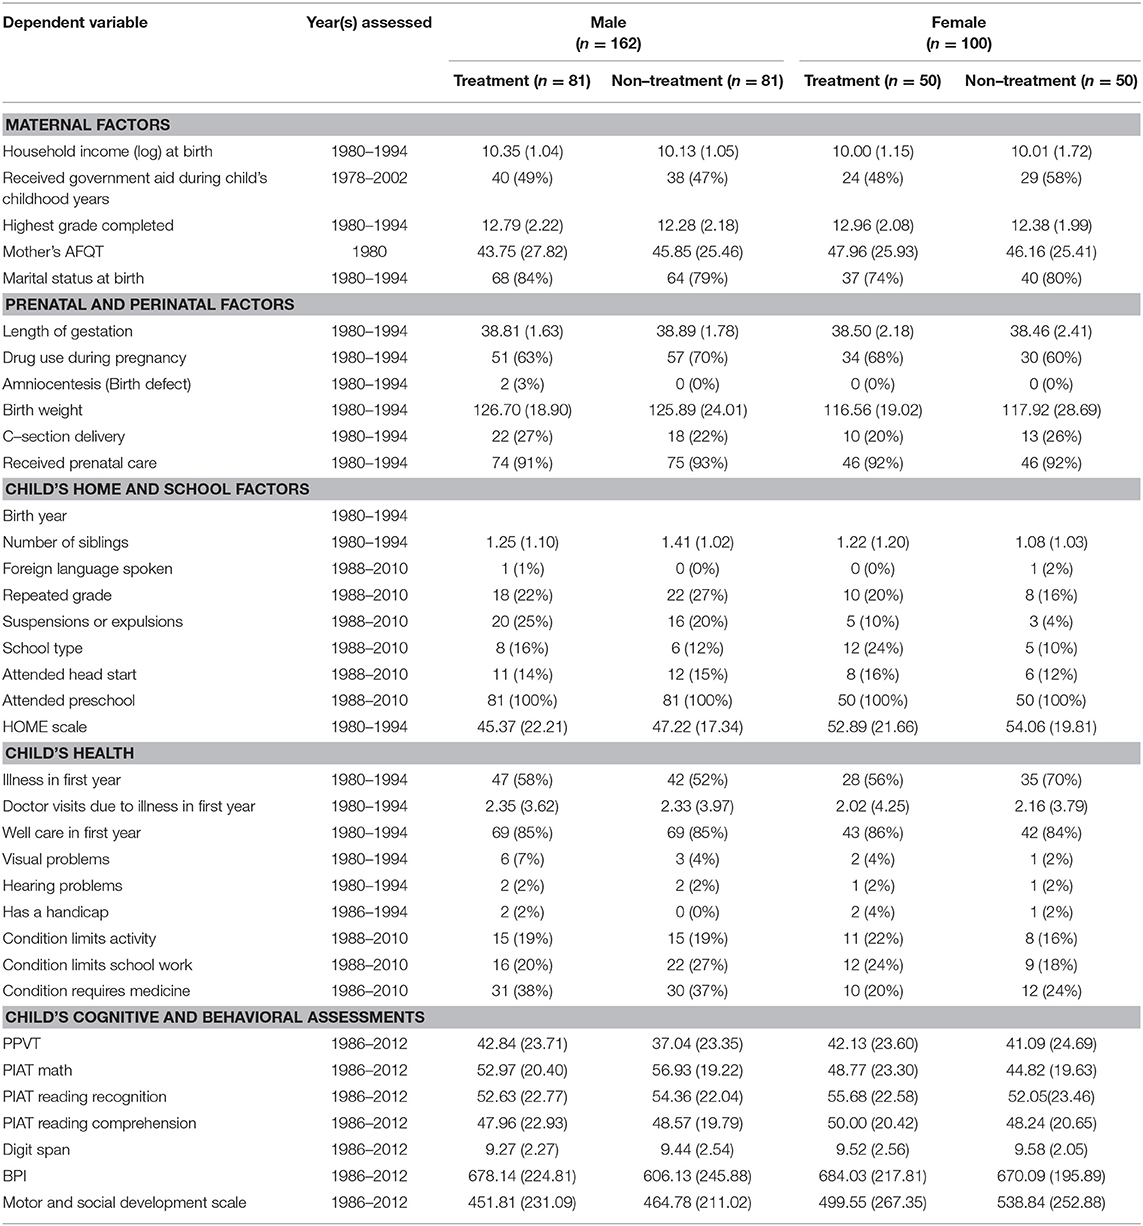
Table 1. Dependent variables used in calculating propensity score and balance check for whites (n = 262).
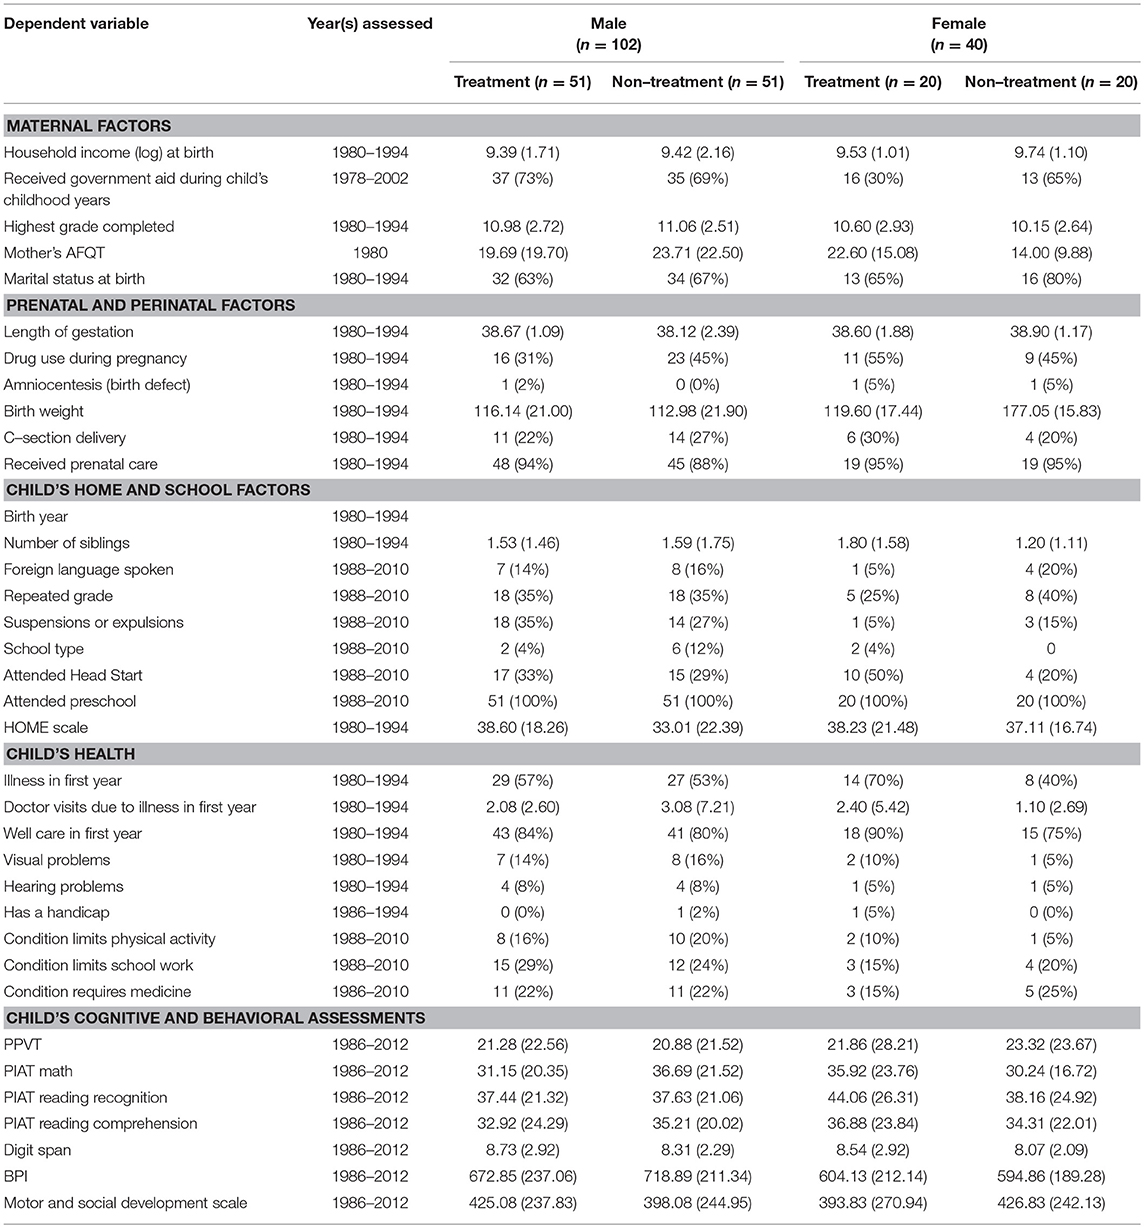
Table 2. Dependent variables used in calculating propensity score and balance check for hispanics (n = 142).

Table 3. Dependent variables used in calculating propensity score and balance check for blacks (n = 182).
Due to racial/ethnic and gender disparities found within special education participation, the propensity score calculations were done separately for each race/ethnicity-by-gender subgroup (i.e., ensuring that a Black male was matched with a Black male). Due to the wide range of birth years that were included in the dataset, Parsons (2001) SAS “greedy match” macro was used to match each person who received services with a non-special education person in pairs of consecutive birth year groups (e.g., 1986 and 1987 and 1988) and within each subgroup. The sample of matched cases resulted in a final sample of 293 matched pairs (n = 586) whose propensity scores ranged from 0.002 to 0.864 (M = 0.155; SD = 0.154). Balance checks were conducted using independent sample t-tests and Chi-square analyses to examine whether there were significant differences in the variables predicting propensity between treatment and non-treatment groups. None of the variables were significantly different across all subgroups or overall sample level. Therefore, all subsequent analyses were conducted on the sample of 586 individuals (see Tables 1–3 for race/ethnicity by sex by special education breakdowns).
Outcome Measures
The effects of special education were assessed using a series of outcome measures selected and categorized using four of the domains outlined by Ysseldyke and Olsen (1997): educational attainment, economic self-sufficiency, social adjustment, and physical health. These domains are part of a proposed framework for assessing the performance and progress of children with disabilities, developed in part to address the IDEA policy requiring states to use alternate assessments for students who cannot take standard forms of assessment. Each outcome measure within each domain is described below.
Educational Attainment
Highest Grade Completed
During all waves of data collection, participants were asked to report the highest grade they completed. A variable was created indicating the highest grade reported across waves.
High School Diploma
Using participant reports of grade completion, a variable was created indicating whether participants received a high school diploma. If participants reported receiving a high school diploma, a separate variable was created to indicate the year participants received this degree.
Economic Self-Sufficiency
Yearly Income
Participants were asked to report their yearly income.
Welfare Use
During all waves of data collection, participants were asked to report whether they received any welfare assistance in that year. Using this data, a composite score was created indicating the total number of years participants reported receiving welfare assistance. A dichotomous variable was created indicating whether participants reported ever receiving welfare assistance.
Use of Any Form of Public Assistance
During all waves of data collection, participants were asked to report whether they received federal assistance from the following programs: welfare, food stamps, Woman, Infants and Children (WIC), or Aid to Families with Dependent Children (AFDC). Using this data, a dichotomous variable was created indicating whether participants reported ever receiving any form of public assistance.
Physical Health
Physical Health Self-Rating
Participants rated their physical health on a 5-point Likert scale (1 = poor, 2 = fair, 3 = good, 4 = very good, 5 = excellent).
Ever Used Marijuana, Stimulants and/or Cocaine
During all waves of data collection, participants were asked to report their drug use, including their use of marijuana, stimulants and/or cocaine. Using this data, a dichotomous variable was created indicating whether participants reported ever using these drugs.
Social Adjustment
Social Support
Four items were used to assess the extent to which participants felt supported by family and friends. Items included, “How much do you feel loved and cared for by your relatives?” and “How much can you open up to your friends if you need to talk about your worries?” Participants rated the items on a 5-point Likert scale (1 = not at all, 2 = a little, 3 = some, 4 = quite a bit, 5 = a great deal). The social support score was based on a mean of the four items (Cronbach α = 0.77).
Family Conflict
A six-item scale was used to assess the degree of conflict in participants' families. Items included, “We fight a lot in our family,” “Family members hardly ever lose their temper,” “Family members sometimes get so angry they throw things,” and “Family members always calmly discuss problems.” The six-item Family Conflict Scale is a subset of the Family Environment Scale (Moos and Moos, 1994). Participants rated the items on a 4-point Likert scale (1 = strongly agree, 2 = agree, 3 = disagree, 4 = strongly disagree). These ratings were reverse coded to indicate that a higher score (e.g., 4) meant a higher level of family conflict compared to a lower score (e.g., 1). The family conflict scale is based on a mean of all six items (Cronbach α = 0.74).
Conviction
During all waves of data collection, participants were asked to report whether they were ever convicted of a felony. Using this data, a dichotomous variable was created indicating whether participants reported ever being convicted.
Results
Six hierarchical multiple regression analyses and five hierarchical binary logistic regression analyses were conducted to compare the educational attainment, economic self-sufficiency, physical health, and social adjustment of individuals who received special education services (the treatment group) to those who did not (the control group). The first step of each regression model assessed the main effects of special education and included birth year, gender, and race/ethnicity to control for the age range represented in the dataset and potential differences related to demographic variables. Propensity was included as a covariate in order to reduce bias (Rosenbaum and Rubin, 1985) and control for the likelihood of receiving services. In the second step of the model, all corresponding 2-way interactions between race/ethnicity and special education, as well as gender and special education were tested to determine whether the effects of special education varied by race/ethnicity or gender. Special education and/or propensity were significant predictors in seven out of the eleven analyses, which are outlined in the sections below.
Highest Grade Completed
Both models were significant (Model 1: F(6, 425) = 4.62, p < 0.001, adjR2 = 0.05; Model 2: F(9, 422) = 3.18, p = 0.001, adjR2 = 0.04; Δ adjR2 = −0.01). Propensity was significant, B = −1.61, p = 0.01, such that individuals with higher propensity attained lower levels of education than individuals with lower propensity. Race/ethnicity was also significant (Hispanic: B = −0.90, p < 0.001, Black: B = −0.48, p < 0.05) indicating that both Black and Hispanic children attained lower levels of education compared to Whites (see Table 4).
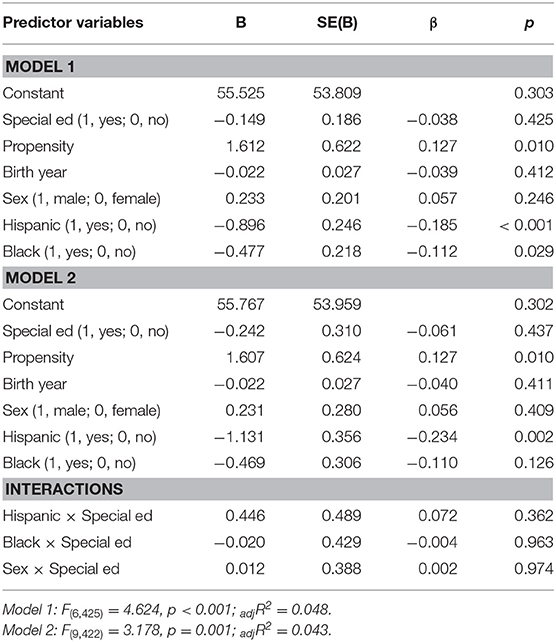
Table 4. Hierarchical multiple regression analyses predicting highest grade completed (n = 586).
High School Diploma (Binary)
Both models were significant (Model 1: χ2(6) = 30.79, p < 0.001, −2LL = 676.82, Nagelkerke R2 = 0.07; Model 2: χ2(9) = 34.50, p < 0.001, −2LL = 673.11, Nagelkerke R2 = 0.08; Δ adjR2 = 0.01). Propensity was significant, B = −1.23, p < 0.05, such that individuals with higher propensity had a decreased likelihood of attaining a high school diploma compared to individuals with higher propensity scores. Gender was significant, B = 0.56, p < 0.01, indicating that females had a higher likelihood of attaining a high school diploma compared to males. Race/ethnicity was significant, Hispanic: B = −0.77, p < 0.01, such that Hispanics had a lower likelihood of receiving a high school diploma compared to Whites. All other terms were nonsignificant (see Table 5).

Table 5. Hierarchical multiple logistic regression analyses predicting completion of high school diploma (n = 586).
Yearly Income
Both models were significant (Model 1: F(6, 508) = 18.66, p < 0.001, adjR2 = 0.17; Model 2: F(9, 508) = 12.44, p < 0.001, adjR2 = 0.17; Δ adjR2 = 0). Birth year was significant, B = −1900.13, p < 0.001, such that younger individuals reported lower income levels compared to older individuals. Gender was significant, B = −4707.47, p < 0.01, such that females reported lower income levels compared to males. Race/ethnicity was significant, Black: B = −5289.36, p < 0.01, such that Blacks reported lower income levels compared to Whites. All other terms were nonsignificant.
Ever Used Welfare (Binary)
Both models were significant (Model 1:χ2(6) = 42.87, p < 0.001, −2LL = 361.92, Nagelkerke R2 = 0.14; Model: χ2(9) = 43.13, p < 0.001, −2LL = 361.67, Nagelkerke R2 = 0.14; Δ adjR2 = 0). Special education was significant, B = 0.79, p < 0.01, birth year, B = −0.14, p < 0.001, such that individuals in special education were more likely to have used welfare compared to individuals who did not. Race/ethnicity was significant (Hispanic B = 0.79, p < 0.05; Black B = 1.23, p < 0.001) such that Hispanic and Black individuals were more likely to have used welfare compared to Whites. All other terms were nonsignificant (see Table 6).
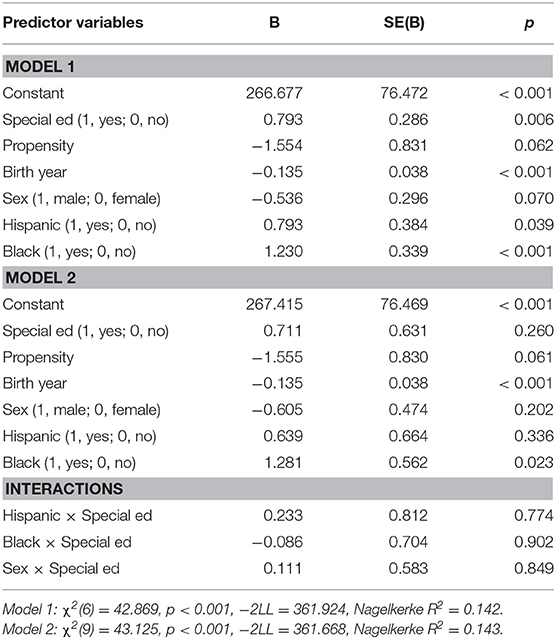
Table 6. Hierarchical multiple logistic regression analyses predicting welfare use (n = 586).
Years of Welfare Use
Both models were significant (Model 1: F(6, 564) = 5.86, p < 0.001, adjR2 = 0.05; Model 2: F(9, 570) = 4.09, p < 0.001, adjR2 = 0.05; Δ adjR2 = 0). Special education was significant, B = 0.14, p < 0.01, indicating that individuals who participated in special education used welfare longer than individuals who did not. Propensity was significant, B = 0.48, p < 0.01, such that individuals with a higher propensity used welfare longer than individuals with lower propensity. Birth year was significant, B = −0.02, p < 0.01, such that older individuals used welfare longer than younger individuals. And race/ethnicity was significant (Black B = 0.16, p < 0.01) such that Blacks used welfare longer than Whites. All other terms were nonsignificant (see Table 7).
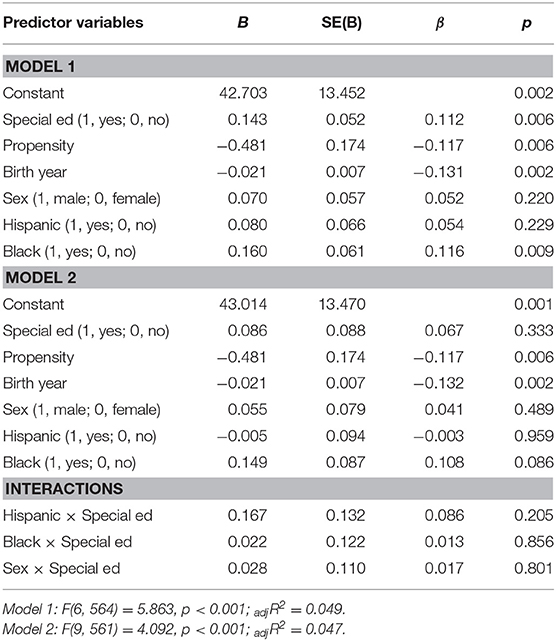
Table 7. Hierarchical multiple regression analyses predicting years of welfare use (n = 586).
Ever Used Any Form of Public Assistance (Binary)
Both models were significant (Model 1: χ2(6) = 116.76, p < 0.001,−2LL = 679.81, Nagelkerke R2 = 0.24; Model 2: χ2(9) = 120.82, p < 0.001,−2LL = 675.76, Nagelkerke R2 = 0.25; Δ adjR2 = 0.01). Propensity was significant, B = 1.42, p < 0.05, such that individuals with higher propensity was more likely to receive any form of public assistance compared to individuals with lower propensity. Birth year was significant, B = −0.21, p < 0.001, such that older individuals were more likely to have received any form of public assistance compared to younger individuals. Gender was significant, B = 0.62, p < 0.01, such that females reported a higher likelihood of receiving any form of public assistance compared to males. All other terms were nonsignificant (see Table 8).
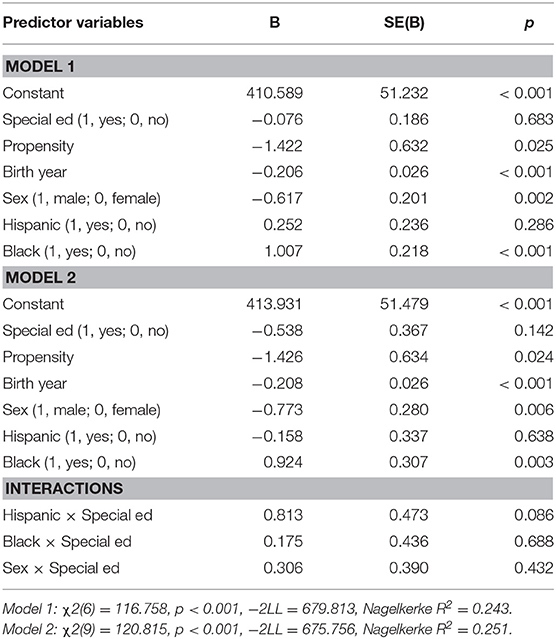
Table 8. Hierarchical multiple logistic regression analyses predicting use of any public assistance (n = 586).
Physical Health
The second model was significant (Model 1: F(6, 539) = 1.38, p = 0.22, adjR2 <0.01; Model 2: F(9, 545) = 2.10, p < 0.05, adjR2 = 0.02; Δ adjR2 = 0.01). The Hispanic x special education interaction was significant, B = 0.66, p < 0.01, such that Hispanics who received special education services had higher health ratings compared to Hispanics who did not receive services, whereas there was no difference among non-Hispanics. All other terms were nonsignificant (see Table 9).
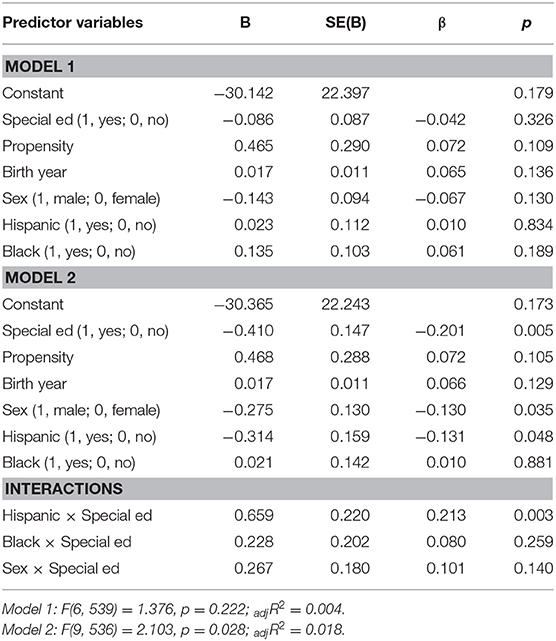
Table 9. Hierarchical multiple regression analyses predicting physical health (n = 586).
Ever Used Marijuana, Stimulants, or Cocaine (Binary)
Both models were significant (Model 1: χ2(6) = 33.94, p < 0.001, −2LL = 777.27, Nagelkerke R2 = 0.11; Model 2: χ2(9) = 37.15, p < 0.001, −2LL = 769.06, Nagelkerke R2 = 0.08; Δ adjR2 = −0.03). Birth year was significant, B = −0.10, p < 0.001, such that older individuals were more likely to have taken drugs compared to younger individuals. Gender was significant, B = −0.63, p < 0.01, such that females were less likely to have taken drugs compared to males. All other terms were nonsignificant.
Social Support
Both models were significant (Model 1: F(6, 542) = 6.29, p < 0.001, adjR2 = 0.06; Model 2: F(9, 542) = 4.75, p < 0.001, adjR2 = 0.06; Δ adjR2 = 0). Gender was significant, B = 0.23, p < 0.01, such that females reported higher levels of social support compared to males. Race/race/ethnicity was significant (Hispanic: B = −0.36, p < 0.001, Black: B = −0.29, p < 0.01) such that Hispanics and Blacks reported lower levels of social support compared to Whites. All other terms were nonsignificant.
Family Conflict
Both models were significant (Model 1: F(6, 539) = 6.95, p < 0.001, adjR2 = 0.06; Model 2: F(9, 545) = 5.41, p < 0.001, adjR2 = 0.07; Δ adjR2 = 0.01). Special education was significant, B = 0.09, p < 0.05, such that individuals in special education reported higher levels of family conflict compared to individuals not in special education. Race/ethnicity was significant (Hispanic: B = −0.20, p < 0.001, Black: B = −0.26, p < 0.001) such that Hispanics and Blacks reported lower levels of family conflict compared to Whites. The Hispanic x special education interaction was significant, B = 0.24, p < 0.05, such that Hispanics who received services reported lower levels of family conflict compared to Hispanics who did not receive services, whereas there was no difference among Whites or Blacks. All other terms were nonsignificant (see Table 10).

Table 10. Hierarchical multiple regression analyses predicting family conflict (n = 586).
Convicted (Binary)
Both models were significant (Model 1: χ2(6) = 43.54, p < 0.001, −2LL = 566.52, Nagelkerke R2 = 0.11; Model 2: χ2(9) = 45.36, p < 0.001, −2LL = 564.70, Nagelkerke R2 = 0.12; Δ adjR2 = 0.01). Birth year was significant, B = −0.14, p < 0.001, such that younger individuals were less likely to be convicted compared to older individuals. Gender was significant, B = −1.13, p < 0.001, such that females were less likely to be convicted compared to males. All other terms were nonsignificant.
Discussion
The purpose of the current study was to compare the adulthood outcomes of children who received special education services with those who did not, using one-to-one match propensity score methodology. Our analyses revealed that Hispanic students showed evidence of benefitting from special education, in terms of reporting better physical health and less family conflict, compared to non-Hispanics. Despite this, the majority of results suggest that individuals who were born between 1980 and 1994 and received special education services did not differ on adulthood outcomes across educational attainment, social adjustment, economic self-sufficiency, and physical health, compared to individuals with the same likelihood of receiving services who did not receive services. In other words, children who received special education services did not fare better than children who were equally likely to have received services, but did not receive them.
Propensity (the likelihood of receiving special education services), however, had a statistically significant effect on several outcomes. In general, individuals with higher propensity scores had significantly lower educational attainment, were less likely to have a high school diploma, compared to individuals with lower propensity scores. Propensity was also significantly associated with economic self-sufficiency, such that individuals with higher propensity scores were more likely to participate in welfare for more years and receive any form of public assistance. Collectively, these findings suggest that the larger set of contextual factors that increase the likelihood of receiving services (e.g., SES, maternal education) are a stronger predictor of adulthood outcomes than the actual services received.
These results are similar to previous research on the adulthood outcomes of children receiving special education (Chesmore et al., 2016) as well as propensity score analyses on school-aged outcomes (Morgan et al., 2010; Sullivan and Field, 2013). They also provide further support for the idea that the disadvantaging contextual factors, especially those connected to poverty, are very hard to overcome, and thus, to successfully promote positive outcomes, programs likely need to address these factors in addition to the symptoms related to children's disabilities.
Perhaps one avenue of future research could investigate how services provided under IDEA can be tailored to mitigate the contextual factors that increase the likelihood of receiving services. Uncovering these relationships in future research will be important to determine how to modify special education services and/or ameliorate the negative effects of the contextual factors that may be more amenable to intervention. For example, if a child's race/ethnicity is one of the strongest predictors of receiving services, then it may be useful to alter current training practices and resources among teachers, practitioners, and administrators that address the needs of different ethnic/racial groups. If, however, neighborhood variables are one of the strongest predictors, then programs and policies that focus on elevating all students within low-income neighborhoods and school districts might be warranted. These findings also underscore the importance of examining multiple, adulthood outcomes in special education research (Ysseldyke and Olsen, 1997). Though current IDEA practices only require one-year follow-ups on the educational and occupational outcomes of individuals, these results remind us that, after exiting school, individuals are likely to continue living under many of the circumstances that increased their propensity for special education. Accordingly, it may be useful for transitional services to include information that is tailored to the specific contextual factors of their community (e.g., rural vs. urban concerns, locations of specific health clinics) and improve current services that are designated for helping adults with disabilities.
Strengths, Limitations, and Future Directions
By combining two, nationally representative databases, this study integrated a number of methodological features to provide a unique perspective for examining adulthood outcomes of students who receive special education services. By using propensity score analyses, we created a comparable “control” sample that reduced bias from confounding variables and allowed for an examination of adulthood outcomes. Indeed, by starting with the dataset of the mothers (the NLSY), we were able to capture important variables that assess the cognitive, physical, and educational characteristics of the mother, as well as “real time” prenatal characteristics that are often difficult to include in child-specific datasets. Furthermore, in order to reduce potential bias that is introduced when employing the more commonly-used, strata-matching technique, we utilized a one-to-one matching process to create our treatment and non-treatment groups.
While propensity score methodology is a way to reduce selection bias and potentially imitate random assignment, it has important limitations. For example, due to the large sample size that is required to conduct these analyses, the data sources required often rely on self-report surveys that are collected at pre-specific time frames, which may not capture important predictor variables that are vulnerable to specific times/situations of the individual. In other words, if a CYA individual was born in an “off year” of data collection, then many of the birth variables are dependent on the accuracy of memory of the NLSY mother. In addition, it is important to recognize that the race/ethnicity distinctions in these analyses were based on the sampling procedure determined by the Bureau of Labor Statistics (for specific procedures on race/ethnicity designation, please see https://www.nlsinfo.org). These specific distinctions may not be adequate to identify important distinctions within racial/ethnic categories (e.g., immigration status, etc.) and are important endeavors for future researchers on different data sources. Despite this, it is important to remember that random assignment is considered the “gold standard” for determining causal inference, and propensity score analysis is, arguably, the best methodology to date that can imitate most features of random assignment for the special education population.
Further, the strict one-to-one matching technique within each race/ethnicity by gender subgroup narrowed the possible range of propensity scores that could be included in the outcomes analyses. Indeed, we were able to find acceptable matches for approximately half of our Treatment group (293 out of our initial sample of 573). More specifically, CYA individuals who were extremely likely to receive special education services could not be included in these analyses because there was no appropriate match for them in the Non-Treatment condition. This is to be expected, since in the context of vision impairment, hearing impairment, and autism, for example, it would be almost impossible to have a one-to-one match with another individual who did not receive services. It is possible that special education plays a significant and positive role for those individuals who have the high propensity to receive services. If that were the case, then a different research methodology would be required to examine this sub-population of students served under IDEA. Given the overall findings regarding the importance of the contextual factors and propensity for special education, however, this seems unlikely.
Due to the longitudinal and cross-sectional nature of the CYA, we were able to examine multiple adulthood outcomes beyond the educational and employment follow-ups that are currently required under IDEA, spanning social adjustment, mental health, and physical health variables. These data also allowed us to examine all individuals served under IDEA, rather than focusing on a single disability category or geographic region. Having data on a wide range of children's ages allowed us to look at IDEA through a timespan that would not have been possible with a dataset that only included a single year birth cohort.
Though these data allowed for a wide array of analyses, the issue of multiple tests can also be a cause for concern. Currently, there is no standard practice agreed upon by statisticians on how to accommodate for multiple tests on the same data. While some recommend the use of a reduced alpha level (e.g., p < 0.01 or Bonferonni corrections), others believe that alpha levels do not need to be altered regardless of the number of tests (Kim and Bang, 2016). It is important to note that all of our significant overall models reached the p < 0.001 level, and therefore, would remain significant after the most conservative corrections. Some of the individual predictors, however, would not remain significant with alpha corrections. The need for adulthood outcomes based on multiple domains recommended by Ysseldyke and Olsen (1997) and required by the U.S. government, however, suggest these outcomes may be logically independent from one another. In the case of logical independence, alpha levels do not need to be reduced for multiple tests (Darlington and Hayes, 2017). Further, given difficulties in achieving large sample sizes of the special education population, decreasing alpha levels will also increase the chances of false negatives. In light of these issues, we discussed the results using the standard <0.05 significance level, but also provided p-values and effect sizes to the third decimal point in our tables so individual readers can make their own interpretations for future research (including meta-analyses) and policy decisions.
It is important to note, however, that the outcomes analyzed were limited to the variables included in the NLSY and CYA datasets and do not cover the exhaustive list of important outcomes and domains that have been outlined by researchers and policymakers (see Ysseldyke and Olsen, 1997). Other datasets, such as the National Longitudinal Transition datasets (NLT and NLT-2), are specifically designed to examine the adulthood outcomes of individuals with disabilities (Shogren et al., 2016). Indeed, Newman et al. (2016) utilized propensity score methods to determine the role of transitional planning on postsecondary outcomes within children in special education. The NLT datasets, however, follow individuals who were receiving special education services during the ages of 13 to 16. Therefore, individuals who received services at an earlier age and an appropriate comparison group of individuals who did not receive services are not included. The NLSY and CYA datasets, on the other hand, allowed us to examine all individuals who received special education services during their school years and to include the child's prenatal and maternal variables in the propensity analyses. However, these data only allow us to examine treatment effects at the broadest level, and do not allow us to examine links between specific special education services or dosage of services and outcomes, which are also important. Such specific analyses were not the focus of our study, but would provide valuable information for future researchers and policy-makers.
Furthermore, it is important to note that the data from the current study represent the special education practices and policies that were relevant for individuals born between 1980 and 1994. It is possible that subsequent modifications to IDEA, including stronger support for preschool special education services, the introduction of the autism category in 1990, and changes in learning disability diagnosis criteria in 2004 (34 C.F.R. §300), among other evolving changes, have altered which individuals qualify for services and how services are implemented. Future research could address these possibilities. Despite these limitations, the current study is a reflection of the current life circumstances of today's adults, and any examination of IDEA is a time-sensitive reflection of an evolving and dynamic set of services.
Further analyses using latent growth curve modeling and/or individual growth modeling methodology could be utilized to test for differences in individuals' trajectories across time, along with multiple outcomes and across multiple cohorts (Singer and Willett, 2003; Shogren et al., 2016). For example, such analyses can help determine if children who received special education services experience different growth trajectories than their regular education counterparts (e.g., were participants making less money at age 20 but not at age 30?). They could also determine if the outcomes between the two groups were due to contextual factors associated with that specific time period (e.g., did children who received services in the late 1990's fare better than those who received services in the early 1990s?).
The positive outcomes experienced by the Hispanic population in our study emphasize the importance of continuing to collect more data and monitor the life-long outcomes of this sample and future special education recipients. This is particularly pertinent given that the enrollment of Hispanic students nearly doubled between 1990 and 2006 (Pew Research Center, 2008), and so, their historical progress within special education may be different compared to their White and Black counterparts. Unfortunately, examining the potentially unique nuances of the cultural, political, and educational factors within the population as they relate to special education is not within the scope of this study, but an important topic for future researchers and policy makers.
Conclusions
Much of the research on links between special education services and outcomes focus on the students who are receiving services while they are still in school. Far less is known about the relationship between IDEA and post-secondary outcomes and, in particular, outcomes that extend beyond one year of their high school graduation. Research on IDEA is also complicated by issues surrounding selection bias, the dynamic nature of the policy and services rendered, the range of disabilities that it covers, and the wide variability with which services are practiced. For these reasons, matched-pairs propensity analyses on the NLSY and corresponding CYA datasets can be particularly valuable for examining the links between specific special education services and targeted outcomes beyond the school years. More specifically, our analyses suggest that Hispanic students who received special education services experience more positive outcomes compared to their non-Hispanic counterparts. Furthermore, the important role of propensity on adulthood outcomes suggests that practitioners might consider tailoring their services more to the contextual factors that increase the likelihood of receiving services (e.g., income, neighborhood quality) in addition to the symptoms and behaviors that are associated with the specific diagnosis.
Data Availability
The datasets for this study can be found at https://www.bls.gov/nls/nlsy79.htm.
Ethics Statement
The data used in this study were collected using procedures that comply with Federal law and the policies and guidelines of the U.S. Office of Management and Budget (OMB) and the U.S. Bureau of Labor Statistics (https://www.nlsinfo.org/content/cohorts/nlsy97/intro-to-thesample/confidentiality-informed-consent).
Author Contributions
TK devised the theoretical and analytical framework, conducted the propensity score analyses, and contributed to the writing. JW contributed to the theoretical framework and writing. BM conducted the regression analyses and contributed to the theoretical framework, database management, and writing.
Conflict of Interest Statement
The authors declare that the research was conducted in the absence of any commercial or financial relationships that could be construed as a potential conflict of interest.
Footnotes
1. ^Code of Federal Regulations, Title 34, (§) 300.8 (c).
References
Acock, A. C. (2005). Working with missing values. J. Marriage Fam. 67, 1012–1028. doi: 10.1111/j.1741-3737.2005.00191.x
Barnett, W. S., and Hustedt, J. T. (2005). Head Start's lasting benefits. Infants Young Child. 18, 16–24. doi: 10.1097/00001163-200501000-00003
Burke, K. M., Raley, S. K., Shogren, K. A., Hagiwara, M., Mumbardo-Adam, C., Uyanik, H., et al. (2018). A meta-analysis of interventions to promote self-determination for students with disabilities. Remed. Spec. Edu. doi: 10.1177/0741932518802274
Chesmore, A. A., Ou, S. R., and Reynolds, A. J. (2016). Childhood placement in special education and adult well-being. J. Spec. Educ. 50, 109–120. doi: 10.1177/0022466915624413
Darlington, R. B., and Hayes, A. F. (2017). Regression Analysis and Linear Models: Concepts, Applications, and Implementation. New York, NY: The Guilford Press.
Dehejia, R., and Wahba, S. (2002). Propensity score-matching methods for non-experimental causal studies. Rev. Econ. Stat. 84, 151–161. doi: 10.1162/003465302317331982
Delgado, C. E. F., and Scott, K. G. (2006). Comparison of referral rates for preschool children at risk for disabilities using information obtained from birth certificate records. J. Spec. Educ. 40, 28–35. doi: 10.1177/00224669060400010301
Graham, S. E., and Kurlaender, M. (2011). Using propensity scores in educational research: general principles and practical applications. J. Educ. Res. 104, 340–353. doi: 10.1080/00220671.2010.486082
Kim, J., and Bang, H. (2016). Three common misuses of P-values. Dent. Hypotheses 7, 73–80. doi: 10.4103/2155-8213.190481
Luellen, J. K., Shadish, W. R., and Clark, M. H. (2005). Propensity scores: an introduction and experimental test. Eval. Rev. 29, 530–558. doi: 10.1177/0193841X05275596
MacFarlane, J. R., and Kanaya, T. (2009). What does it mean to be autistic? Inter-state variation in special education criteria for autism services. J. Child Fam. Stud. 18, 662–669. doi: 10.1007/s10826-009-9268-8
Moos, R. H., and Moos, B. S. (1994). Family Environment Scale Manual. Palo Alto, CA: Consulting Psychologists Press.
Morgan, P. L., Frisco, M. L., Farkas, G., and Hibel, J. (2010). A propensity score matching analysis of the effects of special education services. J. Special Ed. 43, 236–254. doi: 10.1177/0022466908323007
National Center for Educational Statistics (2018). Children and Youth With Disabilities. Retrieved From: https://nces.ed.gov/programs/coe/indicator__cgg.asp (accessed February 25, 2019).
Newman, L. A., Madaus, J. W., and Javitz, H. S. (2016). Effect of transition planning on postsecondary support receipt by students with disabilities. Except. Child. 82, 497–514. doi: 10.1177/0014402915615884
Parsons, L. S. (2001). “Reducing bias in a propensity score matched-pair sample using greedy matching techniques,” in Paper presented at the Proceedings of the 26th Annual SAS Users Group International Conference (Seattle, WA).
Pew Research Center (2008). A Profile of Hispanic Public School Students: One-in-Five and Growing Fast. Retrieved from: https://www.pewhispanic.org/2008/08/26/onein-five-and-growing-fast-a-profile-of-hispanicpublic-school-students/ (accessed February 25, 2019).
Public Law 101-476, (1990). Education of the Handicapped Act Amendments of 1990. Washington, DC: U.S Congress.
Public Law 108-446, (2004). Individuals With Disabilities Education Improvement Act of 2004. Washington, DC: U.S. Congress.
Public Law 99-457, (1986). Education of the Handicapped Act Amendments of 1986. Washington, DC: U.S Congress.
Reynolds, A. J. (2000). Success in Early Intervention: The Chicago Child-Parent Centers. Lincoln: University of Nebraska Press.
Rosenbaum, P. R., and Rubin, D. B. (1985). Constructing a control group using multivariate matched sampling methods that incorporate the propensity score. Am. Stat. 39, 33–38. doi: 10.1080/00031305.1985.10479383
Schweinhart, L. J., Montie, J., Xiang, Z., Barnett, W. S., Belfield, C. R., and Nores, M. (2005). Lifetime Effects: The High/Scope Perry Preschool Study Through Age 40. (Monographs of the High/Scope Educational Research Foundation, 14). Ypsilanti, MI: High/Scope Press.
Shogren, K. A., Shaw, L. A., and Little, T. D. (2016). Measuring the early adulthood outcomes of young adults with disabilities: developing constructs using NLTS2 data. Exceptionality 24, 45–61. doi: 10.1080/09362835.2015.1064416
Singer, J. D., and Willett, J. B. (2003). Applied Longitudinal Data Analysis: Modeling Change and Event Occurrence. New York, NY: Oxford University Press. doi: 10.1093/acprof:oso/9780195152968.001.0001
Sullivan, A. L., Artiles, A. J., and Hernandez-Saca, D. I. (2015). Addressing special education inequity through systemic change: contributions of ecologically based organizational consultation. J. Edu. Psychol. Consult. 25, 129–147. doi: 10.1080/10474412.2014.929969
Sullivan, A. L., and Field, S. (2013). Do preschool special education services make a difference in kindergarten reading and mathematics skills? a propensity score weighting analysis. J. Sch. Psychol. 51, 243–260. doi: 10.1016/j.jsp.2012.12.004
Thorius, K. A. K., and Maxcy, B. D. (2015). Critical practice analysis of special education policy: an RTI example. Remed. Spec. Edu. 36, 116–124. doi: 10.1177/0741932514550812
Keywords: special education, adulthood outcomes, longitudinal methodology, propensity score, NLSY
Citation: Kanaya T, Wai J and Miranda B (2019) Exploring the Links Between Receiving Special Education Services and Adulthood Outcomes. Front. Educ. 4:56. doi: 10.3389/feduc.2019.00056
Received: 11 March 2019; Accepted: 24 May 2019;
Published: 14 June 2019.
Edited by:
Brahm Norwich, University of Exeter, United KingdomReviewed by:
Gregor Ross Maxwell, UiT The Arctic University of Norway, NorwayGraham R. Davidson, Retired, Victoria, Australia
Copyright © 2019 Kanaya, Wai and Miranda. This is an open-access article distributed under the terms of the Creative Commons Attribution License (CC BY). The use, distribution or reproduction in other forums is permitted, provided the original author(s) and the copyright owner(s) are credited and that the original publication in this journal is cited, in accordance with accepted academic practice. No use, distribution or reproduction is permitted which does not comply with these terms.
*Correspondence: Tomoe Kanaya, tkanaya@cmc.edu